Blog

  • What Boomers Are Choosing

    In 1989, a man came to my office and introduced himself as the vice president of development for the Del Webb Corporation.  He retained my firm to prepare a master plan for their first active-adult community outside of their typical desert southwest market. 

    This led me to an exploration of what made a successful active adult community.  I learned they required unique and distinct considerations quite different from those used in more conventional master planned communities.  During the information gathering process, I toured each of the Sun City projects, interviewing staff and visiting residents to understand the qualities and features which attracted buyers and provided the lifestyle sought by retirees. 

    Since that initial project, I and my partners have had the opportunity to plan and design over 60 active adult communities, many of which were realized and built out over the past 10 years.  We have also worked with existing active adult communities to expand or enhance their amenities and programming to remain relevant to the changing needs of the boomer resident and buyer.

    Over the past several years, our firm began working with small towns and rural communities utilizing our insight and knowledge of the retiree market and desired community amenities to create or enhance their position as a retirement destination.  Additionally, we have assisted them in establishing programs to recruit retirees as an economic development strategy that taps into economic, social, educational and professional attributes of the boomers. 

    Through my work with both the active adult and rural/small town communities I have observed changing trends in the retiree market as the Eisenhower generation gave way to the boomers.  The following are some of the patterns and behaviors which are vital to the boomer home buyer as they make decisions on their retirement living.

    Trend 1 – When making a decision regarding retirement housing, boomers are savvy consumers, typically having purchased between 3 – 9 homes in their lifetime.  These are buyers who know what they want and are reluctant to compromise their selection criteria.

    Trend 2 – Recreation preferences have shifted significantly over the 35 years I have worked in this market.  In the late 80s, virtually all active adult communities relied on golf as the primary community amenity.  Now golf ranks 8th as the preferred amenity of retirees and continues to decline in popularity.  Walking facilities are by far the most requested amenity in retiree focus groups followed by fishing, bocce, tennis and pickleball.

    Trend 3 – The preferred design of single family homes sought by retirees remains one-story living with no steps between parking and front door.  The size of individual dwellings is smaller but still well constructed and featuring no reduction in amenities.  However, specialty rooms are being replaced by multi-use space.  My favorite analogy is the comparison of a Cadillac to a BMW.  There is also increased demand for design and construction techniques which enhance the conservation of water, electricity and natural gas.

    Trend 4 – Community size is smaller, ranging from 10,000 to 2,500 units.  The trend now reflects a growing demand in the market for smaller, more intimate communities.  Finance and entitlement issues further support this trend.

    Trend 5 – 65% of boomers desire to continue their education through formal and informal means during retirement.  This preference drives the decision to purchase a home in towns with a college or an established academic program.  Communities which do not have higher learning institutions have brought in private education, on-line and community educational entities.  Senior University in Georgetown, Texas was established to meet this demand by the residents of Sun City Texas.

    Trend 6 – Historic residential sales patterns show that the “resort-style active adult community” appeals to only 7% of the age and income qualified boomer market.  Small towns and rural locations, however, are finding themselves the preferred destination for boomers in retirement.

    Trend 7 – We know there are many factors which are essential to attracting retirees including affordability, health care, transportation, established social fabric, significant retention of visual history and moderate climate.  However, there is a much greater emphasis on proximity to family, especially grandchildren.  This is driving the relocation decision for many boomers.  Additionally, safety and security have been identified by a greater portion of focus group participants. This preference has become more difficult to realize due to a growing reluctance by municipalities to allow private roads and secure entry gates as a facet of the community’s security program.  The requirement for connectivity is also complicating this trend.

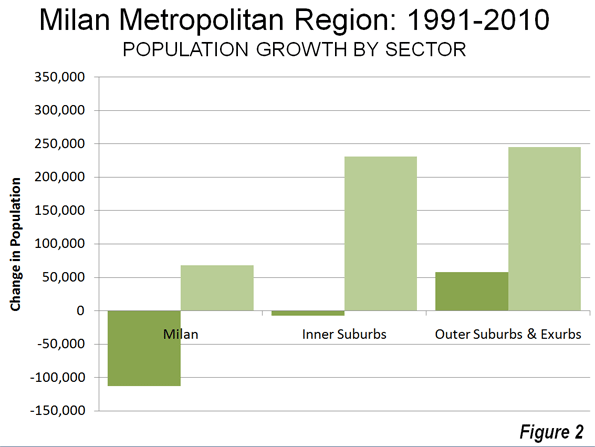
    Trend 8 – Boomers are not flocking en masse to multi-family dwellings in urban cores.  Robert Charles Lesser and Company recently reported that only 4% of affluent empty nesters indicated they would move to a condo downtown in their current metro area while 3% would chose a condo in a suburb of their current metro area.  Essentially, there is little migration of retirees from rural communities and the suburbs to the urban core, contrary to widely held beliefs.

    Overall, the boomer market is diverse and no one solution will appeal to the entire market.  A knowledgeable developer or small town councilman must formulate their plans on local preferences and values.  And remember that many of the myths perpetuated by the media – notably the return en masse of boomers into the city – are just that, a myth.

    Joe Verdoorn, a Principal at SEC Planning, LLC, has over 40 years land planning and development experience working with clients such as Pulte/Del Webb, Motorola, Apple and Hunt Investments.  He is a pioneer in the field of active adult community design who continues to research the retiree market to understand their evolving wants and needs. 

  • The Texas Story Is Real

    Texas Governor Rick Perry entered the Republican presidential nomination race bragging about the job creation record of Texas during his term as his primary pitch to a nation starved for jobs. This triggered a flurry of debate on whether or not Texas is really all Perry claims for it. But while there is certainly nuance in numbers, and Texas doesn’t win on every single measure, on the whole it seems indisputable that Texas did very, very well during the 2000s.

    This may or may not be the doing of Perry. Nor are the national struggles clearly the fault of Obama. The  man at the top always reaps the credit for the blame for what happens on his watch, but the realities of the modern economy are quite complex and there’s only so much influence a governor or president has – and that usually comes with a lag. Nevertheless, the Texas story can’t simply be discounted.

    Let’s take a look at the top level data. While reviewing, keep in mind that the data for the US as a whole actually includes Texas. If you stripped the Texas data out of the US total, the comparisons would generally get even better for the Lone Star State.

    Population

    The root of the Texas story is in its massive population growth during the last decade. While historic growth champions like California stumbled, Texas powered ahead, adding 4.3 million new residents for a growth rate of 20.6% – double that of the 9.7% US average.


    Unemployment

    Despite challenging times at both the beginning and end of the decade, Texas actually managed to keep those people busy at work too.  While it started out the decade with an unemployment rate above the US average, by decade’s end, with population growth and all, it was well below it:


    Jobs

    One reason Texas was able to keep its unemployment rate under control is that it added jobs – nearly a million between 2000 and 2010 in a nation that lost jobs during that period.  The chart below, rendering the US and Texas on the same base, shows that the two moved closely in tandem during the first half of the decade, followed by an ever-widening gap in Texas’ favor.


    Gross Domestic Product

    It’s not enough, perhaps, to merely ask if there are more jobs. Are these jobs that are producing significant economic output, as measured by statistics like GDP?  Looking at the data, we see that Texas again outperformed.


    This one, however, can mislead if looked at alone. With all that population and job growth, of course Texas’ GDP would go up. When considering the average output, GDP per job or GDP per capita is a better measure. The latter is reported by the US government, and shows that Texas actually fell short on boosting this figure. Texas GDP per capita is slightly higher than the US average, but it fell during the decade from 104.7% of the US to 103.7%.


    Personal Income

    Another way to look at this is by examining personal income. As with GDP, the total values are highly correlated with population and job growth. The per capitas tell the story. In this case we see a mirror image of GDP, with Texas somewhat trailing the average, but growing faster than the nation as a whole, improving from 94.0% of the US average to 97.3%.


    Interestingly, the portion of personal income attributable to earnings is higher in Texas than in the US, on both a percentage and per capita basis. Texas trails the US average because it lags in investment income and transfer payments, which have nothing to do with the quality of jobs.

    Household Income

    Household income gives an almost identical tale.  Texas is below average but caught up during the 90s, going from 95.1% of the US average to 96.1%


    Wages

    More directly, we can look at the wages being paid in Texas, which flipped from lower to higher than the US average during the 2000s, though tracking extremely closely the entire way:


    Poverty

    Lastly, the poverty rate is higher in Texas than in the US as a whole – 17.2% vs. 14.3%, not a small difference. However, the gap actually narrowed between the two during the 2000s, as the chart below in the percentage point change in the poverty rate illustrates.


    Conclusion

    While every statistic isn’t a winner for Texas, most of them are, notably on the jobs front. And if nothing else, it does not appear that Texas purchased job growth at the expense of job quality, at least not at the aggregate level.  There are certainly deeper places one might drill into and find areas of concern or underperformance, but that’s true of everywhere.  And these top line statistics are commonly used to compare cities and states. Unless Texas critics are ready to retire these measures from their own arsenal, it seems clear that Texas is a winner.  The Texas story is real.

    Aaron M. Renn is an independent writer on urban affairs based in the Midwest. His writings appear at The Urbanophile, where this piece originally appeared. Telestrian was used to analyze data and to create charts for this piece.

    Photo from Governor Rick Perry’s flickr photo stream.

  • Why the Eurozone Will Come Apart

    Europe has been in the news a lot lately. One day it has a plan to, temporarily at least, deal with the debt problems of delinquent members, and markets climb. The next day there is a glitch and markets fall. What is going on here? Why are markets so spooky?

    We’re witnessing what are almost surely the dying gasps of the European Union (EU) as we know it. By that, I mean the number of countries in the Euro’s common currency zone will decline. The markets are spooked, because how it happens will have huge economic consequences.

    Most economists — I’ve seen references that it is as many as 70 percent — thought that Europe was making a mistake when it became a common currency zone in 1999. Milton Friedman said that it would not make it past the first large recession. He was correct.

    There are two fundamental ways that economists look at currency unions. One question is: What is the likelihood that countries will stay in a currency zone? This is the traditional theory of optimal currency zones. The other asks: What are the challenges to individual countries in a currency zone? This is what economist Greg Mankiw calls the fundamental trilemma of International finance.

    The traditional theory of optimal currency zones holds that, for a currency zone to be successful, the countries need to be similar in fundamental ways. Inflation rates need to be similar. Openness to trade needs to be similar. The countries should be diversified in what they produce. Policy should be integrated, as should the countries’ financial sectors. Capital and labor should be mobile between countries.

    In Europe, the countries are just too diverse to create a long-lasting currency zone. Languages and cultures are very different across European countries.

    A large currency zone works better in the United States. There are fewer differences between, say, New York and California than between, say, Greece and Germany.

    Still, even in the United States, states would choose different monetary policies if they could. For instance, California today would prefer a more expansionary policy than would Texas. This is because the Texas economy is doing far better than is California’s, and Texas has fewer fiscal challenges than California faces. An expansionary monetary policy would presumably stimulate California’s economy, while simultaneously allowing the state to inflate away part of its debt.

    This reflects the trilemma. Here’s an abbreviation of how Mankiw described the trilemma in a 2010 New York Times op-ed:

    “What is the trilemma in international finance? It stems from the fact that, in most nations, economic policy makers would like to achieve these three goals:

    • Make the country’s economy open to international flows of capital.
    • Use monetary policy as a tool to help stabilize the economy.
    • Maintain stability in the currency exchange rate.

    But here’s the rub: You can’t get all three. If you pick two of these goals, the inexorable logic of economics forces you to forgo the third.”

    As Mankiw goes on to say, the United States has chosen the first two options, while China has chosen the second and third, and Europe has chosen the first and third. Right now, Greece and many of the other peripheral countries would like the ability to use the second option.

    The troubled European countries not only have no monetary policy choices, their fiscal options are limited, too. In trying to force countries to meet the characteristics of an optimal currency zone, the EU puts severe limits on fiscal policy choices. This is why at least one country, Greece, has simply lied about its debt.

    In the end, the Greeks and the citizens of other peripheral countries will demand that their governments use all the economic tools available to a sovereign country. The governments will have to comply. The euro zone will shrink.

    Bill Watkins is a professor at California Lutheran University and runs the Center for Economic Research and Forecasting, which can be found at clucerf.org

    Photo: Photo: European Union Flags by futureatlas.com

  • Being Dense About Dwellings: Check the Numbers!

    Recently I suggested that in New Zealand we are heading into the perfect housing storm. Now we have news that house prices and rentals are on the climb again, although stocks remain tight, as an annual inflation rate of 5.3% hits a 21 year high.  The economists are suggesting this is good news, although it means interest rates may have to be pushed up sooner than expected.

    Well the bad news is that the housing crisis might just have worsened. 

    Sure, its not an across-the-board crisis, but it is very real to large and important sections of our population.  Lack of housing affordability remains a threat to social sustainability and economic recovery.  So how are we responding to the threat — or perhaps now the reality — of a perfect housing storm?  What provisions are we making in our urban plans?

    Smaller boxes – bigger footprint
    Urban planners are still more preoccupied with fitting more dwellings into smaller areas than they are with responding to people’s needs for housing.  It might help shift this fixation to point out that the preferred compact city solution is not only socially destructive, because it doesn’t reflect need and does nothing for affordability, but it is also environmentally short-sighted.

    Think about the metrics.

    Take 100 people and house them at 1.5 residents per dwelling.  That’s arbitrary, but it reflects a widespread expectation that most new dwellings will house smaller households in central locations. 

    In the interests of sustainability, let’s assume the resulting 67 dwellings are small, so that we can fit more of them onto less land.  Say, 120 sq meters per dwelling.  That totals 8,000 sq metres or thereabouts (more if we count the common areas in apartment buildings), 80 sq metres per person.  It’s also 67 kitchens, 67 lounges, maybe 67 media centres, at least 67 bathrooms, maybe some additional lighting for common areas and even some lifts.

    Now take 100 people and fit them in at 3 people per dwelling, terraces, duplexes or fully detached houses.  Let’s make the dwellings bigger, say 200 sq metres.  We now need only 33 dwellings, 6,600 sq metres of dwelling, or 66 sq metres per person.  Less space per person, sure, but that’s okay because now we need just half the kitchens, bathrooms, lounges and media centres.  However we look at it, we’ve used a lot less resources and have a spare 1,400 sq metres for open space, extra gardens, courtyards, whatever.  And with the capacity for extra bedrooms, we have much more flexible housing stock.

    So which is the more sustainable?  Surely bigger dwellings with higher occupancies.  Surprised?

    Can we plan for higher occupancies?
    Now, we can’t engineer household size, can we?  Well, actually we already do.  With a housing shortfall we now require young adults to stay longer with their parents, force singles to move in with others,  require couples to take on boarders, or even promote multi-family living, all boosting occupancies.

    So let’s at least understand that building more, smaller dwellings, especially medium- or high-rise apartments, does not necessarily deliver sustainable urban settlement, nor does it provide the flexibility to make the higher occupancy "solutions" we force on people easy to live with.

    Larger dwellings do allow for diverse living arrangements, but its more multi-generational living, more non-family households, more sharing.  Like them or not, such arrangements are likely to increase, if only in response to the affordability issues we seem intent on entrenching.

    So what’s happening to demand?
    So why are planners trying to put more people into smaller dwellings anyway?  How relevant is the expectation that average household size will be smaller in the future than it has been in the past?

    Most forecasts of housing “demand” simply extrapolate diminishing occupancy across demographic projections.  Its all about the coefficients, and the assumption that household structures won’t change much in the medium to long-term. 
    Well, it’s not that simple.

    Things like an unexpected boom in the dissolution of relationships over the past three or four decades, the rapid growth in migration, and the recent stabilisation and even reversal in occupancy rates undermine the conceit that we can accurately forecast the structure, preferences, and behaviour of households 20 or 30 years hence.  If that’s the case, why are our prescriptions for housing increasingly rigid?

    Projecting household types
    To understand this let’s stay with the current ”best”  projections of what households might look like in the future, and think about the implications for housing.

    Statistics New Zealand (SNZ) medium projections to 2031 indicate that families with children will account for a minority of household growth in our main cities (see chart).  The figures may even shrink in Wellington and Christchurch.  According to this projection, they will make up 28% of new households in Auckland, though, so we could still need over 71,000 new dwellings for families there.  It’s reasonable to expect that detached housing will still work best for them.

    Household Category Projections, Statistics New Zealand

    Couples will account for more growth, though, maybe 36% of new households in Auckland according to SNZ, and singles for 32%.  So let’s think about the preferences of the small household segment. 

    So what will the small household segment look  like?
    To get a feel for this, I divided the SNZ age projections into four (setting aside the main family age cohorts) : young adults (aged 20-29), empty nesters (the kids have left home, aged 50-64); early retirees (65-79), and later retirees (80+).  These are the groups most small households will come from.  But they have quite different housing preferences, so the nature of future demand for smaller dwellings depends on which ones grow the most.

    Age-Based Housing Demand Segments (based on SNZ Projections)

    So who will dominate growth?
    Empty nesters and retirees will dominate the demand for new houses.  And these are not usually people who want to move into small, centralised apartments, at least not as a primary residence. 

    Many of them have significant financial equity in their existing homes and emotional equity in their neighbourhoods.  If they move into smaller dwellings, they won’t be that small!  They will expect them to be well appointed and well located, probably close to where they already live. 

    They won’t want high or even medium rise.  And they are  likely to seek three or four bedrooms.  They will need the space to maintain active  lives into their seventies and eighties, more so than past generations.  They will be accommodating visiting family and friends; they will need offices, hobby areas, workshops, and storage. 

    Here’s a model to take seriously if we are serious about sustainability
    And as the baby boomers eventually become less independent, we might expect them to head into retirement villages, already a booming – and highly sustainable – form of housing.

    In fact, we should look seriously at retirement villages if we want to understand the sorts of arrangements that could dominate new housing demand over the next 30 years.  Here, the market seems to have got it right. 

    They offer varied living arrangements – detached and semi detached housing, terraces, apartments, and even on-site nursing facilities.  They offer medium density living with plenty of green space and gardens; common areas and shared facilities for recreation and leisure; plenty of on-site activity to cut down transport needs but also on-site parking to reflect the realities of modern living.  They achieve density and sustainability with style.  And – there must be a lesson here – they do it overwhelmingly in suburban if not city edge localities. 

    So let’s not assume that rising house prices mean a return to business as usual.  Far from it – freeing up the housing market must remain a top priority if the economy is in recovery mode.  And let’s start looking to the suburbs and beyond for the housing solutions that might just help it stay that way.

    Phil McDermott is a Director of CityScope Consultants in Auckland, New Zealand, and Adjunct Professor of Regional and Urban Development at Auckland University of Technology.  He works in urban, economic and transport development throughout New Zealand and in Australia, Asia, and the Pacific.  He was formerly Head of the School of Resource and Environmental Planning at Massey University and General Manager of the Centre for Asia Pacific Aviation in Sydney. This piece originally appeared at is blog: Cities Matter.

    Photo by flickr user: Adam Foster.

  • Declining Birthrates, Expanded Bureaucracy: Is U.S. Going European?

    To President Barack Obama and many other Democrats, Europe continues to exercise something of a fatal attraction.  The “European dream” embraced by these politicians — as well as by many pundits, academics and policy analysts — usually consists of an America governed by an expanded bureaucracy, connected by high-speed trains and following a tough green energy policy.

    One hopes that the current crisis gripping the E.U. will give even the most devoted Europhiles pause about the wisdom of such mimicry. Yet the deadliest European disease the U.S. must avoid is that of persistent demographic decline.

    The gravity of Europe’s demographic situation became clear at a conference I attended in Singapore last year. Dieter Salomon, the green mayor of the environmentally correct Freiburg, Germany, was speaking about the future of cities. When asked what Germany’s future would be like in 30 years, he answered, with a little smile,  ”There won’t be a future.”

    Herr Mayor was not exaggerating. For decades, Europe has experienced some of the world’s slowest population growth rates. Fertility rates have dropped well below replacement rates, and are roughly 50% lower than those in the U.S. Over time these demographic trends will have catastrophic economic consequences. By 2050, Europe, now home to 730 million people, will shrink by 75 million to 100 million and its workforce will be 25% smaller than in 2000.

    The fiscal costs of this process are already evident. Countries like Spain, Italy and Greece, which rank among the most rapidly aging populations in the world, are teetering on the verge of bankruptcy. One reason has to do with the lack enough productive workers to pay for generous pensions and other welfare-state provisions.

    Germany, the über-economy of the continent, has little hope of avoiding the demographic winter either.  By 2030 Germany will have about 53 retirees for every 100 people in its workforce; by comparison the U.S. ratio will be closer to 30. As a result, Germany will face a giant debt crisis, as social costs for the aging eat away its currently frugal and productive economy. According to the American Enterprise Institute’s Nick Eberstadt, by 2020 Germany debt service compared to GDP will rise to twice that currently suffered by Greece.

    Europe, of course, is not alone in the hyper-aging phenomena. Japan, South Korea, Taiwan and Singapore face a similar scenario of rapid aging, a declining workforce and gradual depopulation.

    In the past, it seemed likely America would be spared the worst of this mass aging. But there are worrisome signs that our demographic exceptionalism could be threatened. One cause for concern is rapid   decline in immigration, both legal and illegal.  Although few nativist firebrands have noticed, the number of unauthorized immigrants living in the U.S. has decreased by 1 million from 2007.   Legal immigration is also down.  Meanwhile, the number of Mexicans annually leaving Mexico for the U.S. declined from more than 1 million in 2006 to 404,000 in 2010 — a 60% reduction.

    More troubling still, fewer immigrants are becoming naturalized residents.   In 2008, there were over 1 million naturalizations; last year there were barely 600,000, a remarkable 40% drop.

    The drop-off includes most key sending countries, including Mexico, which accounts for 30% of all immigrants. Since 2008 naturalizations have dropped by 65% from North America, 24% from Asia and 28% for Europe.  In fact the only place from which naturalizations are on the rise appears to be Africa, with an 18% increase.

    This drop off, if continued, will have severe consequences. Since 1990 immigrants have accounted for some 45% of all our labor force growth and have increased their share from 9.3% to 15.7% of all workers. These immigrants, and their children, have been one key reason why the U.S. has avoided the deadly demography of Europe and much of east Asia.

    This decline can be traced, in part, by rapid decreases in birthrates among such traditional sources of immigrants such as China, India, Mexico and the rest of Latin America. Mexico’s birthrate, for example, has declined from 6.8 children per woman in 1970 to roughly 2 children per woman in 2011. This drop-off has reduced the number of Mexicans entering the workforce from 1 million annually in the 1990s to about 800,000 today. By 2030, that number will drop to 300,000.

    A second major cause lies with the improved economy in many developing countries like Mexico. According to economist Robert Newell, per-capita  Mexico’s GDP and family income have both climbed by more than 45% over the last 10 years  . Not only are there less children to emigrate, but there’s more opportunity for those who chose to remain.

    Asia not only has lower birthrates, and, for the most part, better performing economies. As a result, immigrants — many of them well educated and entrepreneurially oriented — who in earlier years might have felt the need to come to the U.S. now can find ample opportunities at home. Many educated immigrants and graduate  students, notably from Asia, are not staying after graduation. America’s loss is Asia’s gain.

    Finally the weak U.S. economy is also depressing birthrates to levels well below those of the last decade — birthrates that could soon reach its lowest levels in a century. Generally, people have children when they feel more confident about the future. Confidence in the American future is about as low now as any time since the 1930s.

    Other factors could further depress birthrate. High housing costs and a lack of opportunities to purchase dwellings appropriate for raising children have contributed to the growth of childless households in countries as diverse as Italy and Taiwan. Until now, American home prices — including those for single-family units — were relatively affordable outside of a few large metropolitan areas.

    But now many local and state governments — often with strong support from the Obama Administration — are implementing European-style “smart growth” ideas that would severely restrict the number of single-family houses and drive people into small apartments. For decades, areas with affordable low-density development (such as Houston, Dallas, Nashville, Raleigh and Austin) have attracted the most families. If we become a nation of apartment-dwelling renters, birthrates are likely to slide even further.

    What does this suggest for the American future? History has much to tell us about the relationship between demographics and national destiny. The declines of states — from Ancient Rome to Renaissance Italy and early modern Holland — coincided with drops in birthrates and population.

    To many in Europe our entrance to the ranks of hyper-aging countries would be a welcome development. It would also cheer many academics and greens, and likely some members of the Obama Administration, who might see fewer children as an ideal way to reduce our carbon footprint. Perhaps happiest of all: the authoritarian Mandarins in Beijing who can send their most talented sons and daughters to American graduate schools, increasingly confident they will return home to rule the world.

    This piece originally appeared at Forbes.com.

    Joel Kotkin is executive editor of NewGeography.com and is a distinguished presidential fellow in urban futures at Chapman University, and an adjunct fellow of the Legatum Institute in London. He is author of The City: A Global History. His newest book is The Next Hundred Million: America in 2050, released in February, 2010.

    Photo by flickr user Sigs24141

  • The Crisis of the “Gentry Presidency”

    The Obama administration’s belated attempt to address the looming employment crisis — after three years focused largely on reviving Wall Street, redoing health care and creating a “green” economy — reflects not only ineptitude but a deeper crisis of what is best understood as the “gentry presidency.”

    Unlike previous Democratic presidents, including John F. Kennedy and Bill Clinton, President Barack Obama’s base primarily lies not with the working and middle classes, who would have demanded effective job action, but with the rising power of the post-industrial castes, who have largely continued to flourish even through the current economic maelstrom.

    From the beginning, Obama has been nurtured and supported by an array of influential leaders in finance, technology and real estate who supported his rise. In the run-up to his nomination, he attracted more money from Wall Street than Hillary Clinton, New York’s senator. Later, he pummeled the Republican nominee, Sen. John McCain (R-Ariz.), by a wide margin among financiers.

    To be sure, Obama’s ground game relied on organized labor, particularly public-sector unions, African-Americans, Latinos and progressive activists. But these groups have not emerged stronger from his three years in office.

    Instead, the major winners of the Obama years have been the big nonprofits, venture capitalists and, most obviously, the financial aristocracy. These have all benefited from the Ben Bernanke-Timothy Geithner — previously the Bernanke-Henry Paulson — policy of cheap money and near zero-interest rates, which have depressed the savings of the middle classes but served as a major boon to Wall Street. This has benefited mostly the wealthiest 1 percent, which owns some 40 percent of equities and 60 percent of financial securities.

    This Wall Street-first approach makes Reaganite “trickle down” look like a populist torrent. Glimmers of reality are beginning to dawn on more perceptive progressive analysts, like Kevin Drum of Mother Jones, who accuses the Democrats under Obama of abandoning “the middle class in favor of the rich.” The Democrats, grouses the reliably partisan but perceptive Harold Meyerson, should be known as “Bankers R Us.”

    To be sure, some parts of the old progressive coalition, such as African-Americans, whose prospects have declined markedly under Obama, will most likely remain loyal to the president. Many other working- and middle-class voters, including Latinos and young people, groups particularly hard hit, may not be ready to bolt en masse for the GOP. But their lessened enthusiasm to participate in either the campaign or to vote could threaten the White House next year.

    These developments, as Marxists might put it, reflect the fundamental contradictions of gentry liberalism. Essentially, gentry liberalism reflects the coalescing interests among the financial, technological and academic upper strata. For these people, the Great Recession was brief and ended long ago. All depend heavily on high stock prices to maintain their wealth. Their interest in the overall U.S. economy — particularly the Main Street grass roots — has become ever more tenuous with their increasing ability to shift assets to East Asia and other developing country hot spots.

    These prerogatives have been neatly protected under Obama. In the past, administrations let corporate scofflaws, like the savings and loan companies, collapse. Some were sent to jail.

    But this time, the Wall Street elites have been allowed to skate through their own self-created crisis with astounding agility. Not only have they stayed out of the slammer, but they have been enjoying the best of times.

    This may have also been good news for Manhattan and San Francisco real estate and luxury retail — Tiffany profits were up 25 percent in the past quarter. Silicon Valley venture capitalists, in particular, have been lavished with access to cheap government loans and incentives — as demonstrated by the recent revelations about solar manufacturer Solyndra — to promote their attempted expansion into the ballyhooed “green economy.”

    The essential problem of gentryism, however, is that it fails to address the fundamental economic needs of the vast majority. It is also tied to policy prescriptions that either fail to spur broad-based growth or, in some cases, hinder it.

    For one thing, by concentrating wealth at the top, the gentry approach has depressed entrepreneurialism among the vast middle and working classes. In contrast to past “recoveries,” the rate of new start-ups has slowed considerably. The health of existing small business remains feeble, notes the National Federation of Independent Business.

    Other initiatives have slowed potential growth, particularly the threat of new draconian environmental regulations. Fossil-fuel development, for example, represents one of the best opportunities for new, high-wage employment for blue- and white-collar workers. In contrast, the massive expenditures of public money on “green jobs” has turned out to be less than effective in creating blue-collar employment.

    Equally revealing has been the pathetic performance of states that most fully embraced gentryism. California, an epicenter of the gentry economy, suffers the second-worst unemployment and lowest new business formation rates among all the states. Illinois lost more jobs in August than any other state. The bluest places — New York City and California — also tend to be the most unequal — and places where the middle class is fleeing.

    Whatever the failings of ungentrified Texas — ranging from a too-tattered social safety net and too many low-paying jobs — the rate of employment growth, including the high-tech sector, dwarfs that of key blue states, including California. Denizens of California, New York and other Obama bastions are voting for the Lone Star state with their feet.

    You don’t have to be a fan of Gov. Rick Perry to acknowledge Texas’s relative success compared with the gentry bastions.

    Overall, gentry rule has fostered a sense throughout the American public of national decline and diminishing personal expectations. Small property ownership, the key to a democratic capitalist society, is fraying. Wall Street’s Morgan Stanley, for example, having helped create the housing crisis, now talks boldly of a “rentership” society.

    This would extend the dominion of Wall Street and large landowners, like feudal lords, over the last redoubts of small property owners.

    Clearly, as even many on the left now acknowledge, we need a bold and radical break with gentry politics. Bernanke-ism is absurd — given that, under today’s conditions, a federally sponsored Wall Street boom does not assure prosperity for most. Perhaps it is time to focus instead on how to shift capital and incentives to the grass-roots economy.

    One possible reform would be a flat, or flatter, income tax that eliminates the patently unjust lower rates for capital gains and eliminates dodges for the ultra-rich, while creating greater incentives to individual grass-roots wealth creation. The Obama payroll tax cut represents a small, grudging step in this direction, but may well be too little, too late.

    Such a radical break would most likely cause mass consternation in Washington — as both parties rally to save their friends on Wall Street and a host of special tax breaks that enrich their campaign coffers. Many big money conservatives would shoot back with capitalist indignation while Democrats like Wall Street’s consigliere Sen. Chuck Schumer (D-N.Y.) would come up with more elegant reasons to protect their Wall Street backers.

    But such a suggestion from Obama might show his willingness to end a vassalage to the patrician class that is sinking both the economy and his own reelection chances.

    This piece originally appeared at Politico.

    Joel Kotkin is executive editor of NewGeography.com and is a distinguished presidential fellow in urban futures at Chapman University, and an adjunct fellow of the Legatum Institute in London. He is author of The City: A Global History. His newest book is The Next Hundred Million: America in 2050, released in February, 2010.

    Photo by flickr user Uggaboy

  • Obama’s New $50 Billion Infrastructure Stimulus — Old Wine in New Bottles

    President Obama’s new $50 billion infrastructure initiative — part of his $447 billion American Jobs Act (AJA)—offered no surprises. It’s almost an exact replica of his FY 2012 budget request which included a sum of $50 billion for transportation to “jump start” a proposed $556 billion six-year surface transportation reauthorization.

    The rhetoric may have changed — Obama avoided using the terms “stimulus” and “infrastructure” in presenting his AJA initiative to Congress—but the substance of the two initiatives is remarkably similar. Both proposals would fund an identical mix of programs (highways, transit, Amtrak, high-speed rail, aviation and the TIFIA credit program) and both would establish a National Infrastructure Bank.

    The FY 2012 transportation budget request failed to obtain congressional approval for two reasons: (1) the Administration failed to show how the proposed $50 billion program would be paid for; and (2) there was no convincing evidence that the program would promptly create new jobs. Indeed, all evidence pointed in the opposite direction. The $48 billion in Recovery Act funds for transportation had failed to create the millions of jobs promised by the Administration. The money earmarked for highways had been spent largely on short term roadway maintenance-type contracts and had produced only temporary jobs. Nor was there much to show for in terms of an improved condition or performance of the nation’s transportation system. As for the Infrastructure Bank, it is widely believed that at least one or two years could pass before the Bank would become operational and in a position to begin financing large-scale job-creating infrastructure projects.

    The same reasons that led Congress to ignore the Administration’s FY 2012 transportation budget request will likely cause the lawmakers to reject the new transportation initiative. They are skeptical that a fresh infusion of funds will succeeed where the first stimulus failed. Doing the same thing over and over again and expecting different results may not be exacly insanity but it does suggest a certain denial to look facts in the face.

    The President said that “everything in this bill will be paid for” and that he will call on the Joint Deficit Committee to come up with additional deficit reductions necessary to pay for the American Jobs Act. But by proposing to end tax breaks for people making more than $200,000 and for oil and gas companies, the White House is setting itself up again for a fight with the Congress which already once before rejected this approach to “revenue enhancement.” It remains to be seen if the independent congressional committee will do Obama’s bidding. With the President’s approval ratings at an all time low, they just might be emboldened to ignore his plea.

    Note: the NewsBriefs can also be accessed at www.infrastructureUSA.org
    A listing of all recent NewsBriefs can be found at www.innobriefs.com

  • Major Texas Metro Areas Are Confirming Failures in Rail Transit

    Despite the success of the Main St. line, I’ve been concerned for a long time now that the next set of rail lines will essentially bankrupt Metro while providing minimal benefit (except for possibly the Universities line, which has moderate benefits, but may not get built anytime soon because of the money drain of the other lines being built first).  Now the Coalition On Sustainable Transportation (COST) has come out with the numbers from other cities (especially Dallas) that don’t bode well for Houston at all.  Some key excerpts (I know it’s a lot, but there are some really good points in here):

    —————

    For example: Dallas will pay increasing debt service for many years and has 30 plus year bonds and commercial paper for its almost $4 billion of debt. Their debt service is considered annual operating costs in the chart below, because: By the time current bonds are paid, the rail system will be at the end of its service life and will need replacement through the creation of a new round of bonds, continuing this high bond expense for as long as the system operates. While other Texas cities have not yet reached this Dallas level of bond debt and expense, Houston is rapidly moving in the same direction and Austin’s planning is pointing in this direction. Currently Dallas’s debt service is about 3 times Houston’s and almost 40 times Austin’s.

    One may look at the data in the table above in many ways, but, none of the conclusions seem to be positive for rail transit. Dallas, Houston, San Antonio and Austin are all among the top 20 fastest growing major cities in the nation. However, the three cities with various levels of rail transit, Dallas, Houston and Austin, all have declining transit ridership trends and have fewer absolute transit riders today than they had a dozen years ago. They have spent billions to implement and promote transit with a heavy focus on rail transit.

    These data highlight a number of broader Texas Metro Area negative transit trends:

    1. Metro areas with more rail transit have significantly higher costs and higher taxpayer subsidies per ride.
    2. Metro areas with more rail transit have fewer total transit boardings per capita.
    3. Metro areas with higher densities have fewer transit riders (boardings) per capita.
    4. Dallas has the largest population and greatest population density but the least cost effective transit system: Higher cost per ride (boarding) and fewer boardings per capita.
    5. Increasing the proportion of a region’s transit funds being spent on rail transit leads to less cost effective overall transit and degraded transit for the majority of transit riders who still ride busses.

    Some Major Texas City Metro Areas comparisons/observations regarding transit data:

    1. Dallas-Ft. Worth Metro’s population is more than 3 times San Antonio’s and Dallas’ annual transit operating expense is 4.4 times San Antonio’s but Dallas has only 1.6 times the transit ridership of San Antonio.
    2. Dallas-Ft. Worth Metro’s population is 3.8 times that of Austin and Dallas’ annual transit operating expense is 3.7 times the transit expense of Austin but Dallas-Ft. Worth has only 1.9 times Austin’s ridership.
    3. Dallas has the most invested, more than $4 billion, in light rail and it has the highest cost per transit ride at 2.8 times San Antonio’s costs and almost 2 times Austin’s. Dallas has the least boardings per capita, about one-half of San Antonio and Austin.
    4. San Antonio’s bus only transit system has 1.2 times Austin’s ridership but only 82% of Austin’s annual operating expense.
    5. San Antonio’s ‘cost per transit rider’ is about one-third of Dallas-Ft. Worth’s and San Antonio has 2 times as many transit riders per capita as Dallas-Ft Worth.
    6. Dallas’ 2011 net debt service (principal and interest) budget of $153 million is greater than San Antonio’s total 2011 budgeted operating costs of $141.3 million and almost as much as Austin’s $168.2 million.


    It is no surprise that Dallas has hit a transit financial wall causing it to pause and curtail, at least temporarily, further light rail expansion. It seems, the more light rail Dallas implements, the more inefficient and expensive its transit becomes. This is an often occurring trend when regions implement rail transit and is a serious problem trend now developing in Houston and Austin. The result is overall degradation of transit service as exorbitantly expensive rail transit and resulting debt absorb increasingly higher percentages of transit funds. This, in turn, results in increasing transit fares and reductions in bus service which have disproportionately negative quality-of-life impacts on lower income citizens. Almost everyone forgets that the majority of transit riders still ride busses even after such massive investments in rail transit such as in Dallas or in Portland, the Mecca of train transit, where well over one-half of the transit rides are on busses. More importantly, this wasteful spending on ineffective trains ‘bleeds dry’ taxpayer funds which could be used to make positive contributions in serving communities’ many, higher priority needs for all citizens. (like express commuter bus services from all neighborhoods to all job centers, as I’ve been advocating)

    Much experience has shown that once a cycle of high cost rail transit is implemented, the agency becomes heavily burdened with debt for a very long time. It is highly probable that the very high debt service (principle and interest) will become a permanent and major part of the transit agency’s annual operating costs. When one issue of bonds is paid down, it becomes time for another round of debt to replace aging equipment. This, in turn results in very poor cost effectiveness and degradation of the overall transit system as it serves fewer riders at higher costs. This high debt can never be paid-off without major increases in local taxes. Transit agencies cannot responsibly project and achieve enough ridership to make rail transit cost-effective. This has even less credibility in light of the national declining trend in the use of transit and the fact that the use of transit in Texas’ major metro areas has a declining trend over the past dozen years. As Dallas and other major cities have experienced, this results in a spiraling decline in transit performance and effectiveness, degradation of mobility for low income citizens and, often, cutbacks in other higher priority city services. This results in reducing overall quality-of-life.

    —————-

    Is this the future we really want for Houston?  Because it’s not too late to stop it now, but it will be too late very, very soon, and then we will be stuck with the same harsh reality as Dallas for decades to come…

    This post first appeared at Houston Strategies

  • The Evolving Urban Form: Milan

    Italy’s population growth has been stagnating in recent decades, but has turned around during the last decade, with the annual growth rate increasing 16 times (from 0.04 percent to 0.69 percent). According to United Nations data, Italy added more international migrants in the 2000s (3.8.5 million) than it added people in any ten year period since 1960. Some of the strongest growth has been in the Milan metropolitan region, which has begun to grow again after years of stagnation. This is not due to any increase in Italian birth rates but principally because of surging international migration.

    Much of this has to do with the enlargement of the European Union (EU) from 15 to 27 member states, and the consequent removal of all legal barriers to internal migration. The Milan metropolitan region, occupies much of Lombardy, Italy’s most populated region. Milan added 634,000 foreign residents in just six years (2000 to 2008, the latest year for which data is available).  The largest share, 103,000, was from the EU’s Romania, with 50,000 from Albania, 47,000 from Morocco, 30,000 each from Ecuador and Egypt and 27,000 from Ukraine. Over the period, more than 80 percent of Lombardy’s growth has come as a result of international immigration.  The key to this lies with the region’s economy, which is the strongest in Italy and all of southern Europe.

    International migration has also fueled large population increases elsewhere, especially in both northern and central Italy, such as Rome and Turin. Further south, however, growth (such as in the Naples area) has continued to be comparatively slow (Figure 1).

    The Urban Area: The Milan urban area is the largest in Italy. The Milan urban area stretches from the core of Milan northward to the Alps and includes development in the provinces of Varese (photo), Como, and Lecco (Photo: Lecco) as well as Monza and Brianza. The province of Como is home to the picturesque Lake Como, while Varese sits at the foot of the Simplon Tunnel (of "Venice Simplon-Orient Express" fame) and the highway over Simplon Pass to Brig in Switzerland’s Rhone Valley and the Matterhorn.


    Varese


    Lecco: Northernmost suburbs


    There is also considerable development both to the east and the west in the province of Milan and more limited development to the south. Overall, the urban area has a population of approximately 5,400,000 (Note 1), covering approximately 800 square miles (2,100 square kilometers) for a population density of approximately 6,700 per square mile (2,500 per square kilometer).  This is similar to that of Los Angeles or Toronto.

    Growth in the Metropolitan Region: Until the recent increase in international migration, the Milan metropolitan region was growing slowly and more recently even losing population. Between 1991 and 2001, the metropolitan region lost one percent of its population. However, since 2001 the metropolitan region has gained 9.0 percent, an improvement from the minus 1.1 percent between 1991 and 2001. The last decade’s growth was at an average annual increase rate of 0.96 percent which is slightly more than the United States (0.94 percent) and slightly less than Canada (1.04 percent). 

    The Inner City: The commune of Milan is the central municipality of Milan metropolitan region. The population of Milan peaked in 1971 at just under 1,700,000 people. By 2001 the population had fallen to approximately 1,250,000 people, a loss of approximately 25 percent and its lowest population since before the 1951 census. The central municipality of Milan continued to lose population to 2001. From 1991 to 2001, Milan lost more than 100,000 people and nine percent of its population. Milan is not unusual in this decline. Declines have been characteristic for virtually all Western European central municipalities, except where there was substantial greenfield space to accommodate new suburban development (such as in Rome).

    However, the commune of Milan has begun to grow again. Milan’s population has increased by nearly 70,000 people or 5.4 percent. Milan now has a population density of 18,600 per square mile (7,200 per square kilometer), slightly higher than that the city of San Francisco (Photo: Milan). Even with the recent increase, however, all of the growth in the Milan metropolitan region since 1991 has been in the suburbs and exurbs (Figure 2) and 87 percent in the last decade (Figure 3).


    Milan

    Much of the commune’s population increase has been the result of international migration, since many Italians continue to migrate to the surrounding suburban and exurban areas, as is the case in a number of European metropolitan regions.  Domestic out-migration continued from the commune of Milan, while the suburbs and exurbs attracted domestic migrants (Note 2).

    Inner Suburbs: The inner suburbs of Milan include portions of the province of Milan outside the commune of Milan and the (single) province of Monza and Brianzia, which was separated from the province of Milan earlier in the decade. The inner suburbs also lost population between 1991 and 2001. This was reversed between 2000 and 2010, when the inner suburbs added approximately 230,000 people, and grew at an overall rate of 9.4 percent. The inner suburbs have a population density of approximately 5,000 per square mile (1,900 per square kilometer), somewhat less than the Sydney urban area and 1.5 times that of Portland.

    Outer Suburbs and Exurbs: The outer suburbs and exurbs stretch north to the foot of the Alps, as well as to the south of the province of Milan. The largest population is to the north, with a far smaller population to the south, in the exurban provinces of Pavia and Lodi. Unlike the commune of Milan and the inner suburbs, the outer suburbs and exurbs have grown in each of the last decades.  Between 1991 and 2001, the outer suburbs and exurbs accounted for all the growth, though at a modest rate of 2.5 percent. The growth has substantially increased since 2001 with the addition of more than 245,000 new residents and a growth rate of 10.4 percent. International migration accounted for 93 percent between 2002 and 2008, 93 percent were foreign (202,000).

    Where the Immigrants are Moving: As might be expected with strong international migration, most of the new entrants have moved to the inner city and inner suburbs. Between 2002 and 2006, 97 percent of the population growth was from international migration, with an addition of 202,000. The overall foreign population increased 119 percent from 2002 to 2008. Yet, the percentage growth was much stronger in the outer suburbs and the exurbs, where the foreign population grew 171 percent (125,000). However, this represented a smaller share of the overall growth (67 percent), which is likely to be an indication of strong outbound domestic migration from the inner city and the inner suburbs to the outer suburbs and exurbs. There was also strong foreign population growth in the balance of Lombardy, with an increase of 147 percent, which constituted a somewhat higher share of overall growth, at 84 percent (Figure 4).

    Decentralizing, Diversifying Milan: Like the other international urban areas (Note 3), Milan continues to suburbanize, though growth has also resumed in the historic core municipality. At the same time, international migration is changing Milan and Italy. United Nations (UN) data indicates that the number of international migrants to Italy was 10 times higher in the 2000s than in the 1990s. The UN projects that the inflow will drop by 50 percent between 2010 and 2015 and then to approximately one-third the 2000s influx to beyond 2050. Whatever the result, because of its strong economy, the Milan area will doubtless continue to attract a disproportionate share of the new arrivals.

    Wendell Cox is a Visiting Professor, Conservatoire National des Arts et Metiers, Paris and the author of “War on the Dream: How Anti-Sprawl Policy Threatens the Quality of Life

    —–

    Note 1: Milan is one of a small number of large urban areas that is often dismissed as being much smaller than it really is. This is because data for metropolitan regions is not routinely produced in Italy and Milan. As a result, analysts often referred to the population of the historical core municipality which has only 20 percent of the metropolitan population. Similar problems of national reporting occur in Germany’s Rhine – Ruhr (Essen-Dusseldorf) metropolitan region and Jakarta, Manila and Kuala Lumpur. The Rhine-Ruhr does not appear on the United Nations urban agglomeration list of all over 750,000, despite the fact that it has 7 million people in close proximity, at near average Western European large urban area densities (7,100 per square mile or 2,800 per square kilometer, compared to the Western European average of 8,000 per square mile or 3,100 per square kilometer)

    Note 2: More detailed data is not available on the internet from the Istituto Nazionale di Statistica Italia, Italy’s statistical bureau.

    Note 3: See additional reviews in the "Evolving Urban Form" series, at : Beijing, Chicago, Dallas-Fort Worth, Jakarta, Los Angeles, Manila, Mexico City, Mumbai, New York, SeattleSeoul and Shanghai .

    Photo: Duomo (Cathedral), Milan. Photographs by author.