Blog

  • Automation, Artificial Intelligence, and Projectile Wooden Shoes

    Sabotage has its root in the French word sabot, which is a kind of wooden shoe. In the early days of the Industrial Revolution craftsmen would throw their shoes into the gears of factory machines. Skilled labor was being replaced with mechanical production, undermining traditional professions, reducing incomes, and removing the social standing of workers. Wealth flowed up to the people who owned the factories and controlled the levers of political power. Sabotage was a form of negotiation. Industrial production was so incredibly efficient and profitable that the craft guilds had no chance of surviving over the long term. And since the cost of manufactured goods dropped like a stone with industrial processes society wasn’t inclined to turn back the clock. What unfolded over the course of a couple of centuries was a series of social, political, and economic convulsions including revolutions, wars, and mass migrations.

    screen-shot-2017-02-14-at-8-09-03-am

    screen-shot-2017-02-14-at-8-08-49-am

    screen-shot-2017-02-14-at-8-09-20-am

    I passed a construction site recently and saw this mobile surveillance pod. This is the beginning of the end of the night watchman. It’s part of the ever expanding panopticon of electronic monitors connected 24/7 to the cloud – complete with facial recognition software and the ability to cross reference an endless number of databases including everyone’s e-mails and geotagged cell phone records. Rent-a-cops are on the way out.

    screen-shot-2017-02-18-at-8-29-21-pm

    screen-shot-2017-02-18-at-8-30-14-pm

    screen-shot-2017-02-18-at-8-29-42-pm

    screen-shot-2017-02-18-at-8-30-03-pm

    Think this is only a big city thing? Try rural Montana. Same same. The squad car parked on the side of the highway with a radar gun is about to fade away. A far more effective and lucrative series of electronic devices will instill discipline in drivers and generate passive municipal revenue instead. Did I mention aerial drones? First they’re used in Afghanistan. Then along the Mexican border. Then poor high crime neighborhoods. Then your quiet little cul-de-sac in Indiana or South Carolina… The code enforcement people are going to love it.

    Screen Shot 2016-03-27 at 10.41.15 PM

    Screen Shot 2016-03-27 at 10.41.39 PM

    How much longer do you think it will be before long haul trucks are fully automated? Autonomous vehicles are cost cutting devices, not the latest upgrade for consumer convenience. What do you think will happen to all the roadside establishments that serve the needs of human truck drivers? Tick tock.

    screen-shot-2017-02-07-at-6-24-10-pm

    This is Google’s newest gadget. It’s comparable to Amazon’s Alexa and Apple’s Siri. Speak to these machines and they perk up. “Play Bohemian Rhapsody.” Or “Order four AA batteries.” Or “When is my next dentist appointment with Dr. Harris?” These devices search the internet and/or various personal files from your phone or computer and seamlessly give you what you want.

    screen-shot-2017-02-18-at-6-20-32-pm

    screen-shot-2017-02-18-at-6-20-54-pm

    Think you’ll be spared because you’re an educated professional? It’s only a matter of time before more advanced versions of artificial intelligence replace an army of human workers in more skilled positions. Medical centers will swap out administrative staff for a suite of voice activated algorithms. Computer programs will eventually read X-Rays and MRI results and provide preliminary diagnoses. Secure pill dispensing machines are already the norm in many hospital pharmacies. Tech support and customer service jobs will disappear. Accountants and paralegals are on that same list. Think outsourcing overseas was a problem for the former middle class? Think illegal immigrants drove down wages? Wait for what’s coming next.

    screen-shot-2017-02-11-at-5-26-33-am

    screen-shot-2017-02-11-at-5-24-40-am

    screen-shot-2017-02-11-at-5-23-25-am

    screen-shot-2017-02-11-at-5-25-55-am

    screen-shot-2017-02-11-at-5-25-03-am

    Here’s a common sight in Silicon Valley. Colonies of second hand RVs parked between a Burger King and a freeway off ramp are occupied by people who have no better option. The middle class tends to write off such populations as alcoholic schizophrenics. I interact with these folks on a regular basis and most have jobs. Some have two or three. They’re adamant that they did nothing wrong, but the larger society has simply discarded them. The median home price in San Jose is $1,085,000. Median rent for a studio apartment is $2,120. Moving to a “cheaper” place like Oakland is no longer an option. Two bedroom apartments there now rent for $3,500 – assuming you can find a vacancy. The minimum wage in these communities ranges between $10.30 and $15 an hour. The numbers don’t add up. There are an awful lot of these homeless camps everywhere these days. This is what a bifurcated economy looks like.

    A friend asked me to write about a possible Minimum Guaranteed Income. The concept is simple enough. If an individual or household earns less than a certain amount of money the government will fill the gap with a cash payment. I remember my social studies teacher talking about a “negative income tax” back in the 1970’s so this isn’t a new idea.

    My response was short and to the point. Not going to happen. Americans reject wealth transfers and chafe at any hint of “social engineering.” Anti-poverty programs are so deeply unpopular that a Minimum Guaranteed Income is a non-starter. And resistance is strongest from the people who would most benefit – the marginal declining middle class.

    The usual solutions aren’t going to work either. Dramatically raising the minimum wage will only encourage more employers to automate more agressively to squeeze labor out of their business models. Jacking up taxes will drive jobs and people out of the state (a process that is already well under way.) Building subsidized housing won’t scale up and is politically toxic. Rent control keeps some people in artificially affordable housing at the expense of their landlords, but does nothing to create new housing – quite the opposite. Reducing regulations and eliminating onerous bureaucracies is structurally impossible since the agencies that administer existing programs are a lot more powerful than the people they’re meant to serve. Moving to Texas works for people who already have a toehold in the middle class, but for those with less skills and no money life in Houston is merely slightly less miserable. The list goes on…

    screen-shot-2017-02-20-at-3-25-18-am

    screen-shot-2017-02-20-at-3-25-08-am

    screen-shot-2017-02-20-at-3-36-01-am

    Screen Shot 2016-02-04 at 7.58.45 PM

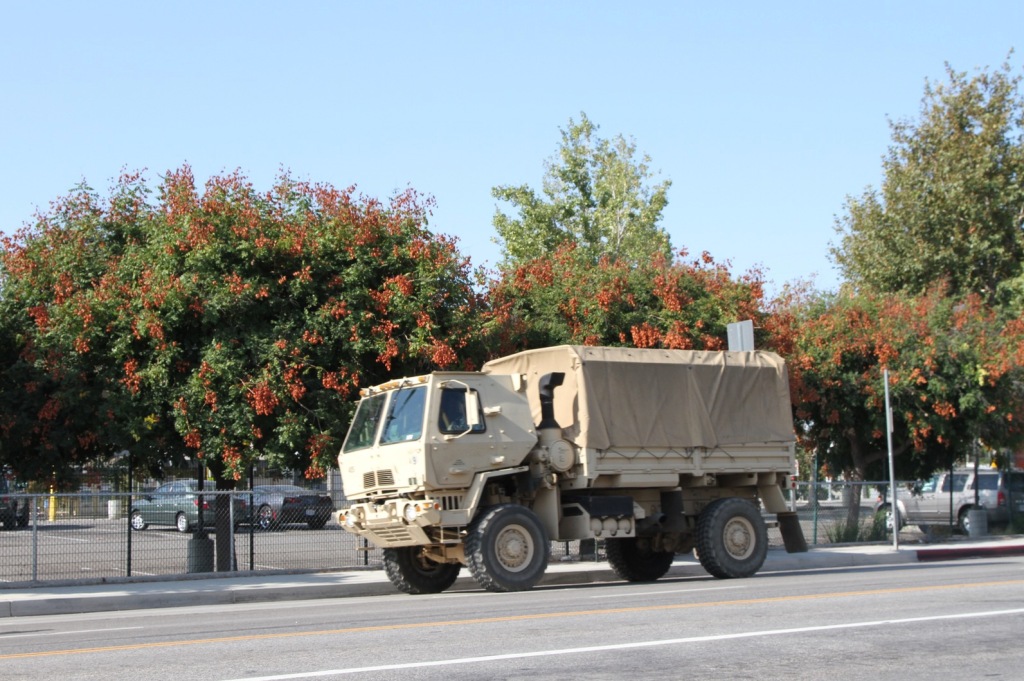
    My best guess is we’ll see the implementation of policies that achieve similar goals to a Minimum Guaranteed Income by other means. But they’ll need to be in keeping with the dominant cultural narrative: The Puritan Work Ethic. If you don’t work, you don’t eat. And they’ll have to be designed to filter out people who are deemed unworthy of inclusion. That’s been the pattern for centuries. The military is the primary model. Cradle to grave socialism is perfectly acceptable – often eagerly embraced – by American society if the wealth transfer is to people who are believed to be deserving. The militarization of domestic affairs is a distinct possibility.

    screen-shot-2016-10-12-at-9-23-39-am

    screen-shot-2016-10-12-at-9-49-12-am

    Massive infrastructure building projects are another viable option for employing large numbers of low skill workers. The cost, productive capacity, or return on investment of such projects is essentially irrelevant. Project funding will be allocated by a political process that prioritizes select populations in particular locations. This preserves the existing vested interests – a combination of corporations and big government. Republican. Democrat. Conservative. Liberal. It doesn’t matter. The goal is to allow business-as-usual to limp along for a while longer while mollifying the displaced population. This will work until the feds can no longer borrow and print money. The alternative is a Soviet Union style collapse.

    John Sanphillippo lives in San Francisco and blogs about urbanism, adaptation, and resilience at granolashotgun.com. He’s a member of the Congress for New Urbanism, films videos for faircompanies.com, and is a regular contributor to Strongtowns.org. He earns his living by buying, renovating, and renting undervalued properties in places that have good long term prospects. He is a graduate of Rutgers University.

    All photos by Johnny Sanphillippo

  • Dallas-Fort Worth & Dayton: World Large City Least Congestion: 2017 Tom Tom Traffic Index

    Dallas-Fort Worth and Dayton Ohio have the least traffic congestion among larger cities (urban areas) in the world, according to the 2017 Tom Tom Traffic Index. Dallas-Fort Worth had the shortest average all day delay, at 18 percent of the 43 cities with more than 5 million population. Dallas-Fort Worth also had the least average peak period traffic delay. This is the second year in a row the Dallas Fort Worth has had the best all day traffic congestion. Dayton had the best all day and average peak hour congestion among the 146 cities with between 800,000 and 5,000,000 population and tied with three others for the best in among all cities the least all-day congestion.

    All City Rankings

    Among all city sizes, Syracuse (NY), Greensboro (NC), Winston-Salem (NC) and Dayton had the best all day traffic, with a nine percent average delay. Cadiz, Spain had the best average peak hour congestion, with an 11.5 percent delay.

    Mexico City had the most intense all day congestion, at 66 percent, followed closely by Bangkok at 61 percent. Other cities with the most congestion include, not surprisingly, Chongqing, Jakarta, Istanbul and Beijing. All have large populations, high densities and millions of cars. A real surprise, however is Lodz, Poland, with a population of less than 750,000, which has the fourth worst congestion (Figure 1)

    Bangkok ranked the most congested city, in the AM and PM peak periods, with an average traffic delay of 104.5 percent. This means that it takes twice as long in Bangkok to make a trip as it would if traffic flowed freely. Mexico City had the second largest delay at 98.5 percent, followed by Bucharest (Romania) at 94.0 percent. Bucharest   heavy traffic congestion surprises, since it has, at best, only one-fifth the population of the largest seven most congested cities. Even more surprising is that much smaller Belfast is the sixth most congested, while Dublin, smaller than Bucharest, ranks seventh (Figure 2).

    Cities Over 5,000,000 Population

    Out of the 43 cities with more than 5 million population, three US cities (Philadelphia, Houston and Chicago) and Madrid join Dallas-Fort Worth in having the least all-day traffic congestion. The five cities with the most traffic congestion are Mexico City, Chongqing, Jakarta and Istanbul (Figure 3).

    Three of the cities with the least average peak congestion are in the United States, including Dallas-Fort Worth, second-ranked Philadelphia and fourth-ranked Chicago. Madrid, again makes the top five in third position, while Sao Paulo ranks fifth (Figure 4). The Chinese cities of Quangzhou and Suzhou rank surprisingly well, in view of the national traffic congestion level (Table), at 6th and 9th least congested.


    Cities with 800,000 to 5,000,000 Population

    All 10 of the least congested cities between 800,000 and 5 million population all day are in the United States. The least congested are Dayton, Knoxville, Richmond, Omaha and Indianapolis, in a fifth-place tie with Kansas City.

    Bucharest had the most all day congestion, followed by Tiainan, Changsha, Shijazhuang and Kaohsiung  (Figure 5).

    The eight least congested cities between 800,000 and 5 million population during peak periods are located in the United States, led by Dayton, Knoxville, Richmond, Tulsa, Worcester and Kansas City.

    The greatest traffic congestion in this population category is in Bucharest, which is followed by Shijiazhuang, Changsha, Auckland and Zhuhai (Figure 6).

    Cities with Less than 800,000 Population

    The four cities with less than 800,000 population and the least all-day traffic congestion are in the United States, Winston-Salem (NC), Syracuse (NY), Greensboro (NC) and Akron (OH). The fifth best traffic congestion is in Ljubljiana, the capital of Slovenia.

    The worst all day traffic congestion in this category is in already cited Lodz and Dublin, as well as Palermo, Belfast, Lublin (Poland) and Edinburgh (Figure 7).

    Cadiz, Spain has the least peak period congestion in this population category, followed by four US cities, Syracuse, Greensboro, Akron and Winston-Salem.

    The greatest average peak period congestion in the below 800,000 population category was in Belfast, followed by Dublin, Lodz, Wellington (NZ) and Edinburgh.


    Traffic Congestion by Country and Geography

    Among the nations, the US has the overall least traffic congestion, with a delay rate of 19.3 percent in all day congestion, followed by the Netherlands and Spain. The US leads in two population categories, 800,000 to 5,000,000 and under 800,000. Spain has the least over 5,000,000 congestion, where Madrid exhibits the impacts of its strong motorway system.

    East Asian cities have the greatest all-day traffic congestion, at 41.1 percent, though among the largest cities Latin America has have most congestion.

    In average peak period congestion, Spain shows the best results, with a delay rate of 29.0 percent, followed by the United States and the Middle-East. Spain leads in the over 5,000,000 category, Turkey in the 800,000 to 5,000,000 category and the United States in the under 800,000 category.

    East Asian cities also have the greatest average peak period congestion, at  67.3 percent. Among the largest cities, congestion is greatest in the Eastern European cities outside Poland and Turkey (Table).

    The Importance of Traffic Indexes

    Cities are more productive if they facilitate greater access throughout their urbanization, especially for work trips, as Remy Prud’homme and Chang-Woon Lee at the University of Paris and David Hartgen and M. Gregory Fields of the University of North Carolina, Charlotte have shown. Traffic indexes provide important metrics to aid city officials in “keeping the traffic moving,” which is essential in the modern metropolitan area. Significantly, worldwide traffic indexes are covering more cities. This year’s Tom Tom Traffic Index added important cities like Jakarta, Hong Kong, Buenos Aires, Santiago de Chile, and Kuala Lumpur, bringing the total to 390. Today’s policy makers have far more information on which to evaluate transport investments than ever before.

    Table
    Summary of Traffic Congestion by Geography
    ALL DAY CONGESTION AVERAGE AM-PM CONGESTION  
    Country/Geography Over 5 Million 800,000-5 Million Under 800,000 All Over 5 Million 800,000-5 Million Under 800,000 All Count by Population Category
    ASIA                  
    China 39.7% 36.3%   38.5% 67.2% 66.6%   67.0% 15, 8, 0
    East Asia: Other 43.0% 38.8%   41.1% 75.5% 57.1%   67.3% 5, 4, 0
    Middle-East\   26.2%   26.2%   35.6%   35.6% 0, 5, 0
    EUROPE                  
    France 38.0% 30.3% 23.5% 24.9% 67.0% 57.0% 42.0% 44.8% 1, 3, 21
    Germany   28.3% 24.5% 25.6%   47.6% 39.9% 42.0% 0, 7, 18
    Italy 30.0% 32.7% 23.8% 25.1% 57.5% 56.5% 37.7% 40.8% 1, 3, 21
    Netherlands     19.5% 19.5%     37.2% 37.2% 0, 0, 16
    Spain 25.0% 27.0% 20.3% 21.0% 45.5% 41.5% 27.1% 29.0% 1, 2, 22
    United Kingdom 40.0% 30.2% 29.7% 30.2% 66.0% 55.7% 55.8% 56.2% 1, 6, 18
    Western Europe: Other   29.3% 24.2% 25.1%   52.8% 42.1% 44.1% 0, 9, 38
    Poland   27.0% 32.7% 31.8%   48.3% 53.0% 52.2% 0, 2, 10
    Turkey 49.0% 26.0%   28.3% 77.0% 34.0%   38.3% 1, 9, 0
    Eastern Europe: Other 42.5% 31.6% 21.1% 27.9% 80.0% 61.1% 43.9% 55.3% 2, 7, 8
    NORTH AMERICA                  
    Canada 30.0% 27.2% 21.3% 24.5% 56.0% 46.8% 38.1% 43.2% 1, 5, 6
    United States 28.6% 18.5% 15.0% 19.3% 52.7% 34.6% 24.2% 35.5% 9, 62, 9
    AUSTRALASIA                  
    Australia     24.2% 27.5%   50.7% 38.5% 44.6% 0, 5, 5
    New Zealand   38.0% 28.2% 29.8%   74.5% 47.9% 52.3% 0, 1, 5
    OTHER                  
    Latin America 44.6% 29.1%   35.6% 72.9% 51.1%   60.2% 5, 7, 0
    South Africa 30.0% 35.0% 23.8% 26.7% 61.0% 71.0% 44.9% 51.9% 1, 1, 4

    Wendell Cox is principal of Demographia, an international public policy and demographics firm. He is a Senior Fellow of the Center for Opportunity Urbanism (US), Senior Fellow for Housing Affordability and Municipal Policy for the Frontier Centre for Public Policy (Canada), and a member of the Board of Advisors of the Center for Demographics and Policy at Chapman University (California). He is co-author of the “Demographia International Housing Affordability Survey” and author of “Demographia World Urban Areas” and “War on the Dream: How Anti-Sprawl Policy Threatens the Quality of Life.” He was appointed to three terms on the Los Angeles County Transportation Commission, where he served with the leading city and county leadership as the only non-elected member. He served as a visiting professor at the Conservatoire National des Arts et Metiers, a national university in Paris.

    Photo: A Bangkok freeway, by author

  • Transportation Game-changers

    Here is the L.A. Times noting that LA Metro ridership is still falling — even though billions have been (mis)spent on extra capacity over the last 30+ years. By my count that’s the second time this year that the Times has broached this tender topic. As a member in good standing of the LA “good government” (googoo) establishment, the paper had for many years chosen to tip-toe around the bad news.

    Readers may know that some of us began flogging the dead horse in the mid-1970s. Go to the attached proceedings and read the contribution by the late UCLA Prof. George Hilton. He was among the first to write sensibly and clearly that LA is not NY — and trying to make it so would be a phenomenal waste. But even LA Times coverage will be for naught. Billions more will be spent. Pouring good money after bad is what the great and the good in city hall do for a living.

    We are in the the early years Uber/Lyft and all manner of ICT information sharing.  These are the game-changers. For the past two months, my wife and I have graduated from a two-car household to a one-car-plus-Uber-plus-walkable-neighborhood HH. The game-changers are here. Conventional transit was never a game-changer.

  • The Economic Implications of Housing Supply

    A new paper with the above title by urban economists Edward Glaeser and Joseph Gyourko provides more evidence to back up the Antiplanner’s recent paper on the New Feudalism. One of the major points of that paper was that the Obama administration’s plan to force suburbs to relax zoning codes to allow higher density housing is not the solution to housing affordability problems.

    Glaeser and Gyourko point out that housing is affordable in most of the country despite zoning. In some parts of the country, however, “property rights have essentially been reassigned from existing land owners to wider communities, which have chosen to substantially reduce the amount of new building.” The result is that the supply curve for housing, which is nearly horizontal (meaning changes in demand have little effect on prices) in communities with traditional zoning, becomes very steep in the overly regulated communities (meaning small changes in demand can result in large changes in prices, i.e., prices will be more volatile).

    Glaser & Gyourko make one interesting point that I had not raised. One of the impediments to housing production in California is a state environmental quality act that requires developers to assess the local environmental impacts of new housing. The result is that little new housing has been built in California, forcing people to move to places like Arizona and Texas. But California’s temperate climate means that greenhouse gas emissions there are far lower than in interior states. “If California’s restrictions induce more building in Texas and Arizona, which require far more artificial cooling,” says the paper, “then their net environmental [effects] could be negative in aggregate.”

    The New York Times reported on the paper, but I think the writer misstates one of the main points. Instead of viewing homes as an investment, suggested the reporter, Americans should view them as consumer goods and accept that prices will fall. Americans need to “open our eyes to the negatives of the national obsession of owning a home, expecting its value to rise, and using the levers of local government to keep neighborhoods as they are,” says the Times.

    Yet homeownership isn’t an “obsession”; it is a natural, worldwide desire to have a predictable, stable home life. Nor does “using the levers of local government to keep neighborhoods as they are” make housing unaffordable: instead, it is using the levers of state or regional government to keep rural areas as they are. While the Antiplanner prefers the Houston model of deed restrictions over zoning, city zoning really isn’t a major problem for affordability so long as there is plenty of unzoned land outside the cities.

    In such areas, people don’t buy homes expecting to get rich from rising prices. But they do see the equity they build in their homes as a store of wealth that they can borrow against to start small businesses, put their children through college, or retire on.

    The one thing missing from the Glaeser/Gyourko paper and the Times article is a way out of the housing affordability mess. Glaeser/Gyourko suggest a federal program of building large numbers of homes in unaffordable areas, but considering the kind of homes federal bureaucrats are likely to build, this is likely to do more harm than good. The Times falls back on the Obama solution of building higher densities, but that’s not how most Americans want to live, and it seems silly to demand higher densities in states like California and Oregon that are at least 95 percent rural. The best solution to the conundrum, the Antiplanner has suggested, is through the courts, not legislation.

    Randal O’Toole is a senior fellow with the Cato Institute specializing in land use and transportation policy. He has written several books demonstrating the futility of government planning. Prior to working for Cato, he taught environmental economics at Yale, UC Berkeley, and Utah State University.

  • The Midwest, Redefined

    What if the region we broadly understand as the Midwest, stretching from the foothills of the Alleghenies to the high plains, and from the chilly northern Great Lakes to the Ohio, Mississippi and Missouri river valleys, had been allowed to develop as organically as its eastern and southern — and even western — neighbors?  

    If it had, it would be far better understood, have a much stronger cultural clarity, and more recognized for its contributions to American society and economy.

    Here’s what I mean.  The north central region of the U.S. has been an American paradox since its founding.  Unlike other regions of the country, where a critical mass of settlers established a colony or territory and then pursued legitimacy, the core of the region had its territorial boundaries established long before settlers had a chance to make a major imprint on the land.  That set off a race for control of the region by two already established regions, New England and Appalachia, with vastly different motivations — and cultural mores.  Because they came from different places, they took different paths to the Midwest.  New Englanders came via the Erie Canal and Great Lakes, while Appalachians traveled northward across the Ohio River.  Rather than intermingle and create a new and blended society, the New Englanders and Appalachians tended to maintain their local strongholds, with New Englanders in larger Great Lakes cities, and Appalachians in the upper regions of the Ohio Valley.  And this happened without any reconsideration or adjustment of political boundaries in the Midwest’s early days. 

    This has hampered our understanding of the Midwest ever since.

    Here’s a thought experiment.  Let’s say that instead of New York expanding to the shores of Lake Ontario and Lake Erie because it wanted to control development of the Erie Canal, western New Yorkers fought to establish their own state.  Similarly, let’s say that early settlers of western Pennsylvania recognized their remoteness from Harrisburg and Philadelphia, and decided local control suited them, too.  And let’s further suggest that, instead of becoming part of Ohio, the Connecticut Western Reserve was also allowed to develop as a separate state as well. 

    Ultimately, it’s conceivable that a new map of the Midwest, one that matches more closely to actual American settlement patterns, might look something like this:

    In my mind, as many as six new states could have emerged.  Western New York could’ve become Niagara, with Buffalo and Rochester as its key metropolises.  Western Pennsylvania could’ve become Allegheny, centered on Pittsburgh and Erie.  The Connecticut Western Reserve could’ve become Erie (or Cuyahoga?), greater Chicago could’ve been recognized as its own state, and the upper parts of Michigan, Wisconsin and Minnesota could’ve become Superior.  The southern part of Missouri could’ve become Ozark.

    The benefit of this is that the political environment aligns with the settlement patterns and modern-day networks of the region.  I’ve made similar points before about the cultural geography of the Midwest.  I think that because two different cultural groups inhabited the same space without ever effectively coming together, they’ve never maximized the development potential within either.  Yes, the Midwest was the nation’s manufacturing center for much of the 20th century, but it could be argued that it often did so in spite of rural and agricultural interests that were strong in state capitals like Columbus, Indianapolis and Springfield.  When manufacturing faded, those same interests often promoted the development of cities within their regions that were less tainted by a manufacturing legacy.

    Two years ago, I noted that, irrespective of state boundaries, the Midwest was somewhat aligned like this:

    And yet, the tension that was evident two centuries ago continues today.  For my “Five Midwests’ series, I quoted a passage from James McPherson’s book about the Civil War entitled Battle Cry of Freedom, in which he noted the economic, social and cultural differences between the Hoosiers, Buckeyes and Butternuts of the Ohio Valley, and the Yankees of the Great Lakes.  Today, geographers can track and map broad travel and commuting patterns that illustrate how we’re connected as a nation, and find those patterns still exist:

    “Danville, in central Illinois, is more closely connected to Des Moines, which is hundreds of miles away in Iowa, than it is to Chicago, which is much closer and in the same state.

    That’s not necessarily because there are tons of Danville commuters trekking to Des Moines. Rather, Nelson and Rae’s methodology shows they are both more tightly linked to the necklace of cities in between them—Urbana, Bloomington, Peoria, etc.—than they are to the cities that fall outside the entire zone.”

    Welcome to the characteristic that keeps the Midwest from being well understood as a region.

    Pete Saunders is a Detroit native who has worked as a public and private sector urban planner in the Chicago area for more than twenty years.  He is also the author of “The Corner Side Yard,” an urban planning blog that focuses on the redevelopment and revitalization of Rust Belt cities.

  • Neo-Stalinists Versus the Sons of Anarchy

    In one of the great scenes from the movie “Dr. Zhivago,” based on the novel by Soviet author Boris Pasternak, a young Bolshevik commander explains to the idealistic physician that “the private life is done in Russia. History has killed it.”

    In America today, it also seems increasingly impossible to separate personal life from the political. In awards shows, sports broadcasts and fashion runways — which once provided escapes from politics — we find endless passionate anti-Trump protests and denunciations. Even corporations, like Under Armour, have faced opprobrium — and even boycotts — for daring to support Trump. Nordstrom faced a possible boycott for carrying a now-canceled fashion line of his daughter, Ivanka.

    In contrast, the GOP, once a smooth-running machine, has become something akin to the motorcycle gang from the TV series “Sons of Anarchy.” Led by a screwball president, its partisans often at odds with each other, they have so far demonstrated some stupefying incompetence, not to mention a lack of policy coherence. If enforced and overwrought unanimity is the disease of today’s Democrats, chaos threatens to be the new GOP curse.

    The new cadre party

    Joseph Stalin, the dominant figure of the Soviet era, understood keenly the role of culture in politics. He once called writers “the engineers of the soul.” He would find some kindred spirits in today’s progressive cultural warriors who dominate the arts. Most of the media, outside of the Murdoch empire, have been, in the words of the Baltimore Sun’s David Zurawik, “flipping out,” losing any tie to the tradition of impartiality. Attempts to silence pro-Trump, or simply too obstreperously right-wing, supporters are also gaining currency on the progressive-controlled social media.

    Conservatives are regularly harassed and prevented from speaking on college campuses. Celebrities and law professors have even praised the idea of a coup, although it’s pretty clear who would have the guns on their side. But what they lack in firepower they have made up for with impressive organization. There has been little “spontaneous” about some of the various demonstrations that, as the Daily Beast recently reported, are produced by well-organized, and well-funded, cadres.

    The dominant groupthink of our cultural and intellectual classes increasingly runs through the bloodstream of the Democratic Party. Once a broad coalition of regional, economic and ethnic interests, the Democrats, as Will Rogers once quipped, were not an “organized party,” but rather a motley assemblage of interests.

    Enforced by the notion of “intersectionality,” activists are compelled to embrace every permutation of the politically correct ideology. Increasingly, no self-respecting Democrat can dissent on issues ranging from climate change policy to “Black Lives Matter,” an “open borders” immigration policy, transgender rights or income redistribution. The threat to the last remaining moderate Democrats, such as West Virginia Sen. Joe Manchin, seems to be of little concern; orthodoxy, if you will, trumps efficacy.

    Read the entire piece at The Orange County Register.

    Joel Kotkin is executive editor of NewGeography.com. He is the Roger Hobbs Distinguished Fellow in Urban Studies at Chapman University and executive director of the Houston-based Center for Opportunity Urbanism. His newest book, The Human City: Urbanism for the rest of us, was published in April by Agate. He is also author of The New Class ConflictThe City: A Global History, and The Next Hundred Million: America in 2050. He lives in Orange County, CA.

    Photo: James Willamor, Creative Commons

  • The Screwed Generation Turns Socialist

    Increasingly American politics are driven by generational change. The election of Donald Trump was not just a triumph of whiter, heartland America. It also confirmed the still considerable voting power of the older generation. Yet over time, as those of us who have lived long enough well know, generations decline, and die off, and new ones ascend.

    In this past election, those over 45 strongly favored Trump, while those younger than that cast their ballots for Clinton. Trump’s improbable victory, and the more significant GOP sweep across the country, demonstrated that the much-ballyhooed millennials simply are not yet sufficiently numerous or united enough to overcome the votes of the older generations.

    Yet over time, the millennials—arguably the most progressive generation since the ’30s—could drive our politics not only leftward, but towards an increasingly socialist reality, overturning many of the very things that long have defined American life. This could presage a war of generations over everything from social mores to economics and could well define our politics for the next decade. 

    To best understand the battle lines, you must know the generations and their differences, and where they will leave this increasingly fractured republic.

    The Greatest Generation

    The last “civic generation” before the advent of the millennials—a term coined by generational theorists Neil Howe and William Strauss—was forged in the Depression, fought the Second World War, and managed the ensuing cold conflict with the old USSR. Born between 1901 and 1927, members of the much admired ++“greatest generation” were civic minded, embracing the idea that government provided an ideal mechanism to address the nation’s problems.

    Like the millennials, who also follow this civic impulse, this generation was decisively Democratic. They are also, sadly, dying out, with the last remnants now in their 80s and 90s. According to generational analysts Morley Winograd and Michael Hais, this group was the only generation, besides the then small cadre of voting age millennials, to support John Kerry in 2004.  

    Under two million in 2010, per the Census, their numbers have dwindled to 750,000. Yet even so, as recently as 2014 , the remnants of the “greatest generation,” according to Pew, still favored the Democrats by 7 percentage points. Even fewer will be around in 2020 but those who remain may well remain liberal. It’s no sample, but my 93-year-old mother holds to pattern. Brought up poor in the Brownsville section of Brooklyn, she voted for the oldest and most left leaning major candidate—Bernie Sanders—in the primary and then cast her ballot for Hillary.

    The Silent Generation Slow to fade

    The “silent generation,” born between 1925 and 1942, mostly came of age in the conservative ’50s. These products of the Eisenhower era have been the prime beneficiaries of the sustained boom that took root between the end of the Second World War and the ’70s. As a result, they continue to hold a big share of America’s wealth—roughly 33 percent –even as they enter their seventies and eighties.

    Given their embrace of the normative social values of their era, and their wealth, it’s not surprising that the silents have tended to the right. These older voters went for Trump by a significant margin, and overall, note Winograd and Hais, 53 percent lean to the Republicans, compared to just 40 percent who lean Democratic.

    It would be a mistake to dismiss the silents before their time, as Democratic theorists sometimes seem to do. They still number upward of 29 million, and more than forty members of Congress hail from this generation, including, ironically, much of the  Democratic leadership. Given their extended longevity, particularly among those in the upper middle class, they may remain influential well into the next decade.

    Boomers: For Now, the Power Generation

    The largest generation in American history before the millennials, the Baby Boomers were born between 1943 and 1960 and they remain the power generation. After all, both presidential candidates last year were clearly Boomers, with sufficient evidence of the narcissism that defines this generation. They also predominate in Congress, with 270 members, roughly half the total, in 2016. Hais estimates that they number between 75 and 82 million strong. 

    Ever since the turbulence of the ’60s, the Boomers have been sharply divided. Peace protests, psychedelics, and Woodstock defined only a part of that generation. Indeed, rather than tending to the left, the Boomers over time have slowly moved to the right. In 1992, note Winograd and Hais, they leaned 49 to 42 percent Democratic; last year, they leaned 49 to 45 Republican. Overall, Boomers supported Donald Trump by a narrow margin.

    In the future, economics more than culture may define Boomer politics. Somewhat more socially liberal than the silent generation before them, they control a dominant share of the nation’s wealth—some 50 percent—and according to a recent Deloitte study will still control about 45 percent well into their seventies and eighties. This may make them naturally suspicious of the redistributionist agenda of the left Democrats, since this would naturally come from their wealth. They will also have to resist attempts by GOP reformers like Paul Ryan to meddle with Medicare, social security, and, for some, pensions. One reason Trump won over these voters—both in the primary and the general election—was by promising not to touch these holy of holies.

    Xers: Long-time outsiders but soon the next power generation

    Smaller than the boomers, and generally less privileged, the X generation—born between 1965 and 1981—gets short shrift among advertisers as well in the media, but seem poised to take power by the end of the decade. Numbering more than 65 million, they are a smaller generation than the boomers but they are slowly gaining control of politics, with 117 members in Congress compared to just five for millennials. They already dominate the leadership of the GOP. Paul Ryan is their poster boy.

    Today, the Xers, many already in their fifties, have only 14 percent of the nation’s wealth, a relative pittance compared to the boomers. But by 2030, as the boomers finally start to fade from the picture, Xers should account for 31 percent of the nation’s wealth, twice the percentage for the millennials. Critically, the heads of most companies backed by venture capital come from this generation, according to the Harvard Business Review. Raised largely during the neo-conservative heyday of Reagan, George H.W. Bush, and Bill Clinton, Xers also dominate the ranks of managers at major companies.

    Yet at the same time, they have faced a rockier economic ride than the boomers, suffering particularly in the 2007 housing crash. The percentage of Xers who own their own homes dropped far more precipitously compared to the more entrenched Boomers The impact was particularly tough on younger Xers, who often got into the market around the housing bust.

    Millennials: The Red Generation?

    The long-term hopes of the American left lie with the millennial generation. The roughly 90 million Americans born between 1984 and 2004 seem susceptible to the quasi socialist ideology of the post-Obama Democratic Party. They are also far more liberal on key social issues—gender and gay rights, immigration, marijuana legalization—than any previous generation. They comprise the most diverse adult generation in American history: some 40 percent of millennials come from minority groups, compared to some 30 percent for boomers and less than 20 percent for the silent and the greatest generations.

    Millennials’ defining political trait is their embrace of activist government. Some 54 percent of millennials, notes Pew, favor a larger government, compared to only 39 percent of older generations. One reason: Millennials face the worst economic circumstances of any generation since the Depression, including daunting challenges to home ownership. More than other generations, they have less reason to be enamored with capitalism.

    These economic realities, along with the progressive social views, has affected their voting behavior. Millennials have voted decisively Democratic since they started going to the polls, with 60 percent leaning that direction in 2012 and 55 percent last year. They helped push President Obama over the top, and Hillary Clinton got the bulk of their votes last year. But their clear favorite last year was self-described socialist Bernie Sanders, who drew more far millennial votes in the primaries than Clinton and Trump combined.

    The West is red, too? Maybe, maybe not.

    Roughly half of Millennials  have positive feelings about socialism, twice the rate of the previous generation. Indeed, despite talk about a dictatorial Trump and his deplorables, the Democratic-leaning Millennials are more likely to embrace limits on free speech and are far less committed to constitutional democracy than their elders. Some 40 percent, notes Pew, favor limiting speech deemed offensive to minorities, well above the 27 percent among the Xers, 24 among the boomers, and only 12 percent among silents. They are also far more likely to be dismissive about basic constitutional civil rights, and are even more accepting of a military coup than previous generations.

    Millennials clearly have not been well-schooled by the founders’ vision. This could augur a grim prospect, a kind of voluntary 1984 with cellphones and social media. Potential economic conflicts between millennials and boomers and Xers for scarce resources could accelerate support for a federally mandated agenda of redistribution. After all, if they have little money, own even less and have modest prospects for achieving what their parents did, why not socialism, constitutional norms be damned?

    Yet this future is not guaranteed. Already white Millennials, still 60 percent of the total youth electorate (less than the 73 Anglo share among older voters but still a large bloc), show signs of moving to the right, particularly outside the coasts. Overall, they backed Trump by 48 to 43 percent and, notes one recent Tufts University survey, they were more enthusiastic about their candidate than were the Clinton backers.

    Other factors could slow the lurch to the left. There is a growing interest in third party politics, not so much Green but libertarian; 8 percent of Millennials voted for Third Party candidates, twice the overall rate. Overall, Tufts finds that moderates slightly outpace liberals, although conservatives remain well behind. Millennials, note Winograd and Hais, also dislike “top down” solutions and may favor radical action primarily at the local level and more akin to Scandinavia than Stalinism. 

    As Millennials grow up, start families, look to buy houses, and, worst of all, start paying taxes, they may shift to the center, much as the Boomers did before them. Redistribution, notes a recent Reason survey, becomes less attractive as incomes grow to $60,000 annually and beyond. This process could push them somewhat right-ward, particularly as they move from the leftist hothouses of the urban core to the more contestable suburbs.

    Yet even given these factors, Republicans have their work cut out for them as the generational wheel turns. Certainly, to be remotely competitive, they must abandon socially conservative ideas that offend most Millennials. The GOP’s best chance lies with making capitalism work for this group, sustaining upward mobility and expanding property ownership. If we see the creation of a vast generation of property serfs with little opportunity for advancement, America’s future is almost certain to be redder, a lot less   market-oriented, and perhaps a lot more authoritarian than previous generations have ever contemplated.

    This piece first appeared in The Daily Beast.

    Joel Kotkin is executive editor of NewGeography.com. He is the Roger Hobbs Distinguished Fellow in Urban Studies at Chapman University and executive director of the Houston-based Center for Opportunity Urbanism. His newest book The Human City: Urbanism for the rest of us, was published in April by Agate. He is also author of The New Class ConflictThe City: A Global History, and The Next Hundred Million: America in 2050. He lives in Orange County, CA.

    Unemployed photo by BigStockPhoto.com.

  • Vancouverizing Seattle?

    A recent Wall Street Journal article (“For Chinese buyers, Seattle is the new Vancouver”) reported that Seattle was replacing Vancouver as the most popular destination for Chinese buyers in North America. For years, there has been considerable concern about foreign investment in the Vancouver housing market, especially Chinese investment. This   demand is widely believed to have driven Vancouver house prices “through the roof.” In response, the British Columbia government recently imposed a 15 percent foreign buyers tax that has had the impact of significantly reducing new foreign investment in Vancouver’s housing market.

    Yet the impact of the tax has still been muted. Houses remain just about as unaffordable as before. The Real Estate Board of Greater Vancouver benchmark price has dropped less than four percent from six months ago, before the foreign buyers tax was imposed. This compares to an 80 percent increase over the last 10 years and 47 percent increase over just the last three years (Figure).

    Clearly there is something other than Chinese investment driving up Vancouver house prices. Since 2004, Vancouver’s median multiple (median house price divided by median household income) has risen from 5.3 to 11.8. This means that that the median house has increased in price more than six times the annual median household income.

    The primary cause of Vancouver’s difficulties is a rigged housing market. For decades, Vancouver has had some of the strongest urban containment policy in the world. Regional land-use authorities have prohibited  housing development from being built on a large agricultural reserve. This land is hardly needed for such use in a nation that has increased its gross agricultural output more than 150 percent since 1961, while reducing its land in farms by three times as many acres as is occupied by all urban settlements combined, according to the 2016 Canadian census. Of course, urban containment restrictions on new housing have driven up house prices, just as Middle East oil supply reductions used to drive up gasoline prices, before the recent supply increases from Canadian and US oil production.

    Vancouver has literally become the third most unaffordable city (metropolitan area) in the nine nations covered by the Demographia International Housing Affordability Survey. This makes a mockery of the Vancouver’s frequent citation as one of the most livable cities in the world. The first principle of livability is affordability — you cannot live where you cannot afford. Most young families of normal economic means cannot hope to ever buy a modest detached house with a yard as their parents or grandparents did decades ago in the Vancouver area. Only Hong Kong and Sydney are less affordable.

    In a recent column (“Not much can or will be done to make Vancouver housing more affordable”) by Gordon Clark in The Province (Vancouver newspaper) describes how things have changed, in a story similar to what you will hear in Sydney, San Francisco and others of the world’s most unaffordable cities. In 1941, his postal supervisor grandfather purchased a house on Oak Street (a main central arterial leading toward downtown) for 1.5 years of income. In 1979 his teacher mother purchased a house in the city of Vancouver for 2.5 times her income. Now with houses costing nearly 12 times incomes, Clark regretfully concludes that nothing can be done: “because the solutions are unacceptable to most people.”

    This illustrates what is perhaps the most powerful characteristic of urban containment regulation — that it creates a strong lobby of support among those who have seen their house values irrationally escalate as a result of unwise government policy. In this environment, public officials simply wring their hands, decry the problem and implement nothing of substance to change the essentially flawed policies. 

    With this rigged market, it should not be surprising that people with money from outside Vancouver, and abroad, would seek to buy houses in Vancouver. After all, the policies all but guaranteed strong returns to anyone with enough capital to enter the market.   It is as if a “Speculators Welcome” banner has been hung from Lion’s Gate Bridge. Not so welcome are those middle-income households being driven out of the market

    Lessons for Seattle

    All of this is a cautionary tale for the Seattle metropolitan area, which also has urban containment policy, but of more recent vintage. Just 140 miles or 225 kilometers south of Vancouver, Seattle’s has housing affordability that already as bad as Vancouver’s  only 12 years ago.

    Seattle has a severely unaffordable median multiple of 5.5, slightly worse than Vancouver’s 5.3 in 2004. In the late 1980s, before Seattle imposed its metropolitan- urban containment policy, the median multiple was as low as 2.4 (Table). Today, a Seattle household with the median income must pay three additional years of income for the median priced house.

    Rising housing demand with severely constricted supply is associated with higher house prices compared to incomes. In this regard, Seattle has multiple risks, from households escaping California to escape from the even higher prices, Seattle is a bargain compared to the “dogs breakfast” of unaffordable housing associated with California where median multiples now exceed 8.0 in all of the major coastal metropolitan areas (Los Angeles, San Francisco, San Diego and San Jose). Prices are so high in California that a seller can buy a comparable house in Seattle for hundreds of thousands less. There may not be as much sun in Seattle, but there’s plenty of money left over for umbrellas and other goods and services.

    Now the pressure is likely to increase as foreign investors who shop the world for rigged housing markets promise quick profits now turn their attention to the Puget Sound. In this environment, it would not be surprising for additional serious house price escalation to be in the offing, and Seattle to indeed become the new Vancouver in the next decade or two.

    Given these forces, we can expect Seattle housing prices   will continue to increase disproportionately to incomes unless there is land use policy reform. Sufficient supply must be allowed on greenfield land to keep house prices from rising farther. And “building to the sky”— which is very expensive and not very family friendly —  is not likely to restore housing affordability in Seattle any more than it has anywhere else. For example, the Manhattanization of central Toronto, with its many new residential towers, has not prevented its median multiple from doubling from 3.9 to 7.7 in the last 12 years. Nor has it prevented a far less obvious (at least to the press) 80 percent share of population growth to be in the suburbs between 2011 and 2016.

    Lost in all of this are ordinary middle and working class people, who routinely take a back seat in public policy to planning obsessions over urban form, and a “sense of place.” Middle-income households are far more in need of a “decent place” to live at a reasonable price. Architectural marvels or sleek streetscapes are no substitute. The issue is not ideological, it is rather practical and human. Nor is it about property rights, or free markets. The issue is that people are being denied the housing they desire by urban containment policy and its distorted priorities. As Paul Cheshire, Max Nathan and Henry G. Overman of the London School of Economics have pointed out, “people rather than places” should be the focus of urban policy.

    It is ironic that progressive metropolitan areas, like Vancouver, where inclusionary zoning drip feeds housing to lower income households, have become, large exclusionary zones where average income households cannot afford houses. Seattle is headed down the same path.  Soon it may be time to hang a “Speculators Welcome” banner from the Space Needle.

    Photograph: Downtown Seattle (by author)            

    Wendell Cox is principal of Demographia, an international public policy and demographics firm. He is a Senior Fellow of the Center for Opportunity Urbanism (US), Senior Fellow for Housing Affordability and Municipal Policy for the Frontier Centre for Public Policy (Canada), and a member of the Board of Advisors of the Center for Demographics and Policy at Chapman University (California). He is co-author of the "Demographia International Housing Affordability Survey" and author of "Demographia World Urban Areas" and "War on the Dream: How Anti-Sprawl Policy Threatens the Quality of Life." He was appointed to three terms on the Los Angeles County Transportation Commission, where he served with the leading city and county leadership as the only non-elected member. He served as a visiting professor at the Conservatoire National des Arts et Metiers, a national university in Paris.

  • TruMpISSION: Impossible – Border Wall

    While running for office, President Trump said the border wall would cost about $8 billion, a figure widely recognized as an unreasonably low estimate”. This week, the Department of Homeland Security (DHS) estimated the cost of construction at $21.6 billion. Figuring out what the wall would cost has been a source of debate for longer than the last election cycle. In 2013, the bipartisan “Gang of Eight” senators set aside $1.5 billion for a plan to add 700 miles of wall – also a completely unrealistic budget.

    In this edition of TruMpISSION: Impossible we examine the numbers behind building a wall along the U.S.- Mexico border. There are five main reasons why this mission is impossible.

    1. It will be hideously expensive. The un-walled portion of the border covers the most difficult terrain, a lot of which could cost $17 million per mile. Historically, building on flat land cost about $4 million per mile. The government spent $2.4 billion between 2006 and 2009 to build a stretch of wall along 670 miles of easy terrain (Secure Fence Act of 2006). A 2009 attempt to build along one rugged stretch of the border was budgeted at $58 million for just 3.5 miles.

    Since most of the easier stuff is already built, I calculated that the cost for the next 1.289 miles could easily run $19.3 billion – I think the new DHS estimate is close to the mark. To put the number into perspective, the cost will be about seven times the entire 2016 budget of the U.S. Border Portal. Construction isn’t the only expense. Section 10 of the Executive Order basically “deputizes” local law enforcement – at the expense of local taxpayers – to act as immigration officers for carrying out deportations.

    2. More than 1,000 of the open border is under water. Building a wall in the water would be wildly expensive and would have to be replaced frequently. In February 2012, construction began to extend began to extend an 18-foot high border fence 300 feet into the Pacific Ocean to seal off the gap that opened at the beach between Tijuana and San Diego during low tide. The private contractor who built it (Granite Construction Company, NYSE:GVA) gave the government a 30-year warranty. The budget for that Surf Fence Project was $4.3 million (I did not find the final cost in any public source). Based on that budget, the cost of building the wall in water could run $75.9 million per mile or about 4.5 times the cost of building on rugged land and nearly 20 times the cost of building the parts on more level ground. Building a fence on the water part of the border would cost close to $9 billion alone.

    3. Maybe Trump does not really mean to build on the border that lies underwater. The Executive Order defines the “Southern border” as only the “land border”. To avoid the extra expense of building in the ocean, the gulf, and two rivers, we can build on the land outside the flood-plain/tidal-zone. It is likely the Mexican president Enrique Peña Nieto has heard of the “adverse possession”. Along the border, state laws transfer rights to abandoned property to the possessor in 5 to 10 years. Building just one half mile from the rivers means the United States could relinquish at least 657 square miles to Mexico. Are we prepared to cede to Mexico an area 1.5 times the size of Los Angeles?

    Fox News has noted that “[w]hile 1,254 miles of [the] borders is in Texas, the state has only 100 miles of wall”. At least 65 miles of the 100 mile route proposed through Texas in 2008 sat a half mile from the border. In some places, like the McAllen area of Texas, the proposed track separated a water reservoir from the pumping stations that bring water to US citizens. Building up to a mile into the US side has already stranded the property of US citizens on the Mexico side of the wall.

    4. The border land that is not under water or already fenced is mostly in private hands. In a January 2016 story Fox News recognized that finishing the wall along the border in Texas could require hundreds of lawsuits by the federal government. The Washington Post also reported going into the 2009 expansion of the wall that much of the planned route would slice through private property. Private property adds an average of $61,491 per mile (based on actual costs in 2012). During the 2009 expansion, 135 private landowners refused to let surveyors onto their property. Seventy percent of the landowners who held out were in Texas. Anybody remember Jade Helm 15 when part of Texas was labeled “hostile territory” during military exercises? The Governor ordered the Texas State Guard to monitor the exercises. What do you think will happen if bulldozers show up uninvited to begin claiming 1,000 miles of Texan’s private property? The federal government can use eminent domain, but it is costly, takes a long time and holds an uncertain outcome.

    5. There may not be enough brick and mortar to build a wall along the US/Mexico border, especially if Trump keeps talking it up. During the 2009 expansion of the wall, cost estimates ballooned as a Border States construction boom led to labor shortages and rising costs for construction materials (e.g., steel and cement). Try building more than 1,000 miles of border wall while re-building transportation infrastructure, the strain will be beyond the global peak in prices seen when shovel-ready projects were initiated under post-financial-crisis stimulus spending.

    The Executive Order gave DHS 180 days (until about the second anniversary of Jade 15) to come up with a plan. DHS also has to figure out how to return deportable aliens “to the territory from which they came” – imagine millions of aliens lined up along the US/Mexico border. DHS has less time (until March 26) to figure out how to pay for the wall by withholding “all bilateral and multilateral development aid, economic assistance, humanitarian aid, and military aid” that the US may be planning to send to Mexico. That sounds like it could actually work to balance the budget outlay. Except that it won’t actually work. Total U.S. foreign aid to Mexico disbursed from all agencies in 2015 was $338.5 million (that’s “million” with an “m”). At that rate, it will take 54 years to recover the cost!

    Aid to Mexico includes $215 million for international drug and law enforcement plus $50 million more for in-country drug enforcement. The other hundred million or so was for justice projects, legal reform, crime prevention and military support. According to former Secretary of Homeland Security Jeh Johnson, “…experience teaches that border security alone cannot overcome the powerful push factors of poverty and violence that exist in Central America. Ultimately, the solution is long-term investment in Central America to address the underlying push factors in the region.”

    [After I calculate the costs for several more truMpISSIONs, I will calculate the cost of financing with debt. Just because something is impossible, doesn’t mean Trump won’t spend your money on it.]

    Susanne Trimbath, Ph.D. is CEO and Chief Economist of STP Advisory Services. Dr. Trimbath’s credits include appearances on national television and radio programs and the Emmy® Award nominated Bloomberg report Phantom Shares. She appears in four documentaries on the financial crisis, including Stock Shock: the Rise of Sirius XM and Collapse of Wall Street Ethics and the newly released Wall Street Conspiracy. Her newest book, Lessons Not Learned: 10 Steps to Stable Financial Markets, was published in November by Spiramus Press (UK). Dr. Trimbath teaches graduate and undergraduate finance and economics.

    Photo: ourfunnyfarm, CC License