Blog

  • World High-Speed Cost Increase Record

    California’s high-speed rail project is setting speed records, not on tracks, but rather in cost escalation. Last week, the California High Speed Rail Authority (CHSRA) announced that the Bakersfield to Merced section, part of which will comprise the first part of the system to be built, will cost between $10.0 and $13.9 billion. This is an increase of approximately 40 percent to 100 percent over the previous estimate of $7.1 billion, an estimate itself less than two years old.

    This "flatter than Kansas" section should be the least expensive part of the system. It can only be imagined how much costs might rise where construction is more challenging, such as tunneling through the Tehachapi Mountains and for the route across the environmentally sensitive Pacheco Pass that leads to the Silicon Valley. CHSRA officials admit that the present $43 billion cost estimate to complete the Los Angeles (Anaheim) to San Francisco first phase will rise substantially. This estimate was also less than two years old.

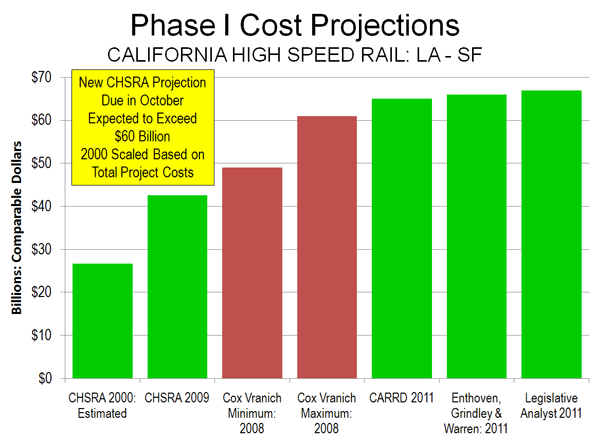
    Today only the most ardent supporters believed that initial estimate figure any longer. Early in the year, CARRD (Californians Advocating Responsible Rail Design) looked closely at CHSRA documentation and estimated that Phase I would instead cost $65 billion. In May, the California Legislative Analyst’s Office indicated that based upon the cost escalation already taking place, the cost of Phase I could reach $67 billion.   Alain Enthoven of Stanford University, William Grindley, formerly of the World Bank and William Warren, a former Silicon Valley CEO project a $66 billion figure (see Figure) and also estimate that costs for the complete project, with extensions to San Diego and Sacramento could be up to $116 billion (Note 1). This is triple the 2000 CHSRA projection (inflation adjusted).

    Megan McArdle of The Atlantic characterized the obsolete $43 billion estimate as "giddily optimistic," while Reihan Salam of National Review Online called the cost escalation "a national embarrassment." In fact, even the $43 billion represented substantial cost escalation. Over the previous decade, the project cost had escalated more than 50 percent after adjustment for inflation.

    Any one of the new cost projection figures would put the California High Speed Rail project on track for a world high speed record in cost escalation. Available data indicates that no transportation infrastructure project in the history of the world has experienced such a large cost increase in so little time.

    Cox/Vranich Projection Low: In 2008, Joseph Vranich and I authored the Reason Foundation’s The California High Speed Rail Proposal: A Due – Diligence Report. Based upon the cost escalation we predicted in that report, our cost escalation estimate for Phase I would have been between $49 billion and $61 billion (Note 2). Little did we expect that our maximum cost escalation figure would turn out to be too conservative and be exceeded even before the first shovel had been turned.

    Rippling to Florida: There has already been a ripple effect from California’s record cost escalation. My Reason Foundation report on the Florida high speed rail project (The Tampa to Orlando High Speed Rail Project: A Florida Taxpayer Assessment) used a comparison to the first segment of the California system to produce a maximum cost overrun estimate of $3 billion for the Florida system. Had the new cost estimates been available at the time, we would have projected even higher cost overruns. Of course, Governor Rick Scott canceled that project to shield the taxpayers of the state from obligations not only for cost overruns but also for operating subsidies.

    Citizen Opposition: Meanwhile, the California project has encountered other difficulties. Strong community opposition to the project has developed along the route through the generally Democratic voting peninsula cities between San Jose and San Francisco. CHSRA had intended to expand the existing commuter rail and freight rail right-of-way from 2 to 4 tracks either elevated or to put it in a trench. Residents fear that an elevated system would be a virtual "Berlin Wall" dividing their communities and that a trench would be little better. Vigorous opposition has also developed in the Central Valley (San Joaquin Valley), which is one of the world’s leading agricultural areas.

    There is also a dispute on routing, as CHSRA considers crossing the "Grapevine" parallel to Interstate 5 between Los Angeles and Bakersfield, rather than the adopted, longer route through the Antelope Valley (the Lancaster-Palmdale urban area, which is likely to have 500,000 people by 2020 when the train is supposed to begin operating).

    Slowing Down the Trains: The peninsula residents have been successful in obtaining strong political support in Sacramento and Washington. There are indications that a "blended" alternative might be developed instead of the elevated or trench alternatives. This would involve mixing high-speed trains on the same two tracks is the present Cal Train commuter service. Of course, this means that the high speed trains could not run very fast. This could add up to 50 minutes to the schedule between Los Angeles and San Francisco, which would make it impossible for the trains to reach the travel time mandated in state law of 2:40. Instead, the trains could take up to 3:30.

    Our Due Diligence Report expressed doubts about the ability of CHSRA to deliver on the legislatively mandated travel times. We predicted that the fastest non-stop trains would take 3:41 between Los Angeles and San Francisco, not much more than the 3:30 that could result from the "blended" alternative. Even that time might not be achievable should citizen opposition develop along other parts of the line. California would, as a result, get the look, but not the substance of high speed rail.

    A Shortage of Funding: Perhaps the final blow will come from financial reality, a commodity often in short supply in recent California history.   At this point, the project has received less than $4 billion in federal grants, which together with a matching $4 billion from the state bonds authorized by taxpayers could be spent. However, given the Republican control of the House of Representatives and the tight federal budget, the prospect for additional federal funding seems dim. High-speed rail was deleted from the federal budget in the agreement between Congress and the President in April. The 2012 budget passed by the House of Representatives does not contain money for high-speed rail.

    CHSRA is optimistic about receiving private investment to fund a major part of the construction. Although there is no shortage of companies looking to be paid to do work on the high-speed rail project, the room empties out when firms are asked to risk billions of their own capital on the project. CHSRA’s own documents indicate that investors are likely to require revenue guarantees, which would appear to violate provisions of the state law that placed the bond issue on the ballot in 2008.

    The Prospects:  At this point there seem to be three potential outcomes. The first, and least likely, is that CHSRA will obtain sufficient funding to build Phase I. Alternatively, CHSRA could build only some portion of the line in the Central Valley, and high speed rail would likely not operate in this far less densely traveled corridor. This would leave California with the most extravagant Amtrak segment in the nation. The third potential outcome is, of course, that the system will never be built.

    Bipartisan concerns are now being expressed in Sacramento, where some Democrats worry that high-speed rail could divert money from more critical, and politically influential, uses. Senator Alan Lowenthal (D-Long Beach), who chairs a committee overseeing the project may have spoken for many after the events of the week: "This is really very serious and needs to stop in its tracks. We can’t just be acting as if someone’s out there giving us wheelbarrows full of money, and it’s just coming. This is not the way we should be operating."

    —-

    Note 1: Enthoven, Grindley and Warren also note that if the California high speed rail project were to equal the worst level of cost escalation yet in California (the San Francisco Bay Bridge project, which is now underway), the costs would rise to as much as $213 billion (Cited in The Wall Street Journal editorial, "Runaway Trains").

    Note 2: Our estimates have been adjusted to "year-of-expenditure" dollars, the method currently used by CHSRA in its cost estimates.

    Photo: California’s Central Valley (where first segment is to be built)

    Wendell Cox is a Visiting Professor, Conservatoire National des Arts et Metiers, Paris and the author of “War on the Dream: How Anti-Sprawl Policy Threatens the Quality of Life

  • The Spread of Proprietors/Independent Contractors In the US

    A few weeks ago EMSI looked at the states with the largest share of 1099 workers — that is, proprietors/independent contractors, farm workers, and others not covered by unemployment insurance. We found that since 2006 every state (as well as D.C.) has seen growth in noncovered workers.

    Simply put, the number of workers outside traditional employment rolls is on the rise.

    We have since mapped out job growth among 1099 workers in every U.S. county from 2006-2011 to see where this increase in nontraditional employment is most evident. And the data makes the trend even clearer: The majority of counties across the nation have seen at least a small increase in noncovered workers, and some have seen huge increases. This is especially the case in the western and southwestern portions of the U.S.

    It should be emphasized that not all 1099 workers captured in the EMSI Complete dataset are proprietors/independent contractors. However, if we use growth in the 1099 economy as a loose proxy for entrepreneurial behavior (i.e., a backbone for economic growth and business development), it’s very apparent which areas are progressing in that arena and which areas are falling behind.

    The counties with the most 1099 job growth are mostly in fairly isolated areas:

    1, Loving County, Texas, 114% (the least populous county in the US)
    2, Todd County, South Dakota, 81%
    3, Calhoun County, West Virginia, 63%
    4 (tie), Roane County, West Virginia, 57%
    4 (tie), Reagan County, Texas, 57%
    4 (tie), Union County, Florida, 57%
    7 (tie), Wayne County, Utah, 54%
    7 (tie), Shackleford County, Texas, 54%
    9, Ochiltree County, Texas, 53%
    10, Kenedy County, Texas, 52%

    Seven of the top 12 counties, in fact, are in Texas, including Midland County. Oil and gas extraction, the fastest-rising sector for 1099 workers in the US, is driving most of this growth in workers outside the unemployment insurance (UI) system.

    In contrast, the counties showing the biggest job loss in 1099 employment have a more diverse population base:

    1, Ziebach County, South Dakota, -23%
    2 (tie), St. Louis City, Missouri, -15%
    2 (tie), Roanoke County, Virginia, -15%
    4, Ohio County, West Virginia, -14%
    5, Sully County, West Virginia, -13%
    6, Oliver County, North Dakota, -12%
    7 (tie), Marshall County, South Dakota, -11%
    7 (tie), Forsyth County, Georgia, -11%
    9, Pennington County, South Dakota, -10%
    10, Decatur County, Iowa, -9%

  • The U.K. Riots And The Coming Global Class War

    The riots that hit London and other English cities last week have the potential to spread beyond the British Isles. Class rage isn’t unique to England; in fact, it represents part of a growing global class chasm that threatens to undermine capitalism itself.

    The hardening of class divisions    has been building for a generation, first in the West but increasingly in fast-developing countries such as China. The growing chasm between the classes has its roots in globalization, which has taken jobs from blue-collar and now even white-collar employees; technology, which has allowed the fleetest and richest companies and individuals to shift operations at rapid speed to any locale; and the secularization of society, which has undermined the traditional values about work and family that have underpinned grassroots capitalism from its very origins.

    All these factors can be seen in the British riots. Race and police relations played a role, but the rioters included far more than minorities or gangsters. As British historian James Heartfield has suggested, the rioters reflected a broader breakdown in “the British social system,” particularly in “the system of work and reward.”

    In the earlier decades of the 20th century working class youths could look forward to jobs in Britain’s vibrant industrial economy and, later, in the growing public sector largely financed by both the earnings of the City of London and credit. Today the industrial sector has shrunk beyond recognition. The global financial crisis has undermined credit and the government’s ability to pay for the welfare state.

    With meaningful and worthwhile work harder to come by — particularly in the private sector — the prospects for success among Britain working classes have been reduced to largely fantastical careers in entertainment, sport or all too often crime. Meanwhile, Prime Minister David Cameron’s supporters in the City of London may have benefited from financial bailouts arranged by the Bank of England, but opportunities for even modest social uplift for most other people have faded.

    The great British notion of idea of working hard and succeeding through sheer pluck — an idea also embedded in the U.K.’s former colonies, such as the U.S. — has been largely devalued.  Dick Hobbs, a scholar at the London School of Economics, says this demoralization  has particularly affected white Londoners. Many immigrants have thrived doing engineering and construction work as well as in trades providing service to the capital’s affluent elites.

    A native of east London himself, Hobbs  maintains that the industrial ethos, despite its failings, had great advantages. It centered first on production and rewarded both the accumulation of skills. In contrast, by some estimates, the pub and club industry has been post-industrial London’s largest source of private-sector employment growth, a phenomena even more marked in less prosperous regions. “There are parts of London where the pubs are the only economy,” he notes.

    Hobbs claims that the current “pub and club,” with its “violent potential and instrumental physicality,” simply celebrates consumption often to the point of excess. Perhaps it’s no surprise that looting drove the unrest.

    What’s the lesson to be drawn?  The ideologues don’t seem to have the answers. A crackdown on criminals — the favored response of the British right — is necessary but does not address the fundamental problems of joblessness and devalued work. Similarly the left’s favorite panacea, a revival of the welfare state, fails to address the central problem of shrinking opportunities for social advancement.  There are now at least 1 million unemployed young people in the U.K., more than at any time in a generation, while child poverty in inner London, even during the regime of former Mayor “red Ken” Livingstone last decade, stood at 50% and may well be worse now.

    This fundamental class issue is not only present in Britain. There have been numerous outbreaks of street violence across Europe, including in France and Greece. One can expect more in countries like Italy, Spain and Portugal, which will now have to impose the same sort of austerity measures applied by the Cameron government in London.

    And how about the United States? Many of the same forces are at play here. Teen unemployment currently exceeds 20%; in the nation’s capital it stands at over 50%. Particularly vulnerable are expensive cities such as Los Angeles and New York, which have become increasingly bifurcated between rich and poor. Cutbacks in social programs, however necessary, could make things worse, both for the middle class minorities who run such efforts as well as their poor charges.

    A possible harbinger of this dislocation, observes author Walter Russell Mead, may be the recent rise of  random criminality, often racially tinged, taking place in American cities such as Chicago, Milwaukee and Philadelphia.

    Still, with over 14 million unemployed nationwide, prospects are not necessarily great for white working- and middle-class Americans. This pain is broadly felt, particularly by younger workers. According to a Pew Research survey,  almost 2 in 5 Americans aged 18 to 19 are unemployed or out the workforce, the highest percentage in three decades.

    Diminished prospects — what many pundits praise as the “new normal” — now confront a vast proportion of the population. One indication: The expectation of earning more money next year has fallen to the lowest level in 25 years. Wages have been falling not only for non-college graduates but  for those with four-year degree as well.   Over 43% of non-college-educated whites complain they are downwardly mobile.

    Given this, it’s hard to see how class resentment in this country can do anything but grow in the years. Federal Reserve Chairman Ben Bernanke claimed as early as 2007 that he was worried about growing inequality in this country, but his Wall Street and corporate-friendly policies have failed to improve the grassroots economy.

    The prospects for a widening class conflict are clear even in China, where social inequality is now among the world’s worse . Not surprisingly, one survey conducted  the Zhejiang Academy of Social Sciences   found that 96% of respondents “resent the rich.”  While Tea Partiers and leftists in the U.S. decry the colluding capitalism of the Bush-Obama-Bernanke regime, Chinese working and middle classes confront a hegemonic ruling class consisting of public officials and wealthy capitalists. That this takes place under the aegis of a supposedly “Marxist-Leninist regime” is both ironic and obscene.

    This expanding class war creates more intense political conflicts. On the right the Tea Party — as well as rising grassroots European protest parties in such unlikely locales as Finland, Sweden and the Netherlands — grows in large part out of the conviction that the power structure, corporate and government, work together to screw the broad middle class. Left-wing militancy also has a class twist, with progressives increasingly alienated by the gentry politics of the Obama Administration.

    Many conservatives here, as well as abroad, reject the huge role of class.  To them, wealth and poverty still reflect levels of virtue — and societal barriers to upward mobility, just a mild inhibitor. But modern society cannot run according to the individualist credo of Ayn Rand; economic systems, to be credible and socially sustainable, must deliver results to the vast majority of citizens. If capitalism cannot do that expect more outbreaks of violence and greater levels of political alienation — not only in Britain but across most of the world’s leading countries, including the U.S.

    This piece originally appeared at Forbes.com.

    Joel Kotkin is executive editor of NewGeography.com and is a distinguished presidential fellow in urban futures at Chapman University, and an adjunct fellow of the Legatum Institute in London. He is author of The City: A Global History. His newest book is The Next Hundred Million: America in 2050, released in February, 2010.

    Photo by Beacon Radio.

  • Who Lost the Middle Class?

    Forty years from now, politicians, writers, and historians may struggle to understand how America, once the quintessential middle-class society, became as socially stratified as Europe or even Brazil. Should that dark scenario come to pass, they would do well to turn their attention first to New York City and New York State, which have been in the vanguard of middle-class decline.

    It was in mid-1960s New York—under the leadership of a Barack Obama precursor, Hollywood-handsome John Lindsay—that the country’s first top-bottom political coalition emerged. In 1965, Gotham had more manufacturing jobs than any other city in the country.programs failed. New York City responded by inflating its unionized public-sector workforce to incorporate minority workers.

    Higher taxes to pay for bigger government joined higher crime to produce a massive exodus of manufacturing and middle-class jobs. Over the last 45 years, New York has led the country in outmigration. A recent study by E. J. McMahon and Robert Scardamalia of the Empire Center for New York State Policy notes that since 1960, New York has lost 7.3 million residents to the rest of the country. For the last 20 years, “New York’s net population loss due to domestic migration has been the highest of any state as a percentage of population.”

    New York City, meanwhile, solidified its standing as the most unequal city in America. Twenty-five percent of New York was middle-class in 1970, according to a Brookings Institution study. By 2008, that figure had dropped to 16 percent, and the numbers have only plunged further since the financial crisis, with virtually all the new jobs in the city’s hourglass economy coming at either the high end or the low. Only high-end businesses can succeed in a local economy that has the nation’s highest taxes and highest cost of living—and even those businesses, in many cases, weathered the downturn only by living off the Fed’s policy of subsidizing banks. Despite the federal largesse, more of the city’s new jobs are in the low-wage hospitality and food-services industries than in the financial sector. The middle has lost its political voice in a city dominated by the politically wired wealthy and the public-sector unions that service the poor.

    New York is the picture of what the Tea Party fears for the country at large. In the 1970s, liberal mandarins seized the high ground of American institutions in the name of managing social, racial, gender, and environmental justice on behalf of the disadvantaged. Their job, as they saw it, was to protect minorities from the depredations of middle-class mores. In the wake of the Aquarian age, the U.S. developed the first mass upper-middle class in the history of the world. These well-to-do, often politically connected professionals—including the increasingly intertwined wealthy of Wall Street, Hollywood, and Silicon Valley—espoused what might be called gentry liberalism, a creed according to which the middle classes had to be punished for their racism, sexism, and excess consumption.

    And they have been punished—with job losses. These losses are the inevitable result of the costs of an ever-expanding, European-style public sector; environmental restrictions on manufacturing, mining, and forestry, which push high-paying jobs offshore; and illegal immigration, which reduces overall wage levels. At the same time, the decline in the quality of K–12 schools has undermined what was once a ladder of economic ascent. After completing high school today, students are likely to require a raft of remedial courses in college. Then, after college, many middle-class students graduate not with an education but with a credential—and a bag of enormous college loans that paid for the intermittent attention of a highly paid, tenured faculty.

    The private-sector middle class’s plight has been exacerbated by international competition and technological innovation, which have undermined job security, including for unionized manufacturing workers, who had enjoyed an unprecedented prosperity for about a quarter-century. Median household incomes have grown only marginally since the early 1970s, despite the mass movement of women into the workplace. Many dual-earner families have been caught in the two-income tax trap: on the one hand, they pay for services once performed by the homemaker; on the other, notes economist Todd Zywicki, they’re pushed into a higher tax bracket when the wife’s salary is added to the husband’s.

    Adding to the woes of the middle and lower classes is that their families are far less stable than they were a generation ago. The decline of marriage has been driven not only by changing mores but also by a decline in male employment. In 1970, only one of 14 working-age men was out of the workforce. Today, notes Nina Easton, one in five is either “collecting unemployment, in prison, on disability, operating in the underground economy, or getting by on the paychecks of wives or girlfriends or parents.” Whites who don’t attend college have out-of-wedlock birthrates approaching those that triggered Daniel Patrick Moynihan’s concerns about the black family in 1965. Today, four in ten American babies are born out of wedlock.

    During the current downturn, the black and Hispanic middle class has been particularly hard hit. From 2005 to 2009, according to a recent Pew survey, inflation-adjusted wealth fell by 66 percent among Hispanic households and by 53 percent among black households, compared with 16 percent among white households. These families worry with good reason that in the face of continuing high unemployment, they may fall out of the middle class. For the Obama administration and the public-sector unions, the solution to this slide is to force the nearly one in four employers that have contracts with the federal government to pay above-market wages. Here again, New York has been a pacesetter. Recently, public-sector unions and their allies tried to force a developer rebuilding a decayed Bronx armory to follow their wage and hiring guidelines; the deal collapsed, leaving one of the poorest sections of Gotham in the lurch.

    There’s a major difference, though, between New York and the country as a whole. The New York option—move somewhere else—doesn’t apply to private-sector middle-class workers fighting adverse conditions that exist throughout America. So they’ve exercised the classic democratic right of political action, organizing themselves to compete in elections. The Tea Party is the national voice of the private-sector middle class—despite the demonizations heaped upon it by public-policy elites whose own judgment and competence leave much to be desired.

    Middle-class decline should be front and center in 2012, which is shaping up as a firestorm of an election. It’s likely to be a bitter contest, in which the polarized class interests of those who identify with the growth of government and those who are being undermined by its expansion face off without the buffer of mutual goodwill. Liberals, unless they change their tune, will blame Tea Party “terrorists” for the tragedy of a fading middle class. They will continue to delude themselves into thinking, as Al Gore said in 2000, that their rivals represent “the powerful” and that they themselves act on behalf of “the people,” even though President Obama’s policies have poured money into Wall Street and the politically connected “green” businesses that form the upper half of his top-bottom electoral coalition. The question is whether the country will buy this line and, more broadly, whether it will follow the New York model. Should it do so, those future historians will no doubt look at the election of 2012 as the contest in which the middle class staggered past the point of no return.

    This piece originally appeared in The City Journal.

    Fred Siegel is a contributing editor of City Journal, a senior fellow at the Manhattan Institute, and a scholar in residence at St. Francis College in Brooklyn.

    Photo by SEIU International.

  • Biggest Boomer Towns

    The boomer generation, spawned (literally) in the aftermath of the Second World War, will continue to shape the American landscape well into the 21st Century. They may be getting older, but these folks are still maintaining their power. Those born in the first ten years of the boomer generation  — between 1945 and 1955 — number 36 million, and they will continue to influence communities and real estate markets across the country, especially as they contemplate life after kids and retirement.

    Much has been written about where “empty nesters” might move as their children move off on their own. One longstanding favorite is the notion that, having jettisoned their children, the boomers will also desert their suburban communities for the bright city lights.

    Unfortunately for developers — some of whom have invested heavily in high-end housing for urbanizing “empty nesters” — the actual data do not support this thesis. Indeed, our analysis of migration by this cohort in the past 10 years shows a 10.3% decline among core city dwellers, a loss of some 1.3 million people over the past decade. For this analysis, Forbes, with the help of demographer Wendell Cox, looked at population numbers from the Census for boomers aged 45 to 54 in 2000 and compared them with the numbers for those ages 55 to 64 in 2010.

    These population changes include reductions due principally to deaths. Census data do not include mortality information. This cohort lost 3.2% of its population over the 10 years. This would only marginally reduce the changes between 2000 and 2010, while the scale of differences between the metropolitan areas would be identical.

    So where are these surviving boomers settling as they enter their likely extended golden years?  The results may surprise urban boosters who have confidently expected them to flock downtown.

    To be sure, a few of the highly affluent — the ones mentioned in the mainstream media — may purchase homes, or pied-à-terres, in places like Manhattan, Chicago’s Gold Coast or San Francisco. But these areas actually have suffered an exodus of boomers over the past decade. In our ranking of the 51 largest metros in the U.S., the urban cores of San Jose, San Francisco, Los Angeles and Chicago scored near the bottom, suffering double-digit percentage losses of boomers. According to the last Census, New York’s urban core, which the Daily News suggested is packed with aspiring seniors, lost 12% of boomers in their mid-50s to mid-60s  — or about 274,000 people.

    Over the past three years  you could blame this loss on the economy, which has postponed retirements brought home many of the boomers’ young, largely unemployed or underemployed children back to the suburban homestead. Or you can credit it to more active lifestyles among boomers who appear to working later than ever. According to a Careerbuilder.com survey, over 60% of workers over 60 indicated they are postponing retirement.

    Yet perhaps something more profound is at work here. An analysis of those who were 55 to 65 in 2000 and 65 to 75 in 2010 reveals an even stronger anti-urban bias, with an over 12% drop in city dwellers. Since these folks are far less likely to have kids at home and more properly retired, this cohort’s behavior suggests that aging boomers are if anything less likely to move to the cities in the next decade.

    Indeed, if boomers do move, notes Sandi Rosenbloom, a noted expert on retirement trends and professor of Planning and Civil Engineering at the University of Arizona, they tend to move to less dense and more affordable regions. The top cities for aging boomers largely parallel those that appealed to the “young and restless” in our earlier survey. The top ten on our list are all affordable, generally low-density Sun Belt metros:

    1. Las Vegas, Nev.
    2. Phoenix, Ariz.
    3. Tampa-St. Petersburg, Fla.
    4. Orlando, Fla.
    5. Riverside-San Bernardino, Calif.
    6. Raleigh, N.C.
    7. Austin, Texas
    8. San Antonio, Texas
    9. Jacksonville, Fla.
    10. Charlotte, N.C.-S.C.

    But according Sandi Rosenbloom, a noted expert on retirement trends and a professor of planning and civil engineering at the University of Arizona, most boomers are staying put, largely in the suburbs they settled in decades ago.  The propensity to move, she points out, starts to drop precipitously as people leave their early 30s. Roughly 1 in 3 people in their 20s move in a given year; by the time they enter their 40s, that figure slides to about 1 in 10. As people age into their 50s and beyond, the percentage drops to roughly 5%, or 1 in 20.

    “The boomers are staying put more than anyone thought,” Rosenbloom says. “People of that generation tend to own their own homes and stay there. The idea that they are moving to the city really comes from the wishful thinking school of planning.”

    The recession has exacerbated this stay-at-home trend. The number of people moving is at its lowest level since the early 1960s. When boomers do decide to move, Rosenbloom notes, they do so largely for prosaic reasons, such as being closer to children or, more important, grandchildren.

    Others succumb to the temptation to cash out expensive housing in metros like New York, Los Angeles, the Bay Area or Boston for less costly residences in Sun Belt locales. Housing in and around these core cities, particularly in attractive neighborhoods, Rosenbloom adds, are simply too expensive for the vast majority of budget-conscious seniors.

    Much of this also has to do with the lifestyle preferences of both boomers and seniors, which appear far different than those put forth by urban pundits. People over 55 that Rosenbloom has interviewed usually express a preference to stay or relocate in places that are less crowded and congested. Furthermore, most are reluctant to give up their cars, and many are less able to walk than drive. This may explain why most retirement communities end up on the urban fringe or farther.

    This trend — which Rosenbloom has also encountered in the U.K., Australia, Canada and New Zealand — is also reflected by the growing shift to smaller towns and cities among both aging boomers and seniors. The “young and restless” may head to suburbs, particularly in the lower-cost Sun Belt cities, but some older Americans appear headed to even less densely populated regions. Over the past decade over 1 million aging boomers and seniors moved to more smaller cities and rural locations from suburban or urban locations.

    What do these trends suggest for the future of our communities and real estate? For one, the big opportunities for selling to aging boomers will remain primarily in the suburbs and some select more rural locations. We also can expect the new senior citizens to move to more affordable places close to their children.

    These findings do provide some long-term hope for the housing market, particularly in suburbs. Leading demographers have been busy predicting a massive drop-off in single-family homes as boomers retire and their children leave. Yet our analysis on the Census reveals that most boomers — as well as those older than them — are staying in the suburbs a lot longer than expected. Many will likely to stay in their homes and old neighborhoods well into their 70s or even 80s, leaving either their home either in an ambulance or to an assisted living facility.

    Developers and planners anxious to service aging boomers should, instead of building downtown towers, address the needs of this generation precisely where they now live and are likely to stay. This could include adding to new residential options in the suburbs to enlivening local shopping districts while boosting senior services in everything from recreation and public safety to health care. As the rock and roll generation heads toward its dotage, both business and communities need to adjust their strategies based not on fantasies but on the realities so clearly evidenced by the Census.

    This piece originally appeared at Forbes.com.

    Joel Kotkin is executive editor of NewGeography.com and is a distinguished presidential fellow in urban futures at Chapman University, and an adjunct fellow of the Legatum Institute in London. He is author of The City: A Global History. His newest book is The Next Hundred Million: America in 2050, released in February, 2010.

  • Report: China to Suspend High Speed Rail Development

    Railway Age reports that Premier Wen of China "has told the state media that the government will suspend approvals of new rail while it conducts safety checks to address concerns rising from the high speed train collision last month that killed 40 people."

    The Premier also indicated that high speed rail trains should operate at slower speeds "at their earlier stage of operation." Earlier this year, the Ministry of Railways slowed all trains to a maximum speed of 300 kilometers per hour (186 miles per hour) and many trains that were to operate at that speed were slowed to 250 kilometers per hour (155 miles per hour). At the time, reports indicated that the slower speeds were to lower operating costs so that fares could be reduced. Concerns had been raised about the much higher fares on the new trains and the cancellation of many conventional trains, which had much lower fares. Railway Minister In addition, Sheng Guangzu told the press that the slower operating speeds would "offer more safety."

    Photo: Suzhou to Nanjing at 300 kph (by author)

  • Britain Needs a Better Way to Get Rich Than Looting

    Mark Duggan, father of four, was armed with a Bruni BBM semi-automatic pistol when he was shot dead by armed police on 4 August. Despite initial reports Duggan did not fire on the officers from the Trident Police Unit, an armed force dedicated to dealing with “gun related murders within London’s black communities”.

    Duggan’s family were not told by police that he had died from his injuries but learned it from the news, in a report designed to deflect blame for the killing onto the victim. The vigil that Duggan’s friends and family held outside the Tottenham police station was a spark that set off rioting across Britain for the last week, and at the time of writing is still not under control.

    Any political character to the initial rioting – as a protest against police brutality – quickly gave way to looting.

    Looting broke out in urban centres, mostly those with a large black community – Tottenham, Enfield, Dalston and Croydon in London. The looters were for the most part young, and of all races, and they sought out popular clothing stores, like foot locker, jewellers and department stores. Some people were attacked in their homes. The “Gay’s the Word” bookshop in Marchmont Street was attacked on 8 August.

    Later, looting spread to Leeds, Birmingham, Manchester and Nottingham – where a police station was firebombed.

    One feature of the looting was the use of mobile phones, blackberries and Twitter accounts to rally looters to sites where, they rightly predicted, the police could be outmanoeuvred.

    Still, it is worth pointing out that as rioting goes this recent outbreak, though widespread, has not been all that violent. Instead it has been more of a Feast of Fools, with the mob enjoying the humiliation of the authorities, as it raids the supermarkets for booze and clothes.

    The Prime Minister, David Cameron has cut short his holiday in Tuscany to recall Parliament, and the London Mayor has come back too. The Drama Queen Cameron, sensing his big moment, promises tough measures to stop the rioting, issuing rubber bullets and water cannon to the police.  London courts processed 167 prisoners in unprecedented overnight sittings on 9-10 of August.

    The cause of the riots has been identified by the Prime Minister and the London Mayor as a breakdown in authority – and they have a point. It is the British social system as a whole that has lost its way, with a collapse in authority in every level, from the police, the political system, school and parental authority but most severely in the system of work and reward.

    Britain’s police force has most decidedly lost authority in recent times. The force used to have an authoritarian culture that was thuggish and racist under reactionary Chief Constables like Sir James Anderton in Manchester and Sir Kenneth Newman in London. But investigations into the police’s “institutional racism” have opened the way to a newer layer of technocratic leaders who were more interested in process than upholding a particular vision of public order.

    Nobody would want to see the return of the old authoritarian policing, but the cadre that replaced them have lacked a guiding esprit de corps. The police have been seen as being corrupted by payments from News International’s investigators for personal information and designed to sideline an investigation into phone hacking.

    Nor has the force’s new face stopped the problem of police brutality. Uncertain of how to deal with the public order challenges of middle class protest (environmental, or more recently student-based), the police have swung irrationally from a hands-off approach that only encouraged greater disorder to excessive force when that failed. The fear of Islamic terrorism has also led to police overreaction.

    The killings of Jean Charles De Menezes (in a terrorism panic), Ian Tomlinson (at a G20 protest) and the vicious assault on Alfie Meadows at a student demonstration have all undermined respect for the police.

    Political leaders have pointedly failed to engage with younger and less well-off groups in society, too. After more than a decade in power the Labour Party is a shell of its former self, but the coalition that replaced it is a bodged compromise whose most attractive radical figure, mould-breaking Liberal Democrat Nick Clegg, managed to turn himself overnight into the most hated man in Britain by joining the government and voting for an increase in student fees (the very thing he had campaigned against). All in all, the political class are stiff, besuited, and incapable of talking in ordinary English, preferring a weird gabble of municipal-speak.

    Lower down the scale teachers, parents and youth leaders have seen their authority undermined by a culture that disparages discipline, and sees “abuse” everywhere. Teachers’ unions have pointed out that changes in the law mean that a substantial minority are being investigated for allegations of abuse made by students at any time, meaning that they are reluctant to uphold discipline in the classroom. At the same time, teachers and social workers challenge parental discipline at every opportunity.

    Perhaps most disturbingly British society has broken the link between hard work and success. Once the “workshop of the world” Britain has a shrinking manufacturing base (around ten percent of all employment). As the analyst Andrew Smithers pointed out, the City of London’s specialisation in financial intermediation took up the slack left by her shrinking industrial sector, but now that is looking like having all your eggs in the wrong basket.

    For a decade or more booming markets and a credit-fuelled economy covered up the weaknesses. Trainers, clothes and electronic devices shipped in from China and paid for on credit kept Britons happy, while a growth in government jobs and the educational maintenance allowance to keep 16-19 year olds in school kept unemployment down.

    The British system of rewards is far from being straightforward. How do you get rich in Britain in 2011?

    • Sir Paul Stephenson, the disgraced chief of the Metropolitan Police retired this July with full pension and benefits on a final salary of £250,000 – having been exposed for taking favours from journalists under investigation for hacking phones.
    • Susan Boyle grabbed the public’s affection on a TV talent show and made £10 million.
    • Beresfords Law firm skimmed £30 million from the Miners Industrial Injury Compensation scheme.
    • Geordie singer turned X-factor judge Cheryl Cole became Britain’s highest paid TV star.
    • Independent consultants raided the National Health Service’s budget of £4.3 billion to build a national database which still does not work.
    • City chiefs like Barclays Bob Diamond and HSBC’s Bob Duggan were awarded bonuses of £6.5 and £9 million last year, from funds boosted by the government’s £200 billion quantitative easing policy.

    The link between work and reward is not easy to fathom. Young people dream unrealistically of success in the world of entertainment, as the most compelling example to them. The more astute know that law and the other professions have done better at securing their incomes – and for them higher education is the route.

    Now the British system of rewards is threatened by the pressure on credit and on government spending. Nervous teenagers and parents see a much higher cost for higher education threatened (though the small print, surprisingly, is more generous than the headline fees). The consumer goods sector has been the one point of connection between younger people and wider society that worked – but recent financial difficulties make many fear that it will soon be out of reach.

    Britain’s radical leaders have in recent times failed to speak to the material aspirations of the greater mass of people. Trade union wage claims are not the fighting point they once were. Left wingers are more likely to be hostile to consumerism than supportive. On the other side, conservatives have abandoned their narrative of hard work to earn well, thinking it too judgmental and mean-spirited.

    Anxiety about the route to material betterment, along with a failure of political answers to that problem and a falling respect for authority have led to disorder. Earlier this year the middle classes rioted on student protests over rising fees. Now some amongst the inner city poor are rioting and looting, in search of a less deferred gratification.

    The looters have taken advantage of the crisis of public authority to make their own short-cut to material success, but it is a self-defeating one. A looted Debenhams or Footlocker will think twice about re-stocking – or at least until they have improved security. Worse still, many family firms and communities have been wrecked by rioters.

    Mark Duggan’s family needs a good answer to why he was shot, and why they had to learn that he had died through the media. Britain needs a less crazed answer to the question of how to meet people’s wants, and it needs a stronger restatement of the value of social solidarity.

    James Heartfield’s latest book The Aborigines’ Protection Society: Humanitarian Imperialism in Australia, New Zealand, Fiji, Canada, South Africa, and the Congo, 1836-1909 is published by Columbia University Press, and Hurst Books in the UK.

    Photo “Tottenham riots” by Nico Hogg

  • Commercial Real Estate: Shrinking to Fit

    We are going to need less commercial real estate in the future, at least on a per-unit-of-population basis. Advances in communications technology are causing profound and sometimes unanticipated changes in our lives.

    Retail Markets
    The coming change is most obvious in retail markets. Americans are increasingly shopping online. However, we’ve really just started to scratch the surface. According to the U.S. Census Bureau’s 2009 E-Stats report issued in May, 2011, E-commerce only accounted for 3.99 percent of U.S. retail sales in 2009.

    I was surprised at how small that number was. Certainly it is higher now, and the 2009 number was almost double 2004’s 2.13 percent, but there is huge room for increased internet retail sales. This is a growth business with a capital G.

    Originally, I believed that traditional brick-and-mortar retailers would have the advantages of customer service and product knowledge, and internet purchasers would be product-savvy shoppers looking for products that they already knew about. That has turned out not be the case at all.

    It is true that the initial internet retail sales successes have been in products where technical knowledge is not critical, and tastes are well established; products such as music, movies, and books. However, online retailers have made impressive gains in providing customer assistance to shoppers looking for more technical products.

    Ratings of products and retailers were an initial step, along with detailed technical data. More recently, internet retailers have added chat windows, some with pictures of the salesperson. It won’t be long until voice or live video are offered, if it isn’t already.

    It is now the case that you are more likely to find more informed assistance on the internet than you will from a brick-and-mortar retailer. This is not to say you can’t find good assistance at a traditional retailer. But your online experience is likely to be better than what you will receive if you walk into a store and deal with the first person you bump into.

    As internet sales increase, expect to see fewer traditional retailers and less demand for retail space. Already, shopping centers anchored by a music store, a video store, or a book store have felt the impacts. This is only the beginning.

    Commercial rents will be softer and vacancies higher in large regional centers and in neighborhood strip malls. This will tend to drive retailers to ever larger centers with more traffic. Smaller centers will likely slowly deteriorate and die. In the end, we’ll have fewer retail centers, but the average center will be larger than it is today.

    Office Markets
    While the number of workers telecommuting is still small, it is growing; someday, it will be very large. Initially, the growth in telecommuting was driven by workers’ desires to physically commute on fewer days. Today, the initiative is changing to employers.

    Companies that adapted to telecommuting employees began to learn how to supervise these workers. Some companies have gone further. My son works for a company that has closed many physical offices, but kept most employees. Everyone was told to telecommute.

    For companies that have made the strategic decision to reduce office space, the advantages must be large. Certainly rent goes down, but other expenses go down too. Heating and cooling costs go away. The company no longer needs to support a local network, with the local network’s support costs.

    I haven’t seen research on telecommuters’ productivity, but it is easy to imagine it increases. Think “happy employees are productive employees.” It is also easy to imagine that productivity decreases. Think “unsupervised employees are unproductive employees.” Clearly, telecommuter productivity is the key to profitably running an office-free operation. As someone once said “any job performed on a computer can be performed anywhere.”

    The lower demand will result in lower office space rental prices and higher vacancies. Again, this should lead to office-dependent operations migrating to the better addresses. In the end, the less-desirable buildings will be empty.

    Industrial Markets
    We’ve seen the huge increase in overseas manufacturing, and we’ve seen the steady decline of U.S. manufacturing jobs. That is just the first stage of a profound transformation in the way things are produced. As the song goes., “You ain’t seen nothing yet.”

    Manufacturing’s future is nicely exemplified by three-dimensional printing. Today, you can Google “three dimensional printing” to find links to videos of three-dimensional printers producing amazingly complicated products, or find companies that have three-dimensional printers. Or you can use a three-dimensional printer to produce something.

    I expect the growth of three-dimensional printers to be something like what we saw with copy machines. The first copy machine I used was in a drug store, and it was coin operated. Then, the banks made them available to customers. Today, we all have at least one in our home and one at the office.

    The day will come when three-dimensional printers will be ubiquitous. You will download instructions for products from some company like Amazon. Then you will produce your good, without the need for an industrial building or a brick and mortar retailer. Producers of products that can’t be printed will print parts, reducing the demand for other producers, inventories, and shipping.

    Any Growth Areas?
    Buildings associated with providing healthcare may be the major exception to declining commercial real estate demand. The aging population, new technology, and long-term wealth trends are likely to continue to drive growth in the economy’s only sector that has grown consistently throughout the recession. At least so far, technological advances in medical care have increased demand for space instead of decreasing it.

    Specialized R&D space may also buck the trend. Many of these facilities can be specialized, however, to the point of being profitably used by only one company. That implies that these buildings are risky investments.

    Policy Implications
    The decline in commercial real estate demand will pose serious challenges to governments. We’re already seeing states and local governments struggle with loss in retail taxes from internet sales . Declining revenues are just the beginning, though. Expenses will increase.

    Empty buildings generate crime. In the case of retail centers, the crime will be very public. Nearby residential property values could decrease, with additional lost revenue to governments. Residents will not stand idly by. They will demand effective action — action that could be very expensive.

    To minimize the fiscal damage, local governments will need to be nimble, a characteristic that few governments possess. They will need to be willing to change zoning codes to adapt to the decline in commercial real estate. They need to allow owners of existing space to redevelop or change their product mix. They may need special tax districts to deal with the blight created by vacant properties.

    Growing population and an eventual real recovery will eventually fix the residential real estate problem. Commercial real estate’s challenges will not be so easily addressed. The impacts are not only on owners, developers, and contractors . All of us will be affected. The time to plan for those changes is now.

    Bill Watkins is a professor at California Lutheran University and runs the Center for Economic Research and Forecasting, which can be found at clucerf.org

    Photo by Mark Lyon — Full Floor For Rent.

  • Queensland’s Future: Diverse and Dispersed

    I was recently asked to outline my thoughts on how the Queensland urban landscape might look 40 to 50 years from now.  Go on, you can laugh.  I did too.  It’s hard enough to forecast the next 12 months, let alone two generations away, but I’ve given it a go, of sorts, so here it is:

    First though, it might be best to outline my methodology.  In short, this forecast will be based on underlying trends, some understanding of human nature, and importantly, the Australian mindset.  My outlook is supported by evidence – what people actually do rather than say – and importantly, not by urban myths or fallacies, despite the frequency with which they have been aired of late.  Unfortunately, we don’t have the space or the time here to support every claim or go into massive detail; so this discussion is confined to broad shapes – not nitty gritty.

    Queensland’s urban future (and that of Australia) can best be summed up in two words – Diverse and Dispersed.

    Let’s deal with the second D – dispersion – first.  Our regional centres are likely to become a whole lot bigger and at the expense of the already crowded south-east corner of the state.  The move away from the world’s bigger cities is already underway, as evidenced in the recent census in the United States, but also throughout much of Europe.  Several Asian and Middle-eastern countries are now also following suite  As a Mckinsey Institute study recently found, smaller cities, particularly in the developing world, are growing considerably faster than the much discussed megacities.

    The annual ABS small-area population data suggests this trend is also very true in Australia and particularly in Queensland, which, over the past decade, been the fastest growing state on the continent, appears to be following the same trend, something likely to be borne out by 2011 Census, due later this year .

    Within our capital cities themselves, the much ballyhooed move downtown will slow – again, it already is doing so – as the cost to live within close proximity to the CBD is just too high compared to the real benefits. 

    The irrational assertions about the trend towards denser living rest on urban myths that promote inner city density over other housing forms. These include the notion that suburban growth worsens carbon emissions and traffic congestion; people are being forced to live far from jobs concentrated in our CBDs and denser development will make it cheaper for them to get to work. These notions are all largely exaggerated or incorrect. More to the point, they stand in opposition to the basic preferences of the market.  

    Instead of having a single high-density city core, with lower development density radiating outwards, the most likely urban shape in the future will be one of more even distribution of housing density throughout the city; concentrated more, no doubt, around middle-ring transport hubs and new master planned town-centres.  Our middle-ring and outer suburbs will have much more compact urban settings but will remain primarily dominated by relatively low density housing.

    Diversity relates to the housing stock itself.  The current push towards smaller dwellings has little to do with demographics and the market’s wants, but reflects basic reaction to diminished housing affordability.   There is a demand for tightly-sized product, but it is nowhere as near as high, nor is the long-term trend towards such as strong, as the urban boosters advocate.

    Taking a wider view, Australia (and America too) is still in its frontier or "barbaric" stage of its cultural evolution.  We walk with wide gaits, worship most things large from roadside bananas to women’s appendages, and don’t really like crowded spaces or queues Most of us like our space; aren’t really ready to give it up, and are not likely to do so for many decades to come.

    Rather than remaining focused on density and concentration, it could well serve the community to focus on what appeals to the vast majority of the population, particularly the middle and working class families.  A more practical approach might be to foster the development of smaller, more efficient cities, as well as expansive suburbs and revived small towns rather than engage in a manic drive towards persistent centralization. 

    Rather a forced density agenda on a largely unwilling population, it makes sense to consider how to make a more dispersed (and diverse) urban future more workable and sustainable. Innovations in work environments, notably increased use of telecommuting and dispersed workplaces, and more fuel efficient cars hold more promise than plans that force Aussies to live a way the vast majority do not prefer.

    This article originally appeared in the June/July 2011 edition of the UDIA Queensland’s Urban Developer Magazine.

    Michael Matusik is a qualified town planner and director of independent residential development advisory firm, Matusik Property Insights.

    Photo by Michael Zimmer.

  • The Evolving Urban Form: Los Angeles

    Los Angeles has grown more than any major metropolitan region in the high income world except for Tokyo since the beginning of the twentieth century, and also since 1950.  In 1900, the city (municipality, see Note) of Los Angeles had little over 100,000 people and ranked 36th in population in the nation behind Allegheny, Pennsylvania (which has since merged with Pittsburgh) and St. Joseph Missouri (which has since lost more than one quarter of its population).

    As people moved West in the intervening decades and especially after World War II, the Los Angeles area exploded in population. By 1960, the Los Angeles metropolitan area, which was then and is now composed of Los Angeles and Orange counties, had passed Chicago to become second in population only to the New York metropolitan area. It was to take considerably longer for the city of Los Angeles to pass the city of Chicago as the nation’s second largest municipality, though this occurred by the 1990 census.

    The Los Angeles combined statistical area (analogous to the former consolidated metropolitan statistical area) is made up of three metropolitan areas, Los Angeles, Riverside – San Bernardino and Oxnard (Ventura County). This combined area covers 35,000 square miles or more than 90,000 square kilometers. This is a land area nearly as large as that of Hungary and larger than Austria. The overwhelming share of the CSA is rural, with less than 10 percent of the land area developed.

    Growth from 1900: The CSA had only 250,000 people in 1900, though grew to nearly 5,000,000 in 1950. By 2010, the population was nearing 18 million, a figure not much less than that of Australia, at 22 million (Table 1). Indeed until 1990 the Los Angeles CSA population was closing in on Australia. However, since that time population growth in the Los Angeles area has slowed considerably and Australia should remain larger.

    Table 1
    Los Angeles Combined Statistical Area: Population (CSA): 1900-2010
    Year City of Los Angeles Balance: LA County  Los Angeles County   Orange County   Riverside County   San Bernardino County   Ventura County   Total 
    1900        102,479                   67,819         170,298           19,696         17,897            27,929         14,367         250,187
    1910        319,198                 184,933         504,131           34,436         34,696            56,706         18,347         648,316
    1920        576,673                 359,782         936,455           61,375         50,297            73,401         28,724     1,150,252
    1930    1,238,048                 970,444      2,208,492         118,674         81,024         133,900         54,976     2,597,066
    1940    1,504,277              1,281,366      2,785,643         130,760       105,524         161,108         69,685     3,252,720
    1950    1,970,358              2,181,329      4,151,687         216,224       170,046         281,642       114,647     4,934,246
    1960    2,479,015              3,559,756      6,038,771         703,925       306,191         503,591       199,138     7,751,616
    1970    2,816,061              4,216,014      7,032,075     1,420,386       459,074         684,072       376,430     9,972,037
    1980    2,966,850              4,510,653      7,477,503     1,932,709       663,166         895,016       529,174   11,497,568
    1990    3,485,398              5,377,766      8,863,164     2,410,556    1,170,413      1,418,380       669,016   14,531,529
    2000    3,694,820              5,824,518      9,519,338     2,846,289    1,545,387      1,709,434       753,197   16,373,645
    2010    3,792,621              6,025,984      9,818,605     3,010,232    2,189,641      2,035,210       823,318   17,877,006
    Consolidated statistical area as defined by OMB as of 2010

    The city of Los Angeles had grown 88 percent from 1950 to 2000, but over the past decade added only three percent to its population. Even more spectacular declines in growth occurred in the rest of the CSA. For example, Orange County had grown 1200 percent between 1950 and 2000 yet grew only six percent in the last decade.

    Growth: 2000 to 2010: The population growth in the Los Angeles CSA was widely dispersed and away from the core. The central area (urban core) of the city Los Angeles extends from the Santa Monica Mountains to South Los Angeles and from the boundaries of Beverly Hills, West Hollywood and Culver City to East Los Angeles grew only 0.7 percent. Uniquely, the central area densified strongly between 1960 and 2000, while other urban cores nearly all declined in population, whether in the United States or Western Europe. Much of this was due to strong immigration from Mexico, other parts of Latin America, as well as Asia.

    The inner suburban ring, which includes the balance of Los Angeles County south of the Santa Susana and San Gabriel Mountains as well as the older northwestern Orange County suburbs grew by 1.5 percent. Within this area, 32 inner suburbs (all in Los Angeles County) grew from 1.766 million to 1.767 million (0.1 percent) from 2000 to 2010 (Note 2).

    The outer suburbs, which include the balance of Orange County (including the Mission Viejo urban area) and the western portions of Riverside and San Bernardino counties (including the Riverside – San Bernardino urban area) grew 19 percent.

    The exurban areas, which include areas outside the core urban areas of Los Angeles, Riverside-San Bernardino and Mission Viejo grew 30 percent. The hot spots included Ventura County, the Santa Clarita Valley, the Antelope Valley, the Victorville-Hesperia area, the Coachella Valley (Indio-Palm Springs), the Hemet area and the Temecula-Murrieta area. An argument could be made that Temecula-Murrieta would be in the San Diego metropolitan area if metropolitan areas were defined by smaller area units, such as municipalities (as in Canada) or census tracts. The exurban areas are more attractive to residents at least in part because of considerably less expensive housing and their greater availability of detached houses than in the three core urban areas.

    More remote areas of the desert extending to the Nevada and Arizona borders added 42 percent to their population (Table 2, Figure 1 and 2).

    Table 2
    Los Angeles CSA: Population by Sector: 2000-2010
    Sector 2000 2010 Change % Change
    Central Los Angeles          1,752,024              1,763,967         11,943 0.7%
    Inner Ring          9,093,756              9,231,513       137,757 1.5%
    Outer Suburbs          3,053,615              3,630,273       576,658 18.9%
    Exurbs          2,173,459              2,822,884       649,425 29.9%
    Remote             301,331                 428,369       127,038 42.2%
    Total       16,374,185            17,877,006    1,502,821 9.2%

    City of Los Angeles: The dispersion of population was also evident in the city of Los Angeles. For decades, the city of Los Angeles has grown strongly. Approximately one-quarter of this growth since 1960 has been the densifying central area, as noted above.

    However, little noted is the fact that most of the city’s growth was greenfield suburban in nature, built at low and moderate densities and largely car-oriented. For most of the past fifty years the growth has been “over the hill” in the San Fernando Valley, a formerly rural area which was annexed by the city before 1930. Between 1950 and 2010, the population of the San Fernando Valley grew from 300,000 to 1,400,000. Thus, the Valley grew like virtually every fast-growing historical core city in the nation that has grown since 1950, by filling up empty land (Figure 3).

    Much has been written about the “Manhattanization” of the Los Angeles core. However, with only 13 towers more than 550 feet, downtown Los Angeles is no threat to Manhattan, with more than 125, or even Chicago with more than 70. Further, job growth is stagnant, with virtually no change in private sector employment over the last decade, despite substantial government subsidies.

    Between 2000 and 2010, the central area grew at its slowest rate since the 1950s, growing by only 0.7 percent to its population, growing only 12,000 (to 1,764,000) or barely 12 percent of the city’s growth. Nonetheless, and contrary to the reputation of Los Angeles, the central area is very densely populated, at approximately 14,000 people per square mile, with the highest density census tracts having more than 90,000 residents per square mile. Among the nation’s largest municipalities, only New York and San Francisco are denser than central Los Angeles.

    The big story in growth was on periphery. The San Fernando Valley captured 70 percent of the city’s growth in the 2000s, with considerable greenfield expansion in the hills north of Chatsworth and Northridge. Even so, the Valley’s growth was only five percent. The western portion of the city, which extends from the Santa Monica Mountains to Los Angeles International Airport, grew three percent and accounted for 13 percent of the city’s growth. The Harbor area added two percent to its population and accounted for five percent of the city’s growth (Figure 4).

    The Future: Growth or Stagnation? After more than a century of spectacular growth, Los Angeles demographic juggernaut is stagnating and could conceivably go in reverse due to declining immigration, an exodus of middle class and working class families.  Indeed Even the strong growth in the outer suburbs and exurbs was not sufficient to drag the regional population increase (9 percent) up to the national rate of 10 percent between 2000 and 2010.

    The immediate prognosis should be for even slower growth. The financial, regulatory and cost of living disadvantages of California are widely recognized by households and businesses alike. With stronger regulations in the offing, such as the stronger land use restrictions likely to occur as a result of Senate Bill 375, any future growth on the periphery could be dampened. Even with multi-billion support in terms of tax breaks and public investment, the central core seems unlikely to come close to making much of a real difference, at least beyond the media.  Los Angeles may not be on the road to Rust Belt stagnation, but the dynamism of the last century is no more.

    ——

    Note 1: In this article, the term "city" means municipality.

    Note 2: This includes municipalities and census designated places nearest the central area of the city of Los Angeles, from Glendale and Pasadena through Monterey Park to South Gate, Compton and Gardena and to the west of the central area.

    Note 3: Biographical Note: The author was born in the Echo Park district, near downtown Los Angeles.

    Photograph: Downtown Los Angeles from Echo Park (by author)

    Wendell Cox is a Visiting Professor, Conservatoire National des Arts et Metiers, Paris and the author of “War on the Dream: How Anti-Sprawl Policy Threatens the Quality of Life