Blog

  • Sweden: A Role Model for Capitalist Reform?

    Sweden is often held up as a role model for those wishing to expand the size of government in the U.S. and other nations. The nation is seen as combining a large public sector with many attractive features, such as low crime rates, high life expectancy and a high degree of social cohesion.

    But in actuality the success of the Swedish society lies not with the extent of its welfare state, but as the result of cultural and demographic factors as well as a favourable business environment throughout most of Sweden’s modern history.

    First, it should be noted that Sweden experienced even higher rates of growth and impressive social outcomes well before the start of the Social Democratic era in 1936. Sweden was an impoverished nation before the 1870s, as evidenced by the massive emigration to the United States. As a capitalist system evolved out of the agrarian society, the country grew richer.

    Property rights, free markets and the rule of law in combination with an increasingly well-educated workforce created an environment in which Sweden enjoyed an unprecedented period of sustained and rapid economic development. Famous Swedish companies like IKEA, Volvo, Tetra Pak and Alfa Laval were all founded during this period, aided by business friendly economic reforms and low taxes.

    Between 1870 and 1936, the start of the Social Democratic Era, Sweden had the highest growth rate in the industrialized world. In contrast, between 1936 and 2008 the growth rate was merely the 18th highest of 28 industrialized nations.

    Second, more attention needs to be paid to social and cultural factors. This reflects factors
    such as the Lutheran work ethic and the cohesion of a largely homogeneous population with
    particular social values. The perceived advantage of Swedes over other countries rose before
    the rise of the welfare state. In 1950, before the rise of the high-tax welfare state, Swedes
    lived 2.6 years longer than Americans. Today the difference is 2.7 years. Sweden’s lower
    income inequality also stems back to at least the 1920s.

    These same factors can be seen in the success of Swedes abroad. The approximately 4.4 million Americans with Swedish origins are considerably richer than the average American, as are other immigrant groups from Scandinavia. If Americans with Swedish ancestry would form their own country their per capita GDP would be $56,900, more than $10,000 above the earnings of the average American and 53 percent above the Swedish GDP level of $36 600.

    A Scandinavian economist once stated to Milton Friedman: “In Scandinavia we have no poverty.” Milton Friedman replied, “That’s interesting, because in America among Scandinavians, we have no poverty either.” Indeed, the poverty rate for Americans with Swedish ancestry is only 6.7 percent, half the U.S. average. Economists Geranda Notten and Chris de Neubourg have calculated the poverty rate in Sweden using the American poverty threshold, finding it to be an identical 6.7 percent.

    Critically, those Swedes who immigrated to the U.S., predominately in the 19th century, were anything but elite. Many were escaping poverty and famine. What has made Sweden uniquely successful is not the welfare state, as much as the hard-won Swedish stock of social capital.

    Third, the recent strong performance of the Swedish economy has its roots in labor market and other reforms enacted by center-right governments. Perhaps least appreciated, Sweden has dramatically scaled back the size and scope of government starting in the 1990s, which spurred the recovery of the growth rate.

    Indeed, modern Sweden’s success can be seen as more a shift away from the far left policy that predominated from the 1960s till the end of the century. During recent years Swedish policies have shifted strongly to the center-right, placing the once dominant Social Democrats in deep crisis.

    An important explanation is that the Swedish electorate wishes to again strengthen the ethical norms that have been eroded during the high tax regime. The center-right government that took office in 2006 and was re-elected in 2010 has implemented stepwise and rather large tax reductions.

    Few other nations demonstrate as clearly the phenomenal economic growth that results from adopting free-market economic policies. School vouchers have successfully been introduced, creating competition within the frame of public financing. Similar systems are increasingly being implemented also in other public programs, such as health care and elderly care. Another example is that the pension system has been partially privatized, giving citizens some control over their mandated retirement savings.

    Where is Sweden headed?

    Yet this is not to say Sweden can not go further into a free market direction. Although taxes have been lowered, research publication reveal they still impact to the level of entrepreneurship and crowding out private sector job creation. One study has for example shown that for each additional Swedish Kronor levied and spent by the government, the efficiency losses in the private sector can be as high as 1-3 additional Kronor.

    One particular challenge lies with immigrants. In the past Sweden was highly successful in integrating immigrants. In 1950 the level of employment for foreign-born was 20 percent higher than the average citizen. In 2000 the level of employment was 30 percent lower for the foreign-born.

    In 1968 foreign citizens living in Sweden had 22 percent higher income from work compared to those born in Sweden. In 1999 foreign citizens had 45 percent lower incomes. While racism had decreased significantly as time had passed, the situation of those born abroad in the labour market had worsened dramatically.

    A government study has shown that in 1978 foreign born from outside the Nordic nations had an employment level that was only seven percent lower than ethnic Swedes. In 1995 the gap had expanded to 52 percent.

    Looking forward, it’s clear that Sweden’s great advantages lie not in socialism, but in circumstances. In addition to its considerable human capital, Sweden has an abundance of natural resources, another that the nation was not involved in either of the worlds wars, which tore up other industrialized nations.

    There remain many problems connected to the welfare state. Amongst others Jan Edling, former economist at the labor union LO which has close ties to the Social Democratic party, has discussed this high hidden unemployment and the connection to over-utilization of welfare systems. Around one fifth of the working age population in Sweden are supported by one form or another of government handouts rather than work.

    The Swedish welfare state, of course, does create some social good, by for example providing relatively generous social security nets. But it is clearly not solely responsible for the low poverty and long lifespan in the nation.

    Many in the United States and elsewhere who tend to see Sweden as a social democratic role model fail to understand the history and trajectory of Swedish society. Indeed, much of the success of Sweden, and other Scandinavian nations, relate to strong norms and entrepreneurship.

    To be sure, Swedish society is not necessarily moving away from the idea of a welfare state, but continuous reforms implemented towards economic liberty have strengthened the society. The rise of government has been stopped and clearly reversed during the past years. Sweden is again returning to the free market policies which have served it so well in the past.

    Nima Sanandaji, is President of the Swedish think-tank Captus.

    Photo by Hector Melo A.

  • Exaggerating in Orlando: Sunrail

    For decades taxpayers have paid billions to finance major transportation project cost overruns far exceeding the routinely low-ball forecasts available at approval time. This has been documented in a wide body of academic literature, the most important of which was conducted by Bent Flyvbjerg of Oxford University, Nils Bruzelius University of Stockholm and Werner Rothengatter of the University of Karlsruhe in Germany (Megaprojects and Risk: An Anatomy of Ambition).

    Major project advocacy, however, has descended to a new low of unprecedented and absurd exaggeration. This is evident in the current public policy debate about the Sunrail commuter rail project in Orlando. Two examples make the point

    Exaggeration #1: Job Creation: The Central Florida Partnership claims that Sunrail will create 10,000  jobs. "almost immediately." This would be quite an accomplishment. The Sunrail project is currently projected to cost approximately $850 million for just the first segment. Every cent of the likely cost overruns will be on a blank check drawn the account of Florida taxpayers.

    At Sunrail’s claimed rate of job creation,  the Obama Administration’s $800 million "shovel ready" stimulus program (enacted in 2009), would have "almost immediately" produced more than nine million jobs. By now, the unemployment rate would have been reduced to little above 2 percent, lower than at any point in the more than 60 years of available data. Of course, and predictably, the stimulus program did no such thing, not least because a job created by public spending is likely to destroy more than one sustainable job in the private sector.

    Exaggeration #2: Sunrail Will Make a Difference: The proponents imply that Sunrail will carry a significant number of trips in the Orlando area, claiming that the line will carry one lane of freeway traffic and that it will give central Florida residents an alternative to high gasoline prices. In fact, even if Sun Rail reaches its ridership projections, it would take a full day of train travel to remove less than an hour’s peak hour freeway volume. Needless to say, no one will notice any fewer cars on the freeway (Figure).

    Further, Sunrail will not provide an alternative to the overwhelming majority of central Floridians, since it will attract only 1,850 new round-trip riders per day by 2030 (Sunrail’s number). Spending $850 million on Sunrail is the same as the taxpayers giving each new rider a gift of $450,000.

    The Need to Set Rational Priorities: All of this is occurring in the face of an national fiscal crisis so severe that even the AARP has expressed its willingness to consider cuts to Social Security. As an AARP spokesperson put it "You have to look at all the tradeoffs." Indeed.

  • Hey, Dad: Family Still Matters!

    America is getting older. Those over the age of 65, which currently account for 12% of the population, are expected to make up 20% of the population by 2030. People are marrying later, and a growing group, though still a distinct minority, is choosing not to have children. So if there are proportionately fewer traditional households, do families still matter in determining how places and regions grow?

    The answer is yes. Using Census data, with the help of demographer Wendell Cox, we determined the regions in the U.S. with the biggest increases in children ages 5 to 17 (See table below). These family hot spots, which include Raleigh, N.C. (No. 1), Austin, Texas (No. 3) and Charlotte, S.C. (No. 4), are also some of the country’s biggest job generators. Many rank highly in the fastest-growing cities in the U.S. And seven of the ten leading regions for kids also have the fastest-growing foreign-born populations.

    Take the region with the biggest increase in children, Raleigh. The North Carolina powerhouse experienced a nearly 50% jump in residents between ages 5 to 17 over the past decade. There are 70,000 more kids in the Triangle now than a decade ago. The region also experienced the second-highest overall population increase, the second-biggest surge in educated migrants and the third-highest job growth over the past two decades. It also ranked among those regions seeing the biggest jump in new immigrants.

    Texas boasts many of the strongest economies in the country, which helps make it home to many of the leading metros for kids, including Austin (No. 3), Dallas (No. 7),  Houston (No. 9) and San Antonio (No. 10). These areas have emerged as major magnets for migrants from both within the country and abroad. Dallas and Houston, for example, now get more immigrants per capita than Washington, Chicago or Boston.

    The rest of our top ten areas for kids were superstars in employment and population growth during the early years of this decade. Despite tougher times, Las Vegas (No. 2), Charlotte, S.C. (No. 4), Phoenix, Ariz. (No. 5), Atlanta (No. 6) and Orlando, Fla. (No. 8)” were all among leaders in overall population and also saw large increases in their numbers of immigrants.

    One thing these regions share is affordable housing. Throughout the real estate bubble, housing prices in Raleigh, the Texas cities and Atlanta remained low. Today, prices have also plummeted in virtually all the other markets in our top ten, reinforcing their relative affordability.

    A look at the bottom of the list also tells two stories. Some 28 of the 50 largest regions — we took out New Orleans due to the unusual circumstance of Hurricane Katrina — actually experienced an absolute decrease in the number of kids. Buffalo’s youth population dropped by almost 30,000 — a 13.6% decline. Many of the other cities at the bottom of the list came from the familiar ranks of slow- or negative-growth Rust Belt cities, including   Pittsburgh (No. 49), Rochester, N.Y. (No. 48) Cleveland (No. 47) and Detroit (No. 46).

    Other areas losing youngsters included the nation’s three legitimate megacities — Los Angeles (No. 44), New York (No. 38) and Chicago (No. 35) — as well as areas long associated with the migration of the “young and restless,” including Boston (No. 37) and San Francisco (No. 36). Unlike young adults who move to Austin and Raleigh, the “young and restless” in these “hip and cool” centers may not hang around long enough to have children.

    Jobs certainly are a big factor. Like the Rust Belt towns, most of these areas have experienced stagnant job growth or even lost employment over the decade. Another reason young families aren’t staying could be housing costs; all these cities rank among the most unaffordable in the nation. Even if you’re a family with a job, or two, it’s hard to raise the capital to make a down payment unless you have loads of stock in Google, or more likely, well-to-do parents.

    Overall, the places with the absolute fewest kids ages 5 to 17 tend to be dense core cities. Children constitute barely 1 in 10 residents in the city of Seattle.  The urban cores of San Francisco, Washington and Boston show similar low rates.

    The few kids in these regions are mostly in the suburbs.  The Seattle suburbs, for example, have 75% more kids than the city. This difference is driven both by growth in immigrants to more affordable, less dense suburban areas as well as the movements of people of child-bearing age out of the city.

    So what do the numbers suggest about the link between families and regional dynamism? Some demographers and urbanists see the shrinking percentage of families as a sign of their increasing irrelevance to regional growth. One prominent demographer even called traditional families a kind of “endangered species,” although an awfully large one given that they still number one in five households and constitute, with their kids, roughly 90 million people, or almost 30% of the population.

    In reality families are unlikely to go the way of the Dodo. As the large millennial generation, born between 1982 and 2003, enters their late 20s and early 30s, they will naturally begin to spawn. Generational researchers Morley Winograd and Mike Hais have studied millennial attitudes and have found that these young adults are much more family-oriented than Gen Xers and even their own baby boomer parents. Some 85% plan on getting married, and some 77% are inclined toward having children of their own.

    It’s also critical to expand our definition of families. Once children leave their home, parents do not suddenly become footloose, fancy-free singles; they remain parents. Often they end up moving closer to their children, or sometimes the children make a “U-turn” to be close to Mom and Dad: Grandparents, after all, make excellent, and cheap, babysitters.

    Of course, many of the more affluent and educated young adults will initially head to urban centers like New York, San Francisco or Boston as they seek potential spouses and begin their careers. But as they age, Winograd and Hais note, many of the older millennials want to establish roots in more affordable suburbs that are often closer to their work, especially ones with good schools. According to a survey by Frank Magid and Associates, a large plurality of millennials name suburbs as their “ideal” place to settle, more so than earlier generations.

    The surprising uptick in the percentage of multigenerational households also suggests a growing role for extended families. Rather than shrinking, household size is beginning to grow again for the first time in decades.

    According to the Pew Foundation, multi-generational households now make up 15% of households, up from 12% in 1980. If hard times continue this trend likely will accelerate. The percentage of single households has also started to flatten and has actually dropped among the elderly.

    So what’s the lesson here? Ignore the claims of pundits on right and left who long have predicted the demise of the family. The family will prove more important than ever in determining where people live, work and, especially, settle.

    None of this suggests a reprise of the Ozzie and Harriet 1950s. As social historian Stephanie Coontz points out, that era was an outlier created by peculiar circumstances including the Depression and the Second World War, which suppressed child-bearing, followed by a huge and sustained economic boom. For most of our history, Coontz notes, family relations in America have been far less orthodox, with grandparents, aunts, uncles, divorced parents and even siblings raising kids.

    Margaret Mead once wrote, “No matter how many communes anybody invents, the family always comes back.” Those who have children, not those who do not, define and create the future. It’s a lesson companies and economic developers would do well to learn.

    Fastest Growing Areas for 5-17 Year Olds
    Rank
    2000
    2010
    Change
    % Change
    1
    Raleigh 143,369 214,124 70,755 49.4%
    2
    Las Vegas 248,469 349,636 101,167 40.7%
    3
    Austin 223,958 307,256 83,298 37.2%
    4
    Charlotte 243,784 329,495 85,711 35.2%
    5
    Phoenix 619,044 794,609 175,565 28.4%
    6
    Atlanta 813,107 1,016,643 203,536 25.0%
    7
    Dallas-Fort Worth 1,035,311 1,276,916 241,605 23.3%
    8
    Orlando 300,729 367,908 67,179 22.3%
    9
    Houston 988,463 1,190,078 201,615 20.4%
    10
    San Antonio 353,599 418,439 64,840 18.3%
    11
    Riverside-San Bernardino 756,033 893,468 137,435 18.2%
    12
    Nashville 235,779 278,122 42,343 18.0%
    13
    Indianapolis 293,728 332,189 38,461 13.1%
    14
    Denver 402,259 453,645 51,386 12.8%
    15
    Tampa-St. Petersburg 387,074 432,851 45,777 11.8%
    16
    Salt Lake City 210,272 232,331 22,059 10.5%
    17
    Columbus 297,323 327,153 29,830 10.0%
    18
    Washington 878,018 957,157 79,139 9.0%
    19
    Sacramento 361,875 390,940 29,065 8.0%
    20
    Oklahoma City 205,122 221,354 16,232 7.9%
    21
    Jacksonville 216,124 233,109 16,985 7.9%
    22
    Portland 356,220 381,928 25,708 7.2%
    23
    Louisville 212,078 224,638 12,560 5.9%
    24
    Kansas City 356,234 376,038 19,804 5.6%
    25
    Richmond 204,359 215,599 11,240 5.5%
    26
    Memphis 249,261 255,755 6,494 2.6%
    27
    Seattle 548,711 562,461 13,750 2.5%
    28
    San Jose 309,422 317,055 7,633 2.5%
    29
    Minneapolis-St. Paul 580,592 593,309 12,717 2.2%
    30
    Miami 870,894 881,916 11,022 1.3%
    31
    Birmingham 192,830 195,263 2,433 1.3%
    32
    San Diego 525,040 520,745 -4,295 -0.8%
    33
    Hartford 205,814 204,130 -1,684 -0.8%
    34
    Cincinnati 390,704 387,109 -3,595 -0.9%
    35
    Chicago 1,772,051 1,745,047 -27,004 -1.5%
    36
    San Francisco-Oakland 676,544 660,471 -16,073 -2.4%
    37
    Boston 751,049 726,366 -24,683 -3.3%
    38
    New York 3,269,939 3,144,025 -125,914 -3.9%
    39
    Milwaukee 292,713 279,371 -13,342 -4.6%
    40
    Philadelphia 1,074,283 1,023,024 -51,259 -4.8%
    41
    Baltimore 479,250 455,157 -24,093 -5.0%
    42
    St. Louis 528,319 493,153 -35,166 -6.7%
    43
    Virginia Beach 306,209 284,872 -21,337 -7.0%
    44
    Los Angeles 2,482,750 2,301,383 -181,367 -7.3%
    45
    Providence 281,358 257,614 -23,744 -8.4%
    46
    Detroit 869,661 784,176 -85,485 -9.8%
    47
    Cleveland 403,465 360,365 -43,100 -10.7%
    48
    Rochester 200,620 177,981 -22,639 -11.3%
    49
    Pittsburgh 406,762 353,740 -53,022 -13.0%
    50
    Buffalo 213,785 184,816 -28,969 -13.6%
    51
    New Orleans 261,362 195,664 -65,698 -25.1%
    Total 28,485,719 29,560,594 1,074,875 3.8%
    Source:  U.S. Census 2000, U.S. Census 2010.   Analysis by Wendell Cox.

    This piece originally appeared at Forbes.com.

    Joel Kotkin is executive editor of NewGeography.com and is a distinguished presidential fellow in urban futures at Chapman University, and an adjunct fellow of the Legatum Institute in London. He is author of The City: A Global History. His newest book is The Next Hundred Million: America in 2050, released in February, 2010.

    Photo by shutterBRI

  • The Evolving Urban Form: Shanghai

    According to the results of the 2010 census, Shanghai’s population was nearly 1,000,000 people more than had been projected by local authorities. The provincial level of jurisdiction grew from a population of 16.4 million in 2000 to 23.0 million in 2010. Shanghai is one of the world’s fastest growing megacities (urban regions of more than 10 million population). Shanghai’s 6.6 million population growth equals the strong growth of the Manila urban region over the same period but trails the 7.4 million growth in the Jakarta urban region. Shanghai modestly extended its lead over Beijing as China’s largest urban region, where the growth over the same period was 5.8 million.

    As is typical of urban regions around the world, Shanghai’s population gain was concentrated outside the core, in suburban and exurban areas (see table at bottom). A map of Shanghai’s districts can be seen here.

    Suburban Growth: The nine suburban districts grew 69% between 2000 and 2010. The suburban areas grew from 9.5 million in 2000 to 16.0 million in 2010, adding the equivalent of the population of greater Toronto, Dallas-Fort Worth or the Rhine-Ruhr (Essen-Dusseldorf). The suburbs dominated growth, with 99.2% of the population gain

    Sonjiang, to the west of Honquiao airport grew the most, adding nearly 150% to its population. Pudong, a huge district that extends from the new edge city development across the Huangpu River from downtown all the way to Pudong Airport on the Yangtze River added 1.9 million people and now has a population exceeding 5 million (Note).


    Pudong Business District

    The Inner Core: The inner core is the all of the famous Bund, with its Western-style commercial architecture along the Huangpu River and Shanghai’s best known shopping street, Nanjing road. The three districts of the inner core all lost population. Overall, the inner core population dropped from 1.209 million to 926,000, a decline of 23%. This may seem surprising, in view of the large number of high-rise condominium buildings that have been constructed in this area. However, these buildings typically replaced higher density low rise development that was generally not up to modern standards. The inner core has a population density of 119,400 people per square mile (46,100 per square kilometer), down from 155,700 per square mile (60,100 per square kilometer) in 2000. Even so, the inner core retains a population density more than 50% above that of either Manhattan or the ville de Paris. 


    Toward Nanjing Road

    The Outer Core: The six districts of the outer core gained 6%, increasing from 5.723 million to 6.060 million people. Two districts sustained minor losses and another three made modest gains. The district of Putuo was the exception, gaining 23%. The outer core districts had a population density of approximately 60,100 per square mile, or 23,200 per square kilometer in 2010.

    Overall, the entire core grew 0.8% and accounted for 0.8% of the growth in the jurisdiction. The population density was approximately 64,000 per square mile or 25,000 per square kilometer.

    Urban and Rural Shanghai: Overall, Shanghai covers approximately 2,445 square miles (6,333 square kilometers), a land area somewhat more than that of the Statistics Canada defined Toronto metropolitan area (2,279 square miles or 5,901square kilometers). However, Shanghai’s population is nearly four times that of the Toronto area. Even so, Shanghai’s rural population remains at approximately 3,000,000 people.

    Based upon the new census count, it is estimated that the population of the urban area is approximately 20,000,000. The suburban areas, inside the urban area but outside the core are estimated to have a population density of 10,600 per square mile or 4,100 per square kilometer, well below the density of the core. Even so, this suburban density is well above that of all but a few of the urban areas of Western Europe. The suburban areas include a number of undeveloped areas that are completely surrounded by urbanization.

    Decentralized Employment: Shanghai has also developed a decentralized employment base, despite having one of the world’s largest central business districts, with 1.25 million jobs. By comparison, Manhattan has approximately 1,750,000 jobs south of 59th Street, while Tokyo has approximately 4,000,000 jobs inside the Yamanote Loop. The central business district has approximately 15% of Shanghai’s employment.

    Shanghai’s Urban Expansion: Shanghai continues to expand in virtually every direction. It is likely that Shanghai’s urbanization will mean that of Kunshan, an urban area of nearly 1.5 million people located in the Suzhou Prefecture of Jiangsu. In addition, the urbanization is also likely to soon meet that of Taicang, another urban area in Suzhou that has a population of approximately 500,000.  At least one of Shanghai’s Metro lines is planned to be extended to Taicang.

    Shanghai’s urbanization is also poised to spill across the border into the province of Zhejiang. Development is also spreading to the east and southeast in Pudong, including Lingang, which will eventually have 1 million residents. The ocean will prevent further expansion in this direction. Lingang is the point from which a 17 mile (28 kilometer) long bridge crosses one-half of Hangzhou Bay Bridge to Shanghai’s new island port, the largest in the world.

    Shanghai exhibits the same trends that are evident in other world megacities. Like Seoul and Mexico City, the inner core population density is falling. And like Jakarta, Mumbai, Manila and most other large urban areas in the world, the overall population density is declining even as population growth continues.

    Shanghai: Population by District & County (Qu & Xian)
    2010 Census
    POPULATION            
    Sector Area: Square Kilometers  Population: 2000  Population: 2010 Population: Change 2000-2010 % Change % of Growth
    INNER CORE 20.1     1,209,000       926,000      (283,000) -23.4% -4.3%
    Huangpu Qu 4.5        575,000        430,000       (145,000) -25.2% -2.2%
    Jing’an Qu 7.6        305,000        247,000         (58,000) -19.0% -0.9%
    Luwan Qu 8.0        329,000        249,000         (80,000) -24.3% -1.2%
    OUTER CORE 261.4     5,723,000     6,060,000       337,000 5.9% 5.1%
    Changning Qu 38.3        702,000        691,000         (11,000) -1.6% -0.2%
    Hongkou Qu 23.5        861,000        852,000           (9,000) -1.0% -0.1%
    Putuo Qu 54.8     1,052,000     1,289,000        237,000 22.5% 3.6%
    Xuhui Qu 54.8     1,065,000     1,085,000          20,000 1.9% 0.3%
    Yangpu Qu 60.7     1,244,000     1,313,000          69,000 5.5% 1.0%
    Zhabei Qu 29.3        799,000        830,000          31,000 3.9% 0.5%
       
    CORE DISTRICTS 281.5 6,932,000 6,986,000 54,000 0.8% 0.8%
       
    SUBURBAN 6,051.1     9,476,000   16,031,000     6,555,000 69.2% 99.2%
    Baoshan Qu 415.3     1,228,000     1,905,000        677,000 55.1% 10.2%
    Chongming Xian 1,041.2        650,000        704,000          54,000 8.3% 0.8%
    Fengxian Qu 687.4        624,000     1,083,000        459,000 73.6% 6.9%
    Jiading Qu 458.8        753,000     1,471,000        718,000 95.4% 10.9%
    Jinshan Qu 586.1        580,000        732,000        152,000 26.2% 2.3%
    Minhang Qu 371.7     1,217,000     2,429,000     1,212,000 99.6% 18.3%
    Pudong Xin   Qu 1,210.4     3,187,000     5,044,000     1,857,000 58.3% 28.1%
    Qingpu Qu 675.5        596,000     1,081,000        485,000 81.4% 7.3%
    Songjiang Qu 604.7        641,000     1,582,000        941,000 146.8% 14.2%
       
    TOTAL 6,332.6   16,408,000   23,019,000     6,611,000 40.3% 100.0%
       
       
    POPULATION DENSITY          
       
    Sector Area: Square Kilometers  Area: Square Miles  Population/ KM2: 2000 Population/ KM2: 2010 Population/ Mile2: 2000 Population/ Mile2: 2010
    INNER CORE 20.1              7.8         60,100         46,100       155,700       119,400
    Huangpu Qu 4.5               1.7        127,800          95,600        331,000        247,600
    Jing’an Qu 7.6               2.9          40,100          32,500        103,900          84,200
    Luwan Qu 8.0               3.1          41,100          31,100        106,400          80,500
    OUTER CORE 261.4           100.9         21,900         23,200         56,700         60,100
    Changning Qu 38.3             14.8          18,300          18,000          47,400          46,600
    Hongkou Qu 23.5               9.1          36,600          36,300          94,800          94,000
    Putuo Qu 54.8             21.2          19,200          23,500          49,700          60,900
    Xuhui Qu 54.8             21.2          19,400          19,800          50,200          51,300
    Yangpu Qu 60.7             23.4          20,500          21,600          53,100          55,900
    Zhabei Qu 29.3             11.3          27,300          28,300          70,700          73,300
    CORE DISTRICTS 281.5           108.7         24,600         24,800         63,700         64,200
    SUBURBAN 6,051.1        2,336.3           1,600           2,600           4,100           6,700
    Baoshan Qu 415.3            160.3            3,000            4,600            7,800          11,900
    Chongming Xian 1,041.2            402.0              600              700            1,600            1,800
    Fengxian Qu 687.4            265.4              900            1,600            2,300            4,100
    Jiading Qu 458.8            177.1            1,600            3,200            4,100            8,300
    Jinshan Qu 586.1            226.3            1,000            1,200            2,600            3,100
    Minhang Qu 371.7            143.5            3,300            6,500            8,500          16,800
    Pudong Xin   Qu 1,210.4            467.3            2,600            4,200            6,700          10,900
    Qingpu Qu 675.5            260.8              900            1,600            2,300            4,100
    Songjiang Qu 604.7            233.5            1,100            2,600            2,800            6,700
    TOTAL 6,332.6        2,445.0           2,600           3,600           6,700           9,300


    —-

    Lead Photograph: The Bund (all photos by author)

    Note: Pudong includes the large Pudong business district, which is directly across the Huangpu River from the Bund in the central business district. However, Pudong is a relatively new development and was not a part of the urban core. Moreover, Pudong extends far to the east and southeast.

    Wendell Cox is a Visiting Professor, Conservatoire National des Arts et Metiers, Paris and the author of “War on the Dream: How Anti-Sprawl Policy Threatens the Quality of Life

  • Will the Last Family Leaving Seattle Please Turn out the Lights?

    New Census data for the Seattle area’s population changes, 2000-2010, permit a preliminary look at age and at types of households in the region. Let’s look at patterns of geographic variation in selected age groups and household types for places in greater Seattle. It provides more evidence for how rapidly Seattle in particular is changing in fundamental ways.

    The data show show a fairly similar geographic pattern — a dramatic gradient from Seattle (and to a degree also the older core cities of Tacoma and Everett) through the older suburbs and out to the urban and exurban fringe. These gradients trace the shares of singles (high in Seattle, low in the far suburbs), those under 18 (low in Seattle, high farther out), husband and wife families with children (low in Seattle, high in the far suburbs), and home ownership (lower in Seattle).

    This pattern is not new. But because of growth management and the concentration of higher-density redevelopment in the core cities, the gradient is perhaps more marked than earlier. Seattle really is exceptional — amazingly high in singles, but low in husband-wife couples with children, proportions under 18, and in home ownership. Conversely, some of the far suburbs are exceptionally low in singles, and high in traditional families, persons under 18, and home ownership.

    Two related variables are young adults, those 20-35, and the share of unmarried partners, but there are some differences from each other and from the preceding variables. The share of persons 20-35 is again exceptionally high in Seattle and Everett but also on military bases, and along the 520 corridor (Kirkland and Redmond). It is unusually low in retirement communities and on islands (e.g., Vashon, Bainbridge). The share of unmarried partner households is also very high in Seattle, but also in less affluent areas, places with high minority shares, and in a few rural communities.

    The shares of population over 65 and of single-parent households also have distinct patterns. The highest shares of the elderly are naturally in retirement communities, followed by island places (Vashon and Bainbridge and Mercer Island) and some older suburbs. Low shares of older folks characterize military bases, areas with many ethnic minorities, and some younger suburbs such as Sammamish and Mill Creek, and (in contrast to many large cities) in Seattle, Tacoma, and Everett.

    High shares of single-parent families occur on Indian reservations, on military bases, and in minority ethnic areas, most notably in south King Ccounty and parts of Pierce County. Low shares of single-parent households occur, as expected, in affluent suburbs, but are surprisingly low in Seattle. These variables, in particular, attest to the continuing gentrification of Seattle, and its changing patterns of ethnicity related to gentrification and high housing costs.

    Higher shares of persons under 5 reveal areas of young families. The highest shares are in military bases and Latino towns in eastern Washington, but are quite high, over 12 percent, in the farthest suburban and exurban places around Seattle such as Duvall and Snoqualmie. They are lowest in retirement towns, on islands such as Vashon and Bainbridge, and in some college towns such as Pullman.

    Shares of persons under 18 show a similar but not identical pattern. Again they are highest in military and Latino places, and in suburban and exurban places in the metropolitan area, and lowest in university towns and in Seattle itself. This implies that while still low Seattle is not as deficient in the very youngest as it is in older children.

    The story is very different for young adults. Not surprisingly, shares 20-25 are very high in university towns, on military bases, and Seattle, and quite low in suburban, mainly residential communities, especially more affluent areas, and on islands. Middle-aged adults, aged 45-64 (the baby boomers and thus the largest age group) are high in some older residential suburbs where younger adults are less common, and low in college towns, Latino areas, and in some areas of very recent growth, as in Snoqualmie and Monroe.

    Home ownership is related to both age and household types. Rates of home ownership are extremely high, in the 90s in newer and more affluent suburbs, with mainly single family homes; the rates are lowest on military bases, college towns, and in a few less affluent suburbs, such as Tukwila. As for the city of Seattle — which has indeed changed its character in a fundamental way — home ownership has dropped to a low of 48 percent. This shift helps us understand the cleavages in Seattle’s body politic, as a formerly very middle class city adjusts to an influx of singles, renters, and young people.

    Finally, as to types of households. Married couple families with children are the historic norm. They remain traditionally high on military bases, and in the farther newer suburbs, such as Snoqualmie, Sammamish, and Maple Valley; they are low as expected in college towns, in retirement communities, and (no surprise) in Seattle—13 percent, which is really low.

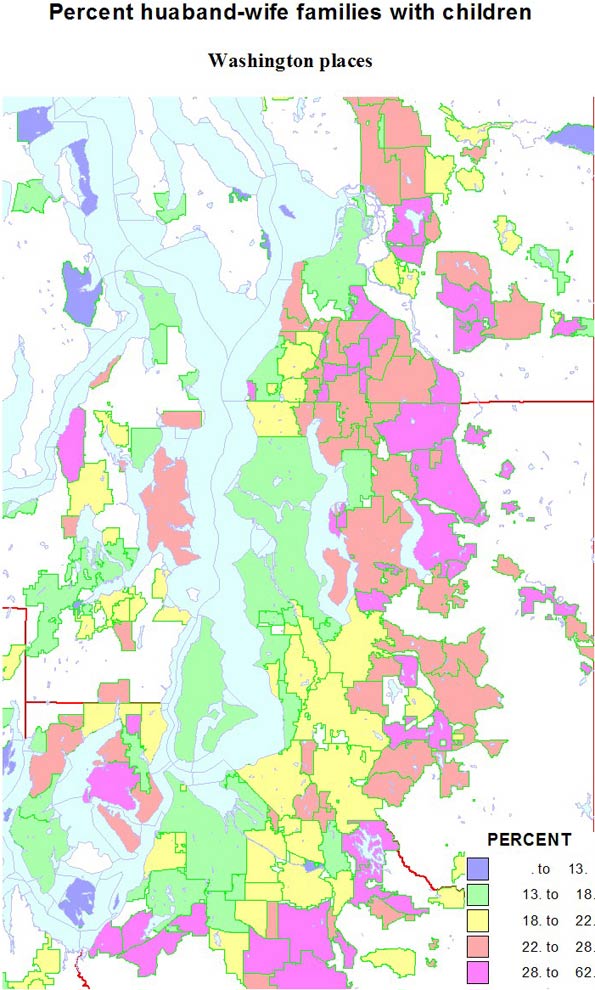
    Conversely, singles are highest in two island towns, Friday Harbor and Langley, but Seattle is an extremely high 41 percent. Shares are lowest in the same new suburbs rich in families, as in Sammamish, at 11 percent. Shares of unmarried partners are a high 10 percent of households in Seattle, but are higher on Indian reservations and the cities of Hoquiam and Aberdeen. The share of single-parent households is also high on Indian reservations, in less affluent and more ethnic suburbs like Parkland and Bryn Mawr and Tukwila. It is lowest in the newer, family-filled far suburbs.

    This piece originally ran at Crosscut.com and was edited by David Brewster.

    Richard Morrill is Professor Emeritus of Geography and Environmental Studies, University of Washington. His research interests include: political geography (voting behavior, redistricting, local governance), population/demography/settlement/migration, urban geography and planning, urban transportation (i.e., old fashioned generalist).

  • The Explosion of Oil and Gas Extraction Jobs

    From Appalachia to Alaska, the growth is eye-popping. Thousands of new jobs have sprouted up, most well-paying and all boons to their regions. There’s no denying oil and gas extraction jobs are on the rise, and not just in Texas and Oklahoma.

    North Dakota is drilling oil at a blistering pace. Pennsylvania and West Virginia, along with parts of New York and Ohio, are seeing a natural gas boom with their Marcellus Shale reserves. And Colorado, Wyoming, Alaska, and other Western states are adding extraction jobs in droves.

    The six fastest-growing jobs for 2010-11, according to EMSI’s latest quarterly employment data, are related to oil and gas extraction. This includes service unit operators, derrick operators, rotary drill operators, and roustabouts. Each is expected to grow anywhere from 9% to 11% this year, in an otherwise stagnant economy.

    But that’s not all. A mixed bag of other extraction and petroleum-related jobs—wellhead pumpers, all other extraction workers, geological and petroleum technicians—are also expected to see healthy gains. In total, nine of the top 11 fast-growing jobs in the nation are tied in one way or another to oil and gas extraction.

    Occupation

    2010 Jobs

    2011 Jobs

    Change

    % Change

    Service unit operators, oil, gas, and mining

    42,110

    46,766

    4,656

    11%

    Derrick operators, oil and gas

    23,323

    25,747

    2,424

    10%

    Rotary drill operators, oil and gas

    28,116

    30,981

    2,865

    10%

    Roustabouts, oil and gas

    75,636

    82,678

    7,042

    9%

    Helpers, extraction workers

    44,303

    47,247

    2,944

    7%

    Petroleum engineers

    29,063

    30,917

    1,854

    6%

    Biomedical engineers

    16,065

    17,061

    996

    6%

    Wellhead pumpers

    24,186

    25,616

    1,430

    6%

    Extraction workers, all other

    23,423

    24,784

    1,361

    6%

    Geological and petroleum technicians

    35,304

    37,205

    1,901

    5%

    What’s driving this employment spike? A push for increased domestic oil production is certainly a factor, as are technology breakthroughs in collecting massive shale gas deposits. But more subtle shifts are also happening, including how federal and state agencies track the oil and gas extraction workforce.

    A Prime Example

    For a case study on the skyrocketing employment picture on the shale front, just look at Pennsylvania. Without a tax on natural gas extraction and perfectly located to take advantage of the Marcellus Shale formation, parts of the commonwealth have become a hotbed for drilling. More than 3,000 wells have been drilled in the last three years, and much more is expected in coming years.

    Since 2008, Pennsylvania has added more than 15,000 jobs in the mining, quarrying, and oil and gas extraction industry, a 41% jump. Only Texas and Oklahoma have added more of these jobs in the last three years. Meanwhile, North Dakota has seen an 80% jump in employment in this sector, second only to Delaware since 2008.

    Where are these well-performing oil and gas jobs located? We mapped the data for the four fastest-growing jobs — roustabouts, service unit operators, derrick operators, and rotary drill operators. Here’s what we found: Texas and Oklahoma of course have a large percentage of these jobs, but California, Alaska, and other Western states have a fair share, too.

    The map below shows 2-year job growth in these oil and gas extraction jobs for every county in the continental US. Williams County, North Dakota is No. 1 with 1,539 jobs added, which amounts to 80% growth.

    More Than a One-Year Trend

    Mining, quarrying, and oil and gas extraction is expected to grow 6% in the US from 2010-2011. That’s the fastest projected growth among the 20 broadest-level industries—twice the rate in fact, as the next fastest-growing industry (administrative and support and waste management and remediation services,).

    This is hardly a one-year bump, though. Over the last five years, the explosion in the sector has been than staggering—even with a minor employment dip from 2009-2010. The industry added more than 345,000 jobs nationally from 2007 to 2009, and is expected add another 85,000 this year, which equals 11% growth.

    It’s also helpful to break out mining and oil and gas extraction from the broad sector to more specific industries to locate the real driver of the growth. In this case, it’s easy to see: Of the 506,401 new jobs in the sector since 2006, more than 431,000 have been in the crude petroleum and natural gas extraction industry (NAICS 211111). This sub-sector has grown by a whopping 113% nationally in the last six years while mining (except oil and gas) remains at its ’06 employment level.

    Every state except for Maine has added jobs in crude petroleum and natural gas extraction since 2006, with Texas, Oklahoma, California, and Kansas leading the way.

    The Rise of Contract Oil and Gas Workers

    In last month’s GOVERNING Magazine, William Fulton wrote about the “1099 economy”—the shift by employers to hire temporary workers who file a 1099 form with the IRS rather than a W-2 and don’t receive benefits. No other industry has seen this move to 1099 workers more dramatically than mining, quarrying, and oil and gas extraction.

    A recent EMSI analysis revealed that the share of 1099 workers in this sector increased from 33% in 2005 to 53% in 2010, the biggest percentage jump among the 20 broadest-level industries. Mining, quarrying, and oil, and gas extraction now has the third-highest share of contract workers, behind real estate (74%) and agriculture, forestry, fishing and hunting (68%).

    At least part of this influx could be attributed to land owners cashing in on royalties after leasing their property for drilling. Through the quirks of how the Census’ Bureau of Economic Analysis* tracks the oil and gas extraction industry — and how the industry data is tied to occupations — some of these jobs could be counts of landowners who are claiming additional income from oil and gas royalties. If that’s the case, these jobs would be better placed in the real estate and leasing industry.

    Please note: For these reasons, EMSI “noncovered” data (i.e., data on 1099 workers plus more traditional state data, etc.) for oil and gas jobs should be treated with caution. Also, the jobs numbers for 2010 are estimates at this point, so it will take more time to see how these trends play out.

    *The Bureau of Labor Statistics measures only workers covered by unemployment insurance and who thereby file a W-2. EMSI’s “complete” dataset adds proprietors and other “noncovered” workers by combining BLS and state data with various Census datasets.

    Joshua Wright is an editor at EMSI, an Idaho-based economics firm that provides data and analysis to workforce boards, economic development agencies, higher education institutions, and the private sector. He manages the EMSI blog and is a freelance journalist. Contact him here.

    Lead illustration by Mark Beauchamp.

  • Why Compact Cities Aren’t so Smart

    I was interested to read the views of Rick Boven of the New Zealand Institute about central and local government needing to resolve their differences about the future of Auckland.  Well, they have worked on that since the establishment of GUEDO in 2005 (now the Auckland Policy Office). 

    But that’s not what the article was really about.  Under the pretext of calling for “new ways of working together” Rick promotes urban containment and greater train travel for Auckland’s future. Well, we’ve heard all that before.

    What Rick may have noticed by way of differences is not a failure of cooperation, but growing realisation that the old prescription for a compact Auckland is not working.  And while it may pain me to say so, in this instance the centre may be looking ahead, while the city continues to look to the past.  Any differences, Rick, arise from diverging views, not from a failure to work together.

    Fallacies and frailties

    And in this case I’m on the side of the centre.

    One can’t pick away at the frailties of urban consolidation planning in one article, but consider the following propositions about the compact city:

    • A focus on centralisation guarantees congestion;
    • A focus on centralisation reduces green space and concentrates urban pollution;
    • Consolidation prejudices old infrastructure, increasing overload and the risk of failure;
    • A focus on rail transit escalates costs, reduces flexibility, and caters for only a minority of trips among even those (relatively few) households that have ready access to it;
    • A focus on rail transit commits us to developing unattractive brownfield sites with high remediation costs if we intend to increase residential densities nearby;
    • A commitment to centralisation and higher densities increases vulnerability to extreme climatic events, rising sea levels, and other natural disasters;
    • Medium to high density living is socially flawed, as it is associated with transience, increased urban crime, diminished quality of life, and loss of a sense of community, especially for households in middle to lower income brackets (and, ultimately, razing of failed apartment blocks);
    • The market does not favour medium to high density housing unless well located, well appointed, and therefore out of the price range of most households;
    • Refurbishment and restoration of inner city suburbs for higher density living leads to gentrification that displaces lower income households;
    • Mixed use developments reduce the amount and push up the price of land for business while lowering the quality of life of residents;
    • Limiting new business land and expecting to take up new employment by increasing densities on existing sites forces up business costs, reducing the attractiveness of investment and competitiveness of business.

    None of this makes compact city policies look very smart.

    Pushing for alternatives

    The current council vision is for Auckland to be the world’s most liveable city.  Well, we won’t achieve that by “me-too” urban consolidation.  Don’t forget, in the corporate world consolidation is a defensive strategy, associated with stagnation not growth, holding the line, not forging ahead.

    A better answer may be to take advantage of our distinctive physical environment and make sure that our urban form complements and takes advantage of it as we move ahead.

    Here are some very broad ideas:

    Allow decentralisation to continue.  It’s happening, don’t fight it.  Provide for it.  That means ensuring that people can meet most of their needs close to where they live.  A sustainable city won’t work without sustainable suburbs.  These should be at the heart of our plans.  And some of them might just have to spill over the urban limits.  Now there’s a real opportunity to practice some innovative urban design.

    Let the city breathe:   We want a CBD which stands out among cities.  Well, by promoting sustainable suburbs we can lay off simply playing with structures and instead seize the opportunity to restore a green (and blue) heart to our city.  A timid but worthy start was made to Queen Street with the (re)introduction of Nikau palms, but we can go a lot further than that.  Barry Lett had great idea for the radical conversion of mid-Queen Street and Myers Park into an urban garden.  What a great place to visit!

    If we take the pressure off forcing housing into the CBD, among other things, we could do a lot more of that.  We could think seriously about creating a pedestrian precinct the length of Queen Street. I would also push for my hot spots to be green – and forge walkways and cycle ways among them.  We could better Integrate the CBD with the quality areas around it.  On the harbour front we need to find ways to cross Quay Street, for example, to merge water and land.  We might start by taking note of Lambton Harbour in Wellington, and how it blends hard and soft surfaces, restores the harbour edge, and creates a place for all people. 

    Develop Smart Sub-Urbs:  Forget Jane Jacobs’ nostalgia for the lost American city.  Those images belong to another age and another place.  Our life, our cultures, and our communities are in the suburbs.  Let’s ensure that strong communities can develop and thrive around urban villages and suburban centres throughout Auckland. 

    If we are serious about sustainability, the suburbs are where it must happen. Here we can deliver smart urban design, strengthen social relationships, and provide capacity for improving the quality of life at all levels.  It’s also at a sub-regional if not suburban level that labour markets operate most efficiently, and employment opportunities might best be promoted.

    And while we’re at it, we need to make sure that the suburbs are well interconnected by generous arterial corridors. This call for some difficult retrofitting.  It may mean reviewing how we use motor-ways; thinking more creatively about buses and bus-ways; and getting over an all-consuming desire to focus everything on the CBD, turning it into a giant interchange instead of a great destination.

    Launch the Satellites: Some of the best places to live in Auckland are beyond the bounds.  We seem so desperate to cling to urban limits that we ignore the fact that people like Auckland because of what lies beyond them. Let’s see if we can encourage smart growth in places like Warkworth, Bombay, Pokeno, Wellsford and Drury, Beachlands, Pukekohe, and others.  Let our rural villages prosper, too. These are all places where we could do some exciting planning and design.  And let’s make sure that we have wide, green corridors linking them, corridors that can cater for whatever modes of transport the future might throw at them – electric cars, light rail, and the like.

    If nothing else, let’s lift the discourse so that our ideas begin to match our aspirations.  The last thing we need to do, Rick, is to get together to recycle the old stuff.

    Phil McDermott is a Director of CityScope Consultants in Auckland, New Zealand, and Adjunct Professor of Regional and Urban Development at Auckland University of Technology.  He works in urban, economic and transport development throughout New Zealand and in Australia, Asia, and the Pacific.  He was formerly Head of the School of Resource and Environmental Planning at Massey University and General Manager of the Centre for Asia Pacific Aviation in Sydney. This piece originally appeared at is blog: Cities Matter.

    Photo by Mark Benger

  • The Other China: Life on the Streets, A Photo Essay

    We all know or have heard about the overwhelming development going on in China. Journalists enthuse and analysts throw magnificent statistics of what seems to be a miracle. Yet there is little discussion of the daily life of the common people, and their struggle. There are miracles aplenty in China, but the astounding figures only partially reflect the reality.

    Thousands of people from rural areas move to the big cities of China in search of job opportunities. Strenuous work funds an often meager existence. No social security, no benefits of any kind. Like immigrants from Europe to America’s cities in last century, they often find in the streets an answer to their needs.

    In the year 2011, in the streets of Chengdu, one of the fastest growing cities in the world, many people still have no other option than fixing their dentures under the most unimaginable poor hygiene conditions. For about 20 RMB a street dentist will fix it for you.

    It takes only 4RMB to get yourself a haircut, right there, on your block.


    And add 5 RMB more to the bill for a deep, though dubious, ear cleaning in one of the many neighbourhoods in Shanghai still south side of the mass production of crystal-clad skyscrapers.

    In those neighbourhoods of all-in-one houses (all-in-one-room), the space is so reduced that the food needs to hang out of the windows. For many neighborhoods that still inconveniently survive in areas of real estate dementia and speculation of the 21st century, it may be just a matter of time until they disappear.

    In China, everything is cheap, and that wonderful home appliance that you just got in the shopping center at a ridiculous price even includes delivery costs. All stores include the cost in the price. There are hundreds of hands out there ready to take everything right to your door for a few coins.

    Real estate developments constantly reconfigure the skyline of Chinese cities selling wonderland views of the contaminated horizon of the Chinese skies. England New Town in Chengdu seems to offer it all, summed up in fantastic Chinglish phrase: “Leads a pious life by the city by view mountain keeping in good health.”

    And even though the children of some will go to the new IMAX around the corner, the people who build the miracle that others can enjoy go to the movies only at improvised movie theaters around the construction sites where they live.

    In the meanwhile, the garbage produced by the miracle accumulates in the suburbs. There are still people ready to make the most out of it.

    They never get the English right, but the Chinglish we find everyday on the streets usually defines the country’s situation better than the proper English. Protect Circumstance: Begin with me. I think Ayn Rand has some followers in the People’s Republic.

    Born and raised in Buenos Aires, Argentina, Nicolas Marino is a 33 year-old architect and photographer currently based in Chengdu, China. For the last 6 years he has chosen a bicycle as means of transport to reach the most remote regions of the world where he focuses most of his documentary work. Some of his journeys include a 10.000km ride from Tehran to Shanghai and several trips around remote and rural China where he has now cycled over 8000km.