Blog

  • Education as an Export

    A trade deficit is a negative balance between a nation’s imports and its exports, so a country with a trade deficit is spending more on imports than it is receiving for selling its exports. Is there any more that can be done to reduce this deficit over the course of time? One potential solution the US trade deficit would be to increase the attractiveness of its higher education institutions to international students, and to therefore increase the amount of money coming into the country. Money from abroad that is spent in the US, such as on tourism, or in this case, on education, is considered an export.

    President Obama identified a key element for future growth of the US economy as “exporting more of our goods,” and whilst this is a great way of decreasing the trade deficit, the actual ability of the country to create more manufactured goods or natural resources is fairly limited.
    But the US has a great potential for growth in the services sector, including financial services, licensing fees, entertainment, and telecommunications. Education could be a particularly high earner for the US, if it were prepared to put more money forward to attract international students.

    The US currently has around 691 thousand international students enrolled in higher education, with the tuition fees estimated to total around $13 billion during the 2009-10 academic year. Consider as well the cost of living for international students, and you can see that the economic impact of international students can be a major earner for the country.

    A University of California at Berkeley Center for Studies in Higher Education paper was released in support of the development of US higher education as an export. The Obama administration has set a goal of doubling export growth by 2015. Whilst this is an ambitious target, it is not beyond achievable.

    Increasing higher education for international students makes viable economic sense not only because the service itself is an extremely profitable one, but also because it will help meet future labour market and growth needs of the country, and fulfil “a diplomatic and cultural mission like no other form of trade”. International students can benefit from the experience of a well-organized educational system.

    There have been countries that have recognised this opportunity for growth and acted upon it. Australia, for example, has grown its educational market to attract more international students, although it has recently announced plans to prop up the educational system with a price hike for lower school years. It seems that the demand for Australian education has been on a steady rise, and there has been a corresponding increase in spending and development by higher education institutions. In the opinion of Michael Andrew, Chairman of Australia’s Skills and Innovation Task Force, after recognising the value of international students and scrutinizing the lengthy application process for higher education, Australia expects that the natural growth in interest will not be enough to keep maintain the industry’s economic boom.

    Andrew has highlighted the benefits of a strong educational policy which educates graduates to opportunities of forming strong links with Australian companies that currently operate in their home countries within Asia and India.

    Australia, the US and Canada would certainly benefit from working harder to encourage learning in industries that are suffering a skills shortage. Foreign students provide what’s been accurately called a ‘rich talent pool’ for industries that these countries have failed to utilize effectively.

    America and Canada differ from Australia in that their markets for labour are already quite saturated, so pushing education as an export and the advantages it can bring to the economy can be overlooked as an investment into future economic development.

    Exporting education can benefit the US in a way that not many other services can, by monetary gain, as well as by continual benefits should international students stay to ply their trades. And even those who don’t remain in the US will thereafter be advocates of the US educational system, and may inspire future generations to learn in the US. Finally, there will always be opportunities for the students to work in their own countries but under US corporations.

    Whether or not the Obama Administration will meet the targets they have set by positioning education as an export is another question in its own right. The US can not expect to grow this lucrative industry without further pushes to attract foreign students looking to learn at the higher education establishments of America.

    Either way, they are on the right track, and are onto how much of an advantage they have over other nations in the education system they can offer. With the right development and marketing, education, sold as an export, could grow to become one of the United States’ highest earners.

    Andy studied International Economics at University but now works as a freelance Search Engine Optimizer and travel advisor for All Inclusive Holidays provider Tropical Sky. Comment here or follow him on his twitter @andym23

    Photo by Evive: International Student Week

  • High Speed Rail Subsidies in Iowa: Nothing for Something

    The Federal government is again offering money it does not have to entice a state (Iowa) to spend money that it does not have on something it does not need. The state of Iowa is being asked to provide funds to match federal funding for a so-called "high speed rail" line from Chicago to Iowa City. The new rail line would simply duplicate service that is already available. Luxury intercity bus service is provided between Iowa City and Chicago twice daily. The luxury buses are equipped with plugs for laptop computers and with free wireless high-speed internet service. Perhaps most surprisingly, the luxury buses make the trip faster than the so-called high speed rail line, at 3:50 hours. The trains would take more than an hour longer (5:00 hours). No one would be able to get to Chicago quicker than now. Only in America does anyone call a train that averages 45 miles per hour "high speed rail."

    The state would be required to provide $20 million in subsidies to buy trains and then more to operate the trains, making up the substantial difference between costs and passenger fares. This is despite a fare much higher than the bus fare, likely to be at least $50 (based upon current fares for similar distances). By contrast, the luxury bus service charges a fare of $18.00, and does not require a penny of taxpayer subsidy. Because the luxury bus is commercially viable (read "sustainable"), service can readily be added and funded by passengers. Adding rail service would require even more in subsidies from Iowa. The bus is also more environmentally friendly than the train.

    Further, this funding would be just the first step of a faux-high speed rail plan that envisions new intercity trains from Chicago across Iowa to Omaha. In the long run, this could cost the state hundreds of millions, if not billions of dollars. Already, a similar line from St. Louis to Chicago has escalated in cost nearly 10 times, after adjustment for inflation, from under $400 million to $4 billion.

    Unplanned cost overruns are the rule, rather than the exception in rail projects. European researchers Bent Flyvbjerg, Nils Bruzelius and Werner Rottengather (Megaprojects and Risk: An Anatomy of Ambition) and others have shown that new rail projects routinely cost more than planned (Note 1).

    Flyvbjerg et al found that the average rail project cost 45 percent more than projected and that 80 percent cost overruns were not unusual. Cost overruns were found to occur in 9 of 10 projects. Further, they found that ridership and passenger fares also often fell short of projections, increasing the need for operating subsidies.

    Iowa legislators may well identify ways to spend their scarce tax funding on services that are actually needed.

    ______

    Note: Flyvbjerg is a professor at Oxford University in the United Kingdom. Bruzelius is an associate professor at the University of Stockholm. Rothengatter is head of the Institute of Economic Policy and Research at the University of Karlsruhe in Germany and has served as president of the World Conference on Transport Research Society (WCTRS), which is perhaps the largest and most prestigious international association of transport academics and professionals.

  • USA: A Net Exporter of Natural Gas?

    Less than a decade ago, major American energy companies were investing billions in constructing new terminals for importing liquefied natural gas — the cooled, dense state of methane that makes it economical for it to be transported by ship. Today, some of those same companies are contemplating spending billions to retrofit those facilities in order to export LNG.

    What happened in the interim? Natural gas boomed in the U.S., thanks to major discoveries of unconventional gas deposits in shale rock and new extraction techniques. In 2011, the U.S. Energy Information Administration raised its estimate for “technically recoverable” natural gas reserves in the U.S. from 353,000 billion cubic feet to 827,000 billion cubic feet. At $4 for every million BTU, natural gas isn’t that much more expensive than coal, which trades at a little over $2 per million BTU but produces twice as much greenhouse gas and significantly more air pollution.

    A “gas glut”

    Despite increased demand and a push to replace coal-fired power with natural gas, the U.S. is suffering what experts call a “gas glut.”

    “The real problem for shale gas is demand — they don’t know where to put all of it,” says Ben Schlesinger, an independent consultant to the natural gas industry. Meanwhile, Europe is paying two to three times the prices in the U.S., and countries that are entirely dependent on LNG, including Japan, Taiwan and South Korea, are paying even more — between $20 and $30 per million BTU.

    Europe also has security and political reasons for wanting access to U.S. gas. Its current primary source, Russia, has shown a willingness to use Europe’s dependence as a bargaining chip. In three of the past five winters, Russia has cut off the supply of gas to some part of Europe in a dispute over prices and other issues.

    Currently there are plans for up to three LNG export terminals on the U.S. gulf coast, and one on the Pacific coast of Canada, in Kitimat. Historically, the only LNG export facility in the U.S. was in Kenai, Alaska. LNG ships bound for Japan have departed from the terminal since the 1960s, but it’s slated to be shut down in the near future. If the first two export plants in the U.S., both converted import facilities, come online by 2015 as projected, they would be the first constructed in the U.S. in 40 years.

    The next Qatar?

    Whether or not the U.S. will become “the next Qatar,” which is the largest exporter of natural gas in the world, will depend on a number of factors. Together, these variables will determine whether investors think LNG export terminals are worth the risk, and whether or not the U.S. will even be capable of sending its bounty overseas.

    First, U.S. gas consumption must remain low. That means no “Pickens Plan” for using our natural gas reserves to fuel our trucking fleet, and no quick changeover from coal to natural gas for energy production. Second, we have to continue to drill at the rapid pace set over the past few years. More than half the natural gas consumed in the U.S. today comes from wells drilled in the last three years, and unconventional wells deplete rapidly, unlike conventional gas fields.

    Economics and more responsible drilling practices suggest that the drilling bonanza will continue, however. Pennsylvania, for example, could turn into the a state literally covered with wells. One engineer at Cornell speculated the state could eventually be home to as many as 100,000.

    “The increase [in unconventional natural gas production] has been so dramatic it’s amazing,” says Schlesinger. Ten years ago, production was a tenth what it is today, and fracking technology is evolving rapidly. If current trends in the U.S. continue — slow turnover of old power plants, reduced demand due to efficiency — it’s likely that much of that gas will be sent overseas as LNG.

    Christopher Mims is a contributor to Good, Technology Review and The Huffington Post, and is a former editor at Scientific American and Grist.org. He tweets @mims.

    Photo by jermlac

  • Biking in Minneapolis

    The sustainable biking craze seems to keep rolling as more and more cities encourage commuters and wanderers to bike across town instead of drive. New programs, such as Nice Ride in Minneapolis, offer an innovative service where one can rent out a bike for a small fee and ride it across town to other stations, or continue to hold onto the bike and continue making payments.

    Other cities are turning their spokes with similar programs: B-Cycle in Denver, a program in D.C., and Bixi in Montreal all have enough riders to sustain the businesses. While profit from these bikes may be viable, the question of sustainability and more improved quality of life still remains.

    The way Nice Ride functions is endearingly simple: one signs up for a fixed subscription (with discounts for university students) and receives a special key that can be used at any Nice Ride station. The user slips in the key, and unlocks a bike. The bike can then be ridden across town to any station in the city, any time from April to November. In June 2010 when Nice Ride began, this simple plan garnered 10,000 trips in in its first month of use. So has this new model (and increased biking in general) for urban transportation provided any gains for the public other than fatigued legs?

    It seems that the program is a perfect fit for the city’s infrastructure. The city already has 46 miles of on-street bike lanes and 84 miles of bike trails to support such a project. On top of this, the city’s bicycle culture is one of the strongest in the nation, second only to Portland, whose more temperate climate has an edge for those cyclists hoping to commute regularly.

    Something that both cities have experienced is a drop in bicycle/motor vehicle crashes as more and more people decide to utilize biking as their main source of transportation. This “safety in numbers” concept has potentially attracted more and more cyclists each year leading to not only a wider understanding of the bicycle culture present, but safer roads as respect is paid to the cyclists braving the busy roads of Minneapolis and St. Paul as well.

    The biking craze in the Twin Cities has also lead to the area being one of the cleanest cities in the world according to an article featured in Forbes. The research examined many different facets of a city’s infrastructure, including the emphasis the city places upon transportation, including biking. The article cites the city’s extensive use of bike lanes (as well as its transit and bus systems) as the major reason the Minneapolis/St. Paul area is so clean. The Twin Cities ranked fifth on the list, behind the likes of Calgary, Honolulu, Helsinki, and Ottawa.

    So while other cities may stick to the classic emphasis on automobiles, Minneapolis has shown that biking is not only a safe mode of transportation, but one that can help to clean up the urban environment as well. Not to mention the cult cycling craze that many biking cities possess seemingly unifies an active demographic into a hopeful mode for future American transportation.

  • California’s Green Jihad

    Ideas matter, particularly when colored by religious fanaticism, wreaking havoc even in the most favored of places. Take, for instance, Iran, a country blessed with a rich heritage and enormous physical and human resources, but which, thanks to its theocratic regime, is largely an economic basket case and rogue state.

    Then there’s California, rich in everything from oil and food to international trade and technology, but still skimming along the bottom of the national economy. The state’s unemployment rate is now worse than Michigan’s and ahead only of neighboring Nevada.  Among the nation’s 20 largest metropolitan regions, four of the six with the highest unemployment numbers are located in the Golden State: Riverside, Los Angeles, San Diego and San Francisco. In a recent Forbes survey, California was home to six of the ten regions where the economy is poised to get worse.

    One would think, given these gory details, California officials would be focused on reversing the state’s performance. But here, as in Iran, officialdom focuses more on theology than on actuality.   Of course, California’s religion rests not on conventional divinity but on a secular environmental faith that nevertheless exhibits the intrusive and unbending character of radical religion.

    As with its Iranian counterpart, California’s green theology often leads to illogical economic and political decisions. California has decided, for example,  to impose a rigid regime of state-directed planning related to global warming, making a difficult approval process for new development even more onerous.  It has doubled-down on climate change as other surrounding western states — such as Nevada, Utah and Arizona — have opted out of regional greenhouse gas agreements.

    The notion that a state economy — particularly one that has lost over 1.15 million jobs in the past decade — can impose draconian regulations beyond those of their more affluent neighbors, or the country, would seem almost absurd.

    Californians are learning what ideological extremism can do to an economy. In the Islamic Republic, crazy theology leads to misallocating resources to support repression at home and terrorism abroad. In California green zealots compel companies to shift their operations to states that are still interested in growing their economy — like Texas. The green regime is one reason why CEO Magazine has ranked California the worst business climate in the nation.

    Some of these green policies often offer dubious benefits for the environment. For one thing, forcing California businesses to move to less energy-efficient states, or to developing countries like China, could have a negative impact overall since shifting production to Texas or China might lead to higher greenhouse gas production given California’s generally milder climate.   A depressed economy also threatens many worthy environmental programs, delaying necessary purchases of open space and forcing the closure of parks. These programs enhance life for the middle and working classes without damaging the overall econmy.

    But people involved in the tangible, directly carbon-consuming parts of the economy — manufacturing, warehousing, energy and, most important, agriculture — are those who bear   the brunt of the green jihad. Farming has long been a field dominated by California, yet environmentalist pressures for cutbacks in agricultural water supplies have turned a quarter million acres of prime Central Valley farmland fallow, creating mass unemployment in many communities.

    “California cannot have it both ways, a desire for economic growth yet still overregulating in the areas of labor, water, environment,” notes Dennis Donahue, a Democrat and mayor of Salinas, a large agricultural community south of San Jose. Himself a grower, Donahue sees agricultural in California being undermined by ever-tightening regulations, which have led some to expand their operations to other sections of the country, Mexico and even further afield.

    Other key blue collar industries are also threatened, from international trade to manufacturing. Since before the recession California manufacturing has been on a decline.  Los Angeles, still the nation’s largest industrial area, has lost a remarkable one-fifth of its manufacturing employment since 2005.

    California’s ultra-aggressive greenhouse gas laws will further the industrial exodus out of the state and further impoverish Californians.  Grandiose plans to increase the percentage of renewable energy in the state from the current unworkable 20% to 33% by 2020 will boost the state’s electricity costs, already among the highest in the nation, and could push the average Californian’s bill up a additional 20%.

    Ironically California, still the nation’s third largest oil producer, should be riding the rise in commodity prices, but the state’s green politicians seem determined to drive this sector out of the state.. In Richmond, east of San Francisco, onerous regulations pushed by a new Green-led city administration may drive a huge Chevron refinery, a major employer for blue collar workers, out of the city entirely. Roughly a thousand jobs are at stake, according to Chevron’s CEO, who also questioned whether the company would continue to make other investments inside the state.

    Being essentially a religion, the green regime answers its critics with a well-developed mythology about how these policies can be implemented without economic distress.  One common delusion in Sacramento holds that the state’s vaunted “creative” economy — evidenced by the current bubble over   surrounding social media firms — will make up for any green-generated job losses.

    In reality the creative economy simply cannot  make up for losses in more tangible industries. Over the past decade, as the world digitized, the San Jose area experienced one of the stiffest drops in employment of any of the 50 largest regions of the country; its 18% decline was second only to Detroit.  Much of the decline was in manufacturing and services, but tech employment has generally suffered. Over the past decade California’s number of workers in science, technology, engineering and math-related fields actually shrank. In contrast, the country’s ranks of such workers expanded 2.3% and prime competitors such as Texas , Washington and Virginia enjoyed double-digit growth.

    So who really benefits from the green jihad? To date,  the primary winners have been crony capitalists, like President Obama’s newly proposed commerce secretary, John Bryson, who built a fantastically lucrative  career (he was once named Forbes’  “worst valued chief executive”) while  running the regulated utility Edison International. A lawyer by training, Bryson helped found the green powerhouse National Resources Defense Council. He’s been keen to promote strict  renewable energy  standards  that also happen to benefit solar power and electric car companies in which he holds large financial stakes.

    Other putative winners would be large international companies, like Siemens, that hope to build California’s proposed high-speed rail line, the one big state construction project favored by the green-crony capitalist alliance. Fortunately , the states dismal fiscal situation and  rising cost estimates for the project, from $42 to as high as $67 billion, as well as cuts in federal subsidies, are undermining support for this project even among some liberal Democrats.  Even in a theocracy, reality does, at times, intrude.

    Finally, there are the lawyers — lots of them. A hyper-regulatory state requires legal services just like a theocracy needs mobs of mullahs and bare knuckled religious enforcers. No surprise the number of lawyers in California increased by almost a quarter last decade, notes Sara Randazzo of the Daily Journal. That’s two and a half times the rate of population growth.

    The legal boom has been most exuberant along the affluent coast.  Over the past decade, the epicenter of the green jihad, San Francisco, the number of practicing attorneys increased by 17%, five times the rate of the city’s population increase. In the Silicon Valley, Santa Clara and San Mateo counties boosted their number of lawyers at a similar rate. In contrast, lawyer growth rate in interior counties has generally been far slower, often a small fraction of their overall population growth.

    If California is to work again for those outside the yammering classes, some sort of realignment with economic reality needs to take place.  Unlike Iran, California does not need a regime change, just a shift in mindset that would jibe with the realities of global competition and the needs of the middle class. But at least with California we won’t have to worry too much about national security: Given the greens anti-nuke proclivities, it’s unlucky the state will be developing a bomb in the near future.

    This piece originally appeared at Forbes.com.

    Joel Kotkin is executive editor of NewGeography.com and is a distinguished presidential fellow in urban futures at Chapman University, and an adjunct fellow of the Legatum Institute in London. He is author of The City: A Global History. His newest book is The Next Hundred Million: America in 2050, released in February, 2010.

    Photo by msun523

  • Orlando’s Sunrail: Blank Checks Induced by Washington

    We are supposedly living in an age of austerity, but many federal programs are leading many states into overspending and potential fiscal insolvency.  Transit spending is a case in point, as is indicated by the proposed Orlando Sunrail commuter rail project.

    How Washington Induces Higher State and Local Spending: For decades, the federal government has encouraged state and local governments to build expensive projects, as is the case in Orlando. Under the Federal Transit Administration (FTA) "New Starts" program, state and local governments can obtain federal funding for such projects, contingent on their taxpayers providing "matching funding." This can be in the form of higher taxes, budget increases or in unplanned subsequent expenditures that are higher than projected. The responsibility for cost overruns and operating subsidies belong exclusively to state or local taxpayers.

    Inaccurate Cost Forecasts: This can prove very expensive. European researchers Bent Flyvbjerg, Nils Bruzelius and Werner Rottengather (Megaprojects and Risk: An Anatomy of Ambition) and others have shown that new rail projects routinely cost more than planned (Note 1).

    Flyvbjerg et al found that the average rail project cost 45 more than projected and that 80 percent cost overruns were not unusual. Cost overruns were found to occur in 9 of 10 projects. Moreover, they found that despite increased attention to these cost blow-outs, final costs continue to be far above the projections presented to public officials and the taxpayers at approval time. Further, they found that ridership and passenger fares also often fell short of projections, increasing the need for operating subsidies.

    Moreover, urban rail systems are of questionable value. Transport economist Clifford Winston of the Brookings Institution has noted that "the cost of building rail systems are notorious for exceeding expectations, while ridership levels tend to be much lower than anticipated" and that "continuing capital investments are swelling the deficit." 

    Federal policies, however, often force state and local taxpayers to guarantee the accuracy of notoriously inaccurate cost projections. The standard FTA "full funding agreement," a prerequisite for federal funding, requires state or local taxpayers to pay for any cost overruns. Further, if the projects are not completed, state and local taxpayers are required to pay back the federal grants (more on Florida’s experience with that later).

    Sunrail: The "Sunrail" commuter rail project is planned to parallel Interstate 4 in the Orlando metropolitan area. From the perspective of Florida taxpayers, the tragedy is that the project has proceeded so far. Project forecasts say that in 2030, Sunrail will add only 1,850 new round trip riders daily to Orlando’s already sparse transit ridership (barely half a percent of travel). Even if all Sunrail trips were for employment, it would not even be a "drop in the bucket" in a metropolitan area likely to add more than 400,000 jobs by 2030. Further, despite inferences to the contrary, this will have less than negligible impact on traffic congestion. It is likely that traffic on Interstate 4 will increase by at least 100,000 cars daily by 2030 (Note 3), many times the cars that Sunrail could possibly remove, even under its probably exaggerated ridership projections.

    Sunrail also will do little to increase job access to jobs in a metropolitan area where less than two percent of employment can be reached by the average commuter in 45 minutes using transit, according to Brookings Institution research. By contrast, at least more than 80 percent of jobs in the Orlando metropolitan area are reached in 45 minutes by car, and more than 55 percent in 30 minutes. Despite the high costs of all this and Sunrail’s negligible effect on regional mobility, politics may preclude cancellation of the project.

    Sunrail’s first phase is projected to cost $350 million (after a half-billion dollar right-of-way purchase). The Federal Transit Administration intends to pay a maximum of $175 million for the project. State taxpayers (through the Florida Department of Transportation) will be required to match that funding with another $175 million, though that amount could grow.

    Florida Taxpayers Already Burnt Once: In addition in paying for likely Sunrail cost overruns, Florida taxpayers would be obligated to fund service levels that satisfy the Federal Transit Administration. Otherwise the federal government can demand that taxpayers send the money back. This is no idle threat. When the Miami commuter rail system (Tri-Rail) provided service levels deemed insufficient, FTA demanded a return of $250 million in federal grants. This repayment was averted only by a state bailout that provided up to $15 million in annual subsidies to increase the service levels (Note 2).

    Essentially then, to obtain federal funding for Sunrail, Florida taxpayers must write a blank check out to a rail construction industry that has repeatedly demonstrated an inability to build rail projects for promised amounts.

    Negotiating a Way Out? Florida taxpayers, however, may have some options to avoid writing the blank check. In March, the US Department of Transportation (USDOT) desperately sought to find governments in Florida willing to provide a blank check to fund the now cancelled Tampa to Orlando high-speed rail line, with costs that were so low that they had "big cost overruns" written all over them.

    In a February 27 letter USDOT told local officials the federal grant repayment provisions were negotiable. Based upon this policy latitude available to USDOT, Florida officials could seek less unreasonable terms with USDOT. For example, a revision might be negotiated to limit Florida’s cost overrun liability to amounts resulting from state actions. Further, Florida should seek agreement that it does not have to operate service levels that are greater than required by demand or can be afforded. This would prevent a repeat of the unhappy Tri-Rail experience.  

    Provisions such as these would provide important protections to Florida taxpayers, who could otherwise be forced to pay hundreds of millions in cost overruns and higher operating subsidies and potentially higher taxes.

    Lessons for Taxpayers: Projects like Orlando’s Sunrail provide important lessons for the nation. The stimulus, now winding down, boosted questionable spending policies well outside the Beltway. Washington needs to stop writing blank checks on taxpayer accounts. It’s time for the feds to stop inducing state and local governments to mimic its fiscal irresponsibility.

    —–

    Notes

    1. Flyvbjerg is a professor at Oxford University in the United Kingdom. Bruzelius is an associate professor at the University of Stockholm. Rothengatter is head of the Institute of Economic Policy and Research at the University of Karlsruhe in Germany and has served as president of the World Conference on Transport Research Society (WCTRS), which is perhaps the largest and most prestigious international association of transport academics and professionals.

    2. The Florida Department of Transportation has made agreements local governments to participate in funding of Sunrail cost overruns. However, in the event that local governments are unable to pay their share, it may be expected that the state will pay, as it did in bailing out Miami’s Tri-Rail (discussed above).  

    3. Assumes that automobile traffic would grow at the projected population growth rate (based upon University of Florida population projections). 

    —–

    Wendell Cox is a Visiting Professor, Conservatoire National des Arts et Metiers, Paris and the author of “War on the Dream: How Anti-Sprawl Policy Threatens the Quality of Life

    Photo: Downtown Orlando (by author)

  • Wind Energy is Not Just Hot Air

    Anaheim Convention Center, Southern California, last week was a hot bed of one of the ultimate forms of renewable energy. The “fuel” used by wind turbines (really the wind) is free for the 30 year life span of the windmill installation, is considered inflation proof, and is 100 % domestically available.

    Just a brief walk through the trade exhibition convinces any visitor of European as well as Chinese commitment to wind energy. One guest speaker, Ted Turner put it: “Just do not look at the next 30 years, look for at least a few hundred years of human energy needs.”

    Conventional energy lobbyists claim that wind is unreliable and will harm operation of the grids. However, grid operators have observed that wind power is more reliable and predictable.

    There are rumors that sound of operating wind will cause a variety of dangerous health effects, including headaches and disturbed sleep. The studies have shown that wind turbines at a distance of 2,000 feet (normal building codes for Wind Mills) have a dB rating close to 45 (comparing that to 55 in an average home in the USA). Normally, two people can carry on a conversation on any wind mill farm. Please remember: this energy source has no side effects such as air or water polluting emissions, no hazardous waste, and has a direct impact on reducing the public health impact of any other energy generation.

    Are birds get affected by wind energy? A very legitimate question by the American Bird Conservancy needs to be addressed with honesty. The bird loss caused by buildings is about 550 million, by power lines 130 million, vehicles 80 million, poisoning by pesticide 67 million, and radio and TV towers close to 4 million. The tabulated loss by wind is under 150,000. Special attention is being paid to bats: The bats and wind energy coalition was formed in 2003 by Bat Conservation International, the U.S. Fish and wild life Service, and the National Renewable Energy Laboratory.
    The view of a wind energy facility or the distance of a home from a wind mill farm had no consistent, measurable or significant impact on home values.

    The current worldwide installed capacity gives a snap shot of Wind energy penetration in a given region. By 2010, the European Union was leading the world with 84,000 MW, China with 42,000 MW and the USA was at 40,000 MW. However, Denmark leads the world as percentage of total power needs fulfilled by Wind Energy: close to 20 % in 2010.

    The potential of up to 20 % electricity generation that can be derived from Wind Energy is feasible, both technically as well as financially by 2030. Most land used to construct wind farms can be used for its original purpose of harvesting, grazing and farming. The actual foot print of turbine farms, roads and generating and transmitting facilities is under 3 percent of total land taken out of commission.

    Wind Energy should be debated in the public forum with both energy independence and long term sustainability for our planet beyond the next election cycle.

  • UN Celebrates Seven Billion People a Year Too Early

    The UN has decided to announce that on October 31, 2011 the Earth’s human population will pass the seven billion mark, up from the six billion that was designated on December 5, 1998. The United Nations Population Division Agency is the main organization that estimates global population. Every two years, their report attempts to piece together surprisingly fragmentary national census data and demographic surveys to arrive at a global estimate. As a geographer, I have long been interested in these reports, and in all aspects of population change and distribution on the earth.

    The UN report is subject to a variety of interpretations, but the main news story has been that a revised methodology projects a global population of 10.1 billion in the year 2100, driven most notably by continued rapid population growth in Africa. This will be a call to arms for population planning programs to increase funding targeted in Africa, along with a new round of debate over the long term sustainability of seven billion people.

    The numbers reveal mostly positive news for those concerned about population growth and hoping for a leveling off of population (achievement of zero population growth). First, the aggregate global estimates from 1950 to 2010 show that the rate of global population growth peaked in 1969 at 2.12% per year, and has now declined to 1.15% per year. This means that population growth has been slowing down for the past 42 years.

    In addition, the absolute annual increase in population peaked in 1988 at 89.63 million and has declined to 78.152 million in 2010. The overall dynamic is a deceleration toward a leveled-off population this century, with some uncertainty as to whether the peak will be eight, nine or ten billion persons.

    We are going from a preindustrial world of a half billion people to a post industrial, urbanized one of seven to ten billion with a global economy hundreds of times larger than the one in the year 1800. Seven to ten— is it too casual to give or take three billion? The difference is not as large as it sounds, since most human activity is concentrated on ten percent of the surface.

    That’s because three quarters of the Earth’s surface area is covered in ocean and ice, and of the dry land, sixty percent of that consists of tundra, deserts, boreal forests and other lands that have very low population densities. As a result, the difference between a world of 7 billion and one of 10 billion is 350 persons per square mile compared to 500 per square mile of settled land. To put the difference in perspective, look at the densities of France, at 296 per square mile, compared to that of Italy, at 521 per square mile. Passing the seven billion mark, or hitting 10 billion, doesn’t call for some fundamental reckoning, or indicate that we’ve reached a carrying capacity ceiling.

    Still, given that UN numbers are estimates, how accurate are the projections for Africa? Table #1 shows the 2010 estimates for the five regions of Africa, and the 2050 and 2010 projections. While East and West Africa combined represent 9 percent of global population and land area, this last frontier of population growth is interesting. The estimates indicate dramatic growth from 1950 to 2010. Population in North, South and Middle Africa as a group have peaked, while East and West Africa are still accelerating. (The other 91 percent of the globe is 80 percent of the way to the UN’s population peak in 2058 and is basically done with population growth.)

    The dynamics of global population change are becoming focused on East Africa and West Africa, the two regions which together comprise about forty percent of the land area of Africa. With the rest of the world experiencing a mix of modest population growth and decline, East and West Africa are projected to experience 94 percent of future global population growth. Even with a more likely scenario of a leveling off at 1.523 billion rather than going on to a very large 2.14 billion, East and West Africa will still represent the largest demographic change story of the 21st century.

    Do East and West Africa have some demographic similarities with China and Latin America back in 1960? If so, as has been seen around the world, fertility declines from 6 to 2 children per mother will happen much more quickly than the UN 2011 projections suggest. Given that African real economic growth of 57% has been robust in the last ten years, including a 29% gain in real per capita income, there is evidence that the continent is slowly emerging out of a poverty trap. Africa is also rapidly urbanizing, and demographic surveys conclusively show a big difference in the fertility rates of women living in urban areas as opposed to rural ones. East and West Africa represent a very interesting final chapter in modern population growth, with the challenge to use land and fresh water efficiently and protect significant wildlife resources, while potentially becoming an economic powerhouse later into the century.

    The story will be interesting and important to follow. In the next forty years, East and West Africa, along with South Asia, will be the big population growth centers, while the rest of the world will increase very slowly. Even with dramatic economic growth, urbanization, and a doubling of population in East and West Africa in the next few decades, the global population could very well level off at 8.8 billion rather than 10.1 billion.

    Back to the estimates themselves: The UN pieces together a global story from a set of data and estimates from countries with infrequent censuses. Table Two shows official national census estimates for 31 countries, which represent about 60% of the global population. Most of the census results are coming in below UN projections.

    Assuming that the rest of the world’s nations that have not conducted recent censuses have similar overall projection problems, one could infer that the actual population is at least one percent lower than the UN 2011 estimates. If we just assume the UN population growth rates for 2010-11 are accurate, and project these 31 country census results forward to July 1, 2011, we get a population of 6.9 billion people. We would then estimate that the world population would hit 7 billion in October, 2012.

    So why is the UN declaring October 31, 2011 as the day of 7 billion? While nobody knows what the true world population is, perhaps the UN should err on the side of accuracy… and put off this announcement until 2012. A delay would increase the probability that we actually have crossed that symbolic threshold, something for all people on earth to reflect upon.

    Ron McChesney is a Geographer who founded a research firm called Three Scale Strategy and a related non-profit called Three Scale Research. The company studies and reports on the economy of the state of Ohio and how Ohio interacts with the rest of the world. His research interests include the study of patterns and changes in population, land use, economics, energy production and transportation.

    Data Sources: UN Population Division, International Monetary Fund, Geohive.com

    Photo by etrenard, “Niger Portrait”

  • Transportation Infrastructure: Yankee Ingenuity Keeps California Moving

    A friend was explaining some philosophy to me the other day and he used an analogy to make his point: If you can get a cannibal to use a knife and fork, is that progress? Of course, the answer is "no". So when I heard the next day that transportation infrastructure performance in the US improved significantly at the height of the worst recession since the great depression I had to ask: is that progress?

    We do not want to stop all economic progress just so that a privileged few with access to resources may enjoy an easier ride on the I-95 interstate highway between Wall Street and Congress. Stopping economic growth is not a solution to the problem of crumbling infrastructure in America.

    In fact, my economic analysis shows that transportation infrastructure is a “leading indicator” of economic activity. In other words, infrastructure performance has to improve for a while – and stay improved – before economic activity will pick up in an area. Alternatively, infrastructure performance would have to decline for a while before businesses would leave that location, too. Think about it this way. From the perspective of a company already in business in a particular location, they would not pack up and leave town the first day that, for example, traffic congestion slows down the delivery of products to their customers. Companies like FedEx Freight plan distribution locations 20 years in advance. For a while, they will find a way around congestion. FedEx Freight uses elaborate technology to “route trucks around huge bottlenecks, but this adds circuitous miles and costs”. Their policy is to “minimize the impact as best you can.”

    We see evidence of how business finds a way to make it work even when government and infrastructure try to stand in their way. California ranked 43rd in 1995 and fell further to 47th in 2000 and 2007 among the 50 states (plus D.C.) in the U.S. Chamber of Commerce’s transportation infrastructure performance index. Although California’s infrastructure is crumbling, businesses are finding a way to work around it. California’s economy could grow faster than the rest of the US economy this year.

    In economics we talk about the efficient use of resources – getting the most out of what you have to work with. In a new study getting underway at the University of Delaware, early results indicate that businesses are operating successfully in the United States despite being hampered by problems like congestion and the lack of intermodal-connectivity (that is, being able to move products from trucks to trains and from trains to ships). California, in fact, may be a benchmark state for economic efficiency. They rank at the bottom for infrastructure performance but business is finding a way to make it work.

    My old pal, Larry Summers – former Economic Advisor to President Obama and subverter of all things economic – took a last final swipe at spending on transportation infrastructure in April 2011. In his first public appearance at Harvard University after leaving the White House, he talked about investment in infrastructure as a way to “…tackle high levels of unemployment, especially among the low-skilled.” He just doesn’t get it. He continues to believe that the way to stimulate the economy is to give tax breaks to business – as if they will build their own roads. He just didn’t get that infrastructure is what supports all economic activity. It’s the stuff that business does business on, not the classical economic “capital” that business brings to the table.

    In fact, it costs businesses to have to work around the crumbling infrastructure. When you ask academic, government and researchers to measure that cost, you get a wide range of views about what constitutes a direct or an indirect cost to business from traffic congestion. But some of these costs are undeniable. There is a cost of computer technology for monitoring congestion; the cost of employees for communicating with drivers about alternate routes; the cost of extra fuel; driver overtime resulting from congestion; refunds to customers for missing guaranteed delivery deadlines, etc. etc.

    So, there’s a benefit to business from improving the performance of transportation infrastructure. They will be saving the money that they are spending now to work-around the infrastructure. And money not spent is at least as good as a tax break.

    Disclosure: Dr. Trimbath’s research on the economic impact of transportation infrastructure performance was supported by the National Chamber Foundation and sponsored in part by FedEx Freight. The 2009 Transportation Performance Index will be released on July 19, 2011 in Washington, D.C. It will show a substantial improvement over 2008.

  • Inside Sydney’s Central Business District: the Retail Core

    World famous for its beautiful harbour setting, Sydney’s Central Business District is undergoing a resurgence. As the hub of Australia’s finance sector, it stumbled during the global crisis. Office vacancies jumped from 5.7 per cent in early 2008 to 8.8 per cent in mid 2009, despite stable supply. Ultimately, though, Sydney was spared the worst, owing to its rise as a staging post for trade and investment in the Asia-Pacific region, which averted the havoc of Europe and North America. Recovery is now underway, if slowly. White-collar employment is picking up and the vacancy rate is down to 7.3 per cent. Landlords are again celebrating the prospect of rising rents.

    But there’s a bigger story. This revival is happening amid some notable trends. Post-crisis, the CBD’s functional map is being redrawn by a wave of Asian and other visitors and investors, prominently listed property trusts and pension funds looking for a safe haven, the spatial demands of a transformed white-collar workplace, intensive residential development on the CBD fringe and officials pushing flashy “green” projects. There’s no doubting the importance of these developments, or that they will be hyped by inner-city based media.

    In fact, central Sydney has been losing economic clout, in relative terms, to the periphery or suburban hinterland for some time, a polycentric trend observed in other countries. Between the 1981 to 2001 censuses, encompassing the most active period of economic liberalisation in Australia’s history, Sydney’s general population growth was 23 per cent, while outer areas in Greater Western Sydney grew by 38 per cent. The CBD’s share of Sydney’s jobs shrunk from around 30 per cent to 9 per cent during this period. Four of the five strongest growing Local Government Areas (LGAs) in the year to 30 June 2009 were still in the outer west: Blacktown, Parramatta, The Hills Shire and Liverpool.

    The latest wave of change will prove significant and long-lasting, but the CBD isn’t destined for a return to metropolitan supremacy.

    Sydney CBD
    Sydney CBD

    The retail core

    For theorists of the CBD, peak land value intersection (PLVI) is a pivotal concept. This is the centrally-located point, usually at the intersection of two thoroughfares, where land values are highest. Without doubt, Sydney’s PLVI is the intersection of George and Market Streets. George Street is the CBD’s spine, traversing a north-south axis from Circular Quay to Central Station. Historically, Market Street was the critical entry route from the west, extending from the defunct Pyrmont Bridge (over Darling Harbour), and now from a branch of the Western Distributor. Blocks surrounding the PLVI are typically occupied by upscale department stores, absorbing peak land prices with high turnover of quality goods on multiple floors. Thus Myer and Gowings stores occupy the north-east and south-east corners respectively, and David Jones a site further east along Market Street (the Gowings site is earmarked for refurbishment as a boutique hotel). The iconic Queen Victoria Building arcade sits on the south-west corner.

    According to the “core-frame model”, another tool of CBD theory, activities competing for the highest rents, like upmarket retail and superior grade office towers, concentrate in core blocks, while marginal activities disperse to peripheral blocks. In terms of the theory, the latter are a “zone in transition”, at an intermediate stage between lower grade building stock and future redevelopment. Activities like low-end retail, fast-food, novelty shops, pawnbroking, wholesaling, storage, off-street parking, warehousing and light-manufacturing locate there.

    Traditionally, Sydney’s CBD had a retail core around the PLVI bounded by York, Park, Elizabeth and King Streets, south of an office core bounded by King, Clarence and Macquarie Streets and Circular Quay. Judging by the headlines, the retail core is Sydney’s biggest news. Long a feature of suburban life, the CBD is being transformed by the arrival of mall-style shopping, adding to the mix of department stores, arcades and stand-alone shops. In some ways, it’s catching up with the social evolution of shopping as a “complete experience” linked to identity formation.

    The catalyst is Westfield’s $1.2 billion development at the corner of Pitt Street Mall and Market Street, just a block east of the PLVI. A pedestrianised section of Pitt Street between King and Market Streets (not a regular mall), Pitt Street Mall is the retail core’s epicentre. Last year, global real estate firm CB Richard Ellis (CBRE) rated it the second most expensive street for retail rents in the world. The first was New York’s Fifth Avenue.

    With rents so high, investment dollars are pouring in. Fronting the eastern side of Pitt Street Mall, Westfield’s contemporary glazed-glass structure, box-like at street level but topped by Sydney Tower, converts four properties into 93,000 square metres of retail space, distributed over a six-storey shopping mall. The first stage opened last October. On completion, it will house 330 flagship and specialty fashion outlets, and lifestyle stores, most of them international brands, including Sydney firsts Versace, Gap, Zara and Miu Miu, together with several eateries. Two skybridges link the complex to nearby Myer and David Jones department stores.

    Westfield’s opening coincided with a general revamp of Pitt Street Mall, featuring landscaping, paving and tree-planting by Sydney City Council, and reconstruction of the mall-like Mid-City Centre, 52 shops on four-levels fronting the Mall’s western side, almost opposite Westfield, penetrating west to 420 George Street. One Mid-City store, jewellery retailer Diva, is reputedly paying the highest rent in the CBD, $13,500 per square metre a year.

    Pitt Street Mall’s face-lift set off a reshuffle of fashion and luxury goods retailers around the retail core, with knock-on effects all the way up George Street. Burberry is moving to refurbished premises at 343 George Street, Louis Vuitton to a new flagship store on the corner of King and George Streets, Dior to Castlereagh Street, and Zegna and Prada to Westfield, from Martin Place. This follows the 2008 opening of the world’s largest Apple store, at glass-clad 367 George Street (roughly opposite Mid-City at 420).
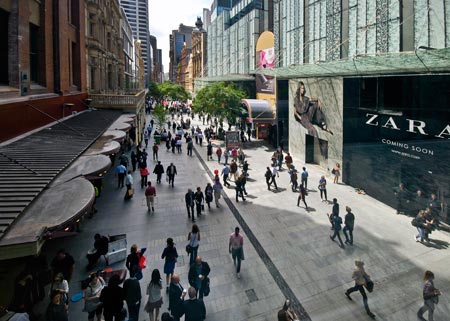
    Pitt Street Mall
    Pitt Street Mall

    A sign that the retail core may be busting out of its old confines, and creeping north of King Street, major retail developments are planned in the vicinity of Wynyard railway station, at 301, 333 and 383 George Street. Some of these anticipate the most striking proposal yet: a futuristic commercial and residential precinct on the foreshore of East Darling Harbour, or Barangaroo, seeing the retail core spill into the CBD’s rising “western corridor”, which was a "zone in transition" in the days when Darling Harbour and Walsh Bay were working ports. This $6 billion plan includes 30,000 square metres of retail space and a pedestrian walkway to nearby Wynyard, the CBD’s busiest underground station.

    It’s easy to explain such hyperactivity. Sydney is one of a handful of global cities in a developed country which wasn’t flattened by the financial crisis. There’s a clear international dimension to the CBD’s resurgence. According to Cushman & Wakefield’s International Investment Atlas 2011, the Asia-Pacific is dominating global property investment. Ranked eleventh, Sydney joins 6 other Asia-Pacific cities in the top 20. In the 18 months to June 2010, reports CBRE, Sydney ranked fourth in the world in terms of cross-border investment. Foreign investors accounted for 42 per cent of Australia’s property asset acquisitions in the third quarter of 2010, way above the typical level of 10 to 15 per cent. In these conditions, Sydney shot up to ninth out of 65 cities in AT Kearney‘s 2010 Global Cities Index. And a 2010 survey by real estate agents Jones Lang La Salle rated Tokyo and Sydney the most popular Asian cities for investment. At a time when many asset classes carry outsized risks, Australian commercial property is a safe option.

    Of course, there’s nothing new about Asian investment in the retail core. Three of its most fashionable shopping arcades belong to Ipoh Pty Ltd, which is owned by a Singaporean fund manager: the Queen Victoria Building, The Strand Arcade between Pitt Street Mall and 412-414 George Street, and The Galleries, on the corner of George and Park Streets, the core’s southern edge.

    But urban planners would be wrong to overestimate the impact of all this on the wider metropolitan region. Quite clearly, Westfield’s target market embraces a small minority of Sydney’s 4.5 million residents. Commenting on the mall’s opening, the Group’s managing director hoped it would be a “destination for the people of Sydney, and the 26.8 million domestic and international visitors who come to Sydney each year”. The Australian Financial Review, citing Westfield, reported that it will “service not only 240,000 workers in the [CBD], but 1.5 million in the primary trade area across the richest suburbs and the 26 million tourists who visit the city each year”. David Jones’ CEO expressed similar sentiments, saying “my hope is that Sydney’s CBD retail precinct becomes a world-class shopping destination on a par with the world’s best such as Oxford Street, London, and Rodeo Drive in LA”.

    Much of the investment surge is predicated on large numbers of visitors, and the growth of inner-suburbs ringing the CBD. If the travelling patterns of China’s newly cashed-up middle class are any guide, for instance, these hopes won’t be disappointed. The number of Chinese visitors to Australia is forecast to grow by 7.9 per cent a year, reaching 783,000 a year by 2019. Meanwhile, Sydney LGA’s population is ballooning (the CBD and environs). Between 2001 and 2009, it grew by 38 per cent, or 49,000 new residents. Eager to meet the former state government’s target of 55,000 new residential units over the next decade, Sydney Council is presiding over a number high-density projects on derelict industrial or recreational sites. Most of the newcomers will belong to the same demographic as current residents, younger, upper-income professionals with a taste for inner-city living. They are no cross-section of Sydney’s population. Below average in age, their median weekly income is $717, compared to $518 for the whole metropolitan region.

    To an extent, Sydney CBD is exhibiting features of the global city phenomenon, when highly-developed zones “secede” from their hinterland and develop stronger ties to distinct occupational classes and overseas markets. The revitalised retail core is unlikely to lure the vast majority of shoppers — who live and work far from the CBD — away from suburban megacentres like Chatswood Chase, Miranda Fair, Warringah Mall, Castle Towers, Minto Mall, Top Ryde City, Westfield’s other centres at Bondi Junction, Parramatta, Burwood, Hurstville, Hornsby and Penrith, local retail strips, or the growing number of Australians who shop online. Just as suburban malls attract customers from their surrounding feeder population, the same applies to the retail core, but with a higher proportion of domestic and foreign visitors.

    The CBD’s revival shouldn’t be misinterpreted. It doesn’t herald a return to regional primacy. Calls by green-tinged academics and newspaper editors and columnists for billions to be spent on CBD-centric rail networks are wrongheaded. Such plans can only have a distorting and negative effect on economic vitality across the metropolitan region, especially fast growing outer LGAs. Look at the CBD’s story. For all the contemporary rhetoric linking urban success to green amenity, it owes more to plain old capitalism.

    John Muscat is a co-editor of The New City, where this piece originally appeared. 

    Photo by Christopher Schoenbohm.