Blog

  • Condo Culture: How Florida Became Floridastan

    Welcome to Griftopia. The Florida housing industry needs a karmic rebalancing. Our recent roar of building new structures is echoed today by the squeaks and pops of a different type of construction industry. Invasive testing – the architectural equivalent of a biopsy – seems to be on the rise. Saws, hammers, and cranes can be heard through the quiet suburban developments and subdivisions around Florida, as shingles and stucco are cut off in small patches to reveal serious problems within.

    Like the hidden defects in mortgage-backed securities and other arcane instruments of finance, these flaws are covered up and papered over, but are no less damaging. They are also just as revealing about our collective haste to accommodate growth.

    Few other places saw as much suburban expansion as Florida did, beginning in the 1990s and lasting right up until the bursting of the 2008 real estate bubble. Old hands in the Florida real estate development game see the cycle as never-ending, stretching all the way back to Ponce de Leon, whose “fountain of youth” was perhaps the state’s first marketing gimmick. The most recent bust, however, provides important lessons, should future cycles include speculators and regulators alike feeding at the trough. Rapid growth breeds errors, compromises, and sloppiness which have dire, lasting consequences.

    Pundits are assigning blame for the Millennial Depression up and down the economic ladder, and certainly the Florida housing boom and bust provides many examples of all that went wrong. The largest developers, driven by stockholders and Wall Street to seek rapid growth and high profits, gambled that Florida’s population boom would last forever. With the good addresses already taken, “B” properties close to interstates, under flight paths and adjacent to sensitive wetlands began to see activity. Low density reduced the developers’ risks and reduced construction costs, as well.

    The Florida condominium – outwardly appearing as an apartment complex — was a home ownership product for the masses. As long as the product lasted 30 years (or however long it took to pay off the mortgage), no one much cared about its quality and stability as an asset. Anonymous, stick-built stucco boxes, baking in the Florida sun, seemed the perfect solution to meet the demands of stockholders and investors, and the regulatory pathway was smoothed over to keep the production line rolling.

    Immigrants from abroad and from other parts of the country bought their own piece of the American Dream: gated entries, warrens of tight garages, patches of St. Augustine grass, buggy-whip sized oak trees and tightly wrapped stucco and glass boxes. Balconies are common, although the tiny decks and the heat preclude much enjoyment of the outdoors. Designed to prevent neighbors from meeting or children to freely play, these contemporary cracker box condos sullenly sweat in the heat. Still, they gave a much-needed step-up for the vast service workforce looking for a way out of the rental market and into an ownership position, and buyers can perhaps be forgiven for overlooking the cheapness of construction in favor of a new way to prosperity and success.

    The demand, however, outstripped the ability to deliver. Design and construction delays simply due to over-commitment and lack of manpower meant that corners were cut, compromises were made, and slop was tolerated. It was as if the investment mania on Wall Street – in journalist Matt Taibbi’s words, “griftopia” – had trickled down to the field superintendents, masons, and framing crews. A collective haste gripped much of the state’s growth industry, haste that is cause for regret today.

    A ten-year-old stucco building may look to be in perfectly good shape from the outside. When entering the bland, beige entry hall, however, the tang of mold immediately invades one’s nose. Once water has been trapped in a building it breeds a most sinister fungus.

    Condominium units that suffer this malady are ascending the legal chain one by one across the girth of the state. First, individual owners collect themselves and confront their homeowner’s association. HOAs bombarded with complaints succumb quickly to “condo chaser” attorneys who promise to split the goodly sums they can rake off the insurance companies that covered the contractors and design professionals involved in the mess. And then, discovery begins.

    It takes about a week to vivisect a low-rise building. Ordinarily, the stucco walls are saw-cut down to the bone, and the plaster comes off in a solid sheet, revealing metal strap ties and sheathing tissue within. The sheathing panels themselves are made of glued together wood chips – so-called “oriented strandboard” – only as strong as the glue itself. Removal of the sheathing layer reveals the deep ligaments and structural bones of the building.

    Buildings designed in Texas, Ohio, Georgia, and elsewhere populate the Florida landscape. These buildings have almost no roof eave at all, as if the fierce Florida sun didn’t matter. The skin-tight stucco may not be Portland cement plaster, because dryvit (an acrylic latex substitute for stucco invented after World War II to quickly rebuild Europe) has become a popular substitute. The windows are set at the outside of the wall, with no shading at all on the glass. The effect is that the building looks as stretched tight as a balloon.

    Unfortunately, such a combination frequently admits water into tiny cracks and crevices, and the water has no way to seep out. Revealing the interior guts of a building is the only way to uncork mold and rust horrors that are otherwise invisible. Insidious ants wind their way into the dark spaces between walls and floors where water and food are available.

    Biopsies on sick buildings reflect our collective errors of judgment, and the healing process will be lengthy and expensive. Designs that do not reflect the harsh realities of Florida’s hot, wet climate are certainly responsible for some of the errors. Designs that did not acknowledge the scarcity of experienced construction crews were also responsible, because construction takes teamwork and skill. And contractors, encouraged to cut costs in order to boost their own bottom lines, cut time or cut labor to get the job done faster.

    Designers and contractors may also legitimately point the finger back at clients who pushed hard. A collective irrationality set in towards the end of the last decade. More work had to be done by fewer people, less experience was available to go around, and in the heat of the moment steps could be skipped in the name of innovation. The consequences are being felt only now.

    A huge, sad pile of lost resources, our vanishing wood and raw materials, must be hauled off to clean these errors out of the system. Sadder to see are the homeowners, as they pack up and move out of their mold-infested units. But saddest of all is the apparent inability of the industry to learn from its own mistakes.

    Let’s hope that this time around it can happen differently. Reject growth for growth’s sake. Florida, hooked on this drug for too long, deluded itself into filling up wetlands and paving more and more space.

    Instead, as the tide rolls in once again, Florida can make a pact with itself to invest in development, rather than growth. Redeveloping older, inner cores of cities where services and employment are already in place can go a longer way towards making the state a sustainable, diverse place to live than paving one more tract of raw land mowed down for home lots can.

    Revamp the state’s development culture. Private developers have written Florida’s growth management code, and gradually increased the requirements so that only the largest and most deep-pocketed developers can compete. Protecting neither the environment nor quality of life very well, the development regulations are in dire need of rewriting, with a different set of requirements that favor smaller-scale development and redevelopment, and encourage affordability.

    In the meantime, discovery continues. More leaky roofs, more fungus-infested units, and more attics seething with ants, testimony to our collective haste and greed. As the nation slowly recovers economically, Florida has paused for breath on the pathway to healthy construction. Before the next boom, its development industry would be wise to use this break in the action to consider the alternatives.

    Richard Reep is an Architect and artist living in Winter Park, Florida. His practice has centered around hospitality-driven mixed use, and has contributed in various capacities to urban mixed-use projects, both nationally and internationally, for the last 25 years.

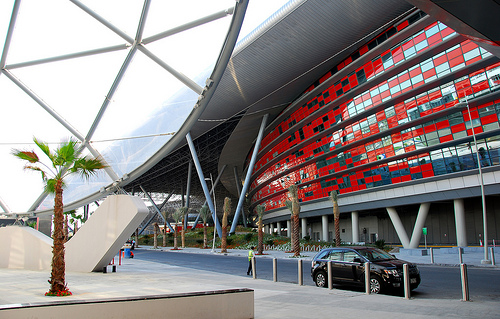
    Photo by the author.

  • Chicago: Out of the Loop

    The “global city” is one of the dominant themes related to  urban success today.  In this model, cities serve both as huge agglomerations of top specialized talent and also as “control nodes” of the global economy serving as key sites for the production of financial and producer services demanded by the new globalized economy. In her seminal book on the subject, Saskia Sassen noted New York, London, and Tokyo as the paradigmatic examples of the global city.

    The status of global cities, however, is protean, and not all “global cities” are created equal or occupy a similar status. Tokyo, for example, is clearly fading in the face of the shift of economic power from Japan to the Chinese sphere of influence – Shanghai, Beijing, Hong Kong and Singapore.

    Chicago has long prided itself as one of those cities, and consistently rated in the top ten global cities in various surveys. It’s a huge business services hub, financial hub, transport hub, cultural center, and massive draw for talent. The greater Loop area is clearly a classic global city area, densely packed with knowledge workers, with gleaming towers all around – over a hundred of which went up in the last decade. The transformation of the Loop and the surrounding neighborhoods in the last 20 years has been nothing short of stunning and remains a testament to the record of both Mayor Daleys.

    Even at its best, the global city model has its weaknesses, such as extreme income inequality, but at least it seems to provide a model that works in an era when so many urban formulas have failed.  Chicago, for example, has used its global city status to avoid the rot that has hit so many Midwestern cities.

    But for Chicago, though its global city side is running strong, there’s a serious problem. Although impressive both economically and awe-inspiring in its physical form, the greater Loop economy is just too small – especially relative to the size of the region. This suggests that the Chicago region cannot rely primarily on the global city to carry its economy.

    This might seem difficult to believe given that the greater Loop is the second largest business district in the United States and home to over half the region’s office space. But it can be easily illustrated by comparing Chicago employment to that in Manhattan.  Here’s a comparison of total jobs in Manhattan vs. all of Cook County, Illinois.


    Source: Quarterly Census of Employment and Wages

    As you can see, Manhattan has almost as many jobs as all of Cook County, and the two are converging. Given trends in both cities, it doesn’t seem unreasonable to think that in the near future Manhattan may actually have more jobs than Cook County.  Not only are there more jobs in Manhattan, but they pay significantly higher wages.  Here is a comparison of the average weekly wage between the two:


    Source: Quarterly Census of Employment and Wages

    Manhattan wages dropped as a result of the financial crash, but still remain 70% higher than Cook County – and until the crash had been pulling away.  They may be surging again as Wall Street has been a notable beneficiary of the bailouts. But the difference in scale is significant under any circumstances. Manhattan, with a mere tenth of the regional population, has about as many jobs as Cook County, which has over half the regional population. The wealth and income engine of Manhattan is simply of a different order and power than any other US city. As a result, the global city side of New York for which Manhattan is a proxy really can pay the freight for not just the outer boroughs, but also the greater region and the budgets of not only New York but to some extent New Jersey and Connecticut as well.

    By contrast, Chicago’s global city side, strong as it is, simply cannot perform the same role in powering its region and state. Though estimates are that it encompasses something like 600,000 people participate in it, and though the Loop along with select suburban business districts are legitimately thriving, this economy is just too small to support the entire region. In fact it can’t pay the bills even for the rest of Chicago itself, much less the region or state, especially considering that the non-global city parts are basically Rust Belt in character.  That’s one reason local government finance is in such rough shape.  The city is facing a deficit of about $650 million and the state’s unfunded future liabilities are upwards of $160 billion.

    Clearly, Chicago needs to continue focusing on expanding the size of its Loop economy and ensuring that it remains a top global city destination in the future. But unlike some other places that can hang their hat on that if they want, Chicago has to go beyond just being a global city and also be something more. After all, Chicago does not enjoy a “lock” on any industry, like New York with finance and media, or even Houston in energy, the Bay Area in technology or Los Angeles in entertainment. In almost every major business category it is not the lead player, which allows for greater economies of agglomeration and, perhaps even more importantly, a powerful and enduring global signature.

    But bluntly, the world city economy is too diffused and small to offer much to the 90% of its people who aren’t a part of that.  In short, Chicago needs more “outside the Loop” thinking.

    A critical aspect of the challenge here lies with improving  the state and local business climate, recently rated as one of the worst in the country by Chief Executive magazine. If you’re a hedge fund partner, architect, or celebrity chef, things are great. But for bread and butter type businesses and workers, which constitute the vast majority of the economy, things are quite different. That’s why everyone from the CEO of Caterpillar,based three hours from the city, on down is publicly complaining and threatening to move.

    Fixing this means finally rooting out the corruption that undermines confidence in local government, restructuring state and local finances to provide more certainty to investors, continuing to focus on education, addressing the infrastructure investment deficit, and radically reducing the red tape that plagues small and medium sized businesses.

    None of these are sexy or easy. In fact, the CEO of the Chicagoland Chamber of Commerce recently said he’s not putting any faith in claims by Rahm Emanuel, the new mayor  that red tape relief is on the way, reflecting the level of skepticism in the local business community right now. Today businesses in the city literally need a city ordinance passed in order to do seemingly simple things like add an awning or get a sidewalk café permit – something that is totally at the discretion of the alderman.  The Chicago Reader recently reported that this sort of “ward housekeeping” accounts for over 95% of city council legislation. Clearly this approach is toxic to business.  That’s why these items are absolutely mission critical items to creating a regional economy that can actually generate employment and pay the bills going forward. Glamor jobs and prestige employers downtown just aren’t going to cut it by themselves anymore.

    Aaron M. Renn is an independent writer on urban affairs based in the Midwest. His writings appear at The Urbanophile.

    Photo by Doug Siefken

  • Natural Gas Vehicles Floor It in Long Beach

    The Alternate Clean Transportation Expo held in Long Beach earlier this month was a spectacular display of engineering ingenuity by Natural Gas Vehicle providers. The event’s theme was that America’s self sufficiency in natural gas has decoupled our energy resources from petroleum prices. But the consensus among the gathered engineers and scientists was to look beyond the current prices of petroleum alone, and consider that domestic self sufficiency includes keeping jobs at home.

    The NGVs (Natural Gas Vehicles, which include Compressed Natural Gas—CNG, as well Liquefied Natural Gas—LNG) reduce greenhouse gas emissions almost 20 percent on medium and heavy duty models, and 30 percent on light duty vehicles.

    All fuels, including natural gas, release energy by burning. But cleanliness and renewability are probably the single most talked-about aspect of NGVs. From energy field to vehicle engine, natural gas needs very little processing to make it usable, compared to crude oil, which is processed into gasoline by complex and expensive refining techniques. A naturally occurring fuel, its chemical formulation is about 90% methane, with smaller amounts of ethane, propane, butane and carbon dioxide, a high octane rating of about 120 – 130, and clean burning characteristics.

    Biomethane gas is extracted from biomass, and is therefore renewable, and it can be produced economically in large quantities. Current estimates are that the US has proven reserves of over 1500 TCFs (trillion cubic feet) of natural gas which, by some estimates, should last for the next 100 years.

    Potentially, natural gas will create jobs not only through vehicle manufacturing, but through the construction of new CNG stations. A landfill processing plant near Dallas, Texas, owned by a pioneering company in CNG station installation, Clean Energy™, creates up to 9,000,000 GGEs (gasoline gallon equivalents)of biomethane gas for fueling stations. It has agreements with airports in Tampa, New York City, New Orleans and Philadelphia to build CNG filling stations that will support ground transport vehicles and off-airport parking shuttles.

    Of course, legitimate concerns have been expressed about the safety of natural gas vehicles. Notably, in a tragic 1998 accident a stopped bi-fueled Honda (a vehicle that can run on CNG or gasoline) was impacted by another vehicle moving at almost 100 mph. A fire started by the gasoline engine broke out.

    NGV supporters counter that the 50 liter CNG tank was intact and remained secure in its support bracket, that NGVs are subject to same federal standards as regular vehicles, and that natural gas cylinders are thicker and stronger than conventional gas tanks.

    The NVG safety record also includes a survey of more than 8,000 natural gas utility, school, municipal and business fleet vehicles that have traveled 178 million miles, in which the vehicle injury rate was 37% lower than in a gasoline fleet. Under federal and state regulations, fueling stations, indoor parking structures, repair garages and car dealerships must all meet high safety standards. Leaking gasoline forms puddles and creates a fire hazard; if the CNG engine leaks at all, the fuel will normally rise to the ceiling and disappear. Insurance companies nationwide have looked at the safety of natural gas buses and fleets and have no reservations about insuring them.

    Hybrids were also on display at the Expo, including a notable innovation by Parker Hannifin Company. Says Tom Decoster, business development manager of the Cleveland-based firm, “We are going to let California know there are alternatives to electric and CNG.” Parker’s alternative is the hydraulic hybrid, with regenerative braking energy stored as a pressurized gas in a vessel. These vessels are known to be accumulators, which Parker compares to batteries. While stored electricity from a battery drives a motor, energy from an accumulator powers a pump-motor to drive wheels. This assistance increases fuel efficiency and sometimes permits a smaller engine.

    Average fuel consumption for a conventional Class 8 vehicle is about 9,800 gallons per year. RunWise™, Parker’s vehicle, reduces the fuel consumption by 30 to 50 percent, depending on route density and operating conditions. “The more stops a vehicle makes during the day, the more efficient the system becomes relative to a conventional drive train,” Decoster says, adding that the NGV also reduces CO2 emissions, compared to a conventional vehicle, by 38 tons per year, the equivalent of about six midsize cars or planting 1,500 trees. It has reduced brake replacement cycles from every few months to almost 2 years. Parker’s technology is intended for refuse trucks and for fleets that need frequent stops, such as those run by FedEx and UPS.

    This highly technical conference and engineering-driven trade show was innovative in one other way, too. Expo organizer GNA designed events to reach out beyond the technorati to ordinary consumers who — it hopes — will one day be its loyal customers.

    Shashi Parulekar is a Los Angeles-based engineer. He holds an MBA, and served as Asia Pacific M.D. with Parker Hannifin Co in Michigan for over ten years.

  • Where Do the Children Play?

    Are compact cities healthy cities? One argument for compact cities is that they are good for our health.  The New Zealand Public Health Advisory Committee in 2008, for example, cited four principles for healthy urban planning based on the density of development: urban regeneration, compact growth, focused decentralisation, and linear concentration.  The aim is less time in cars and more use of active transport.

    One objective of Auckland’s Regional Growth Strategy, with its emphasis on CBD and centre-focused residential growth is “safe and healthy communities”.  But how far can that be achieved through residential intensification?  Does regulating for a compact city work for everyone?  Everywhere? 

    Kids and consolidation

    Research by Penelope Carroll and Karen Witten of Massey University, summarised here and in a recent article in The Aucklander, highlights the disadvantages for children in the inner city. 

    Witten and Carroll suggest that traffic volumes, strangers on the street, and lack of outdoor play space mean that children in central city environments are likely to be confined indoors.  And that raises the disadvantages of high density dwellings: insufficient space, internal noise, lack of natural light, lack of privacy, inadequate parking, inadequate indoor play space, and the potentially hazardous nature of balconies.  Poor health outcomes is a major concern.

    A key issue for children in compact parts of the compact city is lack of opportunity for outdoor activity.  Heavily trafficked streets are not good for bike riding, or even walking alone.  Auckland’s centre is devoid of segregated cycleways or play areas.  Getting to school or the park is a major mission, and may well need a car trip. 

    Even the Auckland Domain, a splendid sprawling park on the CBD fringe, is surrounded by high intensity streets, remote from most central apartments, and is hardly child-friendly.  The much smaller Victoria Park is similarly difficult to access, isolated by major arterial roads.  Albert Park is about the only central green space of note, but this is a throughway between university and town, not an ideal area for children to play. 

    Auckland CBD Green Space

    Perhaps the well-being of children is not a major issue here, because only around 600 (aged under 15) lived in the CBD in 2006.  But it was up 130% over a decade.  And they do count.

    Anyway, the limits of central city living for children – and families – flag more general issues:

    • The need to think seriously about how we cater for families in higher density living generally, in the CBD, in other centres, and in suburbs targeted for intensification;
    • How we provide safe, public green space, areas for play, and ease of movement in high density, mixed use environments; and
    • Just how healthy is the inner city residential for living generally?

    CBD living – not so healthy?

    The factors potentially stressing children in the CBD impact on adults too.  Research for Auckland City in 2003 (CBD Metadata Analysis by No Doubt Research) suggested dissatisfaction with inner city apartment living came from a diminished sense of security and safety, noise nuisance, small units, absence of outdoor living spaces, and lack of a sense of community. 

    In the absence of outdoor recreation space adult residents may get some exercise in the burgeoning gymnasium sector (for between $1,000 and $2,500 a year).  But for many recreational and social activities a car is a necessity.  Simply to take advantage of the key benefits cited for living in Auckland – access to outdoor recreation opportunities, organised sports, beaches, bush and countryside – residential Intensification around centres means more time- and fuel-consuming car trips.

    On top of a lack of open useable space the latest State of the Region Report documents the heaviest concentration of air pollutants in and around central Auckland, hardly a healthy living environment.

    Central Auckland Haze
    Source: Auckland Regional Council,
    State of the Region, 2010

    Community in the central city

    Research by Larry Murphy of the University of Auckland (“Third-wave gentrification in New Zealand: the case of Auckland” Urban Studies 2008, Volume 45) described different communities in the CBD: the well-to-do with their spacious harbour edge apartments (and quite possibly a second home – a beach cottage or lifestyle block – outside the city); the student-dominated quarter to the east; and the low income population to the west.  Families may end up in the latter area, in cramped apartments in featureless apartment blocks, simply for reasons of affordability.

    These are transient populations, some 52% of residents in the Central East and Central West Census Area Units had been in their current dwellings for less than a year in 2006.  This compares with 23% in Auckland as a whole.  These particularly high residential mobility figures contradict any suggestion that high density living might create a strong sense of community cohesion.

    Okay for some, for some of the time

    The CBD works for some people.  The proliferation of downtown bars and entertainment caters particularly for the young and well-to-do.  Gentrification of the harbour-edge works for the professional couple, the wealthy, and out-of-towners.  But the central city is not right for middle or low income households, or families. 

    Two key ingredients of a compact city strategy are increasing residential densities and boosting inner city living.  But these raise health and equity issues.  At the least, they call for investment in the quantity and quality of public space in areas targeted for intensification, making potentially big demands on the public purse given the value of land in the CBD and other commercial centres. 

    We may just have to acknowledge the benefits of suburban living for some time to come and seek opportunities for sustainable development that don’t oblige less well-off families to dwell in small apartments and featureless blocks around busy commercial areas for lack of affordable alternatives.

    Phil McDermott is a Director of CityScope Consultants in Auckland, New Zealand, and Adjunct Professor of Regional and Urban Development at Auckland University of Technology.  He works in urban, economic and transport development throughout New Zealand and in Australia, Asia, and the Pacific.  He was formerly Head of the School of Resource and Environmental Planning at Massey University and General Manager of the Centre for Asia Pacific Aviation in Sydney. This piece originally appeared at is blog: Cities Matter.

    Photo by Pat Scullion

  • World Urbanization Update: Delhi 2nd in a World of Smaller Urbanization

    Perhaps the most surprising development in urban areas over the past year was the ascendancy of Delhi to rank second in the world in population, following only Tokyo – Yokohama. Based upon the new United Nations population estimate, the 7th annual edition of Demographia World Urban Areas places Delhi’s population at 22.6 million. Tokyo – Yokohama, however, is in no immediate jeopardy of losing its number one status, with a population estimated at 36.7 million, approximately 70 percent greater than that of Delhi (Note 1). Demographia World Urban Areas includes population estimates  for all identified urban areas in the world with 500,000 or more residents. Among these 796 urban areas, 169 are in higher income nations and 627 are in lower income nations.

    The Largest Urban Areas: For years, demographers have been watching Mumbai on the assumption that it might eventually emerge as the largest urban area outside Tokyo – Yokohama. However, Mumbai, at 21.3 million, has fallen behind faster growing Delhi and now ranks as the sixth largest urban area in the world. Seoul-Incheon, in Korea, has emerged as the number three urban area, based upon higher than anticipated  suburban growth registered in the 2010 census and now shows a population of 22.5 million. Jakarta, Indonesia’s capital, now stands as number four, with a population of 22.2 million, followed by number five Manila at 21.3 million (Note 2). The next three largest world urban areas are in the Americas with New York at 20.7 million, Sao Paulo at 20.4 million and Mexico City at 19.6 million. The world’s 10th largest urban area is Shanghai (18.7 million), which experienced larger than anticipated growth toward the end of the decade (Table).

    10 Largest Urban Areas in the World: 2011
    Rank
    Geography Urban Area
    Current Year Population Estimate
    Land Area: Square Miles
    Density
    Land Area: Km2
    Density
    Density Year
    1 Japan Tokyo-Yokohama
    36,690,000
    3,500
    10,500
    9,065
    4,000
    2011
    2 India Delhi, DL-HAR-UP
    22,630,000
    605
    37,000
    1,567
    14,300
    2011
    3 South Korea Seoul-Incheon
    22,525,000
    835
    27,000
    2,163
    10,400
    2011
    4 Indonesia Jakarta
    22,245,000
    1,075
    20,400
    2,784
    7,900
    2011
    5 Philippines Manila
    21,295,000
    550
    37,000
    1,425
    14,300
    2009
    6 India Mumbai, MAH
    21,290,000
    300
    70,300
    777
    27,100
    2011
    7 United States New York, NY-NJ-CT
    20,710,000
    4,349
    4,500
    11,264
    1,800
    2000
    8 Brazil Sao Paulo
    20,395,000
    1,125
    18,100
    2,914
    7,000
    2011
    9 Mexico Mexico City
    19,565,000
    780
    25,000
    2,020
    9,700
    2011
    10 China Shanghai
    18,665,000
    1,125
    16,500
    2,914
    6,400
    2011


    Among the top ten urban areas, New York is by far the least dense, followed by Tokyo-Yokohama. They are also the most affluent, with seven of the remaining 10 far more dense and located in lower income countries, while Seoul-Incheon is more dense, but in a nation that is among the latest entrants to higher income status (Figures 1 & 2).


    Highest Population Densities: Dhaka, the capital of Bangladesh is the most dense with 90,600 persons per square mile or 35,000 per square kilometer. Dhaka ranks 24th in population in the world and crowds its approximately 11.5 million residents into 125 square miles or 325 square kilometers (less than the land area of the municipality of Portland, Oregon). Mumbai ranks second in population density, with 70,300 per square mile or 27,100 percent per square kilometer. Among high income urban areas, Macau is the most dense, at 70,000 per square mile or 27,000 per square kilometer, slightly ahead of its neighbor across the Pearl River, Hong Kong, which is estimated to have 66,100 residents per square mile or 25,500 per square kilometer. Of course, both Hong Kong and Macau have artificially high densities, driven by their enclave status. Comparatively few urban areas in the high income world exceed 15,000 per square mile (6,000 per square kilometer).

    Largest Urban Land Area: Although we commonly identify Gotham with the density of high-rise Manhattan, New York sprawls more than any of the top urban areas. Its urban area contains far the largest  land area, stretching to cover 4,350 square miles or 11,300 square kilometers. Los Angeles, more noted for its physical expanse, has approximately one-half the land area of New York and it extends less than both Tokyo – Yokohama and Chicago. Perhaps astonishingly, the Boston urban area covers approximately 95 percent of the land area of Los Angeles, though with only one-third the population.

    Larger Urban Areas, Higher Density: As urban areas become larger, their population densities also increase. Moreover, as in the top 10 urban areas, lower income nations tend to have far higher densities than the urban areas located in the higher income nations(Figures 3 & 4).


    • Overall urban densities are approximately 9,000 per square mile (3,500 per square kilometer) in urban areas with between 500,000 and 1 million population and rise to 15,500 per square mile (6,000 per square kilometer) among urban areas with more than 10 million population.
    • Urban areas in higher income nations range from a population density of 3,800 per square mile (1,500 per square kilometer) among urban areas with from 500,000 to 1,000,000 population. Larger urban areas with more than 10 million population average o 8,900 per square mile (3,400 per square kilometer).
    • The urban areas located in lower income nations have far higher densities densities, ranging from 15,100 per square mile (6,000 per square kilometer) in the 500,000 to 1,000,000 population category and up to 22,100 residents per square mile (8,500 per square kilometer) in the over 10 million population category.           


    Population Density by  Region: There is also considerable variation in urban population densities between the regions of the world (Figures 5 & 6).


    The lowest densities are in affluent areas. The United States and Canada, at 3,600 per square mile (1,400 per square kilometer), Oceania at 4,100 per square mile (1,600 per square kilometer) and Europe at 8,400 per square mile (3,200 per square kilometer). Latin American urban densities are 15,900 per square mile (6,200 per square kilometer), followed by Africa at 18,600 per square mile (7,200 per square kilometer) and Asia, at 18,800 per square mile (7,300 per square kilometer).

    The overall population density of urban areas with more than 500,000 residents in India is estimated at 37,000 per square mile (14,400 per square kilometer), which is more than double that of China, at 17,000 per square mile (6,700 per square kilometer).

    A Smaller Urban World? A review of the size of the world urban areas shows the planet to be made up principally of rural areas and towns and cities with less than 500,000 population. In 2011, approximately 51 percent of the world is urban and 49 percent is rural. Urban areas ranging from just a few thousand residents to under 500,000 residents account for 27 percent of the world’s population, which constitutes a majority of its urban population. Among the larger urban areas, megacities (10,000,000 and larger) and the urban areas with between 1 million people and 2.5 million people each for approximately 6 percent of the world population. The other larger categories of urban areas each account for approximately 4 percent of the world’s population (Figure 5).

    The McKinsey Global Institute recently reported that the world’s megacities were growing less quickly than the other large urban areas. This development, along with the distribution of world urban population may indicate that world’s largest urban areas, especially the megacities, may not be the wave of the future; instead it may be smaller urbanized regions between 500,000 and 10 million.  These regions, with three times the population of the megacities, will likely shape urbanity over the next few decades.

    —————-

    Note 1: An urban area is an urban agglomeration or an urban footprint (area of continuous development). An urban area is the organism of the “city” in its spatial dimension. Census authorities in a number of nations have adopted similar definitions for urban areas (Examples are United States, Canada, United Kingdom, France, Norway, Sweden and Australia). Demographia World Urban Areas uses national census bureau data for both population and land area estimates where it is available and estimates urban land area from satellite imagery for all others.

    Note 2: for the purposes of this analysis, higher income urban areas are generally in nations with a gross domestic product of $20,000 per capita, purchasing power parity.

    Note 3: The urban area population estimates of Seoul-Incheon, Jakarta and Manila are considerably of love those reported by the United Nations. The United Nations data for these urban areas is based upon a far smaller definition of urbanization than is used in other urban areas. As additional explanatory notes are found in Demographia World Urban Areas.

    Photo: India Gate, Delhi (by author)

    Wendell Cox is a Visiting Professor, Conservatoire National des Arts et Metiers, Paris and the author of “War on the Dream: How Anti-Sprawl Policy Threatens the Quality of Life

  • Is The Information Industry Reviving Economies?

    For nearly a generation, the information sector, which comprises everything from media and data processing to internet-related businesses, has been ballyhooed as a key driver for both national and regional economic growth. In the 1990s economist Michael Mandell predicted cutting-edge industries like high-tech would create 2.8 million new jobs over 10 years.  This turned out to be something of a pipe dream. According to a recent 2010 New America Foundation report, the information industry shed 68,000 jobs in the past decade.

    Yet this year, information-related employment finally appears to be on the upswing, according to statistics compiled by Pepperdine University economist Michael Shires. The impact of this growth is particularly marked in such long-time tech hot beds as Huntsville, Ala., Madison, Wis., and San Jose-Sunnyvale-Santa Clara, Calif., in the heart of Silicon Valley, all of which have relatively high concentrations of such jobs.

    The San Jose area, home of Silicon Valley, arguably has benefited the most from the  information job surge. Much of this gain can be traced to the increase in social networking sites such as Facebook, LinkedIn and Twitter, all of which have been incubated in the Valley. Good times among corporations  have led many to invest heavily in software productivity tools, while those marketing consumer goods have boosted spending for software and internet-related advertising.

    The 5,000 mostly well-paying information jobs added this year was enough to boost San Jose’s standing overall among all big metros 20 places to a healthy No. 27 in our ranking of the best cities for jobs.

    But as economists enthuse over the tech surge, we need to note the limitations of information jobs even in the Valley. Software and internet jobs, which have increased 40% over the past decade, have not come close to making up for the region’s large declines in other fields, notably manufacturing, construction, business and financial services. Overall, the region has lost 18% of its jobs in the past decade — about 190,000 — the second-worst performance, after Detroit, among the nation’s largest metros. It still suffers unemployment of close to 10%, well above the national average of 9.0%.

    This dual reality can also be seen in the local real estate industry. Office vacancies may be back in the low single digits in some markets popular with social networking firms, such as Mountain View, but they remain around 14 or higher throughout the region — 40% higher than in 2008. No matter how impressive reporters find a new headquarters for high-fliers like Facebook, the surplus of redundant space, particularly in the southern parts of the Valley, suggest we are still far from a 1990s style boom.

    Some observers also warn that the long-term prospects for the Valley may not be as good as local boosters assume.  Analyst Tamara Carleton cites many long-term factors — like the financial condition of local cities and diminishing prospects for less skilled workers — that make it tougher on those who live below the higher elevations of the information economy. She also says that a precipitous decline in foreign immigration could slow future innovation.

    This dichotomy is even more evident in the other big information gainer among our large cities, Los Angeles. Although it is little known by the media or pundit class, the Big Orange actually boasts the nation’s single largest number of information jobs. Its over 5% growth in information jobs translates to roughly 10,000 new positions over the past year. In LA, the big sector for information jobs is likely not social media but traditional entertainment, one of the area’s core industries.

    Yet information growth clearly is not bailing out the overall economy. Other much larger sectors, such as manufacturing and business services, continue to shrink. The area still suffers from an unemployment rate of roughly 12%.

    Other information winners among our large metros include Boston and Seattle, both traditional centers for software-related jobs. These areas have not been as hard-hit by the real estate and industrial declines as their California counterparts, so increasing information employment does not constitute the outlier that we see in the Golden State.

    Less expected gains were notched by some of our other big information sector winners. One big surprise was New Orleans-Metairie-Kenner, whose information sector, including a growing film and television industry, expanded almost 39% in past year. As is the case with its strong overall rankings in our best cities survey, the Big Easy’s comeback from the devastation of Katrina is heartening. But we must curb our enthusiasm by pointing out that total regional employment remains 100,000 less than it was before the hurricane.

    Equally intriguing has been the strong performance of Warren-Troy-Farmington, Hills, Mich., and Detroit-Livonia, each of which has benefited from the resurgence of the American auto industry. In these areas, information jobs tend to be tied to the needs of large industrial companies. The state has also waged a major campaign for film and television jobs, as part of an attempt to diversify its economy.

    Yet for all the hype that surrounds industries like media and software, it’s critical to point out that overall this is not a huge employment sector. Even in Seattle — home to Microsoft, Amazon and other software based companies — information jobs account for barely 6% of the total. In Los Angeles, it’s 5%, compared with 10% each for manufacturing and hospitality. In media-centric New York, information accounts for barely 4% of jobs, less than half that of financial services and one-third that of the huge business service sector.

    In most other areas, including those experiencing strong growth, information jobs constitute an even smaller part of the economy. In New Orleans, Warren, Mich., and Detroit, such jobs account for less than 2% of employment . Still, the growth of this sector is a promising one for  economies that have long been dominated, like New Orleans, by the generally low-paying hospitality industry, or in the case of the Michigan cities, the volatile and often chronically hurting manufacturing sector.

    The increase in information jobs, however welcome, should not be sold as a universal elixir for  creating widespread prosperity. Over time, strong regional economies are those that rely on diverse employment sources rather than one.  Growth in high-tech and media jobs can wow impressionable reporters and earn economic developers bragging reights, but they can do only so much to lessen the recession’s impact on the vast majority of workers and the broader regional economy.

    Top Cities for Information Job Growth, 2009-2010
    New Orleans-Metairie-Kenner, LA 38.86%
    Honolulu, HI 25.11%
    Shreveport-Bossier City, LA 18.85%
    Huntsville, AL 14.71%
    Leominster-Fitchburg-Gardner, MA  13.33%
    Redding, CA 10.53%
    Madison, WI 10.20%
    San Jose-Sunnyvale-Santa Clara, CA 10.01%
    Grand Rapids-Wyoming, MI 7.63%
    Providence-Fall River-Warwick, RI-MA 6.33%
    Top Big Cities for Information Job Growth, 2009-2010
    New Orleans-Metairie-Kenner, LA 38.86%
    San Jose-Sunnyvale-Santa Clara, CA 10.01%
    Providence-Fall River-Warwick, RI-MA 6.33%
    Los Angeles-Long Beach-Glendale, CA  5.08%
    Warren-Troy-Farmington Hills, MI  3.97%
    Boston-Cambridge-Quincy, MA  3.54%
    Riverside-San Bernardino-Ontario, CA 3.46%
    Charlotte-Gastonia-Rock Hill, NC-SC 3.02%
    Detroit-Livonia-Dearborn, MI  2.48%
    Seattle-Bellevue-Everett, WA  1.47%

    Joel Kotkin is executive editor of NewGeography.com and is a distinguished presidential fellow in urban futures at Chapman University, and an adjunct fellow of the Legatum Institute in London. He is author of The City: A Global History. His newest book is The Next Hundred Million: America in 2050, released in February, 2010.

    Photo by Angelo Amboldi

  • Hollywood Unions

    If you work in L.A. in film, tv, radio, music, news, live or “new” media, there’s a very good chance you’re in a union.

    That’s true if you’re an actor, camera operator, broadcaster, hair stylist, electrician, costume designer, truck driver, writer, production manager, art director or stunt man or woman.

    It’s one of last industries in America with what’s called “union density,” in which collective bargaining determines wage scale, residuals, medical and pension coverage; and sets work rules and jurisdiction (who does what).

    Some members earn a fortune, others a decent living, many barely – or don’t – get by.

    I can’t think of another field, however, where people will pay to get into the union even before they have a chance to put their talent to work.

    And though there’s a mixed historical legacy to the Hollywood labor movement – anti-communism, race and gender discrimination, corruption and complicity – these unions have mostly cleaned house, adapted to changing conditions, and (to varying degrees) have learned to organize new work.

    Industry employers include some of the most powerful corporations on the planet. But despite intense fights over nonunion and “runaway” productions, you don’t hear talk about getting rid of the unions.

    That’s partly because the unions help manage the “freelance” workforce. It’s also that powerful people in the industry – labor and management – accept the system, flaws and all.

    More than 90 percent of private sector American workers are nonunion. For most, the idea of making their job union never crosses their mind.

    But here in L.A., many workers know someone who’s “gotten in” to “the business” and one of its unions.

    And, over the past 20 years, both “above and below the line” unions have integrated into the region’s labor movement, recognizing the value of solidarity in organizing and contract campaigns, politics and strikes.

    It’s too bad most American workers – stuck in low wage jobs with marginal or no benefits – know virtually nothing about how this industry really operates; and – in particular – the role its unions play in sustaining the region’s middle class.

  • Can the Winnipeg Model Save Detroit?

    Detroit, not only in the US but across the globe, has become the poster child for urban decay.  The city lost 25% of its population between 2000-2010, and over half its population since 1950.  Over 90,000 houses stand empty, and many neighborhoods have been completely abandoned. 

    The burden of maintaining infrastructure and law enforcement in a city with an eroding tax base and sparse population has lead to attempts to “shrink” the city.  This means bulldozing several areas of the city, and relocating existing residents.  Current Mayor Dave Bing realizes this, and has pledged to knock down a staggering 10,000 structures during his first term.  In the past such slum clearances lead to vigorous opposition from urbanists like Jane Jacobs, who argued that top down approaches to urban redevelopment would cause a great deal of pain, for little to no benefit.  Yet despite the fact that Jacobs is widely admired by planners, the plan to shrink the city has met with little opposition in Detroit.  Frankly, unless Detroit sees a major population surge, shrinking the city may sadly be necessary.  

    Last week, New York Mayor Michael Bloomberg appeared on NBC’s Meet the Press, and at one point mused about using immigration policy to repopulate the city.   Bloomberg didn’t offer a substantive policy proposal, but the premise makes perfect sense.  Most of Detroit’s problems stem from the fact that fewer and fewer people are working and paying taxes in the city.  There is more infrastructure than people need or the city can afford. 

    Ultimately the issue then is getting people to live in Detroit. But the biggest problem, even with a mild resurgence in the auto sector, is that Americans, and even most Michiganders, don’t want to live in Detroit, even with jobs.

    But for many immigrants, Detroit would seem like a major upgrade over their current living situation. This is not as far-fetched a notion as some may believe. Here’s a proposal for Detroit based on an unlikely Canadian immigration success story: Winnipeg.

    Learning from Winnipeg

    When Americans think of Winnipeg, they think of white guys wearing earmuffs in July, speaking with the kind of Canadian accents typically ridiculed on American sitcoms.  When Canadians from outside of Manitoba think of Winnipeg, they think of a former industrial city that is hardly a draw to the much sought after “creative class” even though  the city has the nation’s lowest housing cost.  What no one from outside the city associates with Winnipeg is immigration.

    Winnipeg’s immigration success is not well known outside of the province, but it is hard to dispute the facts.  Smart immigration policies have helped Winnipeg stabilize its population and reverse the city’s decline.

    Between 1971-1996, the city of Winnipeg grew by just under 16%, or roughly 0.6% per year.  Like many North American cities, all of the growth was taking place in the suburbs.  In fact, the population of Downtown Winnipeg shrunk by 23.25% during that period.  Though the rate of decline is nowhere near that of Detroit, the causes and effects are similar.  Manufacturing declined; people moved to the suburbs, aided by highway expansions and low cost automobiles; residents moved to more entrepreneurial cities, such as Calgary; ensuing job and population decline lead to a decline in safety.  The most notable difference is that racial tensions in Detroit exacerbated suburban flight.  But the similarities are sufficient to use Winnipeg as a model.

    Using immigration to reverse population decline in Manitoba

    In 1998, the Province of Manitoba introduced the Provincial Nominee Program, which gave the province the ability to recruit immigrants over and above federal immigration quotas.  Since Manitoba was not seen as the most attractive place for new immigrants to settle, only 1.8% of immigrants to Canada settled in the province between 1996-2000 (Note 1).  Since the introduction of the nominee program, immigration to the province has increased by 250%.  The increase in the City of Winnipeg has been staggering.  In the years 1996-2000, the city saw 15,809 new immigrants.  In just one year, 2007-2008, the city attracted 16,585 immigrants.  Equally as important, 78% of Manitoba immigrants stay in the province, which is a significant improvement over the 1980s, when they had a retention rate of less than 50%.  Increased immigration ended Manitoba’s population stagnation, and the province now enjoys consistently positive net migration.

    Economic outcomes of Manitoba immigrants

    A survey of immigrants who migrated to Manitoba through the provincial nominee program shows promising results.  Three quarters of participants surveyed have never experienced involuntary unemployment.  Of those surveyed, 85% were employed, and 7% were in school.  While the average annual household income of $49,066 for participants is lower than the provincial average of $60,242, they are generally making enough money to live reasonably well, contributing to the provincial and municipal tax bases. 

    Reasons for the program’s success

    Of course, mass immigration often creates challenges for recipient regions.  Aside from the need for immigrants to find jobs, they also often require language training, and educational upgrading to meet certification levels for their professions. However, the success of the program shows that participants were by and large able to overcome these difficulties.  Some of this can likely be attributed to the fact that immigrants of similar backgrounds tended to cluster together, some integrating into communities with existing settlers of similar backgrounds.  The primary examples of these two patterns are the concentration of Filipino immigrants in Winnipeg, and the large number of Mennonites from Germany, Mexico, and South America who integrated into existing Mennonite communities.  This can be important, since it allows for them to develop, or take advantage of informal support networks.  Living in a community with speakers of the same language makes it easier for immigrants whose first language is not English to integrate into the community, and can help with finding employment. 

    Benefits of targeted immigration to Detroit

    Immigration is often a source of innovation and entrepreneurship.  Recent studies have shown that immigrant entrepreneurs in America have created more jobs for existing Americans than  for other    immigrants.  More people moving to Detroit would also mean more customers for the service industry in the city.  And by paying property taxes, they would help to keep the city government afloat.  Perhaps the most important benefit would be that more people generally would make the city safer.  Criminals, after all, hate witnesses. 

    Hopeful signs from recent immigration to Detroit

    Recently, Detroit has experienced an influx of Latino and Muslim immigration.  Despite the stigma attached to these groups by many Americans, anecdotal evidence suggests that these newcomers have been a boon to the city.  According to the Immigration Policy Center, Arab American employment now contributes $7.7 billion to the Detroit metro economy, and provides $544 million in tax revenue to the state.  They now support over 140,000 jobs in the city.  Latino immigrants are being credited with helping to revitalize Southwest Detroit, which saw $200 million of investments between 1993-2008, and the area’s population grew by nearly 7% between 1990-2000 even as most of the city declined.  The City is now home to nearly 50,000 Latinos, up from under 20,000 in 1990.    

    And for those who claim immigrants take American jobs, the evidence suggests the opposite.  Despite the fact that immigrants have lower average wages than non-immigrants, they manage to have a disproportionate economic impact in many cities, Detroit being one of the best examples.  According to the Fiscal Policy Institute, immigrants contribute 1.3 times as much to the economy per capita as non-immigrants in Detroit.  This means, among other things, they disproportionately create jobs and contribute to the tax base.    

    Policy recommendations

    Creating a targeted immigration program would require co-operation between municipal, state and federal governments.  The policies recommended here are one set of options among many.

    • The federal government should create an ”urban revitalization” visa category to allow for municipalities with severe demographic declines to accept immigrants without counting them towards immigration quotas.
    • The state of Michigan, or other similarly challenged states, should create a specific program modeled on Manitoba’s provincial nominee program.
    • Immigrants should be required to prove that they have the financial means to support themselves for a specified amount of time in the absence of income.  This would ensure that they didn’t burden the existing welfare system.
    • Participants in the program could be required to undertake language training at their own expense, or to prove a basic competence in English. 
    • The City of Detroit should move more aggressively towards allocating abandoned buildings to provide housing or places for businesses of immigrants, or anyone else who wants to occupy them for that matter.  Filling buildings means more property taxes.
    • The City should concentrate on settling new immigrants of similar ethno-linguistic backgrounds into specific underpopulated areas.  Rather than simply allowing a certain number of immigrants into the city, they could create zones with high vacancy levels, and allow immigrants who apply to the program to move into these zones initially.  The aim should be to populate one neighborhood every two years to fill current vacancies.
    • Instead of punitive measures to force immigrants to stay in Detroit, the city should provide incentives to stay.  This could include requiring immigrants under this program to sign long term leases with large deposits, or to purchase property.  This is preferable to attempting to monitor the movement of immigrants. 
    • The city and state should attempt to partner with businesses, who may be interested in opening operations in the city due to the influx of immigrant labor.  This could help to give further incentives for new immigrants to stay, and create jobs for existing unemployed residents.

    Many of these recommendations require more micromanagement than I’d personally prefer, but address political and economic realities.  Simply allowing anyone and everyone to immigrate to Detroit or anywhere else in America is a political non-starter.  Also, the dire budgetary situation facing the City of Detroit and the state of Michigan means that neither can afford to allow new immigrants to become economic liabilities.  After all, the justification for this program is to replace the tax base and reduce crime, not to create a new underclass.  Though there would certainly be some hiccups, evidence in Winnipeg and Manitoba could help to revitalize both Detroit and much of the state of Michigan.  Failure to undertake an aggressive revitalization strategy will make an aggressive shrinking strategy inevitable.  Given the two choices, revitalization seems vastly preferable.

    Note 1: Unless otherwise noted, data on the Manitoba Provincial Nominees Program is based on http://www2.immigratemanitoba.com/asset_library/en/resources/pdf/pnp-manitoba-provincial-nominee-program-tom-carter-report-2009.pdf


    Steve Lafleur is a public policy analyst and political consultant based out of Calgary, Alberta. For more detail, see his blog.

    Photo by Arlo Bates

  • New Roller Coasters for 2011

    The recession has seen many capital budgets at theme parks held back over the last few years, but even still, there are many parks building new and exciting rides all over the world. Here is a round up of some rides to get you foaming at the mouth.

    Cheetah Hunt in Tampa Busch Gardens
    The Cheetah Hunt, as you might expect from its namesake, is a “Linear Synchronous Motor Launch Coaster”, i.e. it uses magnets to launch you off fast then it uses strategically places LSM launch pads two more times on your ride. It is set to open in Spring 2011 and is set to be one of the most exciting rides in the country. The 4.5 thousand feet of track will send you to the top of mountains to twisting through a rocky gorge. Watch the video to whet your appetite.

    The Green Lantern at Magic Mountain
    This new ride looks like unlike anything you may have seen before, unless you have been to Grona Lund where the exact same ride has been featured for a couple of years. Two carts each spin independently, which for me just means you get an inconsistent ride and could, if the weight isn’t distributed correctly, fail to even turn upside down on the ride.

    Formula Rossa in Ferrari World, Abu Dhabi
    Another launched roller coaster, opened in November 2010 and is officially the worlds fastest roller coaster reaching 240 kph in 4.9 seconds, this ride uses a Hydraulic launch system and requires the riders to wear protective eye goggles due to the risk of impact with airborne particulates or insects. That just sounds crazy and the investment made to create it would have matched the investment of the cities in the Arab Emirates have seen.


    Ferrari World Abu Dhabi

    Superman: Escape from Krypton
    This isn’t in itself a new ride, as much as it is an update to an older slightly dated one. Formally Superman: The Escape, the upgrades are little more than the cars are turned backwards. But despite this less than impressive update the ride experience is jaw dropping. Being launched backwards, you are never too sure when you are about to reach the incline and once you reach the top the sustained weightlessness is amazing, all before you find yourself hurtling ground-wards.  Exhilarating update and the simplicity would have saved a few cents.


    http://www.flickr.com/photos/beaster725/5596829350/sizes/m/in/photostream/

    There are many more rides being planned in the next few years, including two big rides in the UK for Thorpe Park. Busch Gardens Williamsburg has had plans for a new rollercoaster or drop ride approved. So the outlook seems pretty hopeful for thrill seekers and adrenalin junkies looking for new thrills. The recession hasn’t dampened the record breaking spirits of the theme park owners. This is just a short list of new rides but there are many more all over the world. If you find yourself on Holiday in America or on any UAE or Dubai Holidays, try and visit a park with one of these exhilarating rides.

    Andy Don went to University in Brighton and travelled the world shortly after graduating; he is now working as a trip advisor and marketing executive. Follow him on his twitter @andym23.

    Lead Photo by Drew Bennet

  • This is Not the Way to Fix Toronto’s Transit

    Results and not ideology should guide transportation policy.

    Large city officials have been lobbying for a major program of federal transit subsidies for years. The push will likely intensify after the federal election.

    A principal resource in this campaign will likely be the Toronto Board of Trade’s third annual Scorecard on Prosperity, which finds Toronto’s transportation system to be among the worst in the world, ranking 19th out of 23 metropolitan areas. Other metropolitan areas also ranked poorly, such as Montreal at 12th, Calgary at 13th and Vancouver at 21st.

    However, a deeper look yields difficulties with the Board of Trade report.

    Automobiles dominate travel in all but two of the metropolitan areas (Hong Kong and Tokyo). Yet, only two of 11 indicators involve automobiles. Eight relate to non-automobile modes such as transit (one deals with freight). The Board of Trade comparisons are skewed because they give disproportionate weight to modes that are relatively minor in metropolitan mobility.

    However, the greatest difficulty with the Scorecard is the implied belief greater reliance on transit is preferable. In fact, transit is slower than cars for the majority of trips. Travel time needs to decrease to encourage metropolitan economic growth, as research at the University of Paris indicates. There is probably no more important transportation indicator regarding the economy.

    A Globe and Mail article rightly expresses particular concern that Toronto’s round-trip average work trip time ranks last at 80 minutes per day. However, at least two of the metropolitan areas had longer work trip travel times. The average work trip travel time in the Tokyo metropolitan area was 96 minutes in 2003 (the latest data available), according to the Japan Statistics Bureau. The Board of Trade failed to find a number for Hong Kong, which the government reported at 92 minutes in 2002. Yet, these travel time laggards rank first and second in the Board of Trade rankings.

    It should be a source of embarrassment that Dallas-Fort Worth, a bane of urban planners and with less than half the Toronto density, should have a work trip travel time one-third less and one-fifth less, respectively, than Calgary and Vancouver, the highest ranked Canadian metropolitan areas.

    It’s worse than that. Among all of the large American metropolitan areas, in or out of The Scorecard on Prosperity, all but New York have better work trip travel times.

    Except in the romantic minds of planners, little of the present car travel demand can be replaced by transit. Further, in virtually all of the metropolitan areas ranking above Toronto, the trajectory has been toward cars, so that the present figures are less favourable to transit than they would have been a decade or two ago.

    For transport to make the greatest possible contribution to economic growth and job creation, the transport system must provide quick mobility throughout the entire labour market (metropolitan area). Transit-favouring ideology will not do.

    The problem is evident. The $8 billion just committed by Mayor Rob Ford and Premier Dalton McGuinty to build an Eglinton subway should be used to reduce travel times as much as possible.

    A huge expenditure on a single street will not do that.

    So long as ideology trumps reality, Toronto’s calcified traffic will put it at a competitive disadvantage. The focus should be on results — the time it takes to get to work, rather than on means — whether the trip is by car or transit.

    Wendell Cox writes here as a Senior Fellow at the Frontier Centre for Public Policy in Winnipeg and is a regular contributor to NewGeography.com. This piece also appeared in the Toronto Sun.