Blog

  • The New Geography of Population Loss and Gain

    Dramatic shifts in population growth across the United States in the last decade should surprise no one. Some patterns are continuing trends of earlier decades, but other patterns show substantial change.  I show these changes in three ways, first a conventional choropleth map coloring counties by broad classes from high losses to moderate and high percent gain, second a map in which absolute gains and losses are depicted by proportional symbols, with colors showing the rate of change, and third, a look a counties that experienced either extreme loss and gain. 

    There are four major regions that experienced population loss. The largest covers the rural high plains from Texas to Canada, and most marked in Kansas, Nebraska, Iowa, North and South Dakota, and eastern Montana in a continuation of at least 60 years, and no surprise, as farms get larger and more mechanized, small towns decline. Yet these losses are less pervasive than earlier, especially due to energy development in Wyoming, North and South Dakota and Montana, and energy and agricultural change in Oklahoma and Texas. 


    The second area of decline, also continuing a long historic trend, can be seen in the heavily African-American dominated areas in the Mississippi Delta, in Arkansas, Louisiana and Mississippi, and across the Black belt, Alabama, Georgia, and South Carolina, where significant development investment simply did not occur—race matters.

    Third, we see continued population reductions  across Appalachia from eastern Kentucky, through West Virginia, but this loss has now taken gotten more severe in western Pennsylvania and New York, largely due reductions in  mining and manufacturing as well as a dearth  of new investment.

    Fourth is decline across many urban as well as rural counties in the upper Midwest, in Illinois, Indiana, Ohio and Michigan, due to a complex mix of deindustrialization and related forces.

    Looking at losses from the map emphasizing absolute number of population change reduces the significance of the losses in the Plains, as most were small, reveals somewhat larger absolute losses in the Mississippi delta, and the specific Katrina-led losses in greater New Orleans. It highlights the concentration of larger losses in core metropolitan counties, not only in northern Appalachia and the upper Midwest, particularly in Ohio, Pennsylvania and Michigan, but also in other large cities, as St. Louis and Chicago.


    At least eight regions of significant growth can be described. Territorially, the most obvious can be seen in the Mountain stares, from Arizona, through Utah and much of Colorado, Wyoming into parts of Idaho and Montana. The reasons vary, from energy in Wyoming, to more amenity based growth in western Colorado and Montana, to broader, across the board expansions in Arizona, Utah and Idaho. The high fertility in the Mormon realm also played a role. Nevada is, well, Nevada.

    A second area of continuing growth is across the Pacific coast, but especially the entire I-5 corridor, the spillover counties surrounding Los Angeles, California’s Central valley, largely due to high Latino growth (which was a major factor way to the north in Washington state).

    Third is the continuing and large scale boom in and around the largest Texas cities, Dallas, Houston, Austin and San Antonio. All have enjoyed a combination of population and economic growth.

    Fourth is a pickup in growth from Oklahoma across the Ozarks, through northwestern Arkansas and across southern Missouri, from a mixture of industrial development and amenity migration.

    Fifth is a less expected belt of growth from the Chicago suburbs, across western Wisconsin, and Minnesota (especially northern), to Fargo, ND.

    Sixth is the never ending growth of Florida. Seventh is the continuing significant urban and industrial based growth in the middle South, from Tennessee and Kentucky, northern Georgia, through South and North Carolina, into Virginia. Then, eighth, is the high level of growth over what we might call the outer, exurban edges of Megalopolis, from Richmond, Virginia, to southern Maine.

    Looking at absolute gains from the second map shows a quite widespread geography of growth, many micropolitan and small metropolitan counties across the west registered  the highest rates of gain. Similarly across the Plains, while the greatest growth is in suburban counties around the Texas giants, growth was robust in many smaller metropolitan areas and cities, from the Mexican border up to Canada.  Likewise, in the upper Midwest, despite problem in the declining big city cores, growth was stronger in exurban and small metropolitan areas. Across the southeast, despite the stupendous growth around Atlanta, Nashville, Raleigh and Washington DC, the significant pattern is how widespread growth was across much of the region. Florida, too, perhaps grew less fast in its long time biggest cities, but is now filling up the remaining space!

    Finally Megalapolis is far from dormant. The old cores of Baltimore, Philadelphia, New York and Boston may be slow growing or even declining a little,but  the satellite and exurban belt show remarkable gains, especially in Maryland, Delaware and eastern Pennsylvania, in a kind of spillover of investment and residence to its outer limits.

    The Biggest Losers and Gainers

    Absolute losses: The largest loss numbers are in core counties of de-industrializing metropolitan areas in the north. Among just the 21 counties losing more than 10,000, Michigan has 3 for a loss of 260,000, Ohio, 6, for a loss of 228,000, and Pennsylvania 3, for a loss of 81,000. Others include Cook county (Chicago), St Louis city and county, Erie (Buffalo), and Baltimore. Greater New Orleans includes three counties, with a loss of 195,000. The one non-metropolitan county is highly African-American Washington County, MS (Greenville). Indeed, high Black concentration is a common denominator among all these areas.  Race continues to rule demography in much of the south.

    Relative losses:  Most of the counties with the highest loss rate (48 counties with over a 17 percent loss) are rural or small town. The only exceptions are Orleans and St. Bernard (New Orleans). States with high rate loss counties include Texas (7), Mississippi and North Dakota (6), Louisiana (5) Arkansas and Kansas (4), South Dakota, Nebraska, Montana and Alaska (2), and one each in Colorado, Minnesota, Nevada, New Mexico, Oklahoma and West Virginia.  The AR, LA and MS counties are heavily African American.

    Absolute Gains

    51 counties gained more than 100,000 residents. The top 11 are
    Wake, NC :: 273,000
    San Diego :: 281,000
    Collin, TX (Dallas suburb) :: 291,000
    Los Angeles :: 299,000
    Bexar (San Antonio :: 322,000
    San Bernardino :: 326,000
    Tarrant (Ft. Worth) :: 363,000
    Clark, NV (Las Vegas) :: 576,000
    Riverside :: 644,000
    Harris (Houston) :: 692,000
    Maricopa (Phoenix) :: 745,000

    Of the 51 big gainers, ALL are metropolitan, as the 12 in Texas gained 3,171,000, the 12 in California 2,640,000, 7 in Florida 1,335,000, two in North Carolina 497,000, three in Virginia 384,000, and two in Georgia 332000. Many of these counties are Sunbelt core counties, or satellite or spillover counties. Many are suburbs of large metropolitan centers. Of the 51, only 8 are in the “north” of the country (Illinois, Utah, Washington and northern California).

    Relative Gains

    The eight counties gaining more than 75% are
    Sumter, FL :: 75%
    Forsyth GA  ::  78
    Rockwall, TX :: 82
    Loudon, VA :: 84
    Lincoln, WY  :: 86
    Flagler, FL :: 92
    Pinal, AZ :: 109
    Kendall, IL :: 110

    Of the top 35 counties, gaining over 50 percent, Texas had seven, Georgia, six, Florida four, Utah 2, with one each in AK, AZ, CO,ID, IL, IN, IA, MS, NV,NC, OH, PA, SD, VA, WA and WY. Twenty-eight are metropolitan suburbs, three are new small metropolitan areas (FL UT), two are energy development areas (SD, WY) and two more environmental (PA, ID). Finally of the 35, 11 are in the North, 24 in the South.  Eight counties are in both the highest absolute and highest relative lists—Pinal, AZ, Douglas, CO, Loudon, VA, and five in Texas, Collin, Denton, Montgomery, Ft. Bend, and Williamson. Overall, in terms of growth, Texas wins.

    Conclusion

    I know a lot about population in the US, but still I’m glad I didn’t venture predictions ten years ago, as population change is more than a little unpredictable. Yes, Sunbelt growth was expected, but the details were sometimes as expected but there were unusual gains and losses. The data reviewed here are just the totals for redistricting, so no attempt was made to relate population change to economic change. Still, while some of the redistribution to the Sunbelt, or to the Mountain states was amenity or retirement driven, much more seems to be a consequence of massive shifts of industry and services from the higher cost north to the lower cost south. But there is a vast amount of talent and physical plant in these areas so I would not dare to predict that 2020 would be a simple continuation of the last decade.

    Richard Morrill is Professor Emeritus of Geography and Environmental Studies, University of Washington. His research interests include: political geography (voting behavior, redistricting, local governance), population/demography/settlement/migration, urban geography and planning, urban transportation (i.e., old fashioned generalist).

  • Why Outsiders Have Wound Up Running So Much of L.A.

    When I was young and my brother was a little older, we would be in bed before dark on mid-summer evenings. (The times were different then.) We would lay in our separate beds, but only an arm’s length apart as shadows lengthened up the far wall of our room, until the dial of the Zenith radio on top of the dresser was the only light left. The Dodgers’ game would be on. Vin Scully was calling the plays.

    The consolations in the tenor murmur of that voice came with a price. But my brother and I did not know it. We knew vaguely that the Dodgers had broken Brooklyn hearts, but we believed, as we drifted between the last pitch and sleep, that the Dodgers could never again break other boys’ hearts so deliberately. The Dodgers had come here, to this almost perfect place, to be with us.

    My brother and I were wrong. The Dodgers’ arrival in Los Angeles in 1958 was a historic break in the way sports loyalties worked. Until then, a baseball team and most of its fans expected to share a highly specific sense of place. After that – and with increasing callousness – a team’s connection to a place would lag behind corporate values. My brother and I listened to Vin as a boyhood gift, but his voice was (and is) just another opportunity for branding a commodity. From the beginning, the Dodgers’ arrival in L.A. wasn’t an embrace. It was a deal.

    The sale of the team in 1998 to Fox Entertainment Group, owned by Rupert Murdoch’s Australia-based News Corp., was a $311-million deal Murdoch needed to anchor Fox’s cable sports network. It was equally a deal that team owner Peter O’Malley needed to manage the tax implications of inheriting the Dodgers. When Fox sold the team to Boston parking lot entrepreneurs Frank and Jamie McCourt in 2004 for $420 million, the deal was eagerly blessed by MLB Commissioner Bud Selig as a business favor to Fox, holder of baseball’s television broadcast rights. Apparently, everyone inside baseball knew how much that deal stank, how overleveraged the McCourts really were. By taking the Dodgers into receivership last week, Selig is trying to engineer another deal. That probably won’t have much to do with us or Los Angeles either.

    When I was young, on the morning after a game, over the plate of two fried eggs and four strips of bacon my mother made us every school day, I would read Jim Murray’s column in the sports section of the Los Angeles Times, but not for his thoughts on the Dodgers. I read Murray for the sound of the voice in his columns, the same way I read Matt Weinstock, Jack Smith, Art Seidenbaum, and Charles Champlin in the Times. I learned from all of them the centrality of place in an imaginative life, a hunger for the stories, and the power of having a voice. But those are boyhood values that are gone for deals, too.

    Like the arrival of the Dodgers in Los Angeles, the sale of the Times to the Chicago-based Tribune Company in 2000 was a deal that sounded good to Angeleños. Instead of bitter Chandler family members, real journalists would run the paper, even if nearly all of them were out of town. And like the sale of the Dodgers to the McCourts, which floated on so much borrowed money that the franchise is now $525 million in debt, the leveraged sale of the Tribune Company in 2007 to developer Sam Zell turned out to be a cynical farce. Another fast-talking out-of-towner took control of an iconic L.A. institution for cents on the dollar and with no idea of Los Angeles. What mattered was getting the deals done. The deals had nothing to do with this place or our story.

    The deals still do not. The Delaware bankruptcy court overseeing the dismantling of Zell’s empire of paper is only interested in getting its assets sold. Commissioner Selig’s takeover of the Dodgers was only a last-ditch maneuver to prevent the McCourts from saving their borrowed lifestyle by mortgaging the Dodgers’ future broadcast rights.

    Something narrow and coarse in the imaginations of the McCourts and Zell and Selig and their business partners squeezed out any moral dimension to their deals or any feeling for Los Angeles. But to question how they acquired so much of our place so cheaply is uncomfortable for Angeleños. Better to grumble about indifferent outsiders. Seen from their perspective, Los Angeles has only market value, the sort of value that sold Los Angeles to the world as one of the most successful lifestyle products of the 20th century.

    Not anymore. Too many deals have soured; too much of the city has been taken into receivership. Even our citizenship – already problematic – has been foreclosed. Deals under duress have taken too many of our civic institutions from local control and put them in the hands of monitors and special masters, raising another question we would prefer to duck: Do we have the capacity to govern ourselves?

    In 1992, retired Superior Court Judge James Kolts, picked by the county Board of Supervisors to investigate systemic abuses in the Los Angeles Sheriff’s Department, hired attorney Merrick Bobb to review excessive force complaints against deputies. Bobb continues to monitor the LASD’s performance.

    From 1996 to 2006, the Metropolitan Transportation Authority operated under federal supervision, after religious and civil rights organizations charged the MTA with “transit racism.” A special master was appointed by the federal court to oversee the MTA’s bus service under a consent decree to insure that buses would meet demand in low-income neighborhoods.

    Complaints in the early 1990s that special education students were being systematically underserved by the Los Angeles Unified School District led to a civil rights suit and another consent decree under which an Office of the Independent Monitor evaluates the district’s compliance with court orders and federal law. The OIM was supposed to complete its work by 2006, but the district has yet to meet all twelve of the goals set by the consent decree.

    In the aftermath of the Rampart CRASH scandal, in which members of an anti-gang police unit were charged with widespread corruption and unprovoked violence in late 2000, the Los Angeles Police Department entered into a consent decree that made the federal Department of Justice arbiter of virtually every aspect of the department, its officers, and their interactions with suspects. The consent decree ended in 2009 – after the department was turned around by a police chief imported from New York – but a transition agreement compels the LAPD to continue demonstrating compliance to the DOJ.

    Grudging compliance to special masters and appointed monitors may be the best we have to give in a city fragmented by institutional barriers and so distracted from civic concerns. Few of us want to see Los Angeles as it is or what it should be; we’ve let others do it for us. This city’s unaccountable political structure, its conception of power merely as the means to another deal, and the city’s air of disconnected neutrality have let thugs police its streets, unfeeling technocrats run its services, and the McCourts loot its most-loved institution. And when those faults became intolerable, others – not us – imposed their solutions. We’ve come to expect this – and worse – from Los Angeles and ourselves. “Forget it, Jake. It’s Chinatown.” might as well be the motto on the city seal.

    Los Angeles succeeded once, less as a place and more as a succession of slick real estate deals that have reached the limits of our landscape. Truthfully, we never needed a shared moral imagination until now, when so many desertions from the common good have shown us how little loyalty the once powerful had for this place. And no deal, no special master, no court-ordered monitor can supply what we lack.

    D. J. Waldie is a contributing editor at the Los Angeles Times and a contributing writer for Los Angeles magazine. He is the author most recently of California Romantica with Diane Keaton. He blogs for KCET TV at http://www.kcet.org/user/profile/djwaldie.

    Photo by johnwilliamsphd

  • Skepticism Greets US DOT’s Draft Transportation Bill

    An undated— and possibly still unvetted by OMB—draft of US DOT’s legislative proposal for surface transportation reauthorization, the “Transportation Opportunities Act,” has been making the rounds in Washington for the past week. Its publication, however, has been largely ignored by the inside-the-Beltway transportation community. What would ordinarily be an eagerly awaited event and an occasion to compliment the Department , has passed virtually unnoticed. Even the usual cheering squad of Administration-supportive advocacy groups such as Transportation for America, the Building America’s Future coalition and US PIRG has been muted in their approval.

    The reason for this indifference is twofold. Partly, it’s because the DOT draft contains no surprises: it merely restates the proposals already revealed in the President’s FY 2012 Budget request. But more importantly, the draft has been ignored because it has been judged to lack political savvy and realism. Even the highly partisan liberal Streetsblog was obliged to pronounce the draft bill as irrelevant. Wrote Tanya Snyder, its Capitol Hill correspondent in a level-headed assessment, “…don’t expect it to be central to the debate in Congress. By refusing to adjust to a still-struggling economy, high gas prices, and a deficit-obsessed Congress, the president has rendered his own plan moot.”

    Snyder’s dismissive verdict is understandable. Consider the following:

    Item: Multiple congressional spokesmen have stated in recent months that future surface transportation funding will be limited to the tax revenues deposited into the Highway Trust Fund. There will be no further rescue or “bailout” of the Trust Fund using general funds; “deficit funding is out of the question”; “government must learn to live within its means.” The House Transportation and Infrastructure Committee reaffirmed this position as recently as March 15 in its “Views and Estimates for Fiscal Year 2012” report. Yet the US DOT chose to ignore these unambiguous congressional signals. Its legislative draft has reaffirmed the initial White House proposal for a six-year surface transportation program totaling $556 billion, with an up-front FY 2012 appropriation of $50 billion. Meanwhile, transportation-related tax revenues are expected to average only $38 billion/year, for a six-year total of $230 billion according to the latest Congressional Budget Office estimates. In recent appropriation hearings on the FY 2012 transportation budget, Transportation Department officials failed to explain how the resulting shortfall of over $300 billion would be funded.

    Item: In its draft bill, the US DOT has proposed to devote $53 billion over six-years to pursue a “high-speed” rail program that would eventually (in 25 years) give 80 percent of Americans access to high-speed rail service. Yet Congress has rescinded all of FY 2011 funding for the high-speed rail program and House Republican leadership has announced its intention to totally eliminate support for high-speed rail beginning next year. Even if a modest passenger rail program should survive, it is likely to be focused on the Northeast Corridor, as Rep. Mica has strongly suggested, and not pursue a quixotic multi-billion dollar national “high-speed” rail vision as conceived and advocated by the White House.

    Item: In its draft bill, the US DOT has proposed to expand the existing Highway Trust Fund into a successor “Transportation Trust Fund.” The expanded Fund would include four accounts – for Passenger Rail, Highways, Transit and an Infrastructure Fund. To fund the two new accounts plus the expanded Highway and Transit accounts, the Transportation Department has proposed an unspecified new “energy tax” to supplement the existing sources of revenue (i.e. transportation-related taxes on fuel, heavy trucks and tires). However, the initiative for any new tax measures must originate with the House Ways and Means Committee. With the House Republicans on record as opposed to any new taxes, and with bipartisan desire not to increase the consumers’ cost of energy, any proposed “energy tax” has virtually zero chance of success in the 112th Congress. (Note: it’s not even certain whether the energy tax proposal would survive OMB review).

    Item: The US DOT has proposed a three-part “Livability” program totaling $27.5 billion over six years. The program would subsume existing formula-based transportation enhancement activities and include a program of discretionary grants for bicycle, pedestrian and capacity building activities. However, the ill-defined “livability” concept has met with profound skepticism on the part of House Republicans. Congressional sources have made it known that a “livability” program is unlikely to be a part of any future surface transportation bill.

    Item: The US DOT has proposed a “National Infrastructure Innovation and Finance Fund” to finance transportation infrastructure projects of national and regional significance through grants, loans, loan guarantees and lines of credit. The Fund, administered by a heavily bureaucratized structure (executive director, nine-member Investment Council, Advisory Committee) would receive $30 billion over six years. This proposal, also know as the National Infrastructure Bank, faces considerable bipartisan skepticism and overt opposition by several influential House and Senate leaders. Its chances of passage are rated at less than 50-50.

    In sum, the unreality of its fiscal ambitions and the lack of political support for its key programmatic initiatives has rendered the DOT’s legislative proposal “dead on arrival” in the judgment of congressional observers. That is not to say that the proposal deserves to be totally ignored. Many of its programmatic provisions – for example, those dealing with accelerated project delivery, tolling, highway and motor vehicle safety, “state of good repair” policy, pursuit of VMT fees, performance management and freight policy—are worthy of consideration and will likely find their way into the final bill.

    However, the Washington policy establishment is largely ignoring what it considers a stubborn refusal by the drafters of the US DOT bill to face the facts and adjust to political realities. Instead, transportation stakeholders are awaiting the release (probably in late June) of the House Transportation and Infrastructure Committee bill that will more correctly reflect the mood of the Congress, the stakeholders and of the country. It is safe to conclude that what is likely to emerge from that committee — and eventually approved by the full House and the Senate— will bear little resemblance to the U.S. Transportation Department’s unrealistic draft legislative proposal.

    Ken Orski has worked professionally in the field of transportation for over 30 years.

    Flickr photo of Seattle’s I-90, I-5 Interchange, by Flickr user “rutlo”, available online at http://www.flickr.com/photos/rutlo/3197844879/

  • The Dispersionist Manifesto

    We live in an era of the heady drumbeat of urban triumphalism. In a world that is now, by some measures, predominately urban, observers like historian Peter Hall envision a “coming golden age” of great cities. It is time to look at such claims more closely, replacing celebratory urban legends with careful analysis. Although the percentage of people living in cities is certain to grow, much of this growth will be in smaller cities, suburbs and towns. And it is unclear whether extreme centralization and densification are either inevitable or desirable, for as cities get larger—both in the developed and developing world—they display a tendency to become increasingly congested, bifurcated by class and economically inflexible.

    It may be time to propose a less gargantuan vision that is more humane for the vast majority of people. This alternative view embraces not cramming and concentration— the favored strategies of most planners, pundits, architectural stars and their urban land-owner enablers—but the protean development of more dispersed and less concentrated cities and suburbs. This is what is happening in most cities in the world today, and has been the pattern of urban areas throughout history.

    There are numerous signs that this reality is taking root, both in the developing world and in high-income countries. Shlomo Angel, a lecturer at the Woodrow Wilson School at Princeton, has shown that as the world’s urban population has grown, the percentage living in the 100 largest cities has declined. Between 1960 and 2000, the share of the largest cities declined from nearly 30 percent to closer to 25 percent. Since the nineteenth century, notes Angel, urban population densities have declined, as people have sought out less dense, more appealing, and usually less costly locations on the periphery. This is true, he points out, in London and even to some extent Mumbai, as well as in the United States. As the World Bank has noted: “Cities became more packed and more sprawling at the same time.”

    What may be best is to forge not an agenda for centralization, but policies that promote both smaller cities and villages. This, notes Ashok R. Datar, chairman of the Mumbai Environmental Social Network and a long-time advisor to the Ambani corporate group, may represent the most practicable strategy for relieving the unbearable congestion that threatens so many mega-city environments.

    Down from the Commanding Heights

    The dispersionist viewpoint challenges the assumption that the bigger, more densely packed a city is, the better. This approach appeals to prominent urbanists, such as the University of Chicago’s Saskia Sassen, who see such places as the inevitable occupiers of the (Leninist) “commanding heights” of the global economy. To spread out economic growth, a World Bank report asserts, is to discourage it.

    The dispersionist view begs to differ. In many important ways, the largest urban agglomerations can also be seen as gradually losing their edge to more smaller cities. One of the ironies of this Age of Cities lies in the fact that relative size is no longer the overwhelming critical advantage as was the case in the less urbanized past. Before the late twentieth century, big cities were efficient and economically viable. The greatest urban centers of history—Babylon, Rome, Constantinople, Paris, London, Kaifeng, Baghdad, New York, Tokyo—grew in part because concentration provided the best, and sometimes only, way to support the basic infrastructure for commerce, cultural development, state religion or the exercise of power. But increasingly size not only matters less, but actually can be seen as a detriment to efficient, sustainable urbanism. This is particularly evident in the developing world where urbanization is spreading most rapidly. With the exception of Tokyo, the world’s most populous urban agglomerations—Delhi, Mumbai, São Paulo, Mexico City—have evolved into almost unspeakably congested leviathans, plagued by both deepening class divides and environmental problems.

    By 2025, cities in developing countries are projected to account for eight of the ten world’s largest cities. Four will be located in the Indian subcontinent alone, and each will accommodate twenty million or more residents. They may be seen as “colorful” by what one writer calls “slumdog tourists,” and “exciting” for those working within the confines of their “glamour zones,” but for most of their citizens life will be very difficult, and better only compared to what are even more dismal conditions in the countryside.

    Over the past forty years, the percentage of Mumbai’s population living in slums has grown from one in six to a majority. One indicator of the conditions there: the average Mumbaiker’s lifespan is now seven years less than the national average. This is all the more remarkable since most Indians still live in villages with very limited sanitation and even less access to quality health care. Concentrating more people in Mumbai or other developing mega-cities represents a form of lunacy. Much the same can be said for Kolkata, Manila, Cairo, Mexico City, and Lagos.

    On the other hand, the dispersionist notion emphasizes second and third tier city development. Already many Indian businesses and skilled workers are moving to smaller, less congested, often better-run cities such as Bangalore, whose density is roughly one-fourth of Mumbai’s, or Ahmadabad in the state of Gujarat. Much of this new growth takes place in campuslike settings on the edge of the city that take advantage of newer infrastructure and offer workers a less harried way of life. Many of India’s key industries—auto manufacturing, software and entertainment— are establishing themselves in such smaller cities, which are far less dense and less populated than Mumbai or Kolkata.

    In a more planned fashion, China is embracing decentralization, encouraging growth in smaller interior cities such as Chengdu, Wuhan and Xi’an. Such cities, notes Chengdu-based architect Adam Mayer, offer a healthy alternative to the coastal megacities of Shanghai, Hong Kong, Shenzhen, and Guangzhou. China’s bold urban diversification strategy hinges both on forging new transportation links and on nurturing businesses in these interior cities.

    Such commitment, and the resources to fund it, are lacking in much of the developing world. Africa, for example, now boasts many huge, and rapidly growing, cities, but it is hard to describe Lagos in Nigeria, Luanda in Angola, and Kinshasa in the Democratic Republic of the Congo as places with particularly bright prospects. One exception may be Capetown, the beautiful South African coastal city that shone so well during the recent World Cup. Latin America, too, has a plethora of huge and growing cities, but it is hard to imagine Mexico City and São Paulo as likely hot-spots for future economic growth. Instead the best prospects lie in smaller cities like Santiago, the capital of resource-rich Chile, or Campinas, a growing smaller Brazilian city with three million residents that lies outside the congested São Paolo region.

    This shift to smaller cities, as Michigan State’s Zachary Neal points out, has been conditioned by rapid improvements in telecommunications and transportation infrastructure. But perhaps the most conclusive evidence that smaller can be better and more efficient can be found in other parts of the developing world. Cairo, Baghdad, and Tehran are the biggest cities in the Middle East, but they are hardly economic successes. In contrast, Tel Aviv, whose total metropolitan population is only three million, has emerged as a major center for technology as well as one of the world’s premier diamond centers. The other leading candidates in the region hail from the United Arab Emirates, notably oil-rich Abu Dhabi and perhaps also its now financially weakened neighbor, Dubai.

    No place illustrates the principle that smaller can be better as well as Singapore. With roughly four million residents, Singapore ranks only sixtieth in terms of population among the world’s cities. But its economy clocks in at twenty-seventh, ahead of much larger Mumbai. In per capita terms, by purchasing power parity, it boasts an income of $62,200, one of the highest in the world, and behind only Liechtenstein, Luxembourg, Bermuda, and Qatar (and roughly the same as the United States). This is a remarkable achievement for a city-state whose per capita income at the time of its independence in 1965 was equal to those of other developing countries. Today Singapore boasts one of the world’s largest ports, a highly efficient subway system, and among the world’s most impressive skylines. It is easily the cleanest, most efficient big city in all of Asia. It is noteworthy that Singapore has employed its collective intelligence to develop a socially, economically and increasingly environmentally viable city in a space of only 268 square miles.

    The High-Income World

    The dispersionist reality is also evident in the high-income world. Even though some city cores have improved markedly, the largest and densest urban regions have performed somewhat worse than newer, smaller and often less compact urban areas. This decentralizing trend can also be seen in the western United States. In 1965, New York presided over the American economy like a colossus, accounting for more than 150 of the nation’s 500 largest companies; today that number is fewer than fifty. Not far behind New York are Los Angeles and Chicago, which also claim the coveted status of “world city.” In the meantime, a host of smaller and far more dispersed Texas cities have come to the fore. Houston, Dallas, San Antonio, and Austin enjoy the most rapid job and population growth of the nation’s largest metropolitan regions. Houston, which replaced New York as the center of the global energy industry, now has more Fortune 500 companies than Chicago. Together, the four Texas cities boast more large company headquarters than greater New York.

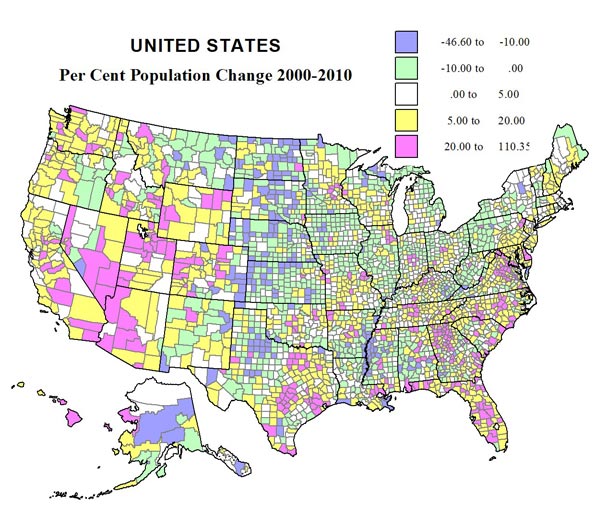
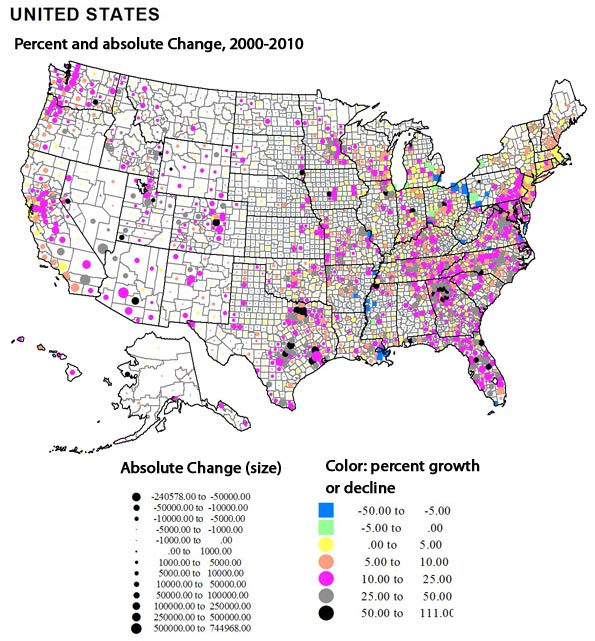
    But this movement from large dense cities to less dense ones represents only part of the dispersionist trend. A more critical one involves the movement from larger cities to smaller ones. In fact, between 2000 and 2008, notes demographer Wendell Cox, regions of more than ten million suffered a 10 percent rate of net outmigration. The big gainers were cities between 100,000 and 2.5 million residents. The winners included not only cities in Texas, but also southern urban regions such as Raleigh-Durham, now the fastest growing metro area over one million in the nation, and Nashville, and rising Heartland cities such as Columbus, Indianapolis, Des Moines, Omaha, Sioux Falls, and Fargo. Among urban areas of over one million, Columbus, Raleigh, Indianapolis, Denver and Kansas City all rank considerably ahead (in terms of growth of educated migrants between 2007 and 2009) of megacities such as New York, Los Angeles and San Francisco, according to the most recent American Community survey. One key advantage for these smaller cities is the price of housing. Even after the real estate bust, according to the National Association of Home Builders, barely one in three Los Angeles median-income households can afford a median-priced house; in New York, that ratio falls to one in four. In contrast, in regions such as Raleigh, Austin, San Antonio and Indianapolis, between two in three or four in five can afford the American dream. Advocates of dense cities mega-regions often point out that many poorer places, including old Rustbelt cities, enjoy high levels of affordability while regions such as New York do not. But that does not mean that affordability itself is a problem; areas with the lowest affordability, including New York, also have suffered among the high rates of domestic outmigration. The formula for a dynamic region mixes affordability with a growing economy.

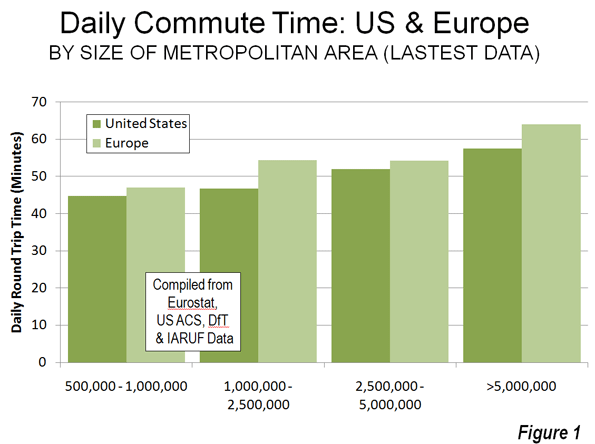
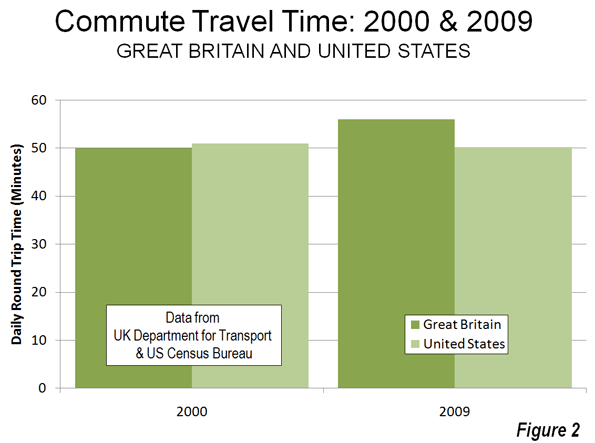
    The smaller cities also are often easier for workers and entrepreneurs in which to do business. Despite the presence of the nation’s best developed mass transit system, the New York area has the longest commuting travel times; the worst are in Queens and Staten Island. As a general rule, average commuting time also tends to be longest in some of the biggest denser cities, notably New York, Chicago, and Washington, D.C. In contrast, the average commutes in places like Salt Lake City and Kansas City are slightly above twenty minutes. Over a year, moving to these smaller cities can save roughly 70 hours a week in commuting time.

    Finally there is the critical social issue. The largest cities such as New York and Los Angeles also tend to suffer the most extreme polarization of incomes. New York, for example, now has a distribution of wealth roughly twice as concentrated at the top than the national average. In 1980 Manhattan ranked seventeenth among the nation’s counties for social inequality; by 2007 it ranked first, with the top fifth of wage earners earning fifty-two times that of the lowest fifth, a disparity roughly comparable to that of Namibia. This is not only an American phenomenon. A study of the core city of Toronto, for example, found that between 1970 and 2001 the portion of middle-income neighborhoods in the city had dropped from two thirds to one third, while poor districts had more than doubled to 40 percent. By 2020, according to the University of Toronto researchers, middle-class neighborhoods could fall to barely less than 10 percent, with the balance made up of affluent and poor residents.

    Increasingly, one sees income gaps in high-income country megacities that one normally associates with developing countries. This is particularly true in expensive megacities whose finance-driven economies create high costs but lesser opportunities for middle and working class families. Once cost of living is factored in, more than half the children in inner London live in poverty, the highest level in Great Britain. More than one million Londoners were on public support in 2002.

    The Triumph of Suburbia

    We can see the impact of dispersion not only in the movement between cities but also in population shifts within them. Even the great metropolitan areas are, for the most part, de-concentrating. They increasingly boast not one center but a series of smaller ones, some far from the urban core. This can also be seen in both developing and high-income cities. The new business center of Mexico City, for example, is located in suburban Santa Fe and not the historic core. Much of the Mumbai entertainment complex known as Bollywood long ago migrated to the northern suburbs, with their malls and less dense neighborhoods.

    This pattern can be seen even more in the high-income countries. In virtually every major city in Europe, the urban core now represents a smaller percentage of the metropolitan population than two decades ago. Cities such as London, Paris, Frankfurt and Madrid, despite the presence of excellent mass transit, are far more suburbanized and decentralized than they were two decades ago. Since 1965, virtually all European major metropolitan area growth has been in the suburbs. Indeed, the share of the metropolitan area population gains in the suburbs has been greater in Western Europe than in the United States. As in the United States, this reflects in part the shift of technology industries into suburban areas. The reasons for this may have much to do with the family-oriented nature of many engineers and scientists, and their preference for campus-like settings. This is true both in the Grande Couronne around Paris, where many French tech firms cluster, and in Great Britain. The dynamic growth in fields such as technology and high-value-added and design-led manufacturing are concentrated not in the core, or even the surrounding suburbs, but in the outer reaches of the Thames Valley and around Cambridge. New home-work opportunities and attractive housing concentrates workers in such places, as well as in cities such as Bath and Taunton. “Cities,” concluded one recent report by the British Urban Regeneration Association, “are no longer the main source of new enterprises.”

    This statement will be familiar to people who study North America. For all the talk about new media and other tech related fields clustering in “hip and cool” urban cores, the greatest concentrations of technology industries are in predominately suburban areas, such as those on the periphery of Ottawa, Montreal, and Toronto, or Route 128 around Boston, Orange County, California and the hill country around Austin, Texas. One reason is that the brain power is there. According to the United States Census, eighteen of the nation’s twenty counties with the highest percentage of college-educated people over twenty-five are in either suburban or small cities.

    Silicon Valley, the world’s predominant high-tech concentration, remains to a large extent a vast suburb. The headquarters of such firms such as Intel, Apple, and Google are not in urbanized, transit-oriented San Francisco, but in sprawling, car-dominated places like Santa Clara, Cupertino and Mountain View. Although there are some pockets of density, the Valley essentially functions along suburban lines with no significant real urban core. Transit ridership in the Valley now stands at 3 percent, closer to a Phoenix or Houston than a New York or San Francisco.

    These economic trends are also reflected in demographics. Nationwide, over the past decade, suburbs have accounted for 85 percent of all metropolitan growth. Over the past decade, out of the forty-eight metropolitan areas, suburban counties gained more migrants than core counties in forty two cases; virtually all the fastest-growing communities in the country over the past decade have been located on the suburban fringe. Another indicator: Despite all the talk of people moving “back to the city” to experience the joys of density, between 2000 and 2008, the share of households living in detached housing rose from 61.4 percent to 63.5 percent.

    The Urban Future

    Whether in the high income or developing world, the evidence suggests our urban future will be more diverse—and dispersed—than commonly assumed. Like the housing around some suburban areas, there has also been a crash in many inner city markets.

    As a result of overestimating the demand for high density, there are sad stretches of abandoned or drastically devalued highrise and mixed-use areas in Miami, Kansas City, Chicago, Los Angeles and even the core of Portland, where condo prices have tumbled by at least 30 percent since 2007.

    Rather than force a density agenda on a largely unwilling population, it is better to consider how to make the more dispersed urban future more workable and sustainable. In the developing world, this might include the development of regional employment centers to reduce the often unbearable congestion of the urban core. At the same time, more thought should be given to allowing for houses on small lots, which could serve as gardens or placing for small household industry. In the high-income countries, there will be new opportunities in what may have once been considered second-tier markets to develop new urban amenities. There will be similar openings in the suburbs and even exurbs. Although these areas will not become densely packed, they will become more urban in many ways.

    Much also can be done to make our dispersing geography more environmentally friendly. Recent studies by environmental scientists in Australia suggest that the carbon footprint of high-rise urban residents, contrary to the conventional wisdom, is higher than that of medium and low-density suburban homes, due to the cost of heating common areas such as parking garages, and the highly consumptive lifestyles of more affluent urbanites, a considerable number of whom own second residences in the countryside. Even if these claims are exaggerated, there is no question suburbs and lower-density cities can be made more environmentally sustainable by such relative low-cost, relatively unobtrusive steps, these including insulation and tree-planting as well as the adoption of more fuel-efficient automobiles and a greater embrace of telecommuting, which is by far the fastest form of commute to work.

    Instead of clinging to the idea that density and concentration are best, planners, architects and developers would do better to focus what appeals to the vast majority of the population, particularly the middle and working classes. Nurturing smaller, more efficient cities, as well as expansive suburbs and revived small towns, may prove far more practical and beneficial to society than imposing the manic agenda among planners, pundits and urban land speculators for relentless centralization.

    This piece originally appeared in Wharton Real Estate Review.

    Joel Kotkin is executive editor of NewGeography.com and is a distinguished presidential fellow in urban futures at Chapman University, and an adjunct fellow of the Legatum Institute in London. He is author of The City: A Global History. His newest book is The Next Hundred Million: America in 2050, released in February, 2010.

    Photo by Paul Sapiano

  • Stories from the 2010 Census: Race and Ethnic Change in Washington State

    The city of Seattle is an exceptional place. The 2010 census figures on race, ethnicity and age confirm this reputation. The main story from the census findings is the continued gentrification of Seattle, with displacement of minorities and the less affluent out of the center of the city, especially to south King county and Pierce county. The city core is becoming whiter, while the edges and suburbs, north and east as well as south are becoming far more diverse.

    A second part of the story is the overall increase in the minority population, both statewide and in central Puget Sound. I present six maps, the first four showing the census tracts with the highest shares of Black, Asian, Native American, Latino, and those with two or more races. The last two show change in the share of all minorities (or of whites, looking at it from that point of view) for the state and for the greater Seattle area, a remarkable summary of the new face of the metropolis.

    The Black share of the population, which did grow substantially in the decade, grew mainly in the very south end  of Seattle, south to Tukwila, a smaller area in south Tacoma, with belts over 10 percent Black covering much of central and south Seattle, south King county and much of Tacoma and Lakewood. Unlike the 1960s through 1980s, there is NO tract over half Black (the highest is 41 percent). Shares in most of the region remain well below 5 percent, rural small town areas below one percent.  Blacks and Asians are not well represented outside greater Seattle.

    The Asian population is much larger than the Black total, and higher shares are far more widespread. Unlike the concentration that has long existed on south Seattle’s Beacon Hill , the 2010 map shows equally high shares in many parts of the eastside, especially Bellevue and Redmond and Sammamish, and smaller areas in south King county and south Everett. The newer areas are also areas of high foreign born and immigration of professionals from Asia.

    Unlike the Black and Asian populations, the Native American and Latino populations are more prevalent outside the metropolitan Seattle core.  The Native American population resides mainly on official reservations, often dominating their census tracts. The largest area and population is associated with the Yakama nation in central Washington. The Latino population of the state increased 71 percent to 756,000 in 2010.  From the map, it’s clear that the Latino population follows the irrigated agriculture of the Columbia basin, including the small metropolitan areas of the Tri Cities (Kennewick-Richland-Pasco) and Yakima.

    The highest Latino shares in the metropolis are in south King county and Pierce county, rather similar to the pattern for African-Americans, but with a more westerly orientation in south Seattle  and Renton.  Native American populations remain quite concentrated in the recognized reservations, quite urban in Tacoma (Puyallup), suburban in Snohomish and King counties, and exurban in Kitsap county. About five percent of Washingtonians identify as of two or more races, a remarkable 47 percent increase. The main areas are most associated with the major military reservation , Ft. Lewis-Mc Chord in Pierce county, with lesser shares in highly diverse south Seattle and south King county.


    A map of all minorities would attest to the diversification of two parts of the state, the Columbia basin in eastern Washington, and the greater Seattle area, with up to half the urban footprint showing shares over 35 percent non-white, and with much of south King county and south Tacoma, and parts of Bellevue-Redmond now over 50 percent. This is a remarkable shift from an overwhelmingly white suburbia of 20 years earlier.

    Perhaps even more revealing has been the low share of minorities in professional, affluent, highly educated parts of Seattle— what analyst Aaron Renn has dubbed “the white city”.  Homogeneity also prevailed in far suburban, exurban and rural areas but these areas rarely lay much claim to be “multicultural.”

    The change in greater Seattle’s Black population reveals its continuing exodus/displacement from Seattle, and its continuing suburbanization.  Asians too experienced tremendous growth in the suburbs, especially in eastern King county and suburban Snohomish county. Change in the Latino population, like that of the Black population, is greatest in south King county, into south Tacoma, but also in the SR99 corridor in Snohomish county. Growth in both the Black and Latino populations follows that of less affluent housing markets than is evident in the areas with expanding Asian populations.

    The map of minority population change for the Seattle region highlights the exceptionalism of the city of Seattle.  Most observers would probably be drawn to the dramatic and obvious diversification of suburbia, in all directions, north, east and south of Seattle. But as a 55 year resident of Seattle, the most dramatic feature is that much of Seattle has become whiter or only slightly more diverse. In contrast  the bulk of the region has become more ethnically and racially complex . 

    The reasons for this redistribution are complex, but we know that the popularity of living in Seattle on the part of younger, less familial and more professional households, together with shifts in the housing stock away from family housing, was critical in making the central city less diverse and the rest of the region, and much of the state, more so.

    Diversity

    How can we measure diversity?. Usually it is  measured as the degree to which the shares of major racial and ethnic groups are equal. So maximum diversity for six groups (Blacks, Native Americans, Asians, Latinos, Whites, and those of two or more races, would be .167, if each group were one sixth. An area 100 percent of one race would have zero diversity or an index of 1.


    Viewed this way, the  2010 census may surprise the reader. Seattle has long been the most or among the few most diverse places in the state and many people probably believe it still is. But according to the 2010 census Seattle has been displaced by dozens of places in its own region! It has become slightly more diverse, as suburban cities, mainly but not only to the south have become markedly more diverse.  Many might also think eastern Washington, with its increasing Latino population, must be highly diverse. But no, the hotbed of diversity is from the southern part of Seattle, through south King County, to and beyond Tacoma.  Table 1 lists the most diverse places. The top six most diverse places are  just beyond the city of Seattle, and their diversity is amazingly high.  In Pierce County a belt of high diversity extends from Fife and the Puyallup reservation across south Tacoma to Lakewood, Parkland, Spanaway and Ft.Lewis-McChord.  This is truly a remarkable transformation.

    Most Diverse Urban Places in Washington
    Rank Place Diversity
    1 Tukwila 0.241
    2 Sea Tac 0.247
    3 BrynMawr-Skyway 0.249
    4 Boulevard Park 0.259
    5 White Center 0.264
    6 Riverton 0.273
    7 Fife 0.295
    8 Kent 0.312
    9 Renton 0.319
    10 Federal Way 0.324
    22 Tacoma 0.401
    40 Seattle 0.471

    Washington state and even greater Seattle are still much “whiter” than most other larger states. The exception has been a relatively high share of Asian people, due to our port of entry position from Asia.  But the last decade has been one of increasing diversity, especially in metropolitan suburbs and in eastern Washington.


    Richard Morrill is Professor Emeritus of Geography and Environmental Studies, University of Washington. His research interests include: political geography (voting behavior, redistricting, local governance), population/demography/settlement/migration, urban geography and planning, urban transportation (i.e., old fashioned generalist).

  • China: Urbanizing and Moving East: 2010 Census

    The National Bureau of Statistics of China has just released the first results of the 2010 census. The new figures portray a radically reduced population growth rate, rapid urbanization and an unprecedented domination of population growth by the East Coast.

    Slowing Population Growth: China, the world’s most populous nation, grew rapidly until the early 1980s. The strongest growth since 1950 was in the 1964 to 1982 census period, during which the annual growth rate exceeded two percent. By the 1990 to 2000 period, the annual rate had fallen to 1.1 percent and then dropped in half to approximately 0.6 percent between 2000 and 2010 (Figure 1). The nation’s total population growth between 2000 and 2010 was approximately 75 million. In contrast, the 1964 to 1982 rate would have produced a population increase of 300 million people. Two key factors have   influenced this drop in population growth rate. The first is rapidly improving affluence, a factor routinely associated with lower birth rates around the world. The second factor is China’s one child policy, which is contributing to an aging of the population and has been associated with an increasing male to female birth ratio.

    Accelerating Urbanization: Between 2000 and 2010, China continued to urbanize at a pace and scale never seen before in world history (Figure 2).  China added approximately 205 million urban residents over 10 years, more urban residents than live in any country except for India and the United States. China’s urban population expansion was 2.5 times the estimated increase in rapidly urbanizing India. In 2010, nearly 50 percent of the population lived in urban areas, compared to 37 percent in 2000. This increase is well above expectations. The United Nations had projected an urbanization share of 47 percent, which would have converted to approximately 50 million fewer urban residents.

    A large share of the increase in urban population was from the nation’s large migrant population, which lacks registration (hukou status) at its current, generally urban place of residence. A floating population, this group rose from 120 million in 2000 to 220 million in 2010. This movement of 100 million people dwarfs the national population increase of 75 million. Previous data indicated that virtually all of Shanghai’s population growth was due to migration of (principally poorer) people from elsewhere, as has occurred elsewhere in the nation.

    Moving East: For the first time since 1950, one region of the nation was dominant (Figure 3), with 83 percent of growth on the already heavily urbanized East Coast. In contrast, the center (East Central and West Central regions) combined for only eight percent of the growth, which is down from 41 percent between 1990 and 2000 and 56 percent between 1964 and 1982 (Note 1) Regional and provincial level population trends are indicated in the table below (link to provincial level map).

    China Population Trends by Region & Province
    1990-2010
    1990 2000 2010 1990-2000 Change 2000-2010 Change Share of Growth: 1990-2000 Share of Growth: 2000-2010
    CHINA    1,130.49    1,262.28       1,332.77 11.7% 5.6% 100.0% 100.0%
    EAST COAST 428.61 493.84 552.20 15.2% 11.8% 49.5% 82.8%
    NORTH 165.08 182.06 200.20 10.3% 10.0% 12.9% 25.7%
      Beijing        10.82 13.82 19.61 27.7% 41.9% 2.3% 8.2%
      Hebei          61.08 67.44 71.85 10.4% 6.5% 4.8% 6.3%
      Shandong       84.39 90.79 95.79 7.6% 5.5% 4.9% 7.1%
      Tianjin        8.79 10.01 12.94 13.9% 29.3% 0.9% 4.2%
    CENTRAL 151.89 172.60 193.00 13.6% 11.8% 15.7% 28.9%
      Fujian         30.05 34.71 36.89 15.5% 6.3% 3.5% 3.1%
      Jiangsu        67.06 74.38 78.66 10.9% 5.8% 5.6% 6.1%
      Shanghai       13.34 16.74 23.02 25.5% 37.5% 2.6% 8.9%
      Zhejiang       41.45 46.77 54.43 12.8% 16.4% 4.0% 10.9%
    SOUTH 111.63 139.18 159.00 24.7% 14.2% 20.9% 28.1%
      Guangdong      62.83 86.42 104.30 37.5% 20.7% 17.9% 25.4%
      Guangxi        42.25 44.89 46.03 6.3% 2.5% 2.0% 1.6%
      Hainan         6.56 7.87 8.67 20.0% 10.2% 1.0% 1.1%
    NORTH EAST 99.33 106.55 109.52 7.3% 2.8% 5.5% 4.2%
      Heilongjiang   35.21 36.89 38.31 4.8% 3.9% 1.3% 2.0%
      Jilin          24.66 27.28 27.46 10.6% 0.7% 2.0% 0.3%
      Liaoning       39.46 42.38 43.75 7.4% 3.2% 2.2% 1.9%
    EAST CENTRAL 344.25 375.23 381.43 9.0% 1.7% 23.5% 8.8%
    NORTH 106.40 116.59 119.92 9.6% 2.9% 7.7% 4.7%
      Anhui          56.18 59.86 59.50 6.5% -0.6% 2.8% -0.5%
      Inner Mongolia 21.46 23.76 24.71 10.7% 4.0% 1.7% 1.3%
      Shanxi         28.76 32.97 35.71 14.6% 8.3% 3.2% 3.9%
    SOUTH 237.85 258.64 261.51 8.7% 1.1% 15.8% 4.1%
      Henan          85.51 92.56 94.02 8.2% 1.6% 5.3% 2.1%
      Hubei          53.97 60.28 57.24 11.7% -5.0% 4.8% -4.3%
      Hunan          60.66 64.40 65.68 6.2% 2.0% 2.8% 1.8%
      Jiangxi        37.71 41.40 44.57 9.8% 7.7% 2.8% 4.5%
    WEST CENTRAL 236.49 259.61 259.18 9.8% -0.2% 17.5% -0.6%
    NORTH 59.91 67.29 69.20 12.3% 2.8% 5.6% 2.7%
      Gansu          22.37 25.62 25.58 14.5% -0.2% 2.5% -0.1%
      Ningxia        4.66 5.62 6.30 20.7% 12.1% 0.7% 1.0%
      Shaanxi        32.88 36.05 37.33 9.6% 3.5% 2.4% 1.8%
    SOUTH 176.58 192.32 189.98 8.9% -1.2% 11.9% -3.3%
      Chongqing      28.86 30.90 28.85 7.1% -6.6% 1.5% -2.9%
      Guizhou        32.39 35.25 34.75 8.8% -1.4% 2.2% -0.7%
      Sichuan        78.36 83.29 80.42 6.3% -3.4% 3.7% -4.1%
      Yunnan         36.97 42.88 45.97 16.0% 7.2% 4.5% 4.4%
    FAR WEST 21.81 27.05 30.44 24.0% 12.5% 4.0% 4.8%
      Qinghai        4.46 5.18 5.63 16.2% 8.6% 0.5% 0.6%
      Tibet          2.20 2.62 3.00 19.3% 14.6% 0.3% 0.5%
      Xinjiang       15.16 19.25 21.81 27.0% 13.3% 3.1% 3.6%

    East Coast: The East Coast growth share of 83 percent is far higher than in previous census periods, which reached a high at 49 percent between 1990 and 2000. The share of growth was consistent within the sub-regions of the East Coast. The North, surrounding Beijing and the Yellow River (Huang He) Delta, accounted for 26 percent of the growth. The Central East Coast, with Shanghai and the Yangtze River (Changjiang) Delta at its core, captured 29 percent of the growth. The South, centering on the Pearl River Delta, and the megacities of Guangzhou, Shenzhen and Dongguan, accounted for 28 percent of the growth (Note 2).

    All of the 11 provincial level jurisdictions (Note 3) on the East Coast all except for Guangxi grew at least as fast as the nation. The fastest growth in the nation was in the three provincial level municipalities: Beijing, where the population increased 42 percent, Shanghai at 38 percent and Tianjin at 29 percent. Even so, Beijing’s population was a full two million less than some estimates, while Shanghai’s was nearly one million more than current city estimates.

    Outside the provincial level municipalities, Guangdong was the fastest growing in the nation, adding 21 percent. Guangdong became the nation’s largest provincial level jurisdiction, reaching 104 million and adding 18 million new residents. The Guangdong count was particularly surprising, roughly 7 million higher than would have been expected based upon 2009 population estimates. Zhejiang, adjacent to Shanghai grew 16 percent. Hainan, an island province carved from Guangdong in the 1980s, grew 10 percent.

    North East: The North East ("Manchuria" or "Dong Bei") accounted for only four percent of the nation’s growth, down significantly from previous census periods.  All three provinces grew at lower rates than the nation. These are traditional manufacturing areas that have not seen the sort of investment seen further south.

    East Central: The East Central provinces accounted for eight percent of the nation’s growth, down from 23 percent between 1990 and 2000. Among the seven provinces, only Shanxi and Jiangxi grew faster than the national rate. Hubei, home of Wuhan, one of the nation’s largest urban areas, experienced a loss of more five percent, the second largest population decline in the nation after Chongqing. The northern East Central jurisdictions grew at approximately one half the national rate, while the south grew at approximately one fifth the national rate.

    West Central: The seven West Central provincial level jurisdictions lost population in an amount equal to -0.6 percent of the national growth. This compares to an18 percent share of national growth between 1990 and 2000. The provincial level municipality of Chongqing experienced the largest rate of population loss in the nation at seven percent. Sichuan, from which Chongqing was carved in the 1990s, lost three percent of its population. Nonetheless, two provincial level jurisdictions in the West Central grew faster than the national rate, Ningxia and Yunnan. As in the East Central, the North grew at approximately one half the national rate. The South experienced heavy rural population losses, even as large urban areas, such as Chongqing and Chengdu experienced strong population gains.

    Far West: The jurisdictions of the Far West captured five percent of the national growth. The Far West grew the fastest among the regions, at 12.5 percent compared to 11.8 percent on the East Coast.  Each of the jurisdictions, Xinjiang, Tibet and Qinghai grew more quickly than the national rate. Nonetheless, with such a small population (30 million), the population growth in the Far West was barely one-half that of Beijing or Shanghai and little more than Tianjin.

    Provincial Losses, Urban Gains: Despite the uneven concentration of growth on the East Coast, the larger increase in (100 million) in migration from rural to urban areas led to a less uneven distribution of urban growth. The slow growth and even the population losses occurring in the interior mask huge growth in major urban areas of the same provincial level jurisdictions.

    Based upon 2009 estimates (provincial level urban data has not yet been released for 2010), the provincial level municipality of Chongqing gained 4.5 million urban residents (more than the population of Berlin), while the overall provincial level population loss was 2 million from 2000 to 2010. This illustrates one of the principal dynamic of population trends in China, as the countryside loses population to urban areas not only on the East Coast but also in the same general areas. The rural areas of Chongqing, which accounted for two-thirds of the population, lost more than 6 million residents, principally to the nearby Chongqing urban area as well as to other urban areas of the nation.

    In Sichuan, with its large and fast growing capital Chengdu, the urban population grew nearly 10 million, while  the provincial population was declining 3 million, indicating a rural loss of 13 million. Thus, while the East Coast accounted for 83 percent of the overall population growth, government estimates through 2009 indicate that only 47 percent of the urban population growth was on the East Coast (Figure 4). 

    Challenges: China faces no shortage of demographic challenges. An aging population will impose significant financial burdens on the generations to come, as is already happening in more affluent nations. The ratio of female to male births needs to be improved or social stability could be difficult to maintain in the decades ahead. The role of China’s one-child policy in these issues is now being debated and reviewed.

    The strong trend toward urbanization will continue for decades. The United Nations estimates that China will be nearly 75 percent urbanized in 2050 compared to the current 50 percent. The nation is expected to add 70 million residents, with an increase of 400 million in urban areas and a loss of 330 million in rural areas. Should these projections be reached, China’s rate of urbanization will be near the current levels in the affluent West. Even with more than one-half of urban growth now occurring outside the East Coast, there is a need to decentralize more of the growth to the emerging urban areas of the interior. This is something now widely recognized within Chinese planning and government circles.

    —–

    Photo: Wuhan (capital of Hubei) By author

    Note 1: There are various methods to categorize the regions of China. This classification is used to illustrate the differences in regional growth rates in the census periods since 1950. The provincial level municipality of Beijing is classified as East Coast because it is surrounded by provincial level jurisdictions (Hebei and Tianjin) which are coastal. Inner Mongolia, which stretches across the entire center of the nation is classified in the East Central because its population is more concentrated in that area. The regional population change between 1953 and 1964 includes an estimated allocation of population to provincial level jurisdictions into which abolished provinces (Rehe, or Jehol and Xikang) were merged during the period.

    Note 2: The Hong Kong and Macao Special Administrative Regions are also in the south, but are not included in the 2010 census data.

    Note 3: There are three types of provincial level jurisdictions in China, provinces, provincial level municipalities and autonomous regions.

    Wendell Cox is a Visiting Professor, Conservatoire National des Arts et Metiers, Paris and the author of “War on the Dream: How Anti-Sprawl Policy Threatens the Quality of Life

  • The Transportation Politics of Envy: The United States & Europe

    The Department for Transport of the United Kingdom may be surprised to learn that the average round-trip commute in the nation is up to a quarter hour less than reflected in its reports. This revelation comes from an article in The Economist, ("Life in the Slow Lane") citing a survey indicating that the average commuter in the United Kingdom spends less than 40 minutes daily traveling to and from work in 2000. According to Regional Transport Statistics, published by the Department for Transport, the average commuter spent 50 minutes traveling to and from work in 2000. The UK government further indicates that the average commute time had risen to 56 minutes by 2009. The Economist relies on the much lower figure (and other similarly low estimates from other European nations) in fashioning an article criticizing transportation policy in the United States.

    Shorter US Commute Times: The Economist begins with the contention that the average work trip travel time in the United States is substantially greater than that of the number of European nations. The most reliable data says otherwise.

    The most comprehensive work trip data in Europe is maintained by Eurostat, the statistical agency of the European Commission. The Eurostat data indicates that average commute times in Europe are somewhat more than in the United States in metropolitan areas of similar size (Figure 1), when compared to the comprehensive data from the US Census Bureau. For example, among metropolitan areas of more than 5 million population, the daily round-trip average commute is under 58 minutes in the United States, less than the 64 minutes in Europe. European commute times are longer in all population categories (Note).

    Overall, the average round-trip travel time in the US metropolitan areas over 500,000 population is 23.6 minutes and 25.3 minutes in the European metropolitan areas.

    Moreover, there are indications that the US trend is favorable, at least in comparison to the United Kingdom. Between 2000 and 2009, UK government data shows average round trip commute times to have increased six minutes, while US government data indicates a decline of nearly one minute (Figure 2).

    The US: Less Traffic Congestion:  The Economist then asserts that traffic congestion is worse in US metropolitan areas than in Europe. According to The Economist:

    …with few exceptions (London among them) American traffic congestion is worse than western Europe’s. Average delays in America’s largest cities exceed those in cities like Berlin and Copenhagen.

    The reality is the opposite, according to the INRIX Traffic Scorecard and a more correct rendering of the point above would have been:

    … with few exceptions (Los Angeles among them) western Europe’s traffic congestion is worse than America’s. Average delays in some of western Europe’s smallest cities exceed those in cities like Atlanta, Houston and Dallas-Fort Worth.

    INRIX compared 2010 peak period traffic delays in metropolitan areas of the United States and Europe. As with commuting time, the average travel delay per driver was greater in Europe than in the United States in every population classification. While Los Angeles has the worst congestion the approximately 200 metropolitan areas (one-half in the US and one-half in Europe), the next 13 worst were in Europe (Honolulu ranks 15th) and 18 of the worst 20 were in Europe (Figure 3). The third worst ranking US metropolitan area was San Francisco, at 28th, while Washington was 29th. Only seven of the 50 most congested metropolitan areas were in the United States. Of course, anyone who has driven extensively in the metropolitan areas of the US and western Europe knows that congestion is generally far worse in Europe, a fact confirmed by the INRIX data.

    Indeed, traffic congestion in the smallest European metropolitan areas (under 500,000) was worse than in the largest US metropolitan areas, those with over 5 million (There were no US metropolitan areas with less than 500,000 population in the INRIX data, see Figure 4). Those automobile-oriented, highly suburbanized banes of urban planning, Atlanta, Dallas-Fort Worth and Houston all ranked in the middle, between 90th and 110th. At least 75 European metropolitan areas had worse traffic congestion than all three.

    High-Speed Rail Envy: Finally, The Economist decries the lack of high-speed rail in the United States, noting that:

    The absence of true high-speed rail is a continuing embarrassment to the nation’s rail enthusiasts.

    It is hard to imagine a more pathetic standard for evaluating public policy than "satisfying rail enthusiasts."  It is well known that that governments from Washington to London, Athens and Lisbon are in serious financial difficulty. It is a time for limiting public expenditures to matters of genuine priority. That does not include high speed rail.

    The intercity road and airport systems are principally financed by users, in contrast to the operating subsidies and intense (100 percent) capital subsidies required by high-speed rail. This is evident in California with its now $65 billion first line that has more than doubled in real cost in a decade. It is also evident, closer to home for The Economist, where the controversial HS-2 high-speed rail proposal from London to Manchester and Leeds could easily double in cost (to £65 billion), based upon the best international research. Astoundingly, a doubling of cost would be a bargain for Britain’s taxpayers compared to two previous high-speed rail failures in the same corridor (See: The High Speed Rail Battle of Britain). The recurring environmental justifications ring hallow due to the high costs and the three generations or more it would require in California and the United Kingdom to eliminate the first gram of greenhouse gas.

    Transport policy could be improved in the United States, as well as in Europe. However, the starting point must be facts, not fancy, and certainly not envy.

    ——-

    Note: this analysis includes all data available for metropolitan areas in the United States (metropolitan statistical areas) and Europe (larger urban zones, the closest equivalent to US metropolitan areas). US data is complete, covering all 100 metropolitan areas with more than 500,000 population and is from the United States Census Bureau. European data is principally from Eurostat (94 larger urban zones and three from other sources). Paris data is from IAURIF (Institut d’aménagement et d’urbanisme de la région Île-de-France). Newcastle-upon-Tyne and Leeds data is from the UK Department for Transport.  Data is not available for a number of metropolitan areas with more than 500,000 population in Europe.

  • The Best Cities for Jobs 2011

    These may be far from the best of times, but they are no longer the worst. Last year’s annual “Best Cities for Jobs” list was by far the most dismal since we began compiling our rankings almost five years ago. Between 2009 and 2010, only 13 of 397 metropolitan areas experienced any growth at all. For this year’s list, which measured job growth in the period between January 2010 and January 2011, most of the best-performing areas experienced actual employment increases — even if they were modest.

    For Forbes’ list of the best cities for jobs, we ranked all 398 current metropolitan statistical areas, based on employment data from the Bureau of Labor Statistics reported from November 1999 to January 2011. Rankings are based on recent growth trends, mid-term growth and long-term growth and momentum. We also broke down rankings by size — small, medium and large — since regional economies differ markedly due to their scale.

    Reflecting the importance of the war effort in stimulating local economies, command of this year’s best place for jobs was handed to the Army from the Marines. Killeen-Temple-Fort Hood, Texas, shot up to No. 1 from No. 4, while Jacksonville, N.C., last year’s first-place winner and home to Camp Lejeune, dropped to 19th place.

    Read about how we selected the 2011 Best Cities for Job Growth

    Once again the best places for jobs tended to be smaller communities where incremental improvements can have a relatively large impact. Eighteen of the top 20 cities on our list were either small (under 150,000 nonfarm jobs) or mid-sized areas (less than 450,000 jobs).

    But no place displayed more vibrancy than Texas. The Lone Star State dominated the three size categories, with the No. 1 mid-sized city, El Paso (No. 3 overall, up 22 places from last year) and No.1 large metropolitan area Austin (No. 6 overall), joining Killeen-Temple-Fort Hood (the No. 1 small city) atop their respective lists.

    Texas also produced three other of the top 10 smallest regions, including energy-dominated No. 4 Midland, which gained 41 places overall, and No. 10 Odessa, whose economy jumped a remarkable 57 places. It also added two other mid-size cities to its belt: No. 2 Corpus Christi and No. 4 McAllen-Edinburgh-Mission.

    Whatever they are drinking in Texas, other states may want to imbibe. California–which boasted zero regions in the top 150–is a prime example. Indeed, a group of California officials, led by Lt. Gov. Gavin Newsom, recently trekked to the Lone Star State to learn possible lessons about what drives job creation. Gov. Jerry Brown and others in California’s hierarchy may not be ready to listen, despite the fact that the city Brown formerly ran, Oakland, ranked absolute last, No. 65, among the big metros in our survey, two places behind perennial also-ran No. 63 Detroit-Livonia-Dearborn, Mich.

    One lesson that green-centric California may have trouble learning is that, however attractive the long-term promise of alternative energy, fossil fuels pay the bills and create strong economies, at least for now. Even outside of Texas, oil capitals did well across the board, not surprising given the surging price of gas. Our No. 2 small metro, Bismarck, N.D., which also No. 2 overall, is the emerging capital of the expanding Dakota energy belt. Also faring well are Alaska’s two oil-fire cities, Fairbanks (No. 10 on our small list) and Anchorage (No. 3 on the medium-sized list).

    There were some intriguing surprises as well. Most welcome are signs of revival from New Orleans-Metarie, La., which moved up a stunning 46 places to capture the No. 2 slot among our large metros. The region lost 11% of its population and nearly 16% of its jobs during the last decade. But now the Big Easy seems to be finding its place again among America’s great cities. Jobs, up 3.5% since 2006, have been created by rebuilding, a resurgence of tourism and a growing immigrant population – the region’s Hispanic population grew by 35,000 over the past decade.

    There were other inspirational improvements this year. Sparked by a revival in manufacturing, a host of former sad sacks in parts of the Midwest are showing signs of definite improvement. Niles-Benton Harbor, Mich., a long-time denizen at the bottom of our list, shot up a remarkable 242 places this year to a respectable No. 121. Another old industrial city, Kokomo, Ind., ascended 177 places to No. 215, while Holland-Grand Haven, Mich. improved by 172 places to No. 221 and Grand Rapids, Mich., rose 167 places to No. 183. Milwaukee, a long-time loser among our largest metros, moved up by a healthy 163 places overall to a better-than-average No. 143.

    The Northeast Corridor has also made strong progress. Here the likely explanation can be found in the fruits of Obamanomics. The stimulus has been particularly good for the vibrant economies surrounding the ever-expanding federal leviathan. Among the large metros, Washington-Arlington-Alexandria, Va., did best of all the cities outside the South, repeating its No. 6 ranking among large metro areas. Right behind, at No. 7 on the large city list, sits the primarily suburban Northern Virginia metro area, while Bethesda-Rockville-Frederick, Md., ranks 12th.

    The other big East Coast winners are the financial and university-oriented economies, which have reaped huge benefits from the TARP bailout and the Obama Administration’s college-centric stimulus plan. After the Texas cities and the imperial center, most of the best performing big metros are located in financial and university centers, including No. 9 New York City, No. 10 Philadelphia, No. 11 Pittsburgh, No. 13 Boston and No. 15 Raleigh-Cary, N.C.

    So who’s losing? Outside of Oakland and the big Southern California metros — including No. 60 Los Angeles, No. 59 Sacramento, No. 58 Riverside-San Bernardino and No. 50 Santa Ana-Anaheim- Irvine — the bottom tier consisted of a motley crew of mid-South cities like Memphis (#64 on the big city list) and still-struggling, former big Sunbelt boomtowns Las Vegas (No. 62), West Palm Beach-Boynton Beach-Boca Raton, Fla. (No. 56), Ft. Lauderdale-Pompano Beach-Boynton Beach, Fla. (No. 54), Phoenix-Mesa-Glendale, Ariz. (No. 53), Atlanta-Sandy Springs-Marietta Ga. (No. 52) and Tampa-St. Petersburg-Clearwater, Fla. (No. 51).

    For the most part, these areas rose with the housing bubble and will not fully recover until the economy diversifies beyond real estate speculation. Already some of the bubble victims are showing signs of life, including No. 155 Merced, Calif., up 134 places, and No. 167 Orlando, Fla., which rode a revived interest in tourism to jump 89 places since last year.

    While energy, America’s three wars, the recovering financial markets and real estate problems have played the lead role in setting the stage for the best places to do business, the Intermountain West has shown resilience with Salt Lake City, at No. 20 among large cities; Provo-Orem, Utah, Ogden-Clearfield, Utah, and Boulder, Colo. at Nos. 10, 25 and 26, respectively, among mid-sized cities; and Logan, Utah, and Fort Collins, Colo. at Nos. 9 and 38 among small cities.

    As America struggles with a weak economic recovery, opportunities abound across the geography of the states—even in places where it seems bleakest like California, Nevada and Florida. If old industrial areas can stage the glimmers of a comeback, along with over-taxed and over-regulated Gotham, and greater New Orleans can rise from the near dead, these areas, with generally newer infrastructure and attractive climates, might be next to experience a resurgence of their own.

    Read about how we selected the 2011 Best Cities for Job Growth

    This piece originally appeared in Forbes.com

    Joel Kotkin is executive editor of NewGeography.com and is a distinguished presidential fellow in urban futures at Chapman University, and an adjunct fellow of the Legatum Institute in London. He is author of The City: A Global History. His newest book is The Next Hundred Million: America in 2050, released in February, 2010.

    Michael Shires, Ph.D. is a professor at Pepperdine University School of Public Policy.

    Photo by Bas Lammers