American greatness was long premised on the common assumption that each generation would do better than the previous one. That is being undermined for the emerging millennial generation.
Blog
-
The High Cost of a Home Is Turning American Millennials Into the New Serfs
The problems facing millennials include an economy where job growth has been largely in service and part-time employment, producing lower incomes; the Census bureau estimates they earn, even with a full-time job, $2,000 less in real dollars than the same age group made in 1980. More millennials, notes a recent White House report, face far longer periods of unemployment and suffer low rates of labor participation. More than 20 percent of people 18 to 34 live in poverty, up from 14 percent in 1980.
They are also saddled with ever more college debt, with around half of students borrowing for their education during the 2013-14 school year, up from around 30 percent in the mid-1990s. All this at a time when the returns on education seem to be dropping: A millennial with both a college degree and college debt, according to a recent analysis of Federal Reserve data, earns about the same as a boomer without a degree did at the same age.
Downward mobility, for now at least, is increasingly rife. Stanford economist Raj Chatty finds that someone born in 1940 had a 92 percent chance of earning more than their parents; a boomer born in 1950 had a 79 percent chance of earning more than their parents. Those born in 1980, in contrast, have just a 46 percent chance.
Since 2004, homeownership rates for people under 35 have dropped by 21 percent, easily outpacing the 15 percent fall among those 35 to 44; the boomers’ rate remained largely unchanged.
In some markets, high rents and weak millennial incomes make it all but impossible to raise a down payment (PDF). According to Zillow, for workers between 22 and 34, rent costs now claim upward of 45 percent of income in Los Angeles, San Francisco, New York, and Miami, compared to less than 30 percent of income in metropolitan areas like Dallas-Fort Worth and Houston. The costs of purchasing a house are even more lopsided: In Los Angeles and the Bay Area, a monthly mortgage takes, on average, close to 40 percent of income, compared to 15 percent nationally.
Like medieval serfs in pre-industrial Europe, America’s new generation, particularly in its alpha cities, seems increasingly destined to spend their lives paying off their overlords, and having little to show for it.
Rather than strike out on their own, many millennials are simply failing to launch, with record numbers hunkering down in their parents’ homes. Since 2000, the numbers of people aged 18 to 34 living at home has shot up by over 5 million.
One common meme, particularly in the mainstream media, has been that millennials don’t want to buy homes. The new generation, as Fast Company breathlessly reported, is part of “an evolution of consciousness.” Other suggest the young have embraced “the sharing economy,” so that owning a home is simply not to their taste. The well-named site Elite Daily asserts that the vast majority of millennials are headed to “frenetic metropolis” rather than becalmed suburbs.
And it’s not just ideologues claiming millennials have evolved out of home ownership. Wall Street speculators like Blackstone are betting that the young are committed to some new “rentership society,” with that firm investing $10 billion to scoop up existing small homes to rent, and even building tracks of homes exclusively for rent.
It’s not a lifestyle choice, but economics—high prices and low incomes—that are keeping millennials from buying homes. In survey after survey the clear majority of millennials—roughly 80 percent, including the vast majority of renters—express interest in acquiring a home of their own. Nor are they allergic, as many suggest, to the idea of raising a family, albeit often at a later age, long a major motivation for home ownership. Roughly 80 percent of millennials say they plan to get married, and most of them are planning to have children.
Overall, more than 80 percent of millennials already live in suburbs and exurbs, and they are, if anything, moving away from the dense, expensive cities. Since 2010 millennial population trends rank New York, Chicago, Washington, and Portland in the bottom half of major metropolitan areas while the young head out to less expensive, highly suburbanized areas such as Orlando, Austin, and San Antonio.
Age will accelerate this process. Economist Jed Kolko notes as people enter their thirties they tend to head out of core cities to suburban locations; roughly one in four people in their mid to late twenties lives in an urban location but by the time those people are in their early thirties, that number drops precipitously and continues dropping into their eighties. In fact, younger millennials, notes the website FiveThirtyEight, are moving to the ’burbs at at a faster clip than previous generations. What’s slowing that trend is economics. Many can’t afford to move or transition to a traditional adulthood.
The millennial housing crisis is reshaping the geography of opportunity. Although millennial rates of homeownership have dropped nationwide, the most precipitous declines have been in such metropolitan areas as New York, Miami, San Francisco, Portland, Seattle, and Los Angeles. In all these areas, public policy has regulatory barriers in the way of suburban and exurban affordability. It is in these markets where such things as “tiny houses” and “micro-apartments”—not exactly a boon to people looking to start families—are being touted as solutions to housing shortages.
Nowhere is this dynamic more evident than in California, where the state government has all but declared war on single-family homes by banning new peripheral development, driving up house prices throughout metropolitan areas. Regulatory fees typically add upward of $50,000, two-and-a-half times the national average; new demands for “zero emissions” homes promise to boost this by an additional $25,000.
Due largely to such regulatory restraints, overall California housing construction over the past 10 years has been less than half of that it averaged from 195 to 1989, forcing prices up, particularly on single-family houses. The state ranks second to the last in middle-income housing affordability, trailing only Hawaii. It also accounts for 14 of the nation’s 25 least affordable metropolitan areas.
Home ownership rates in California are among the nation’s lowest, with Los Angeles-Orange having the lowest rate of the nation’s 75 large metropolitan areas. For every two homebuyers who come to the state, five families leave, notes the research firm Core Logic.
The irony is that the state’s progressive policies are contributing to a less mobile society and a potential demographic crisis. For one thing, fewer young people can form families—Los Angeles-Orange had one of the biggest drops in the child population of any of the 53 largest metros from 2010 to 2015.
This also has a racial component, as homeownership rates African American and Latino households—which often lack access to family wealth—have dropped far more precipitously than those of non-Hispanic Whites or Asians. Hispanics, accounting for 42 percent of all California millennials, endure homeownership roughly half that seen in other parts of the country.
This is not the planners’ happy future of density dwelling, transit-riding millennials but a present of overcrowding, the nation’s highest level of poverty and, inevitably, a continued drop in fertility in comparison to less regulated, and less costly, states such as Utah, Texas, and Tennessee that have been among those with the biggest surges in millennial migration.
Once identified with youth, California’s urban areas are now experiencing a significant decline in both their millennial and Xer populations. By the 2030s, large swaths of the state—particularly along the coast—could become geriatric belts, with an affluent older boomer population served by a largely minority servant class. How feudal!
Ownership of land has always been a critical component of middle-class wealth and power. Those celebrating the retreat from homeownership among millennials are embracing the long-term decline of that middle class, two thirds of whose wealth is in their homes.
The potential decline in ownership also represents a direct assault on future American prosperity. Jason Furman, who served as chairman of President Obama’s Council of Economic Advisors, calculated that a single-family home contributes 2.5 times as much to the national GDP as an apartment unit. Investment in residential properties has dropped to its lowest share of overall spending since World War II; by some estimates reviving that would be enough to return America to 4 percent growth.
With so many millenials unable to afford homes, or even to see a path to future ownership, household formation has been far slower than in the recent past. Rather than a surge of middle-class buyers, we are seeing the rise of a largely property-less generation whose members will remain economically marginal into their thirties or forties. Indeed by 2030, according to a recent Deloitte study, millennials will account for barely 16 percent of the nation’s wealth while home-owning boomers, then entering their eighties and nineties, will still control a remarkable 45 percent of the nation’s wealth.
If this continues, we may have to all but abandon the notion of the United States as a middle-class nation. Instead of having a new generation that strikes out on their own, we may be incubating a culture that focuses on such things as the latest iPhone, binge watching on Netflix, something they do far more than even their Xer counterparts.
Progressives who embrace these developments are abandoning one of the central tenets of mainstream liberalism. In the past, many traditional liberals embraced the old American ideal of dispersed land ownership. “A nation of homeowners,” President Franklin D. Roosevelt believed, “of people who own a real share in their land, is unconquerable.” Homeownership is not only critical to the economy but provides a critical element of our already fraying civic society; homeowners not only tend to vote more than renters, but they also volunteer more and, as Habitat for Humanity suggests, provide a better environment for raising children.
On the flip side, high housing prices tend to suppress birthrates. Many of the places with the highest house costs—from Hong Kong to New York, Los Angeles, Boston, and San Francisco—also have very low birthrates. The four U.S. areas ranked among the bottom 10 in birthrates among the 53 major metropolitan areas in 2015. Over time these can have a dampening impact on economic growth, as is clearly seen today in places like Japan and much of Europe, and increasingly here in the U.S.
It’s time for millennials to demand politicians abandon the policies that have enriched the wealthy and stolen their future. That means removing barriers to lots of new housing in cities and, crucially, embracing Frank Lloyd Wright’s notion of Broadacre Cities, with expansive development along the periphery.
These new suburbs, like the Levittowns of the past, could improve people’s lives, while using new technology and home-based work to make them more environmentally sustainable. They could, as some suggest, develop the kind of urban amenities, notably town centers, that may be more important to millennials than earlier generations. One thing that hasn’t changed is the demand for affordable single-family homes and townhomes. But the supply is diminishing—those under $200,000 make up barely one out of five new homes.
There are some reasons for hope. The soon-to-develop tsunami of redundant retail space will open up millions of square feet for new homes. A move to prefabricated homes, already common in Europe and Japan, could help reduce costs. Certainly there’s potential demand at the right price—ones that young people can reasonably aspire to and then build lives in.
The alternative is to travel back to serfdom and a society sharply divided between a small owner class and many more permanent rent payers. By then, the American dream will be reduced to a nostalgic throwback in an increasingly feudalized country.
This piece first appeared in The Daily Beast.
Joel Kotkin is executive editor of NewGeography.com. He is the Roger Hobbs Distinguished Fellow in Urban Studies at Chapman University and executive director of the Houston-based Center for Opportunity Urbanism. His newest book, The Human City: Urbanism for the rest of us, was published in April by Agate. He is also author of The New Class Conflict, The City: A Global History, and The Next Hundred Million: America in 2050. He lives in Orange County, CA.
-
All Houston Does (Economically) is Win
Like most big cities that get the nod, Houston has spruced itself up for the Super Bowl, planting flowers and concentrating in particular on the rough stretches between Hobby Airport and NRG Stadium. Yet it’s unlikely the city’s reputation will be much enhanced by the traveling media circus that accompanies these games.
The last time the city hosted the Super Bowl, in 2004, the Washington Post called it “super ugly.” The website Thrillist recently named Houston “the worst designed city” in America, with the usual kind comments about porn shops near offices, lack of walking districts, fat people and awful traffic. For good measure, 24/7 Wall Street named it among the 25 worst cities in America.
Casting shade on Houston is nothing new. In his best-selling 1946 travelogue Inside U.S.A., the journalist John Gunther described Houston as having “a residential section mostly ugly and barren, without a single good restaurant and hotels with cockroaches.” The only reasons to live in Houston, he claimed, were economic ones; it was a city “where few people think about anything but money.”
Gunther clearly did not see a great future for the place, predicting that it would have only a million people by now. In fact, the Houston metropolitan area’s population now stands at 6.6 million with the city itself a shade under 2.3 million. At its current rate of growth, Houston could replace Chicago as the nation’s third-largest city by 2030.
Why would anyone move to Houston? Start with the economic record.
Since 2000, no major metro region in America except for archrival Dallas-Fort Worth has created more jobs and attracted more people. Houston’s job base has expanded 36.5%; in comparison, New York employment is up 16.6%, the Bay Area 11.8%, and Chicago a measly 5.1%. Since 2010 alone, a half million jobs have been added.
Some like Paul Krugman have dismissed Texas’ economic expansion, much of it concentrated in its largest cities, as primarily involving low-wage jobs, but employment in the Houston area’s professional and service sector, the largest source of high-wage jobs, has grown 48% since 2000, a rate almost twice that of the San Francisco region, two and half times that of New York or Chicago, and more than four times Los Angeles. In terms of STEM jobs the Bay Area has done slightly better, but Houston, with 22% job growth in STEM fields since 2001, has easily surpassed New York (2%), Los Angeles (flat) and Chicago (-3%).
More important still, Houston, like other Texas cities, has done well in creating middle-class jobs, those paying between 80% and 200% of the median wage. Since 2001 Houston has boosted its middle-class employment by 26% compared to a 6% expansion nationally, according to the forecasting firm EMSI. This easily surpasses the record for all the cities preferred by our media and financial hegemons, including Washington (11%) and San Francisco (6%), and it’s far ahead of Los Angeles (4%), New York (3%) and Chicago, which lost 3% of its middle-class employment.
Voting With Their Feet
Urbanistas may revile Houston but the metro area’s population has grown more than any other U.S. metropolis in the new millennium, up by 1.2 million between 2000 and 2010. The most recent figures show Houston’s population expanded 159,000 between 2014 and 2015, the most of any U.S. metro area.
Much of this is a result of people moving from elsewhere, roughly 500,000 net since 2000. In comparison, New York, Los Angeles, Chicago and even the Bay Area have suffered considerable migration losses.
It may be popular to suppose the new Texans are just a bunch of losers looking for cheap rent and low taxes. But the recent rate of increase in the population of educated 25- to 34-year-old educated people in Houston tops that of the San Jose area, and easily exceeds that of competitors like New York, Los Angeles and Boston. Houston has been getting not only bigger but also smarter.
Like domestic migrants, foreigners like the idea of jobs, particularly decent paying ones. Since 2000 Houston’s foreign-born population has grown 60%, roughly three times the expansion in New York, San Jose and San Francisco, and more than five times that of Los Angeles or Chicago. In the last decennial Census, Houston ranked second, just behind New York, in total numbers of new foreign-born residents.
So, what’s the appeal? Even the most civically minded Houstonians will admit it’s not the weather — particularly the humid, brutal summers — or the topography, which makes a plate seem mountainous. More critical is housing prices. Per demographer Wendell Cox, housing prices in Houston, adjusted for income, are roughly one-third those of coastal California and half those in places like metropolitan New York, Boston and Seattle.
Houston simply offers a more congenial setting for upward mobility than its more celebrated rivals. The National Association of Home Builders/Wells Fargo Bank Housing Affordability Index finds more than 60% of homes in the Houston metro area are affordable for median-income families, compared with only 15% in Los Angeles, once ground zero for the dream of aspirational homeownership. Overall, when incomes and costs are weighed, Houston ranks at or near the top of places where paychecks stretch the farthest.
Life After Oil
Some have predicted that with the fall in oil prices, Houston would experience a sharp decline, repeating the disastrous experience of the early 1980s. The energy sector has lost some 67,000 jobs but the economy has not collapsed. Patrick Jankowski, chief economist for the Greater Houston Partnership, notes that, unlike the early 1980s, overall employment has not declined. To be sure last year’s gains — some 15,000 net jobs — are meager compared to the remarkable 120,000 increase experienced in 2014. This year Jankowski predicts better, but hardly robust growth of nearly 30,000 jobs.
Though some sectors of the real estate market are clearly overbuilt, notably luxury housing and high end office space, construction remains buoyant, particularly in the lower end of the single family market. David Wolff, one of the area’s largest land developers and former head of the transit agency, Metro, lived through the 1980s crash and frankly expected a harder landing this time. “It’s like being in the middle of a gun battle, and picking yourself up from the floor and being amazed you don’t have a bullet hole,” Wolff says.
The change in administrations has also boosted confidence. “It is nice to have a president who doesn’t hate your major industry, “Wolff quips. He and others also point to the port, which is booming, the massive and expanding Texas Medical Center and anti-business practices in blue states, such as New York and California, as contributing to the region’s increasing economic diversity.
Andrew Segal, head of Boxer Properties, one of the city’s leading owners of Class B real estate, sees little decline in either rents or demand for his buildings. Energy may never regain the prominence it once had, he argues, but other sectors have emerged, and the city itself has greatly enhanced its urban amenities, parks, and educational offerings. “It’s getting more diversified like Dallas and cooler like Austin. The ’80s simply did not come back.”
The Secret Sauce
My Center for Opportunity Urbanism colleague Anne Snyder suggests Houston’s resiliency stems largely from its culture of openness. One of the most diverse metro areas in the country, Houston long has been accessible for newcomers of all kinds. In contrast to more hierarchical, the planning-oriented regimes elsewhere, she writes, “ creative friction – unchaperoned and prescribed – is Houston’s secret sauce.”
Low prices and vast landscapes, she notes, allow space for minorities to set up businesses, buy houses, open a dizzying array of shops and restaurants. Houston’s much-maligned strip malls, notes architect Tim Cisneros, are the “immigrant’s friend,” allowing for small businesses to start with lower rents and easy parking.
Not all Houstonians like the way the place works. Local intellectuals and some in the media have been pushing for the Bayou City to renounce its no-zoning policies and embrace the top-down “smart growth” approach that dominate places like California, Oregon and many areas of the Northeast.And to be certain, there are trade-offs. Although there are some promising walkable districts — both in the city and in some of the planned developments on the periphery — most Houstonians rely on their cars to get around, shop and eat at strip malls. And to be sure, entrenched poverty, inequality and inadequate schools remain all too common, but minorities, at least, are far more likely to own a house there than in more regulated places like New York, Los Angeles or Boston.
Houstonians also show their optimism by making the ultimate bet on the future: children. Per the American Community Survey’s Houston ranks in the top five cities for elementary-age school children per family among the 53 major metropolitan areas, well ahead of places like Chicago, Los Angeles, New York, and San Francisco, which placed 45th.
Jobs, housing, diversity, and the movement of families have driven Houston’s success. An upbeat attitude, and openness to outsiders, has made Houston a super city, Super Bowl or not.
Joel Kotkin is executive editor of NewGeography.com. He is the Roger Hobbs Distinguished Fellow in Urban Studies at Chapman University and executive director of the Houston-based Center for Opportunity Urbanism. His newest book, The Human City: Urbanism for the rest of us, was published in April by Agate. He is also author of The New Class Conflict, The City: A Global History, and The Next Hundred Million: America in 2050. He lives in Orange County, CA.
Photo: Hequals2henry [CC BY-SA 3.0], via Wikimedia Commons
-
Caterpillar’s HQ Move to Chicago Shows America’s Double Divide
Earlier today Caterpillar announced that it was moving its corporate headquarters from Peoria to Chicago. The move affects about 300 top-level executives. The company will retain a large presence in Peoria.
This is in line with what I’ve written about before: the rise of the executive headquarters, where a company moves its executive suite (anywhere from 50-500 people) to a major city like Chicago while leaving the back office elsewhere.
Chicago has benefitted from this more than any other city I know. In addition to many corporate HQ relocations from the suburbs, it lured ADM from downstate Decatur, ConAgra from Omaha, and even MillerCoors from Milwaukee.
These are all food/agriculture or industrial concerns. That’s right in line with Chicago’s industrial heritage.
I would assume there’s a real possibility every major agricultural or industrial company in the US interior that’s not already headquartered in a major city like Minneapolis may make a similar move to Chicago. I’m sure World Business Chicago already has its target list compiled and is making calls.
This exposes two major divides in the American economy.
The first is between cities positioned advantageously vs. disadvantageously. Chicago is the former (along with Boston, San Francisco, Dallas, etc). Peoria, along with most sub-million metro areas with an industrial heritage, is the latter. It’s simply difficult to keep higher end jobs in these cities. This robs of them of not just some high wage positions, but also significant talent firepower that could be invested in civic betterment.
The second is between those who are prospering with high skills, and those who are not. Chicago has a serious murder problem that’s been making global headlines for two years. It also has a huge financial problem on its hands, especially in the school district.
This doesn’t seem to be affecting business recruitment. CAT and others have not been scared off. This shows that, so far at least, Chicago and its successful segments can succeed even while the impoverished black and Latino areas of the city fail, and as many other industrial cities fall into decline.
In other words, this is another example of the decoupling of success in America. Those who are succeeding in America no longer need the overall prosperity of the country in order to personally do well. They can become enriched as a small, albeit sizable, minority.
Trump’s election was an intrusion into that success caused by those resentful from being left behind. The election of leftist mayors in the style of Bill de Blasio is another such reaction. It’s very clear from what I see and hear in global cities that those who are succeeding wish those who are not would hurry up and die or just go away. They pretty much say it explicitly when it come to the white working class, and you can believe they are thinking it when it comes poor blacks.
There are cumulatively a lot of angry people out there, who are not blind to what items like CAT’s relocation imply. This inequality is only a recipe for further political upheaval and unrest.
Aaron M. Renn is a senior fellow at the Manhattan Institute, a contributing editor of City Journal, and an economic development columnist for Governing magazine. He focuses on ways to help America’s cities thrive in an ever more complex, competitive, globalized, and diverse twenty-first century. During Renn’s 15-year career in management and technology consulting, he was a partner at Accenture and held several technology strategy roles and directed multimillion-dollar global technology implementations. He has contributed to The Guardian, Forbes.com, and numerous other publications. Renn holds a B.S. from Indiana University, where he coauthored an early social-networking platform in 1991.
Picture by Bidgee (Own work) [CC BY 3.0], via Wikimedia Commons
-
Death Spiral Demographics: The Countries Shrinking The Fastest
For most of recent history, the world has worried about the curse of overpopulation. But in many countries, the problem may soon be too few people, and of those, too many old ones. In 1995 only one country, Italy, had more people over 65 than under 15; today there are 30 and by 2020 that number will hit 35. Demographers estimate that global population growth will end this century.
Rapid aging is already reshaping the politics and economies of many of the most important high-income countries. The demands of older voters are shifting the political paradigm in many places, including the United States, at least temporarily to the right. More importantly, aging populations, with fewer young workers and families, threaten weaker economic growth, as both labor and consumption begin to decline.
We took a look at the 56 countries with populations over 20 million people, nine of which are already in demographic decline. The impact of population decline will worsen over time, particularly as the present generation now in their 50s and 60s retires, begins drawing pensions and other government support.
Europe: Homeland of Demographic Decline
Heading up our list of slowly dissipating large countries is the Ukraine, a country chewed at its edges by its aggressive Russian neighbor. According to U.N. projections, Ukraine’s population will fall 22% by 2050. Eastern and Southern Europe are home to several important downsizing countries including Poland (off 14% by 2050), the Russian Federation (-10.4%), Italy (-5.5%) and Spain (-2.8%). The population of the EU is expected to peak by 2050 and then gradually decline, suggesting a dim future for that body even if it holds together.
The most important EU country, Germany, has endured demographic decline for over a generation. Germany’s population is forecast to drop 7.7% by 2050, though this projection has not been adjusted to account for the recent immigration surge. The main problem is the very low fertility rate of the EU’s superpower, which according to United Nations data was 1.4 between 2010 and 2015. It takes a fertility rate of 2.1% to replace your own population so we can expect Germany to shrink as well as get very old.
Nor can Europe expect much help from its smaller countries. Although too small to reach our 20 million person threshold, many of Europe’s tinier “frontier” countries have abysmal fertility rates. Among the 10 smaller countries with the greatest population declines, all are in Europe, and outside Western Europe, with Bulgaria’s population expected to shrink 27% by 2050 and Romania’s 22%. Each of these have below replacement rate fertility. Things are not that much better in Western Europe, where fertility rates are also below replacement rates, but not quite so low. Long-term, the only option for Europe may be to allow more immigration, particularly from Africa and the Middle East, although this may be impossible due to growing political resistance to immigration.
Demographic Decline: The Asian Edition
If this were just a European disease, it would not prove such a challenge to the economic future. Europe is gradually diminishing in global importance. The big story in demographic trends is in Asia, which has driven global economic growth for the past generation. The decline of Japan’s population is perhaps best known; the great island nation, still the world’s third largest economy, is expected to see its population fall 15% by 2050, the second steepest decline after Ukraine, and get much older. By 2030, according to the United Nations, Japan will have more people over 80 than under 15.
But the biggest hit on the world economy from the new demographics will come from China, the planet’s second largest economy, and the most dynamic.
Until a generation ago, overpopulation threatened China’s future, as it still does some developing countries. Today the estimates of the country’s fertility rate run from 1.2 to 1.6, both well below the 2.1 replacement rate. By 2050 China’s population will shrink 2.5%, a loss of 28 million people. By then China’s population will have a demographic look similar to ultra-old Japan’s today — but without the affluence of its Asian neighbor.
Other Asian countries have similar problems. Thailand ranks as the fifth most demographically challenged, with a projected population loss of 8%. The population of Sri Lanka, just across Adam’s Bridge from still fast-growing India, is projected to increase only 0.6%.
Also going into a demographic stall is South Korea, another country which a generation ago worried about its expanding population. With its fertility rate well below replacement (1.3), the country will essentially stagnate over the next 35 years, and will becoming one of the most elderly nations on earth.
Full List: The Countries Shrinking The Fastest
Smaller Singapore is an anomaly. The city-state has a rock-bottom fertility rate of 1.2, but projects a population increase of 20% by 2050 due to its liberal and vigorously debated immigration policies.
Economic Consequences
Most world leaders are fixated on the unpredictable new administration in Washington in the short term, but they might do better to look at the more certain long-term impacts of diminishing populations on the world’s most important economies. Economists, including John Maynard Keynes, have connected low birth rates to economic declines. On the “devil” of overpopulation, Keynes wrote, “I only wish to warn you that the chaining up of the one devil may, if we are careless, only serve to loose another still fiercer and more intractable.”
It is already fairly clear that lower birthrates and increased percentages of aged people have begun to slow economic growth in much of the high-income world, and can be expected to do the same in long ascendant countries such as China and South Korea. Economists estimate that China’s elderly population will increase 60% by 2020, even as the working-age population decreases by nearly 35%. This demographic decline, stems from the one-child policy as well as the higher costs and smaller homes that accompany urbanization, notes the American Enterprise Institute’s Nicholas Eberstadt. China’s annual projected GDP growth rate will likely decline from an official 7.2% in 2013 to a maximum of 6% by 2020.
There are several reasons these demographic shifts portend economic decline. First, a lack of young labor tends to drive up wages, sparking the movement of jobs to other places. This first happened in northern Europe and Japan will increasingly occur now in Korea, Taiwan, and even China. It also lowers the rate of innovation, notes economist Gary Becker, since change tends to come from younger workers and entrepreneurs. Japan’s long economic slowdown reflects, in part, the fact that its labor force has been declining since the 1990s and will be fully a third smaller by 2035.
The second problem has to do with the percentage of retirees compared to active working people. In the past growing societies had many more people in the workforce than retirees. But now in societies such as Japan and Germany that ratio has declined. In 1990, there were 4.7 working age Germans per over 65 person. By 2050, this number is projected to decline to 1.7. In Japan the ratios are worse, dropping more than one-half, from 5.8 in 1990 to 2.3 today and 1.4 in 2050. China, Korea and other East Asian countries, many without well-developed retirement systems, face similar challenges.
Finally, there is the issue of consumer markets. Aging populations tend to buy less than younger ones, particularly families. One reason countries like Japan and Germany can’t reignite economic growth is their slowing consumption of goods. This challenge will become all the more greater as China, the emerging economic superpower, also slows its consumption. The future of demand, critical to developing countries, could be deeply constrained.
What about the USA?
To a remarkable extent, the United States has avoided these pressing demographic issues. The U.N. has the U.S. tied with Canada for the fastest projected population growth rate of any developed country: a 21% expansion by 2050. Yet this forecast could prove inaccurate.
One threat stems from millennials who, even with an improved economy, have not started families and had children at anything close to historical rates. Today the U.S. fertility rate has dropped to 1.9 from 2.0 before the Great Recession; population growth is now lower than at any time since the Depression. This places us below replacement level for the next generation. Projections for the next decade show a stagnant, and then falling number of high school graduates, something that should concern both employers and colleges. The United States’ high projected population growth rate, like that of Singapore, is entirely dependent upon maintaining high rates of immigration.
But even before the election of Donald Trump, who is hell-bent on cracking down on at least undocumented immigration, total immigration to the United States has been slowing. At the same time the fertility rates of some immigrant groups, notably Latinos, have been dropping rapidly and approaching those of other Americans. This is despite the fact that as many as 40% of women would like to have more children; they simply lack the adequate housing, economic wherewithal and spousal support to make it happen.
In the coming decades, the countries that can maintain an at least somewhat reasonable population growth rate, and enough younger people, will likely do best. To a large extent, it’s too late for that in much of Europe and East Asia. For countries like the United States, Canada and Australia, with among the most liberal immigration policies and large landmasses, the prospects may be far better. However, we also need native-born youngsters to launch, get married and start creating the next generation of Americans.
This piece originally appeared at Forbes.
Joel Kotkin is executive editor of NewGeography.com. He is the Roger Hobbs Distinguished Fellow in Urban Studies at Chapman University and executive director of the Houston-based Center for Opportunity Urbanism. His newest book, The Human City: Urbanism for the rest of us, was published in April by Agate. He is also author of The New Class Conflict, The City: A Global History, and The Next Hundred Million: America in 2050. He lives in Orange County, CA.
Photo: Ahmet Demirel [Public domain], via Wikimedia Commons
-
The Real State of America’s Inner Cities
The New York Times ran a piece in today’s paper about the state of America’s inner cities – and of course Donald Trump. Their conclusion is that the landscape of America’s cities, and of American blacks – the “inner city” is clearly a racially loaded term – is complex.
I agree with that. I’ve classified America’s cities into three major buckets: elite/vertical success cities like New York, workday/horizontal success cities like Dallas-Ft. Worth, and struggling cities like Youngstown or Flint.
There’s no one size fits all model of cities. Some cities like New York indeed have become amazingly successful. But it’s also true that many post-industrial cities remain in terrible shape.
Even within the successful cities, there are immense divisions. Chicago is booming in its downtown and North Side. But the South and West Sides are seriously struggling.
Black America also has a complex landscape. Highly educated blacks are doing very well. It’s an under-reported story that upscale suburbs like Carmel, Indiana and Overland Park, Kansas are seeing strong black population growth and population share growth, although the totals in both cases remain modest. Cities like Houston, Atlanta, and Charlotte are becoming magnets of black middle class. The black population is also strongly suburbanizing, part of the general trend of the diversification of the suburbs. The South retains a significant rural black population.
But undoubtedly black poverty remains a big issue, both in cities and in suburbs. Black America as a whole remains far behind white America in economic success. Last I checked, black median household income was around $35,000, compared with $57,000 for whites. The wealth gap was even more stark, with the black household median at only $7,000 compared with $111,000 for whites.
So the idea that America’s cities are uniformly decayed or that black America is uniformly failing isn’t accurate, but it certainly is true that significant portions are dealing with bigtime problems.
Where did Trump get his ideas about America’s cities? The media have seemed to suggest he’s simply holding on to outdated 1970s stereotypes. But that seems unlikely. He lives in Manhattan and started building there in the 70s. He knows the difference.
It’s pretty obvious where Trump got the idea that inner cities and black America are in bad shape. He got it from urban progressives themselves.
In the last two years the urbanist discourse has been increasingly dominated by racial issues: Black Lives Matter, housing discrimination and segregation, income inequality, and a general arguing that American society is saturated with racism that is the cause of many and pervasive ills in the black community.
It’s only now, after Trump said basically, “I agree”, that all of a sudden people start talking about this complex, nuanced landscape. Urban progressives need to take an accounting of how they have been talking about things too.
The idea that Trump is intending to denigrate the inner city is obviously false. He uses the same type of rhetoric about “disasters” and such when talking about white working class industrial and mining towns. His whole point is that the people in these places are victims of a venal and incompetent elite. He surely means the same thing in describing inner cities.
The difference is that he found a rhetoric that resonated with working class whites. That same rhetoric is not resonating with working class blacks. What poor whites interpreted as a validation of their worth, many blacks have interpreted as a denigration of their accomplishments in the face of adversity. Trump will never win the leadership class in cities. But if he’s serious about wanting to help these communities, clearly on his to do list is finding new rhetoric that speaks to the rank and file urban black community in a way that resonates.
As for the word “carnage,” I don’t know how else to describe what’s happening in Chicago. The global media have been full of front page type stories over the last two years about the horrific violence there, and justifiably so. I agree completely with critics that Chicago’s police department is in dire need of reform. The lack of internal reforms there may explain a lot of the difference in the crime trajectory of Chicago vs. NYC and LA. But the attempts to explain away what’s going on in Chicago – nowhere near historic highs! St. Louis has a higher murder rate! – is unbecoming. It is a legitimate disaster.
There also does remain an immense amount of work to do on integrating blacks into mainstream American success. One mind-boggling factoid that I saw recently came from Mitch Daniels’ open letter to the Purdue University community. It says that only about 100 black high school grads a year in the entire state of Indiana have GPAs and test scores at the average level of Purdue freshmen. Last year Purdue only admitted 26 total students of all races from Indianapolis Public Schools.
Mitch is making it his business to do something about it. Purdue is planning to open its own high school in Indianapolis to try to better prepare black students for college.
America as a whole needs to do the same. Regardless of who or what is to blame, black Americans, and others left behind in our highly unequal cities, are our fellow citizens whom we should care about as neighbors. Integrating them fully into mainstream success is an imperative.
Trump isn’t wrong that there are big problems that need to be faced. The challenge I’d put to him is to engage seriously on the many complex structural challenges involved. Some problems – rebuilding water and sewer infrastructure, which is a dire need – really are “simple” problems of engineering and money. Many others like policing are not.
In the near term, he needs to put his branding, A/B testing, etc. skills to work, and rebuild the way he talks about cities and the black community. That will be one test of how serious he is about rebuilding America’s inner cities.
Aaron M. Renn is a senior fellow at the Manhattan Institute, a contributing editor of City Journal, and an economic development columnist for Governing magazine. He focuses on ways to help America’s cities thrive in an ever more complex, competitive, globalized, and diverse twenty-first century. During Renn’s 15-year career in management and technology consulting, he was a partner at Accenture and held several technology strategy roles and directed multimillion-dollar global technology implementations. He has contributed to The Guardian, Forbes.com, and numerous other publications. Renn holds a B.S. from Indiana University, where he coauthored an early social-networking platform in 1991.
Photo: Flint River in Flint Michigan
-
In the Automation Debate, Don’t Forget the Job Multiplier Effect
In his 1950s satire Player Piano, author Kurt Vonnegut describes a dark dystopia where automation has led to a world of meager consumption and desperate idleness. The vision of workers displaced by machines predates this though, and is perhaps most associated with the 19th century Luddite movement where workers sabotaged machinery for fear of losing jobs. In economic thought, the prospect of labor-replacing technology has a still much longer history.
The opinion of most economists has been that “Luddite fears” are misplaced. New technology is economically synonymous with increased efficiency, new and cheaper products, expanded national income and demand for goods, and ultimately an expanded demand for labor and higher wages. With recent technology, however, most notably robots and artificial intelligence, a growing number of economists are sounding alarm.
Will the future be one where capital in the form of robots and other machines make remunerative work increasingly obsolete? Will it be one where smart policy aims at the maintenance and fostering of labor-intensive processes, while shunning automation and capital intensity? These two questions increasingly dominate the economic debate. In this brief exploratory paper we highlight an important element in that debate.
Don’t Forget Multiplier Effects
The jobs supported by a given industry extend beyond those specifically employed in that industry. A more or less wide variety of produced inputs are needed, and jobs are created as well in the industries supplying these inputs. And the suppliers themselves need inputs, as do their suppliers, and so on, creating an often long and complex chain of input supply and job creation. Importantly, some industries have deeper supply chains than others, and a deep supply chain means higher off-site job effects.
Turning to economic models, the off-site job effects of a given industry are captured by the employment multiplier of an input-output model. Employment multipliers measure total jobs divided by on-site jobs—a multiplier of 3 means for every job on-site two more are created off-site through supply chain multiplier effects. Now it may be that industry A offers fewer jobs on-site than industry B yet offers more jobs in total when multiplier effects are included. In framing a jobs policy, failure to include multiplier effects could lead to the erroneous choice of B over A.
Off-site job creation extends beyond the chain of industrial inputs. An industry with a given number of workers and high wages will create more jobs through the effects of personal consumption spending than one paying low wages. Likewise an industry with much capital (buildings, machines, etc.) creates more property income than one with little capital, and this means greater personal consumption spending. More importantly, though, in the case of high-capital industries, considerable annual expenditures will be required to maintain, repair, and periodically replace the capital stock, and this creates jobs in the broad collection of industries that provide these essential capital goods and services.
Multipliers and Automation
So we ask the question: Do industries characterized by automation have greater off-site employment effects, i.e., multiplier effects, than other industries? If we had some definitive index of automation by industry we could simply compare industry I-O employment multipliers to this index and determine the answer. Unfortunately, to our knowledge, no such index exists. Is there a suitable surrogate?
To begin with note that any tool or machine, even simple and inexpensive ones, contribute to the abridgement of labor and thus to some degree of automation. At the same time, a thoroughly automated factory, with its robots and advanced technology, is a very expensive factory, and thus a factory with a high ratio of capital stock to labor. So as a tentative exploration of the relation between automation and employment multipliers, let us compare industry capital-labor ratios and multipliers (see italicized footnote for how we estimate the value of an industry’s stock of capital).
The multiplier effect we wish to examine includes particularly the action of personal income and induced investment spending. These are derived from our input-output model “closed” with respect to household spending and investment. Such models are strictly intended to portray the economic base of regional economies. When constructed at the national level, they tend to overstate multipliers, the result of assuming, in effect, that all economic activity is explained by national exports. However, absolute size notwithstanding, industry-by-industry comparisons provide an entirely reliable indication of relative multiplier magnitudes.
Drawing an overall comparison of multipliers and capital-labor ratios, across all of the approximately 1,000 North American Industrial Classification System (NAICS) industries, provides a less than perfect yet solidly positive correlation. Figure 1 shows indicative findings.
Leading the collection is petroleum refineries (NAICS 324110), with nearly $21 million in plant and machinery per employee and an employment multiplier of nearly 100. Think of the great investment in building a refinery, all the moving parts, the ongoing investment needed to maintain it, all the many inputs per worker and an employment multiplier near 100 is perhaps not surprising, especially as it is derived from a national-level model. Other industries with large capital investments (per worker) and employment multipliers include light truck and utility vehicle manufacturing (336112), petrochemical manufacturing (325110), and tobacco manufacturing (312230).
At the other extreme, low multiplier-low capital investment, we find fine arts schools (611610). With a modest building, capital, and equipment investment of less than $9,000 per employee, art schools appear with an employment multiplier of barely 1.5. Other sectors at the low end, mainly service sectors, include child day care services (624410), mobile food services (722330), and nail salons (812113). It is easy to see how modest wages and minimal capital investment results in shallow multiplier effects.
Implications for Policy
While more research on the particulars of consumer spending and investment effects is warranted, and a more explicit measure of automation than simply the ratio of capital-to-labor would be helpful, our findings are nonetheless indicative of a need to consider multiplier effects in framing policy. As automation proceeds, employment multipliers will, of mathematical necessity, increase: A theoretical factory, fully automated, with no jobs at all, would have an employment multiplier approaching infinity. So in judging which industries fit better with a jobs and industry policy, consider where the inputs come from, including especially the investment goods and services needed to maintain plant and equipment. A factory full of domestically made and serviced robots may employ more workers than it appears.
* Measuring the value of an industry’s capital stock:
Among the annual data included in Emsi’s I-O model are figures on the flow of property income by industry. Property income is the return on invested capital. Assuming a uniform rate of return across all industries (we assume 4%, a rough but for our purposes acceptable assumption), the total value of capital in a given industry is computed as the industry’s flow of property income divided by the assumed uniform rate of return. Finally, dividing the value of an industry’s capital stock by the number of its employees provides that industry’s capital-labor ratio: the economist’s standard measure of industry capital-intensity.
Dr. Robison is EMSI’s co-founder and senior economist with 30 years of international and domestic experience. He is recognized for theoretical work blending regional input-output and spatial trade theory and for development of community-level input-output modeling. Dr. Robison specializes in economic impact analysis, regional data development, and custom crafted community and broader area input-output models. Contact Josh Wright with questions about this analysis.
Photo credit: Flickr/Steve Jurvetson
-
The Immigration Dilemma
In often needlessly harsh ways, President Donald Trump is forcing Americans to face issues that have been festering for decades, but effectively swept under the rug by the ruling party duopoly. Nowhere is this more evident than with immigration, an issue that helped to spark Trump’s quixotic, but ultimately successful, campaign.
Many Americans are clearly upset about an estimated 11 million undocumented immigrants, and many also fear the arrival of more refugees from Islamic countries. Perhaps no issue identified by Trump has been more divisive.
Not surprisingly, Trump’s rhetoric has stirred bitter anger among the country’s polite establishment, right and left, as well as the progressive grievance industry. His call for a massive border wall has not only offended our neighbor, Mexico, but also created legitimate concern in Latino communities of massive raids. According to a 2012 study for the National Institutes for Health, the undocumented account for roughly one in five Mexicans and up to half of those from Central American countries.
The weakness of the open borders position
Anti-immigrant sentiment has a long, if somewhat nasty, history in America. It usually follows periods of great immigration, and ethnic change, as occurred in the mid-19th century and early 20th century, when immigration policies were dramatically tightened.
Today, economics dictates some change of direction. In a country where wages for the poorest have been dropping for decades, the notion of allowing large numbers of similarly situated people into the country seems to be more a burden than a balm. In California, among noncitizens, three in five are barely able to make ends meet, according to a recent United Way study.
In California, Gov. Jerry Brown has famously laid out a “Welcome” sign to both Mexican illegal and legal immigrants coming to the state. Many progressives consider concerns with nationality and cultural integration as vile attempts to have them “Anglo-Saxonized.” The open borders ideology has reached its apotheosis in “sanctuary” cities which extend legal protection from deportation even to criminal aliens who have committed felonies.
Trump’s over-the-top response
Politically, the open borders rhetoric helps Trump. Even in California, three-quarters of the population, according to a recent UC Berkeley survey, oppose sanctuary cities. Overall, more Americans favor less immigration than more. Most, according to a recent Pew Research Center study, also want tougher border controls and increased deportations. They also want newcomers to come legally and adopt the prevailing cultural norms, including English.
But in his rants on immigration, Trump may be going too far. Only a minority favor Trump’s famous wall, and the vast majority, including Republicans, oppose massive deportations of undocumented individuals with no criminal record. Limiting Muslim immigration does better, but appeals to only roughly half of Americans.
Trump’s restrictionist choice for attorney general, Sen. Jeff Sessions, is also on record opposing more legal immigration. This could prove ruinous to the country’s long-term future. Like most high-income countries, the United States’ fertility rate is below that needed to replace the current generation. If the U.S. cuts off its flow of immigrants too dramatically, we will soon face the labor shortages, collapse of consumer demand and drops in innovation already seen in the European Union and much of East Asia.
An overly broad cutback in immigration would also deprive the country of the labor of millions of hard-working people, many of whom do difficult jobs few native-born Americans would do. The foreign-born, notes the Kaufmann Foundation, are also twice as likely to start a business as the native-born.
Read the entire piece at The Orange County Register.
Joel Kotkin is executive editor of NewGeography.com. He is the Roger Hobbs Distinguished Fellow in Urban Studies at Chapman University and executive director of the Houston-based Center for Opportunity Urbanism. His newest book, The Human City: Urbanism for the rest of us, was published in April by Agate. He is also author of The New Class Conflict, The City: A Global History, and The Next Hundred Million: America in 2050. He lives in Orange County, CA.
Photo: JamesReyes [Public domain], via Wikimedia Commons
-
King Tide
10,000 years ago San Francisco Bay was a dry grassy valley populated by elephants, zebras, and camels. The planet was significantly cooler and dryer back then. Sea level was lower since glaciers in the north pulled water out of the oceans. The bay isn’t that deep so a relatively small change in sea level pushed the coastline out by twelve miles from its present location. Further back in pre-history when the earth was warmer than today sea level was higher. The hills of San Francisco were small islands off the coast of ancient California.


These cycles play out on a scale we humans can’t perceive in our daily lives. You can think of this process as a larger version of the tides that play out over thousands of years instead of twice a day. There’s absolutely no need to debate human induced climate change. The climate changes all the time with or without us. The real question is how we will adapt over time.
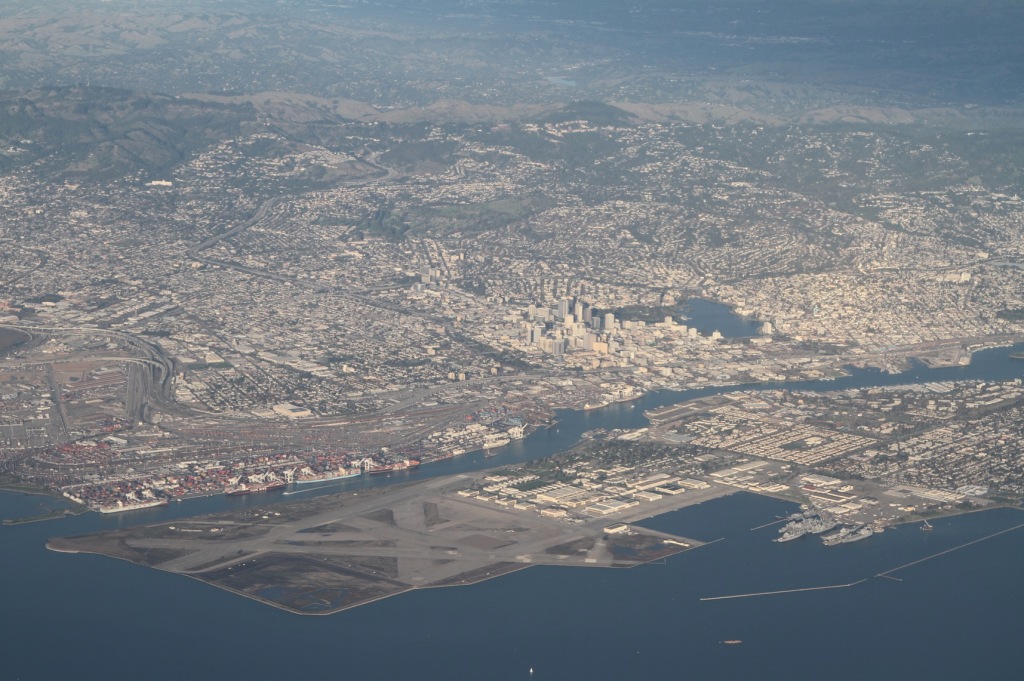


In the last century the majority of what was once low lying wetlands around the bay were filled and built upon. Airports, shipping terminals, oil refineries, housing developments, and industrial parks are sitting on landfill just slightly above water.


We just experienced a king tide. This is a naturally occurring cyclical event that happens whenever the earth, moon, and sun line up in a particular way to create a tide that’s about seven feet higher than usual. In this part of the world king tides tend to arrive a few times a year alongside heavy winter rains. The result is a submerged landscape that at a normal high tide in summer is actually dry land.


A significant amount of territory would be underwater in a king tide if it weren’t for extensive levees, drainage ditches, canals, and pumping stations that actively manage the hydrology of the built environment.


So far the engineered solutions are working to plan. But this stuff is expensive to build and maintain. If we skimp or take our eyes off the ball there’s a risk of a breach that would do serious damage to the affected areas. This is California’s version of New Orleans with the added feature of seismic activity to complicate matters.


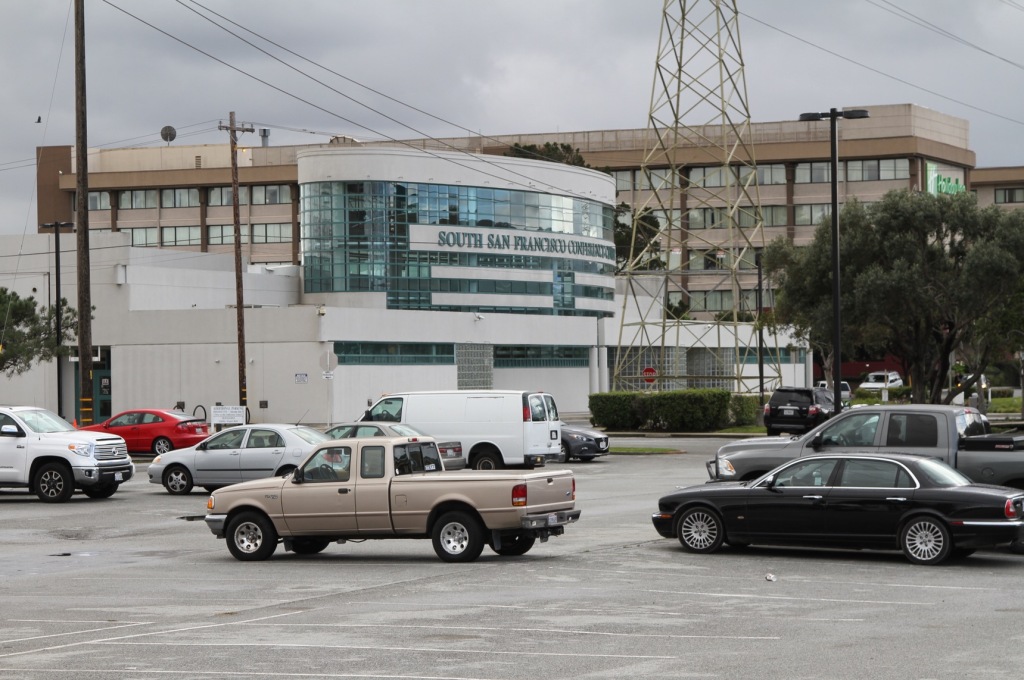
Last summer I was exploring the semi industrial neighborhoods around the airport just south of the city and found myself having a conversation with a hotel manager.


Even during ordinary high tides the water level of the canal is about the same as the parking lot. So whenever it rains the drainage system that normally pulls water away from the land works in reverse and canal water is pushed up onto the surface.


What’s the difference between a hotel room that remains completely dry vs. a hotel room that has just one inch of standing water on the floor? That’s the difference between $100 a night and $0 per night.


The management has long responded to the situation by not renting ground floor rooms during the rainy season. That constitutes a seasonal operating loss since any hotel that falls below a 60% occupancy rate loses money. But there isn’t much that can be done. The rooms on the lower level are being renovated so that once the weather clears up the hard surfaces can be thoroughly cleaned and aired out and put back on the market without incident.


Warehouses and industrial sheds in the area have a similar set of challenges. Who exactly wants to store or manufacture things in a facility that gets wet whenever it rains at high tide?


I was curious why such valuable waterfront land wasn’t redeveloped with new construction that was built with rising tides and earthquakes in mind. Wasn’t the canal a natural feature that could be capitalized upon as a major amenity? Wouldn’t people pay extra to stay at a fancy hotel or live along a landscaped promenade with cafes and shops? It could be really nice, and the real estate market would certainly be able to absorb the required price point. I was told the hotel owner had asked for permission to redevelop the site as a retirement village. Local regulators denied the applications. The city insists that the property remain as it is.
Over the years I’ve had more than one mayor or city official in different parts of the country explain that each new resident costs the city money in services and infrastructure. What cities desperately need is tax revenue. That’s why we see a proliferation of casinos, premium outlet malls, entertainment complexes, and technology parks. A half assed soggy hotel is better for the city’s bottom line than anything that will burden the municipality with needy residents.


In the short term there are all manner of temporary quick fixes that can keep this system going. But over the long haul there are only two possible trajectories for these places. One is for huge sums of public money to be spent defending private property. The other is that the structures that currently occupy vulnerable positions will lose value, be abandoned, and gradually slip under the tide. Downtown San Francisco is likely to find the funds to keep back the waves. Will taxpayers really be willing to fortify the old Taco Bell and aging suburban big box store? Toss in an earthquake or two and things could get really interesting very fast. Happenstance is the polite politically neutral term for this kind of triage.
John Sanphillippo lives in San Francisco and blogs about urbanism, adaptation, and resilience at granolashotgun.com. He’s a member of the Congress for New Urbanism, films videos for faircompanies.com, and is a regular contributor to Strongtowns.org. He earns his living by buying, renovating, and renting undervalued properties in places that have good long term prospects. He is a graduate of Rutgers University.
All photos by Johnny Sanphillippo
-
Access in the City
Access for residents to employment is critical to boosting city productivity. This has been demonstrated by researchers such as Remy Prud’homme and Chang-Woon Lee of the University of Paris, David Hartgen and M. Gregory Fields of the University of North Carolina, Charlotte. Generally, city productivity (economic growth and job creation) can be expected to improve more where employment access is better . Access is measured in the number of jobs that can be reached by the average employee in a certain period of time, like 30 minutes.
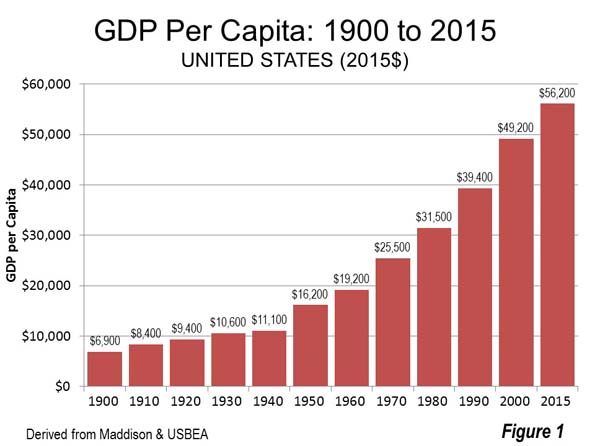
Generally, US cities have seen strong productivity gains as they have become more accessible. In 1900, before the broad adoption of the automobile, US gross domestic product (GDP) per capita was $6,900 (2015 dollars). By 1930, when there were 90 percent as many motor vehicles as households in the nation, GDP per capita rose to $10,600. Now, even factoring in the economic reverses of the last decade, GDP per capita is more than five times that amount (Figure 1).
Further, American metropolitan areas tend to have shorter work trip travel times and less traffic congestion than their counterparts elsewhere. Much of this is due to their more decentralized employment bases than elsewhere in the world, where decentralization has increased at a slower rate.
Public officials and planners now have been given an important new tool for assessing access and improving metropolitan transportation. Researchers at the University of Minnesota Accessibility Laboratory have been studying accessibility in US employment markets (metropolitan areas) in the most detailed terms yet. The first report, in 2013, was authored by Professor David Levinson (on autos) and since that time Andrew Owen and Brendan Murphy have collaborated with Levinson in reports on autos, transit and walking. These modal reports measures access by the number of jobs that can be reached in a metropolitan area by the average employee in 10 minute intervals (from 10 to 60 minutes).
This article summarizes access in the 30 and 60 minute travel times in 49 metropolitan areas (Note 1). The 30 minute trip is used because it is close to the average one-way work trip travel time in the United States (26.4 minutes in 2015). The 60 minute trip is used is the longest commute considered. This “one hour economic circle” has also been adopted in Chinese cities, such as Chongqing for urban area planning, as recommended by former World Bank principal planner Alain Bertaud.
Access by Automobile
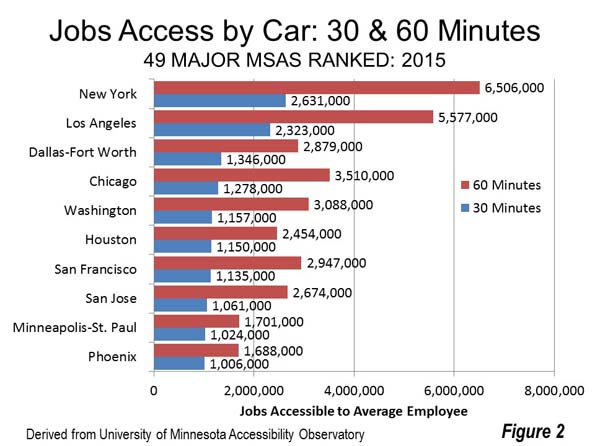
As one would expect, more jobs can be accessed in the larger metropolitan areas. New York leads, with 2.6 million jobs accessible to the average employee within 30 minutes by auto. New York is closely followed by Los Angeles, only 12 percent lower at 2.3 million. With a population 35 percent below that of New York, and with the worst traffic congestion in the United States, this is a surprising result. The greater dispersion of jobs in Los Angeles certainly helps. In third position, Dallas-Fort Worth surprisingly edges out much larger Chicago, in fourth position. This undoubtedly is the result of DFW’s superior freeway system, which along with its arterial system has resulted in the best traffic congestion in the world for any metropolitan area over 5 million population. Washington (Note 2) and Houston rank fifth and sixth.
Employment access by autos in 60 minutes is the highest in New York, and Los Angeles, with Chicago third (ahead of Dallas-Fort Worth), probably due to its larger overall labor market (42 percent more jobs than Dallas-Fort Worth). Washington, San Francisco and Dallas-Fort Worth have around 3,000,000 auto accessible jobs (Figure 2).
Access by Transit
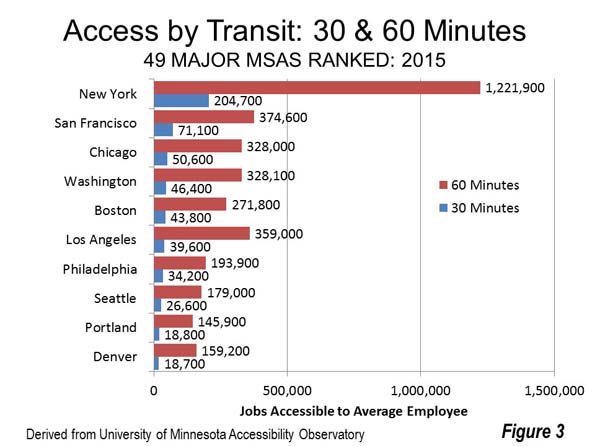
Transit access is dominated by New York’s 200,000 jobs within 30 minutes access by transit. This is nearly three times that of second place San Francisco. The top five include three of the other metropolitan areas with the largest central business district (CBD or downtown) areas, Chicago, Washington and Boston, while Philadelphia, with the sixth largest CBD ranks seventh. Los Angeles ranks sixth. Seattle, Portland and Denver round out the top ten, well above their 15th, 24th and 21st population ranks. These high rankings may be a measure of their transit system quality, though access by transit is a mere fraction of their auto access.
New York leads in 60 minute transit access, at more than 1.2 million, followed by Los Angeles, San Francisco, Washington and Chicago (Figure 3).
Access by Walking
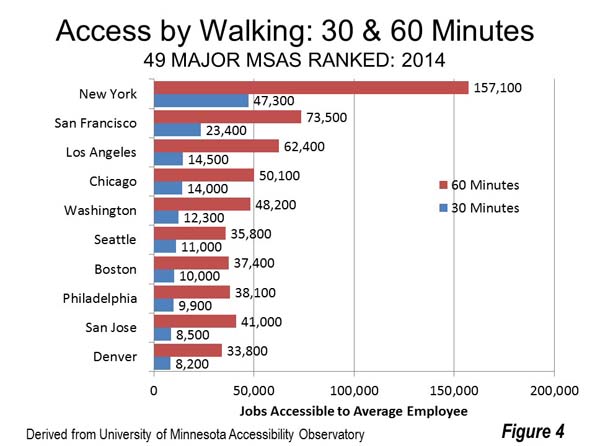
New York also leads in 30 minute walk access, more than doubling that of second place San Francisco, at 47,300, followed by Los Angeles, Chicago and Washington. New York also leads in 60 minute walking access, at 157,100, followed, again, by San Francisco, Los Angeles, Chicago and Washington (Figure 4).
Modal Comparisons
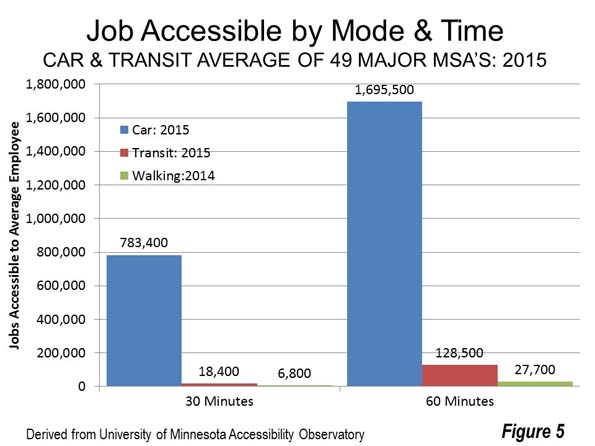
The job accessibility differences between autos and transit are significant. On average among the 49 metropolitan areas, 30 minute access by car is 783,000 jobs, compared to only 18,000 for transit and 7,000 by walking. At 60 minutes, autos reach nearly 1.7 million jobs, compared to fewer than 130,000 for transit and 28,000 by walking. Thus, at 30 minutes, the accessible auto market is 43 times that of transit and 115 times that of walking (Figure 5).
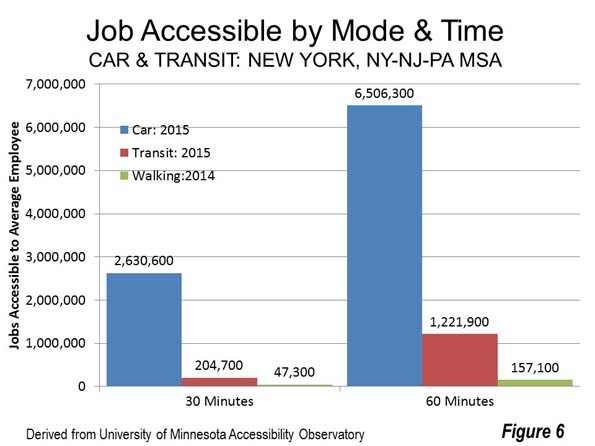
The ultimate transit city in the United States is New York. There, the average employee can reach 2.6 million jobs by auto in 30 minutes, compared to 205,000 for transit and 157,000 by walking. Auto access in 30 minutes is 13 times that of transit and 56 times that of walking (Figure 6).
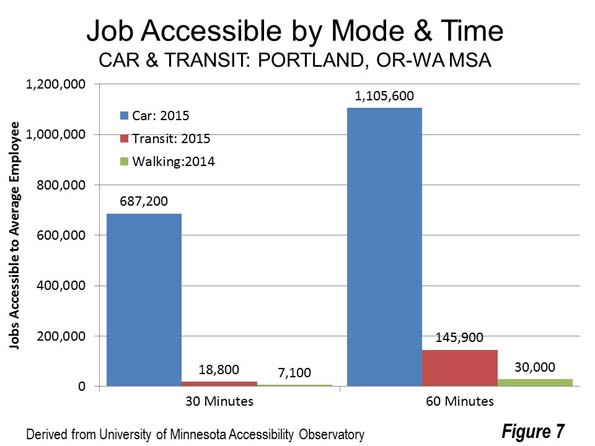
Portland is a metropolitan area often cited for its urban transport policies, especially its extensive light rail system. Further Portland has a comparatively strong, traditional central business district (downtown) and has implemented policies intended to reduce car use and encourage transit and walking as well as increase urban densities. The average Portlander can reach 687,000 jobs in 30 minutes by car, 19,000 by transit and only 7,000 by walking. That’s only slightly better than the national average, with autos providing 37 times the access of transit and 97 times that of walking (Figure 7).
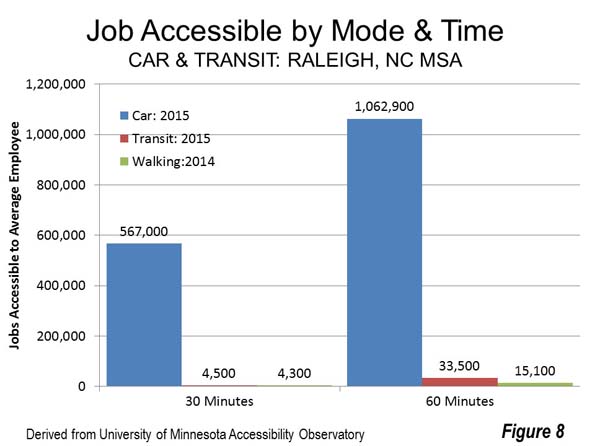
Raleigh (Note 2) is certainly not a new city, but its explosive growth has given the metropolitan area a post-World War II urban form, with comparatively low density (one-half that of Portland) and very low transit ridership. The average employee in Raleigh can reach 567,000 jobs by car in 30 minutes, compared to 4,500 by transit and 4,300 by walking. Raleigh’s auto access is 125 times that of transit and 132 times that of walking, both higher than the national average (Figure 8).
Extending Auto Mobility to All
It is clear from the data that access to an auto provides unique advantages in comparison to transit or walking. Professor Robert Gordon, in his seminal The Rise and Fall of American Growth says that" "Much of the enthusiastic transition away from urban mass transit to automobiles reflected the inherent flexibility of the internal combustion engine—it could take you directly from your origin point to your destination with no need to walk to a streetcar stop, board a streetcar, often change to another streetcar line (which required more waiting), and then walk to your final destination."
It might be asked, “how can it be that this is so in view of the many billions spent on new urban rail lines?” The answer is that transit cannot be competitive with the automobile in the modern urban area. Professor Jean-Claude Ziv and I concluded that it could take all of an urban area’s gross domestic product each year to build and operate such a system.
At the same time, transit moves a large share commuters to the largest central business districts in the transit legacy cities. This is an important niche market, but not a large percentage overall.
With the practical impossibility of replicating auto mobility for people who cannot afford cars, new thinking is needed. One approach could be auto ownership programs, according to Evelyn Bloomenberg and Margy Waller in a 2003 Brookings Institution paper. This could require shifting transit funding priorities toward employment access and the longer term economic growth that would produce.
Note 1: The latest reports cover 50 metropolitan areas. This article deals with 49, because no transit data was provided for Memphis.
Note 2: Some metropolitan areas are virtually adjacent to others. This can increase the jobs accessible because there is significant employment outside the metropolitan area, in an adjacent metropolitan area. Examples are San Francisco and San Jose, Washington and Baltimore, and Raleigh and Durham.
Photo: Suburban Employment Center: Chicago (by author)
Wendell Cox is principal of Demographia, an international public policy and demographics firm. He is a Senior Fellow of the Center for Opportunity Urbanism (US), Senior Fellow for Housing Affordability and Municipal Policy for the Frontier Centre for Public Policy (Canada), and a member of the Board of Advisors of the Center for Demographics and Policy at Chapman University (California). He is co-author of the "Demographia International Housing Affordability Survey" and author of "Demographia World Urban Areas" and "War on the Dream: How Anti-Sprawl Policy Threatens the Quality of Life." He was appointed to three terms on the Los Angeles County Transportation Commission, where he served with the leading city and county leadership as the only non-elected member. He served as a visiting professor at the Conservatoire National des Arts et Metiers, a national university in Paris.
-
The Brooklynization of Brooklyn
The New Brooklyn: What It Takes to Bring a City Back
by Kay HymowitzMy City Journal colleague Kay Hymowitz has written a number of great articles on Brooklyn, the borough that is her home. This inspired her to write a great book on the topic of the transformation of Brooklyn called The New Brooklyn.
It starts with a two-chapter history of the borough from its earliest settlement to the present day, followed by a series of chapters looking at Brooklyn today. This includes the transformation of Park Slope (where she and her husband moved in the early 1980s), Williamsburg, Bed-Stuy, and the Navy Yard.
But she recognizes that Brooklyn is not all hipster gentrifiers. It is still a borough of immigrants and still too often poverty. A quarter of Brooklyn’s residents are below the poverty line. So she also presents case studies of this other face of the new Brooklyn, including the looking at the Chinese of Sunset Park, the West Indians of Canarsie and the African-Americans of Brownsville.
There’s a lot of great details in here. For example, that there were once slaves in Brooklyn:
It’s worth lingering over this jarring fact: when you walk past the fine townhomes and churches of Brooklyn Heights, eat at a pizza joint in Bensonhurst, or wander through the art galleries of Bushwick, you are traversing land once tilled by African slaves – and a substantial number of them, given the small size of the white population.
Also how NYCHA income limit rules helped segregate public housing that had formerly been at least partially integrated.
NYCHA residents were required to move out once their income surpassed a certain ceiling. That made sense; public housing was supposed to be for those who couldn’t afford to live in private developments. The problem was that most of those who reached the income ceiling were white. Antipoverty advocates argued that it was only fair to give preference to the most disadvantaged on waiting lists. Perhaps; but as a result, upwardly mobile whites were replaced by poor black refugees both from the South and the cleared slums of other parts of New York.
There are also some passages that would give Richard Florida the tingles:
The postindustrial crowd settling in Park Slop had a somewhat different profile from their educated suburban cousins, a profile that continues to dominate gentrified neighborhoods everywhere. They were an artsy-literary bunch; today, we would call them the “creative class”…Whatever the reasons, the original gentrifiers were in conscious retreat from suburban conformity. Though gentrifier tastes have veered back towards mid-century modern, the Tiffany lamps, stained glass and Victorian antiques that the pioneers collected were a far cry from the harvest-gold kitchen appliances and plastic chairs and dishes favored by suburbanites.
A few of the essays were previously published in City Journal, but the majority of the book is new. The writing is very accessible and not academic. The New Brooklyn provides not just a highly readable look at the current conditions in Brooklyn, but a sense of how we got to where we are. As someone who lacks in-depth knowledge of Brooklyn, I found it very informative.
You can also listen to Kay talk about her book in a recent episode of the City Journal podcast.
Aaron M. Renn is a senior fellow at the Manhattan Institute, a contributing editor of City Journal, and an economic development columnist for Governing magazine. He focuses on ways to help America’s cities thrive in an ever more complex, competitive, globalized, and diverse twenty-first century. During Renn’s 15-year career in management and technology consulting, he was a partner at Accenture and held several technology strategy roles and directed multimillion-dollar global technology implementations. He has contributed to The Guardian, Forbes.com, and numerous other publications. Renn holds a B.S. from Indiana University, where he coauthored an early social-networking platform in 1991.