Blog

  • Zhengzhou Ghost City Alive!

    Zhengzhou, Henan, China (March 28, 2011): In December, London’s Daily Mail reported that the Zhengzhou New Area was China’s largest “Ghost City.” A visit to the Zhengzhou New Area indicates exactly the opposite. Chinese “Ghost Cities” are large areas of new development that are virtually unoccupied. The most famous example is Ordos, a new and reportedly empty city, built to replace an older city in Inner Mongolia.

    Zhenghou is an urban area of approximately 2.5 million population and is the capital of Henan province. The Zhengzhou New Area is located in the northeastern quadrant of Zhengzhou. It is circular in design, with two parallel roads, high-rise condominium buildings on the inner ring and commercial buildings on the outer ring. The interior of the circle includes the Henan Arts Center and a skyscraper that is under construction. A new high speed rail station is under construction to serve the new Guangzhou to Beijing line. The station is to be one of the largest in Asia.

    Our visit revealed anything but a Ghost City. Granted, no-one would mistake the traffic for Beijing Third Ring Road volumes, but virtually all of the parking spaces were taken and there was traffic on the streets (Figure 1). That ultimate indicator of Chinese urbanization, the availability of frequent taxicab service was well in evidence. Two of the city’s bus rapid transit lines serve the interior circle road, again indicating a substantial threshold of non-ghost urbanization.

    There were people on the sidewalks, though not the numbers typical of an older, more dense section of a Chinese urban area (Figure 2). It was clear from the laundry hanging in glass enclosed patios that many of the condominiums were occupied, though it is to be expected that many would not be, given the Chinese propensity to invest in multiple residential properties (a tendency the central government seeks to curb). Many of the commercial skyscrapers were occupied, and some were still under construction. There are also shopping centers, small stores and fast food restaurants.

    Zhengzhou New Area is intended by the developers to become the new central business district for Zhengzhou. There is much more planned than this first phase. Eventually, the Zhengzhou New Area is intended to cover 105 square kilometers (41 square miles), generally further to the northeast. City maps already show the planned street pattern, not unlike 19th century maps of some US cities.

    In short, the Zhengzhou New Area is alive and not a Ghost City. It may well be that it took longer than expected for the place to come alive. But it is clear that the life of the Zhengzhou New Area began more than four months ago.

  • Hanoi’s Underground Capitalism

    Along the pitted elegance of Pho Ngo Quyen, a bustling street in Hanoi, Vietnam, you will, predictably, find uniformed men in Soviet-style uniforms, banners with Communist Party slogans, and grandfatherly pictures of Ho Chi Minh. Yet, capitalism thrives everywhere else in this community — in the tiny food stalls, countless mobile phone stores and clothing shops  offering everything from faux European fashion to reduced-price children’s wear,  sandals and sneakers.

    Outside a ministry office, someone is cutting hair on the street. Nearby a woman is drying squid to sell to customers. Internet cafes proliferate, filled with young people.  Virtually every nook and cranny has a small shop or workplace for making consumer goods.

    In some ways, Hanoi seems very much a third-world city in terms of its infrastructure and cracking sidewalks, and it shares some characteristics with the slums featured in this Megacities project, such as underground economies and a growing population migrating from rural areas. But its poverty pales compared to places like Mumbai or Rio. The poor sections are rundown and crowded, but you don’t see people sleeping on the streets. This is a city clearly on the way up — in a country with nearly 95% literacy and a countryside that not only feeds itself but remains the largest source of export earnings.

    Of course, many rural residents — still roughly 70% of the population — continue to pour into Hanoi and other cities, but without the same desperation that characterizes, for example, people moving from Bihar to New Dehli or Mumbai. There is nothing of the kind of criminal elements that fester in the favelas of Brazil or Mexico City colonias.

    In Hanou, even for the poor, it’s not just about survival. There’s a sense of Wild West in the East. With very un-socialistic frenzy, motorcyclists barrel down the streets like possessed demons, with little regard to walking lanes or lights. Everyone not on the government payroll seems to have hustle, or is looking for one.

    Modern-day Hanoi reminds me most of China in the 1980s, when I first started going there. But there are crucial differences. State-owned companies in Vietnam lack the depth and critical mass of their Chinese counterparts, for example.  Still, as in China, foreign firms are moving in: Panasonic plants dot the outskirts, and Nokia is planning to build a $200 million factory on the city’s edge.

    Hanoi is not Singapore either, where an enlightened state has allowed flashes of street capitalism, particularly in the hawker’s stalls that make the city a foodie’s delight. In Singapore business remains highly deliberate and world-class, enabled by a much envied and skilled Mandarinate. As you walk around Hanoi, peak inside a cavernous building and you’ll see not a sleek Singapore-style mall, but a cluttered collection of small boutiques. It reminds one of nothing more than the Vietnamese outposts in Orange County, Calif., or in Los Angeles’ Chinatown, which is now largely dominated by Chinese from Vietnam.

    Le Dang Doanh, one of the architects of Vietnam’s economic reforms, which were  known as (Doi Moi) and launched in 1986, estimates the private sector now accounts for 40% of the country’s GDP, up from virtually zero. But Le Dang estimated as much as 20% more occurs in the “underground” economy where cash — particularly U.S.  dollars — reigns as king.

    “You see firms with as many as 300 workers that are not registered,” the sprightly, bespectacled 69-year-old economist explains. “The motive force is underground. You walk along the street. I followed an electrical cable once and it led me to a factory with 27 workers making Honda parts and it was totally off the system.”

    After years as a Communist apparatchik, Le Dang now has more faith in markets than is commonly found in the American media or U.S. college campuses. Trained in the Soviet Union and the former East Germany, Le Dang saw up close the “future” of a state-guided economy and concluded it doesn’t work. He noted that in agriculture farmers produce 50% of the cash income on the 5% of land that they can call their own. He also mentions proudly that his son, born in 1979, works for a private Hanoi-based software firm.

    Other Vietnamese also have developed a taste for self-interest — and display considerable ingenuity finding their way. One clear inspiration, and source of capital, for the rapid acceleration toward capitalism comes from the over 3.7 million overseas Vietnamese. Ironically many of these are former stalwart opponents to the nominally capitalist rulers who fled the Communist takeover in 1975.

    Today you see these ties at Vietnamese banks and trading companies nestled in various U.S. communities, including the largest in Orange County.  Overall, the U.S. community — also strong in Houston, Northern Virginia and San Jose –  accounts for roughly 40% of the total diaspora.

    These communities have prospered, after a shaky start following the end of the Vietnam War. They are particularly prominent in fields such as information technology, science and engineering, with percentage representation in the workforce in those fields higher than most other immigrant groups.

    For years the Communist homeland had little contact and shared no common purpose with this  largely successful, intensely capitalist diaspora. Strengthening ties between these upwardly mobile communities and the mother country are changing both. As UC Davis researcher Jane Le Skaife has found,Vietnam now ranks sixteenth in the world in remittances from abroad, with over $8 billion in 2010, nearly three-fifths come from the U.S.  This amounts to roughly 8% of the country’s GDP and is a larger amount than investment from international aid donors.  Skaife and others believe this number may be much too small given the Vietnamese penchant for  running beneath the official radar — a skill honed over the centuries.

    Although hardly fans of the official Marxist-Lenninist regime, many Vietnamese , notes Le Skaife, now take great pride — and see great opportunity — in Vietnam’s rapid growth and growing affluence.  According to the  CIA World Factbook, the country’s poverty rate has dropped from 75% in the 1980s to  10.6% of the population in 2010 . In terms of economic output, a brief on Vietnam by the World Bank reported that between the years 1995 and 2005 real GDP increased by 7.3% per year and per capita income by 6.2% per year.

    The growing symbiosis of   Vietnam with its diaspora, particularly in the U.S., will shape the rapid development of the country, notes Le Dang. This parallels the roles played earlier by the Indian and Chinese diaspora in the development of their home countries over the past two decades.

    Nowhere will this impact be felt more than in major cities such as Hanoi, Danang and especially Ho Chi Minh City (the former Saigon). “We are seeing more of the expatriates here, and they are bringing management skill and capital through their family networks,” Le Dang says. “They are a key part of the changes here.”

    For Americans, these changes should be welcomed both for economic and geopolitical reasons. Although much of our intelligentsia welcomes the onset of a “post-American” world, the perspective in Hanoi could not be more different. To Vietnam’s leaders, the United States, for all memories of the devastating war there, remains a critical counterweight to the country that has been their historic rival, China. Americans are more welcomed in Hanoi these days than in Berlin or Paris, or maybe even Toronto.

    Even in the ramshackle working class wards along the Red River, you see signs in English and the dollar is welcome. It’s not that these fiercely independent people want to become Americans, but that they are acting like Americans — or at least those who still favor grassroots capitalism as the best way to secure the urban future.

    This piece originally appeared in Forbes.

    Joel Kotkin is executive editor of NewGeography.com and is a distinguished presidential fellow in urban futures at Chapman University, and an adjunct fellow of the Legatum Institute in London. He is author of The City: A Global History. His newest book is The Next Hundred Million: America in 2050, released in February, 2010.

    Photo by Gerry Popplestone

  • The Accelerating Suburbanization of New York

    Some of the best evidence that the tide has not turned against dispersion and suburbanization comes from an unlikely source:  New York’s 2010 census results. If dense urbanism works anywhere in America, it does within this greatest of US traditional urban areas.

    Before the actual count, the Census Bureau estimated, in large part as a result of a successful historical core municipality (city of New York) challenges, that as of Census Day (April 1, 2010), the city would have added 413,000 residents since 2000 and would have accounted for more than one-half of the metropolitan area growth. But the numbers turned out startlingly different. In fact, the city’s census count came in nearly 250,000 below projections and accounted for the lowest share of New York metropolitan area growth since the 1970s.

    Overall the 2010 census figures paint a picture of continuing dispersion in the nation’s largest metropolitan area, New York. The metropolitan area stretches from Manhattan, with the world’s second largest business district (after Tokyo) to the four outer boroughs of the city of New York, more than 100 miles to the eastern end of Long Island, north to Putnam and Rockland counties, completely across northern New Jersey, jumping the Delaware River to include Pike County, Pennsylvania and south to Ocean County (New Jersey), nearly all the way to Atlantic City. In all, this 23 county metropolitan area has the nation’s largest population and actually extended its margin over second place Los Angeles, which has been converted from a growth leader to a laggard giant growing slower than most Midwestern metropolitan areas. New York added 574,000 residents, while Los Angeles added 473,000. If New York continues to add more people than Los Angeles in future censuses, its position as the nation’s largest metropolitan area be secure.

    Major metropolitan areas in general did poorly in terms of growth in the new cesusus. This was particularly true in New York. Between 2000 and 2010, the New York metropolitan area population rose from 18,323,000 to 18,897,000, a modest growth rate of 3.1 percent, one of the slowest among major metropolitan areas in the country. The national growth rate was three times as high

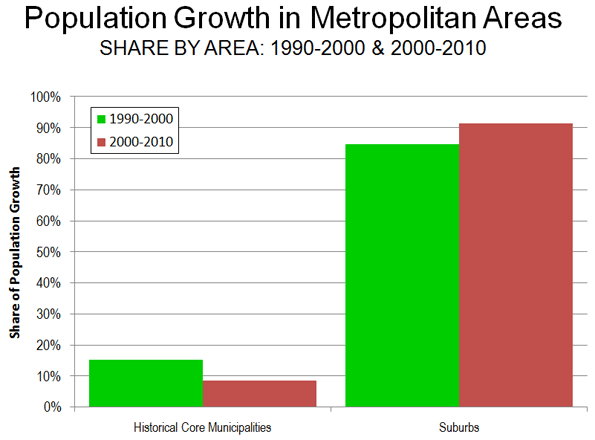
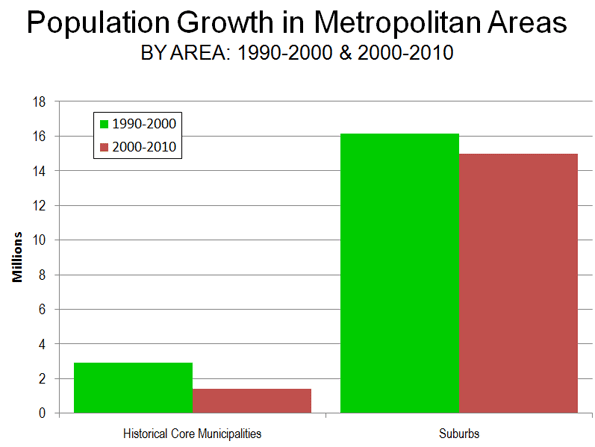
    Suburbanization Accelerating Again: If you had read the New York Times and other Manhattan-based media over the last decade you would have assumed the suburbs were in decline and cities ascendant, particularly in the New York area. Yet in reality over the past decade, the suburban counties captured their largest share of New York metropolitan area growth in three decades. During the 2000s, the suburbs accounted for 71 percent of growth, up from 54 percent during the 1990s and 48 percent in the 1980s. The outer suburbs grew the fastest, while the inner suburbs – some of which are denser than historical core municipalities in other metropolitan areas – grew faster than the historical core municipality, the city of New York (Figure 1 and Table)


    NEW YORK METROPOLITAN AREA
    POPULATION TREND BY COUNTY: 2000 TO 2010
    2000 2010 Change %
    HISTORIC CORE MUNICIPALITY (New York)
    Bronx County, NY       1,332,650       1,385,108        52,458 3.9%
    Kings County, NY       2,465,326       2,504,700        39,374 1.6%
    New York County, NY       1,537,195       1,585,873        48,678 3.2%
    Queens County, NY       2,229,379       2,230,722          1,343 0.1%
    Richmond County, NY         443,728         468,730        25,002 5.6%
    Subtotal       8,008,278       8,175,133       166,855 2.1%
    INNER SUBURBAN
    Bergen County, NJ         884,118         905,116        20,998 2.4%
    Essex County, NJ         793,633         783,969         (9,664) -1.2%
    Hudson County, NJ         608,975         634,266        25,291 4.2%
    Middlesex County, NJ         750,162         809,858        59,696 8.0%
    Nassau County, NY       1,334,544       1,339,532          4,988 0.4%
    Passaic County, NJ         489,049         501,226        12,177 2.5%
    Union County, NJ         522,541         536,499        13,958 2.7%
    Westchester County, NY         923,459         949,113        25,654 2.8%
    Subtotal       6,306,481       6,459,579       153,098 2.4%
    OUTER SUBURBAN
    Hunterdon County, NJ         121,989         128,349          6,360 5.2%
    Monmouth County, NJ         615,301         630,380        15,079 2.5%
    Morris County, NJ         470,212         492,276        22,064 4.7%
    Ocean County, NJ         510,916         576,567        65,651 12.8%
    Pike County, PA           46,302           57,369        11,067 23.9%
    Putnam County, NY           95,745           99,710          3,965 4.1%
    Rockland County, NY         286,753         311,687        24,934 8.7%
    Somerset County, NJ         297,490         323,444        25,954 8.7%
    Suffolk County, NY       1,419,369       1,493,350        73,981 5.2%
    Sussex County, NJ         144,166         149,265          5,099 3.5%
    Subtotal       4,008,243       4,262,397       254,154 6.3%
    SUBTOTAL: SUBURBAN     10,314,724     10,721,976       407,252 3.9%
    TOTAL     18,323,002     18,897,109       574,107 3.1%


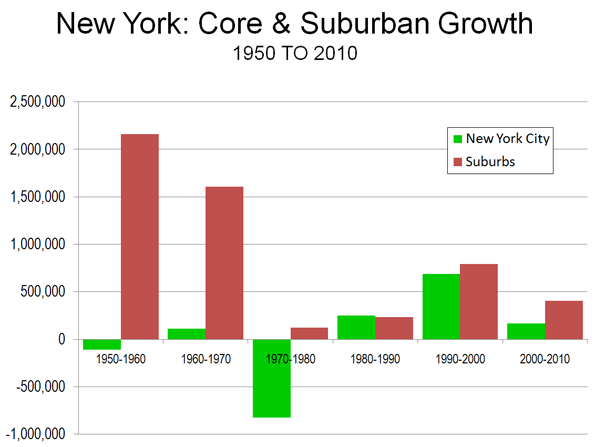
    Critically, the city of New York did worse than at any time since the 800,000 population loss that was sustained in the 1970s, representing all of the loss since 1950. Between 1950 and 1980 the suburbs added 3.9 million residents. The city’s fortunes had improved measurably in the 1980s and 1990s, with approximately one-half of the metropolitan area’s growth. The last decade’s share of metropolitan area growth – only 29 percent – in the historical core municipality indicates a startling acceleration of dispersion, although fortunately not a return to the population decline of the 1970s (Figure 2).

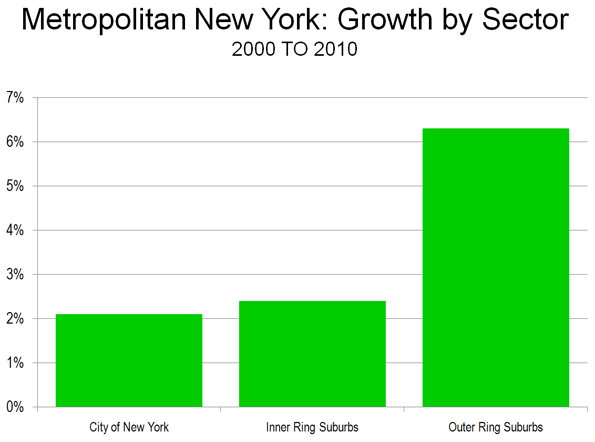
    City of New York: The city of New York grew from 8,008,000 to 8,175,000 between 2000 and 2010, a rate of 2.1 percent.

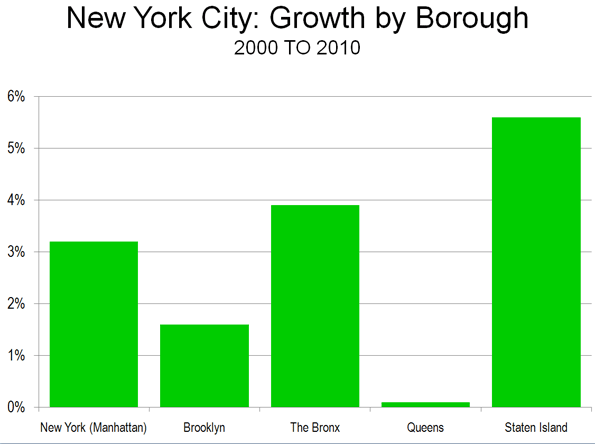
    Staten Island (Richmond County), which is largely suburban in form, was the fastest growing of New York’s boroughs, with a growth rate of 5.6 percent. The Bronx grew the second fastest, at a rate of 3.9 percent. Only Staten Island and Queens (below) reached their population peaks in the 2010 census (Figure 3).

    The Bronx has experienced perhaps the nation’s most successful urban turn-arounds, after a disastrous period in the 1970s and 1980s, when large swaths of the South Bronx were literally leveled. The population fell from 1,472,000 in 1970 to 1,204,000 in 1990. By 2010, the population had recovered nearly two-thirds of the loss, to 1,385,000.

    Manhattan (New York County) added 3.2 percent to its population (49,000) and reached 1,586,000. This is approximately one-third below its population peak of 2,232,000 in 1910.   Manhattan’s population, however, remained approximately 45,000 below the Census Bureau estimates.

    Brooklyn (Kings County) continues to be the largest borough in New York, with 2,505,000 residents, an increase of 39,000 (1.6 percent) between 2000 and 2010. Brooklyn reached its population peak of 2,738,000 in 1950. Brooklyn’s population proved approximately 75,000 below the Census Bureau’s estimates.

    The slowest growing borough was Queens, which added only 2,000 residents (a 0.1 percent population increase), yet reached its population peak of 2,231,000. Queens had added more residents than any other borough since 1950 and added approximately 275,000 residents in the 1990 to 2000 census period.

    Inner Ring Suburbs: The inner ring counties (Nassau, Westchester, Bergen, Passaic, Essex, Hudson, Union and Middlesex) grew 2.4 percent from 6,306,000 to 6,460,000. Growth rates varied significantly, from a loss of 1.2 percent in Essex County (where Newark is located) to 8.0 percent in Middlesex County. Middlesex County includes newer suburban areas further away from the core than in any other inner ring county. Much of the Middlesex County growth occurred in these areas. The inner ring suburbs captured 26.7 percent of the metropolitan area growth.

    Outer Ring Suburbs: By far the e fastest growth was in the outer ring counties, with a population increase of 6.3 percent, from 4,008,000 to 4,262,000. Monmouth County was the slowest growing outer ring county, adding 2.5 percent to its population. Pike County, Pennsylvania, which is the farthest to the west of any county in the metropolitan area, had by far the highest growth rate, at 23.8 percent. Ocean County, New Jersey, had the second fastest growth rate, at 12.8 percent. Ocean County lies at the extreme southern end of the metropolitan area. The outer ring counties captured 44.3 percent of the metropolitan area growth.

    Suburban Growth and Projections: Overall suburban growth was from 10,314,000 to 10,712,000, for a gain of 407,000 (4.0 percent). This was above the Census Bureau estimate of 392,000. The suburbs now contain 57 percent of the metropolitan area population.

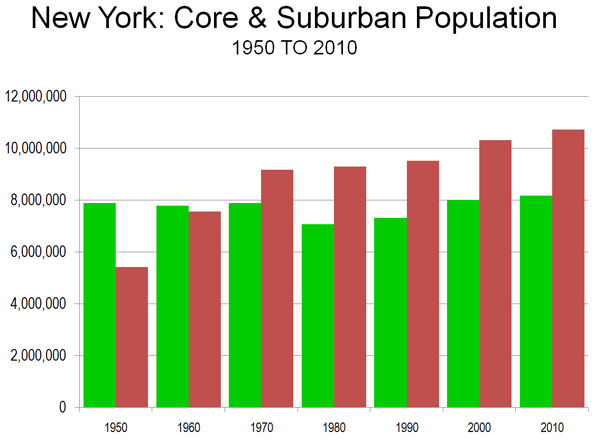
    New York’s Continuing Dispersion: The dispersion of the 2000s is an extension of the overall metropolitan area trend since 1950 (Note). The historical core municipality, New York, has added less than 300,000 residents, or 3.6 percent. The suburbs have added 5.3 million residents, nearly doubling their population. Approximately 95 percent of the metropolitan area’s growth was in the suburbs between 1950 and 2010 (Figure 4).

    The dispersion is apparent even in the city of New York. Since 1950, Queens, the outermost of the inner four boroughs, added nearly 700,000 residents, while the more inner boroughs of Manhattan, Brooklyn and the Bronx, lost nearly as many residents. Overall these four inner boroughs gained only 6,000 residents since 1950. Staten Island, which is largely post-war suburban, grew 277,000, while the city overall was growing by 283,000, leaving only a net gain of 6,000 for the four inner boroughs of New York.

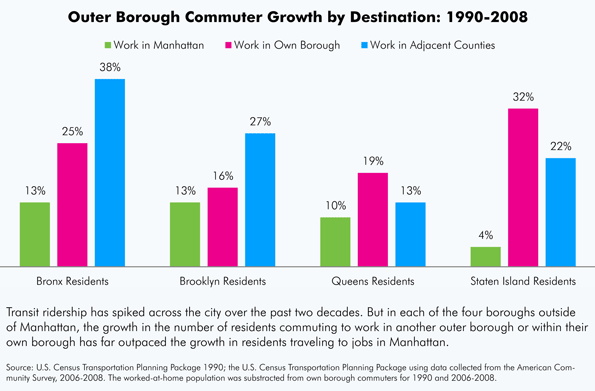
    A recent newgeography.com article documents similar patterns in employment dispersion and commuting during the 1990 to 2008 period.

    Consistency with the National Trend: The accelerating suburbanization of New York is consistent with the national trends in major metropolitan areas in the new census data. Between 1990 and 2000, historical core municipalities accounted for 15 percent of metropolitan area growth. Between 2000 and 2010, the share of historical core municipality growth had fallen to 9 percent.

    Note: This analysis is based upon the metropolitan area boundaries as currently defined.

    Wendell Cox is a Visiting Professor, Conservatoire National des Arts et Metiers, Paris and the author of “War on the Dream: How Anti-Sprawl Policy Threatens the Quality of Life

    Photo by Mike Lee

  • Vancouver Olympic Villiage Scandal Gets Worse

    The Vancouver Olympic Village scandal continues to worsen.  During construction, the City of Vancouver was forced to take over financing of the project, as the developer’s initial lender backed out due to cost overruns.  At the end of last August, the developer fell behind its payment schedule, and the City placed the property into receivership in November.  The development has been a spectacular failure, with fewer than half of the 737 units being sold.  The outstanding debt to the city is $743 million.  To make things worse, a quarter of the tenants are now suing the City. 

    One might expect that a billion dollar development for Olympic athletes would be pretty posh.  Prices ranged from $530,900 for a 566 square foot studio, to $4.8 million for three bedroom units.  Even in unaffordable Vancouver, you’d expect that to come with a bedroom big enough to fit a bed.   According to tenants, they didn’t even get that.  What they did get was bizarre leaks, cracking ceilings, and inadequate heating.  The project sounds like something out of Arrested Development, or as the tenants’ legal counsel put it, “It’s like they were sold a BMW and they got a broken Toyota. And even if they manage to fix everything, it’s still a Toyota.”  The units are far from the luxury accommodations buyers were lead to believe they were getting.

    In short, the lawsuits seem perfectly legitimate, and are likely to cost the City another $50 million dollars.  It’s also hard to imagine this quagmire will help the value of the units on the market.  Even before the horrendous conditions of the condo units were made public, reports claimed that the development was worth $150-200 million less than what was owed to the city.  It is hard to imagine a scenario where the city isn’t stuck with hundreds of millions of dollars of losses. 

    Of course, none of this should come as a surprise.  Government housing projects generally fail.  And if governments can’t build adequate housing for the poor, it’s hard to imagine them building upscale housing at a price that the market will bear.  Hence the shoddy work.  The lesson here is a simple one, that history proves again and again: governments make bad landlords.

  • Vietnam, No Longer an Underdeveloped Country

    The most recent estimates for 2010 indicate that Vietnam is no longer among the underdeveloped countries of the world and has moved onto the ranks of middle-income countries.  Financial remittances – better known as money being sent back to the home country – have lent a critical hand in accomplishing this major triumph in the country’s formerly depressed economy.

    The influx of money by overseas Vietnamese, many of whom fled as political refugees, has dramatically changed the economic landscape of the country in terms of poverty levels and development.

    Development Since the War

    The aftermath of the war had left Vietnam among the five poorest countries in the world with 75 percent of the population living in poverty in 1984. Since then, the poverty level had dramatically decreased to 37 percent in 1998 and later to 29 percent in 2002, according to the World Bank.

    The CIA World Factbook more recently estimated Vietnam as having only 10.6 percent of the population living below the poverty line in 2010, a far cry from the 75 percent just 26 years earlier. In terms of economic output, a brief on Vietnam by the World Bank reported that the real GDP increased by 7.3 percent per year during 1995-2005 and per capita income by 6.2 percent per year.

    Vietnam was expected to enter the ranks of other middle-income countries by reaching the $1,000 GDP per capita marker by 2010, which it did according to the International Monetary Fund (IMF). The IMF estimated Vietnam’s GDP per capita as $1,155 for the 2010 fiscal year. Since then, the country’s Ministry of Planning and Investment (MPI) has set a new target that nearly doubles Vietnam’s current GDP per capita over the next four years. An expected GDP per capita of $2,100 by 2015 will allow Vietnam to surpass India’s GDP per capita in the global economy and be among the ranks of the Philippines.

    The target GDP per capita, however, is still well below its communist competitor, China, which now boasts an average GDP per capita of $4,520. Even though China presently holds the title as the “Red Dragon of the East,” Vietnam, with its enormous potential for economic growth, has recently been referred to as the “Rising Dragon” and the “New Asian Dragon” by various scholars.

    The World Bank avowed, “Vietnam is one of the best performing economies in the world over the last decade.” It further stated, “Vietnam’s poverty reduction and economic growth achievement in the last 15 years are one of the most spectacular success stories in economic development.”

    Remittances Over the Years

    Financial remittances have had a notable influence on the improved economic conditions in Vietnam over the years. This has been especially evident since the U.S. rescinded the embargo against Vietnam in 1995, which allowed for greater opportunities to remit money through formalized channels.

    In the years immediately following the Vietnam War, it was close to impossible for Vietnamese-Americans to send money directly to their home country. The majority of remittances that were successfully sent back to the home country were primarily conducted through informal money transfers.

    The gradual increase in official remittances over the past few decades, however, has been attributed to a combination of key events, which include but are not limited to: the Vietnamese government launch of a renovation process (Doi Moi) in 1986, the U.S. lifting of the embargo against Vietnam in 1995, and Vietnam’s membership into the World Trade Organization in 2007.

    In 2008, Vietnam emerged as the tenth leading recipient of migrant remittances among developing countries with $7.2 billion received during that year alone. The U.S. neighbor to the south, Mexico, with $26.3 billion, was third behind India and China.

    Later in 2009, Vietnam’s financial remittances fell slightly to $6.8 billion despite predictions of a greater drop among all developing countries. The slight decline during the considerable global economic downturn illustrated the resilience of money being sent to Vietnam from abroad, particularly from troubled economies such as the United States, France and in Eastern Europe.

    In addition, remittances appear again on an upswing.  By the end of the 2010 fiscal year, Vietnam set a new total inward remittance record of more than $8 billion through official channels. This $8 billion represented about 8 percent of the overall GDP for the country that year.

    The Role of remittances on development

    Although there have been no notable studies that directly connect migrant remittances and development specifically in Vietnam,  the effects of financial remittances on the Vietnamese economy are likely to be profound.

    Existing studies on other countries in the world have already illustrated the significant relationship between migrant remittances and development in the home country in terms of balance of payments, saving and investment, structural changes in the economy, and other channels influencing development and growth. In recent decades, these links between mother country and expatriates have played a critical role in the rise of both China and India.

    Such ties are particularly critical for developing countries which see remittances as a reliable long-term source of foreign capital. In 2000, the United Nations reported that financial remittances had increased the GDPs of El Salvador, Jamaica, Jordan, and Nicaragua by 10 percent. The World Bank in 2004 further revealed that financial remittances accounted for 31 percent, 25 percent, and 12 percent of the GDP in Tonga, Haiti, and Nicaragua, respectively.

    More recent data from the Migration Policy Institute (MPI) in 2009 astonishingly showed that remittances constituted 49.6 percent, 37.7 percent, and 31.4 percent of the overall GDP for Tajikistan, Tonga, and Moldova, respectively. Although Vietnam’s inward formal remittances comprise less than 10 percent of the country’s overall GDP, it was still ranked 16th among the top 30 remittance receiving countries by the World Bank in 2010.

    The existing potential of remittances on development has been notable in Vietnam and continues to grow exponentially – even despite the slowing of the economy in the rest of the world.

    Whether or not these effects are positive or negative may be a matter of ideology and politics. The Vietnamese government clearly wants to maximize the benefits of remittances. But there is concern about such issues as “dollarization” of the economy and the role such transfer may play in worsening the growing inequality between the rich and poor widely decried in Vietnam. Yet overall remittances should be seen as a net positive, helping to spark entrepreneurial ventures critical to the country’s movement from a third world to a solidly second world status.

    Jane Le Skaife is a doctoral candidate in the Department of Sociology at the University of California, Davis. She is currently conducting her dissertation research involving a cross-national comparison of Vietnamese refugees in France and the United States.

    Photo by Yen H Nguyen

  • Census 2010 Offers Portrait of America in Transition

    The Census Bureau just finished releasing all of the state redistricting file information from the 2010 Census, giving us a now complete portrait of population change for the entire country.  Population growth continued to be heavily concentrated in suburban metropolitan counties while many rural areas, particularly in the Great Plains, continue to shrink.


    Percentage change in population, 2000-2010. Counties that grew in population in blue, decliners in red. Note: Legend values not multiplied by 100.

    Dividing counties by those growing faster or slower than the US average paints the picture even more starkly:


    Percentage change in population, 2000-2010.  Counties growing faster than the US average in blue, slower than the US average in red.  Note: Legend values not multiplied by 100.

    The release of all county data means it is also possible to take an unofficial, preliminary look at metropolitan area growth.  The biggest gainers were Sunbelt cities in the South, Texas, and the Midwest, while the Midwest and Northeast continued to lag, particularly the old heavy manufacturing axis stretching from Detroit to Pittsburgh. But this picture was not monolithic. Many Southern cities with Rust Belt profiles like Birmingham failed to grow much compared to neighbors, nor did coastal California with its development restrictions.


    Percentage change in population, 2000-2010. MSAs that grew in population in blue, decliners in red. Note: Legend values not multiplied by 100.


    Percentage change in population, 2000-2010.  Counties growing faster than the US average in blue, slower than the US average in red.  Note: Legend values not multiplied by 100.

    A full table of population change for large metro areas (greater than one million people) is available at the bottom of this post.

    Basic race information is also available in this data release, since it is used to ensure redistricting complies with the requirements of the Voting Rights Act.  Here’s a map showing the concentration of Hispanic population the US:


    Population of Hispanic Origin, as a percentage of total population. Note: Legend values not multipled by 100.

    Hispanic population remains heavily concentrated in the Southwest, but the interior, and especially parts of the South one would not expect, such as Alabama, posted significant gains in Hispanic population share.


    Hispanic population as change in percentage of total population, 2000-2010.  Note: Legend values not multiplied by 100.

    As the highest concentrations of Hispanics remain in the Southwest, similarly the Black population is at its heaviest concentrations in the South:

    Black Alone population as a percentage of total population, 2010.  Note: Legend percentages not multiplied by 100.

    A lot has been written about the so-called reverse Great Migration of blacks from the North to the South.  These results show something of that effect, but less of a general than a specific migration. Some cities both North and South are becoming magnets for Blacks, while other traditional Black hubs like Chicago are no longer favored. Note that some northern cities that showed a larger increase in concentration started off on a low base, like Minneapolis-St. Paul:


    Black Alone population as change in percentage of total population, 2000-2010.  Note: Legend values not multiplied by 100.

    As noted above, here are all US metro areas with a population greater than one million people in 2010, ranked by percentage change in population:

    2000-2010 Population Growth, MSAs of 1 Million or More
    Rank Metropolitan Area 2000 2010 Total Change Pct Change
    1 Las Vegas-Paradise, NV 1,375,765 1,951,269 575,504 41.8%
    2 Raleigh-Cary, NC 797,071 1,130,490 333,419 41.8%
    3 Austin-Round Rock-San Marcos, TX 1,249,763 1,716,289 466,526 37.3%
    4 Charlotte-Gastonia-Rock Hill, NC-SC 1,330,448 1,758,038 427,590 32.1%
    5 Riverside-San Bernardino-Ontario, CA 3,254,821 4,224,851 970,030 29.8%
    6 Orlando-Kissimmee-Sanford, FL 1,644,561 2,134,411 489,850 29.8%
    7 Phoenix-Mesa-Glendale, AZ 3,251,876 4,192,887 941,011 28.9%
    8 Houston-Sugar Land-Baytown, TX 4,715,407 5,946,800 1,231,393 26.1%
    9 San Antonio-New Braunfels, TX 1,711,703 2,142,508 430,805 25.2%
    10 Atlanta-Sandy Springs-Marietta, GA 4,247,981 5,268,860 1,020,879 24.0%
    11 Dallas-Fort Worth-Arlington, TX 5,161,544 6,371,773 1,210,229 23.4%
    12 Nashville-Davidson–Murfreesboro–Franklin, TN 1,311,789 1,589,934 278,145 21.2%
    13 Jacksonville, FL 1,122,750 1,345,596 222,846 19.8%
    14 Sacramento–Arden-Arcade–Roseville, CA 1,796,857 2,149,127 352,270 19.6%
    15 Denver-Aurora-Broomfield, CO 2,179,240 2,543,482 364,242 16.7%
    16 Washington-Arlington-Alexandria, DC-VA-MD-WV 4,796,183 5,582,170 785,987 16.4%
    17 Tampa-St. Petersburg-Clearwater, FL 2,395,997 2,783,243 387,246 16.2%
    18 Salt Lake City, UT 968,858 1,124,197 155,339 16.0%
    19 Portland-Vancouver-Hillsboro, OR-WA 1,927,881 2,226,009 298,128 15.5%
    20 Indianapolis-Carmel, IN 1,525,104 1,756,241 231,137 15.2%
    21 Richmond, VA 1,096,957 1,258,251 161,294 14.7%
    22 Oklahoma City, OK 1,095,421 1,252,987 157,566 14.4%
    23 Columbus, OH 1,612,694 1,836,536 223,842 13.9%
    24 Seattle-Tacoma-Bellevue, WA 3,043,878 3,439,809 395,931 13.0%
    25 Miami-Fort Lauderdale-Pompano Beach, FL 5,007,564 5,564,635 557,071 11.1%
    26 Kansas City, MO-KS 1,836,038 2,035,334 199,296 10.9%
    27 Minneapolis-St. Paul-Bloomington, MN-WI 2,968,806 3,279,833 311,027 10.5%
    28 Louisville/Jefferson County, KY-IN 1,161,975 1,283,566 121,591 10.5%
    29 San Diego-Carlsbad-San Marcos, CA 2,813,833 3,095,313 281,480 10.0%
    30 Memphis, TN-MS-AR 1,205,204 1,316,100 110,896 9.2%
    31 Birmingham-Hoover, AL 1,052,238 1,128,047 75,809 7.2%
    32 Baltimore-Towson, MD 2,552,994 2,710,489 157,495 6.2%
    33 Virginia Beach-Norfolk-Newport News, VA-NC 1,576,370 1,671,683 95,313 6.0%
    34 Cincinnati-Middletown, OH-KY-IN 2,009,632 2,130,151 120,519 6.0%
    35 San Jose-Sunnyvale-Santa Clara, CA 1,735,819 1,836,911 101,092 5.8%
    36 Hartford-West Hartford-East Hartford, CT 1,148,618 1,212,381 63,763 5.6%
    37 San Francisco-Oakland-Fremont, CA 4,123,740 4,335,391 211,651 5.1%
    38 Philadelphia-Camden-Wilmington, PA-NJ-DE-MD 5,687,147 5,965,343 278,196 4.9%
    39 St. Louis, MO-IL 2,698,687 2,812,896 114,209 4.2%
    40 Chicago-Joliet-Naperville, IL-IN-WI 9,098,316 9,461,105 362,789 4.0%
    41 Los Angeles-Long Beach-Santa Ana, CA 12,365,627 12,828,837 463,210 3.7%
    42 Milwaukee-Waukesha-West Allis, WI 1,500,741 1,555,908 55,167 3.7%
    43 Boston-Cambridge-Quincy, MA-NH 4,391,344 4,552,402 161,058 3.7%
    44 New York-Northern New Jersey-Long Island, NY-NJ-PA 18,323,002 18,897,109 574,107 3.1%
    45 Rochester, NY 1,037,831 1,054,323 16,492 1.6%
    46 Providence-New Bedford-Fall River, RI-MA 1,582,997 1,600,852 17,855 1.1%
    47 Buffalo-Niagara Falls, NY 1,170,111 1,135,509 -34,602 -3.0%
    48 Pittsburgh, PA 2,431,087 2,356,285 -74,802 -3.1%
    49 Cleveland-Elyria-Mentor, OH 2,148,143 2,077,240 -70,903 -3.3%
    50 Detroit-Warren-Livonia, MI 4,452,557 4,296,250 -156,307 -3.5%
    51 New Orleans-Metairie-Kenner, LA 1,316,510 1,167,764 -148,746 -11.3%

    Aaron M. Renn is an independent writer on urban affairs based in the Midwest. His writings appear at The Urbanophile. Maps and analysis done using Telestrian.

  • Final Census Results: Core Cities Do Worse in 2000s than 1990s

    Based upon complete census counts for 2010, historical core municipalities of the nation’s major metropolitan areas (over 1,000,000 population) captured a smaller share of growth in the 2000s than in the 1990s.

    The results for the 50 metropolitan areas (New Orleans excluded due to Hurricane Katrina and Tucson unexpectedly failed to reach 1,000,000 population) indicate that historical core municipalities accounted for 9 percent of metropolitan area growth between 2000 and 2010, compared to 15 percent in the 1990-2000 period. Overall, suburban areas captured 91 percent of metropolitan area population growth between 2000 and 2010, compared to 85 percent between 1990 and 2000.

    Total population growth in the historical core municipalities was 1.4 million, nearly all of it in municipalities with a largely suburban form (such as Phoenix, San Antonio and Charlotte). This compares to an increase of 2.9 million during the 1990s.

    Suburban areas (areas in metropolitan areas outside the historical core municipalities) grew 15.0 million, down from 16.1million.

    Overall, the major metropolitan areas added 14 percent to their populations in the 2000s, down from 19 percent growth in the 1990s. The historical core municipalities grew 4 percent, compared to the 1990s rate of 7 percent. Suburban areas grew 18 percent, compared to the 1990s rate of 26 percent (all data unweighted).


  • NY Borough to Borough Commute? Fuhgeddaboudit

    As the country’s largest and densest metropolis, New York City has been able to offer a level of public transit service that most other cities can only dream about. Commuting to Downtown or Midtown Manhattan has been—and still is to a large degree—a remarkably easy affair for hundreds of thousands of residents, whose travel options include commuter train, subway, ferry and bus. However, like a lot of older American cities, New York has changed dramatically since most of those services were put into place, and more and more residents, particularly among lower-income workers, no longer travel to Manhattan for work.

    Census data show that between 1990 and 2008 the number of residents who traveled to work in their own borough or a neighboring borough or county increased much faster than the number who made the more traditional commute to Manhattan. For instance, the number of Bronx residents who traveled to Queens or Westchester County for work increased by 38 percent, and the number who traveled inside the borough jumped by 25 percent, while the number commuting to Manhattan increased by only 13 percent in the same period.

    The discrepancies on Staten Island are even starker: During the same period, the number of Staten Island residents traveling to work inside their own borough increased by 32 percent, and those going to Brooklyn or New Jersey increased by 22 percent, while the number heading into Manhattan barely changed at all—a four percent increase in those 18 years. Although not as dramatic, Brooklyn and Queens both saw significant gains in non-traditional commutes as well. In fact, the number of Brooklyn residents traveling to Queens grew by 32 percent, compared to a 13 percent increase in the number going to Manhattan. In 2008 despite being a notoriously difficult trip for public transit riders, nearly 160,000 people crossed the Brooklyn/Queens border for work everyday.

    One big reason for this shift in commuter patterns is New York’s changing economic landscape. For decades Manhattan has been steadily losing its share of jobs to the other four boroughs, but over the last ten years that process has sped up considerably. From 2000 to 2009, New York City lost a net 41,833 jobs, but that was because of the huge concentration of losses in Manhattan during 2008 (over 100,000 in that single year). Every other borough saw a net increase in jobs during that period. Queens saw 2.4 percent growth, Staten Island 4.6 percent growth and the Bronx and Brooklyn 7.7 and 7.9 percent growth, respectively.

    It won’t come as surprise to those who have been paying close attention to the economy that robust job gains in the health care and education sectors are what lie behind sustained growth in the outer boroughs. Between 2000 and 2009, New York City gained nearly 120,000 jobs in those two sectors alone. And although Midtown Manhattan has several prominent hospitals and universities, collectively, the hundreds of hospitals, nursing homes, community health clinics, colleges and professional schools in the other four boroughs—from Montefiore Hospital in the Bronx and SUNY Downstate Medical Center in Brooklyn to Queensborough Community College in Bayside—accounted for the lion’s share of jobs in those sectors.

    New York City’s transit system wasn’t designed for commuter trips to jobs within and between boroughs outside of Manhattan, and as a result the city’s median commute times have been rising steadily for decades. According to American Community Survey data released last December, New York’s four outer boroughs all have median commute times that are north of 40 minutes, which puts them among the longest in the country. And among public transit riders they are significantly longer, ranging from 52 minutes each way in Brooklyn to a barely comprehensible 69 minutes each way in Staten Island.

    In our study, we interviewed a number of outer borough employers who felt that a lack of dependable rapid transit service has exacted a toll on their businesses. A lack of transit effectively shrinks their labor pool, they said, and causes more turnover as disgruntled employees decide to leave rather than suffer through two hour commutes every day. The chief operating officer at SUNY Downstate Medical Center in East Flatbush Brooklyn even said that it could cause the hospital to rethink its plans for expansion. “I’ve been here 24 years,” he said, “and I still haven’t seen any improvements in mass transit.”

    New York’s biggest investments in transit are still almost entirely focused on Manhattan commuters. Tens of billions of dollars are being invested in what amounts to an extension of the Q train along Second Avenue, a new Long Island Railroad tunnel to Grand Central, a one stop extension of the number 7 train on the west side, and a Santiago Calatrava-designed Fulton Street Station in lower Manhattan. A new Moynihan Station on 34th Street is apparently next on the agenda. These projects may spawn billions more in lucrative real estate deals, but they don’t reflect the city’s true economic geography.

    A lack of transit investments in the outer boroughs might be understandable if these new outer borough jobs were spread out evenly over a large territory, but a huge percentage are located in relatively dense clusters. Over 20,000 commuters descend on the SUNY Downstate and Kings County Medical Campuses — right across the street from each other —every morning, for example. But very little has been done to facilitate commutes to that area, and many employees and patients depend on a dizzying array of livery cabs and dollar vans to get them where they’re going. Similarly, JFK airport in Queens is home to over 55,000 jobs; Hunts Point in the Bronx 20,000; the Sunset Park waterfront in Brooklyn 32,000, and so on.

    Making much needed investments in service and upgrades to the bus system may not be as sexy as a new train terminal in Midtown. But if New York is going to sustain job growth and retain a truly world-class transit system, then it will have to start looking beyond Manhattan and invest in solutions that make commutes to job centers in the outer boroughs easier for residents.

    David Giles is a research associate at the Center for an Urban Future, a Manhattan-based think tank. He is the author of Behind the Curb, a Center for an Urban Future report about the gaps in transit service in the four boroughs of New York City outside of Manhattan, from which this article was adapted. For the whole report, please visit BehindtheCurb or www.nycfuture.org.

    Photo: The Brooklyn Bridge by S J Pinkey

  • Chicago’s Unique Population Loss of the 1 Million Plus Cities

    There are only 9 cities in the United States with populations over 1 million. The list includes New York, Los Angeles, San Diego, Philadelphia, Chicago, Phoenix, Houston, San Antonio, and Dallas. With this afternoon’s release of Census 2010 numbers for New York City, the final 2010 data is in.

    Of these 1 million or more cities, only Chicago lost population over the last decade, yet the media seems to be in love with Mayor Daley.  The New Yorker called Mayor Daley “America’s most successful mayor.” Newsweek is equally “impressed” with Daley’s performance, saying “Daley also leaves behind a glittering metropolis that Chicagoans rightly love and outsiders can only envy.”

    Chicago’s 200,000 person loss shows Mayor Daley’s failed legacy as Mayor. Daley leaves office with a smaller population than when he took office in 1989. Numbers are stubborn things. There was no Chicago comeback of the middle class to experience bad public schools, high taxes, and corruption.  Almost no one predicted Philadelphia would gain population while Chicago declined. Mayor Daley’s legacy appears to be built on smoke and mirrors. A fawning media of urban reporters puffed up Daley for years. According to the numbers, Mayor Daley is America’s worst Mayor leaving Rahm Emanuel with intractable problems. Is it more accurate to call Mayor Daley the white man’s Coleman Young?