Blog

  • The Evolving Urban Form: The Valley of Mexico

    The last 60 years of urban growth in the Mexico City area should dispel any belief that suburban dispersion is principally an American phenomenon or even limited to the high income world. Over the last 60 years, all of the population growth in what is now called the Valley of Mexico metropolitan area and urban area has occurred outside the urban core (See Map). In this regard, the declining population in Mexico City urban core mirrors that of other urban cores, such as the city of Chicago, the city of Copenhagen, the city of Paris and nearly all other urban cores in the high income world.


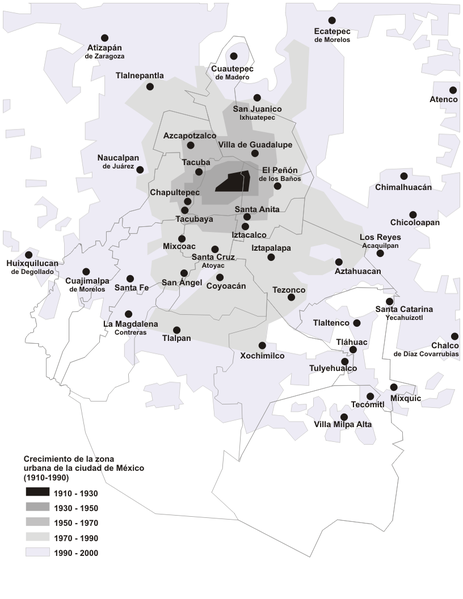
    Map: Valley of Mexico Urban Area: Northernmost Urbanization Excluded

    A New Name: the Mexico City metropolitan area is one of only two out of the world’s more than 25 megacities (10 million or more population) that has adopted a name more reflective of geographical reality, shedding reference to the urban core, which is declining in influence virtually everywhere. The other name-changing metropolitan area is Jakarta where the name Jabotabek is an acronym composed of the beginning of four large municipality names.  Mexico’s national statistics bureau, the Instituto Nacional de Estadística y Geografía (INEGI) has designated the Mexico City metropolitan area as the "Zona Metropolitana del Valle de México," which translates to the Valley of Mexico metropolitan area.

    According to the broadest definition, the Valley of Mexico metropolitan area had a population of 21.4 million according to the 2010 census. The Valley of Mexico joins a lengthening list of metropolitan areas with more than 20 million people. No reliable world ranking of metropolitan areas is feasible, because of varying definitions by nations and other population estimating sources (Note: Metropolitan Ranking). It can be said with assurance that the world’s largest metropolitan area is Tokyo – Yokohama, with approximately 40 million people and perhaps even that Jabotabek ranks second at nearly 30 million people. Other metropolitan areas making legitimate claims to having more than 20 million people include Seoul, Sao Paulo, Mumbai, Delhi, Manila and New York (Note: New York).

    The Valley of Mexico Urban Area

    In the early 1980s, the Valley of Mexico was expected to become the world’s largest urban area. A number of factors worked to keep that from happening, such as a falling birthrate and the devastating earthquake of 1985, which slowed growth and the simple problems created by the unmanageable scale of the region. This led to greater decentralization both to peripheral parts of the Valley of Mexico as well to other Mexican states.   

    In 2010, the Valley of Mexico urban area had a population of 19.4 million people. The urban area is estimated to cover 780 square miles (2,020 square kilometers), for a population density of 25,000 per square mile (9,700 per square kilometer). This makes the Valley of Mexico urban area approximately one-fourth the density of Dhaka (Bangladesh), the densest urban area in the world and similar in density to the Cairo urban area. The Valley of Mexico is less than three times as dense as the Paris urban area and less than four times the density of North America’s most dense urban areas, Los Angeles and Toronto. The next edition of Demographia World Urban Areas: Population & Projections (current edition) will show the Valley of Mexico to be the world’s ninth largest urban area.  

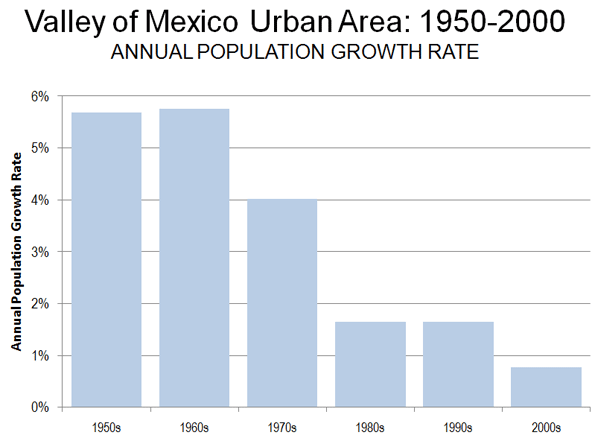
    The key issue here is a population growth rate that has plummeted since 1950. In the 1950s and the 1960s, the Valley’s population growth exceeded 5.5% annually. The rate fell to 4.0% during the 1970s, and dropped to 1.6% in the 1980s and 1990s. By the 2000s, the annual population growth rate had fallen to 0.8% (Figure 1).

    Urban Core: Former Mexico City:  In 1950, the core “delegations” constituted Mexico City – Cuahtemoc, Miguel Higalgo, Venustiano Carranza and Benito Juarez had 2.23 million people out of the urban area’s 2.88 million. Mexico City covered a land area of 54 square miles (139 square kilometers). In 1970 the population rose to a peak of 2.85 million with a peak population density of 53,000 persons per square mile (20,500 per square kilometer). At this point a severe population decline began, with a drop of more than 1.1 million people to 1.68 million by 2005. This represented a 41 percent drop in population density, two 31,000 persons per square mile (12,000 persons per square kilometer). A modest increase to 1.73 million people occurred between 2005 and 2000 in the urban core.

    In 1950, the urban core accounted for 78 percent of the urban area population. By 2010 this figure had fallen to under nine percent (Figure 2).


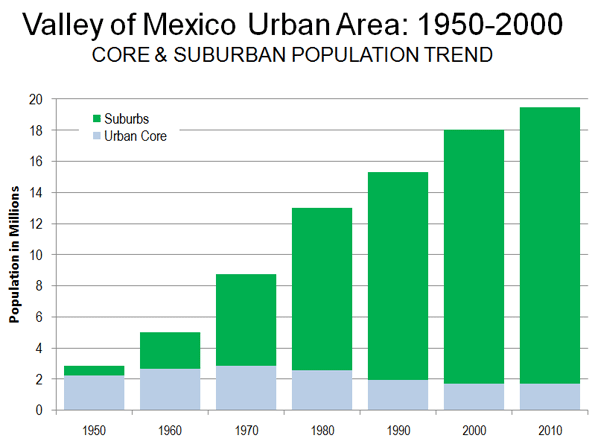
    The Suburbs: As of the 2010 census, more than 90 percent of the urban area population lives in what has historically been the suburbs.  Since 1950, the urban core has lost 500,000 residents; while suburban areas have added more than 17 million. Thus, the suburbs have accounted for more than 100 percent of the growth in the urban area over the past 60 years (Figure 1). During the 1950s, the suburbs accounted for more than 80 percent of the growth and in each decade since that time the suburbs have been 95 percent or more of the growth.

    In the earlier decades, the suburbs inside the Distrito Federal (but still outside the urban core) accounted for most of the growth, 93 percent during the 1950s and 53 percent during the 1960s. However from the 1970s to the present the growth has shifted to the more distant suburbs outside the Distrito Federal. These suburbs have captured at least 70 percent of the growth, including between 80 percent to 90 percent over the past two decades.

    Valley of Mexico Metropolitan Area

    The trend of continuing dispersion is evident in the metropolitan area trends. As defined in 2005, the Valley of Mexico metropolitan area included the 16 "delegations" (boroughs) of Mexico City (the Distrito Federal), and 60 municipalities (municipios), 59 of which are in the adjacent state of Mexico and the last of which is in the more northerly state of Hidalgo. In the late 2000s, another 28 municipalities in the state of Hidalgo were proposed for addition to the metropolitan area (and are included in this analysis).

    The metropolitan area is divided into five parts, the urban core (pre-1994 Mexico City), the urban balance of the Distrito Federal, inner ring municipalities, which are adjacent to the Distrito Federal, the outer municipalities before the proposed expansion and the 28 municipalities in the state of Hidalgo.

    Between 2000 and 2010, the urban core of the former Mexico City added 38,000 people or two percent to its population but accounted for only two percent of total metropolitan area population growth. Thus, during the 2000s, suburbs (areas in the urban area outside the urban core) gained 98 percent of the population growth (Figure 3).

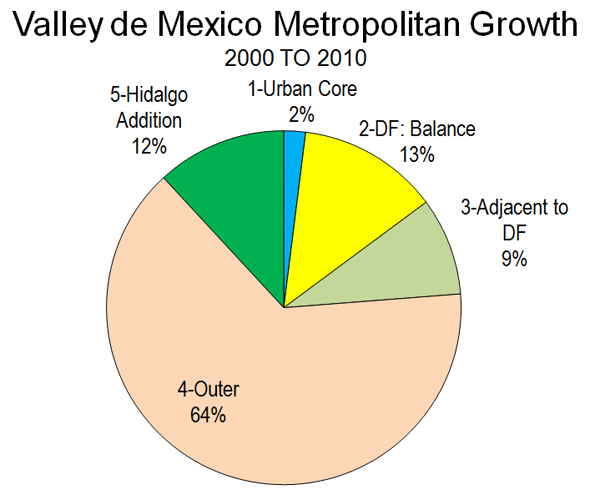
    The vast majority of the growth took place either in the outer delegations – some 12 percent of growth –while the inner suburbs of the state of Mexico captured 9 percent of the growth. The "lion’s share" of the growth was in the outer suburbs of the states of Mexico and Hidalgo, at more than 75 percent.

    Clearly, the Valley of Mexico metropolitan area is prime example of the suburbanization and reduced urban densities that have occurred virtually around the world.

    Valley del Mexico Population: 2000 to 2010
    Geographical Sector 2000 2010 Increase Rate Share
    Urban Core (Former Mexico City) 1.692 1.730 0.038 2% 2%
    Balance of Distrito Federal 6.913 7.143 0.230 3% 13%
    Distrito Federal 8.605 8.873 0.268 3% 15%
    Inner Muncipalities 6.061 6.232 0.171 3% 10%
    Outer Municipalities 3.730 5.032 1.302 35% 75%
    Hidalgo Expansion 0.993 1.240 0.248 25% 14%
    Total 19.390 21.378 1.740 9% 100%
    In millions

    ——

    Note: New York: according to US Census Bureau estimates from 2009, the New York metropolitan area had slightly less than 20 million people. However the Combined Statistical area (which includes the Connecticut suburbs) had a population of 22 million people. Because metropolitan areas are labor market areas, the extent of their transport systems is an important factor in delineation. In the case of New York, the extent of the highway and transit systems is sufficient to suggest the combined statistical area as more appropriate for international comparisons.

    Note: Metropolitan Area Ranking: There is only one known research effort to consistently define and rank the world’s metropolitan areas. Richard L. Forstall (who ran the Rand McNally "Ranally" international metropolitan area program), Richard P. Green and James B. Pick, produced that list, which was limited to the top 15 in the world. This small number, in relation to more than 750 metropolitan areas in the world with more than 500,000 people illustrates both the difficulty of obtaining sufficient data and the complexity of the research.

    Note: Pachuca de Sota: the entire urban area is within the Valley of Mexico metropolitan area.

    Photo:  Cathedral, Mexico City (by author)

    Wendell Cox is a Visiting Professor, Conservatoire National des Arts et Metiers, Paris and the author of “War on the Dream: How Anti-Sprawl Policy Threatens the Quality of Life

  • Chicago, Portland: Employment Dispersion from Downtown Continues

    New data shows that the downtown areas of both Chicago and Portland (Oregon) are modestly dispersing and losing market share in relation to metropolitan area employment.

    Chicago: The Chicago Loop Alliance reports that private sector employment in the Loop, the core of the Chicago downtown area, fell from 338,000 to 275,000 between 2000 and 2010. An additional 30,000 government workers are employed in the Loop, however 2000 data was not provided for the government sector. As a result of the loss, the Loop private sector share of total Chicago metropolitan area employment fell 13 percent, from 7.7 percent in 2000 to 6.7 percent in 2010.

    The larger downtown area, including areas to the north (North Michigan Avenue area) and to the south had total private sector employment of 480,000. Chicago had the second largest downtown (central business district) in the nation in 2000, with an employment density of more than 160,000 per square mile and a transit work trip market share of 55 percent, trailing only the Manhattan business district (south of 59 Street) and the Brooklyn central business district).

    Portland: The Portland Business Alliance reported that downtown Portland employment had fallen from 86,800 in 2001 to 83,400 in 2009. This represents a four percent market share loss in comparison to the metropolitan area over the period. All of Portland’s growth over the period has been in suburban Clark and Skamania counties in Washington, which added 12,700 jobs, while the Oregon portion of the metropolitan area was losing 4,500 jobs.

    In 2000, Portland had the nation’s 22nd largest central business district, and the 12th highest transit work trip market share, at 30 percent (Brooklyn included).

  • High-Speed Rail vs. Modal Neutrality

    Isn’t it curious that an Administration devoted to the principle of multi-modalism is so obsessively determined to promote a single mode of its own preference — that of high-speed rail? All three governors who rejected the federal HSR grants — Govs. Walker, Kasich and Scott — told Sec. LaHood that their states could badly use that money for more urgent needs of fixing roads, bridges and transit systems and, in the case of Gov. Scott, rebuilding Florida’s ports in anticipation of the Panama Canal expansion.

    Yet Sec. LaHood turned a deaf ear to those requests, insisting that the stimulus money must be spent on high-speed rail — even though money spent on other modes could have been just as effective in creating jobs. After justly condemning “stove pipe” mentality and modal biases in federal decision making it is ironic to find the Administration ignoring its own principles of modal neutrality in such a blatant manner.

  • Can Common Sense, and maybe Mickey, Save Orlando’s Transit Mess?

    The week’s debate about high-speed rail has once again polarized our populace, inflamed irrationality, and sent everyone back to their familiar corners.  Little constructive debate is possible when major newspapers are flailing the governor for rejecting money and the seemingly global revolutionary fervor is gripping local citizens who rallied in protest Wednesday night around downtown Orlando’s Lake Eola.  None of this will do any good for the service workers trying to get to their jobs in the theme parks or for downtown cube dwellers streaming to scattered office parks. With or without light rail the city inches closer and closer to the traffic hell of Atlanta, or worse even, DC. After all, both cities already have large rail transit systems.

    What will do some good is a creative discussion of some real change that can occur to improve our commute.

    We must recognize that we are stuck with our cars.  They aren’t going away.  We can’t wish them away. We have to make them better fast, because with changes blowin’ in the wind and with oil jumping back up over $100 a barrel.

    The high-speed bullet train – a sort of latter-day interstate highway program – sounded like a great idea at first, a welcome alternative to the ardor of air travel and the gas-sucking monotony of driving.  It has shortcomings, however, it will likely prove obscenely expensive, and once one gets to the destination, one is typically relegated to more driving.

    Nor is this some form of effective industrial policy.  The things will be built overseas – Germany, Japan or most likely China –  a great jobs program for someone else.  And tourists, who vastly prefer the freedom of car rental and driving, aren’t likely to use it except as a novelty for one of their visits to our wonderful place.  Perhaps the bitterest part of the bullet train pill: it will indebt our children and grandchildren to pay off landowners giving up their land in eminent domain – which produces nothing – and the cost of complex machines made overseas. The bullet train ends up being a clumsy solution imposed from above, rather than a grassroots solution to our real problems. 

    Any frequent driver on Interstate 4 between Orlando and Tampa can tell you there are four basic kinds of traffic: tourists in buses or cars; freight, in the form of tractor-trailers: business travelers (who need the flexibility of a car on the other end): and personal travelers.  Instead of targeting an expensive solution at just the smallest form of traffic, personal travel, a 4-part solution is suggested, all of which would add up to far less than $2 billion that minimally the high-speed line would have cost.

    1.  Trains can be good – for freight.  There are already freight lines running between Tampa and Orlando.  Getting the freight off of tractor-trailers and onto these freight lines, where it is vastly cheaper to move goods, should be a no-brainer for the state.  Use some of the DOT money to modernize freight depots along the pathway, incentivize freight customers to move their goods onto trains, and this will vastly improve the situation.
    2. Tourists can drive – at a price.  Our state should be treat itself with higher regard and also encourage a culture of sustainability for those visiting us.  Higher taxes on rental cars should be charged, and the taxes placed in an environmental fund to remove some of the unsightly development that has defaced our region, and return it to the special place it once was.
    3. Give business travelers an alternative.  If there were an affordable air shuttle between Tampa and Orlando, at the right price it would be full.  Little Embraers (made in Melbourne, by the way) taking off from FBOs at Orlando Executive Airport, Sanford Airport, and Orlando International Airport and landing in Tampa airfields would be worth $100 a seat, if the time/cost tradeoff were analyzed.  Ybor City for lunch, anyone?
    4. Give personal drivers an alternative.  For the cost of less than 50 miles of new road, a totally independent alternative to I-4 is waiting out there.  The first link of this road would connect Tampa’s Crosstown Express to Lakeland’s Western Beltway.  The next link of this road would connect the Western Beltway to the Greenway at Celebration.   Drivers will be able to go from downtown Tampa to downtown Orlando without their wheels touching I-4 even once.  Nice.

    And now, for the big one.  Right smack in the middle of the white-hot I-4 corridor lays a large, private entity, Disney, has been operating a private, train-based mass transit system for the last 40 years.  High labor costs?  Yes.  Fossil fuel driven?  Yes.  This entity has been strangely silent over the entire debate.

    If this entity were to wake up and seize the opportunity before it, one might see a true train that works.  First of all, the monorail was planned with some sense: it connects dense areas together.   If Disney were to offer to build, as a private development, extensions of its monorail reaching out to Tampa on one side and Orlando on the other, the air rights for this system could be along government-owned I-4 (no imminent domain costs).  This entity is also highly encouraged to charge market rate and to make a profitable venture out of operating this system. And the taxpayers would not be stuck with the bill.

    A vision for transit between Tampa and Orlando needs to be truly holistic, taking into account all types of traffic connecting the two regions.  This vision also needs to be locally driven, taking advantage of local strengths and assets already in place.  The high speed bullet train does none of this.  Instead, a multi-faceted solution that provides flexibility at both ends, leverages our current strengths, and partners with the strongest player in the region has a chance of truly making a difference in the present tense and likely future budget climate  This is what sustainability is truly about, and is what our future generations deserve.

    Richard Reep is an Architect and artist living in Winter Park, Florida. His practice has centered around hospitality-driven mixed use, and has contributed in various capacities to urban mixed-use projects, both nationally and internationally, for the last 25 years.

    Photo by Joe Penniston

  • Las Vegas, Birmingham & Salt Lake City Show Continuing Dispersion to Suburbs

    Census data released in the last week indicates confirms the continuing dispersion of population away from the historical core municipalities (central cities) to the suburbs in the 2000 to 2010 decade. The new figures, for Las Vegas, Birmingham and Salt Lake City indicate that a majority of growth occurred in the suburbs in each metropolitan area and that the dispersion of population to the suburbs was greater in the 2000s in each case than in the 1990s.

    Las Vegas: The Las Vegas metropolitan area continued to grow strongly, adding 41 percent to its population between 2000 and 2010. This, however, represents a more than halving of the growth rate from the 1990s (86 percent). The metropolitan area population in 2010 was 1,951,000, up from 1,376,000 in 2000.

    The core municipality of Las Vegas of grew 22 percent between 2000 and 2010 (from 478,000 to 584,000). The core city of Las Vegas has an overwhelming suburban urban form, having experienced virtually all of its growth in the modern, car oriented era of suburbanization. During the 2000s, the land area of Las Vegas was expanded from 113 square miles to 131.

    The suburbs grew 52 percent between 2000 and 2010. The suburbs attracted 82 percent of the metropolitan population growth, up from 65 percent in the 1990s. The suburbs now account for 70 percent of the Las Vegas metropolitan area population.

    Birmingham: The Birmingham metropolitan area experienced a decline in growth rate from 10 percent in the 1990s to seven percent in the 2000s. The population increased from 1,052,000 to 1,128,000.

    The historical core municipality of Birmingham declined eight percent, from 243,000 to 212,000. This loss of 13 percent is the largest yet recorded for a historical core municipality in a major metropolitan area. Birmingham’s population peaked at 341,000 in 1960. This loss of more than one-third in population between 1960 and 2010 is despite annexations that doubled the size of the city (from 75 to 150 square miles).

    The suburbs gained 13 percent between 2000 and 2010 and captured 140 percent of the metropolitan area’s growth (up from 124 percent in the 1990s). The suburbs now account for 81 percent of the metropolitan population.

    Salt Lake City: In the Salt Lake City metropolitan area growth declined to 16 percent in the 2000s from 26 percent in the 1990s. The population rose from 969,000 to 1,124,000.

    The historical core municipality of Salt Lake City grew three percent (from 182,000 to 186,000). Salt Lake City reached its population peak at 189,000 in 1960. This modest loss occurred while the land area of the city nearly doubled (from 56 square miles to 109).

    The suburbs gained 19 percent between 2000 and 2010. The suburbs attracted 97 percent of the metropolitan population growth, which is up from 89 percent in the 1990s.

  • Sputnik Moments, Spending Cuts, and (Remember These?) Jobs

    The stand-off in Washington over spending reductions has pushed aside serious discussion about a far more pressing issue:  job creation.

    Granted, the country is long overdue for action on spending cuts. There is much that our government does that we can live without. Bureaucracies’ programmatic lassitude and congressional appropriators’ adolescent-like lack of discipline have contributed to our nation’s fiscal imbalance.

    To be sure, the federal deficit is heading into a crisis zone the likes of which the United States has never seen, and a fairly dramatic policy response is needed to fix it. But one overlooked way to improve the fiscal picture would be to spark economic growth. This is precisely what worked well in the 1990s, something for which both a Republican Congress and Democratic President could legitimately claim credit.

    But the focus on jobs and economic growth has been lost.

    Democratic leadership chooses to focus on a narrow, government-driven idea of job growth, deluding themselves – against the huge weight of evidence – that government can lead the job growth agenda through stimulus. Republicans have made spending cuts the backbone of their jobs growth strategy, and they have embarked on a campaign to convince voters that if we cut enough spending, investor confidence will return, employers will hire more people, and jobs will return.

    President Obama’s Sputnik moment was truly the stuff of science fiction, or at least the Truman Show, in which we all drive our Priuses from our homes to the train station down the street on our way to work or the gym in a carefully planned world that will – voila! – create millions of jobs.  Republicans, for their part, have been primarily focused on non-defense discretionary spending – that part of the federal budget that accounts for only a little more than a third of all spending and which, if you removed all of it, would still leave the entitlement programs intact that add most to our debt and deficit. After the work of the scalpel is done, Republican theory goes, enough space will be cleared up in the economy for Adam Smith’s invisible hand to start generating jobs in an Austrian school-like spontaneous order, which will generate jobs…and so on.

    Now, to their credit, Republicans have begun talking more seriously about introducing entitlement reforms this year that would address the more serious deficit issues. Given the bipartisan nature of President Obama’s debt commission, the plan should get the support of at least some Democratic members, even if the President and Democratic congressional leadership shove it aside.

    But however much GOP congressional leaders might be wising up on addressing the deficit through fiscal restraint, they are AWOL on addressing it through job creation and growth, without which deficit reduction is much, much more painful.

    Voters know this at some level. In a poll of self-identified conservative Republicans at ConservativeHome.com, a site I edit, respondents are eager to see deep spending cuts, but they also give Republican lawmakers low marks on job creation and economic growth. In a poll we conducted last week, nearly half (49 percent) of respondents said they thought Republicans had been doing a good job of pushing for spending reductions, but 69 percent said Republicans were not doing a good job of explaining what they were doing to create jobs. The party of growth and opportunity has not even convinced its most ardent supporters what it is doing on the economy.

    Meanwhile, Gallup’s numbers this past week painted a troubling picture amidst slightly good news. While their survey showed an unemployment drop from 10.9 percent to 9.8 percent in the past year, this came mostly from gains among the most and least educated. Middle America remains pretty much stuck where it was. And then, as if to pour salt in a wound, Gallup released numbers three days later showing deterioration in jobs numbers in February compared to January.

    We can’t keep going on pretending stimulus, on the one hand, and spending cuts, on the other, are a viable economic growth strategy. There needs to be a realistic plan put forward and the party whose candidate figures this out will win the White House in 2012.

    The plan should consist of at least the following:

    First, tax reform. The President’s debt commission put forward some really good ideas. The best idea winning the most bipartisan support is reforming the corporate tax code. Rather than being a giveaway to big business, lowering America’s ridiculously high rate is the most proven way to create jobs. The OECD, not some right wing group, has concluded this after studying the issue across a number of countries. Also, simplifying the tax code by getting rid of costly deductions would help.

    Second, make it clear what being too big to fail means so investors will know, and start putting more capital into businesses that will create jobs. Luigi Zingales at the University of Chicago has a good idea about clarifying the current financial reform bill along these lines.

    Third, make energy the central component of a growth strategy. The U.S. has the capacity to become a net exporter of natural gas and to re-start a generation of nuclear power production that would make us less dependent on nonrenewable energy. We would also be greener in terms of carbon emission and would create jobs.

    Fourth, build more roads. Forget about those train tracks. We should be scraping together every unused stimulus dollar and wasteful penny of DOT funding to add lanes of highway to our most congested areas. Facilitating commerce and reducing lost revenue due to traffic congestion will also have the benefit of creating needed jobs.

    This would be a start. Whether anyone will take up the challenge is another issue.

    Ryan Streeter is Editor of www.ConservativeHome.com.

    Official White House photo by Pete Souza.

  • The State of Silicon Valley

    Every year, the top officials, policy wonks, and business managers convene at the annual State of the Valley conference to discuss and debate the health of the region. Over a thousand attendees trekked to San Jose, Calif., on Feb. 18 for the release of this year’s report. Published since 1995 by Joint Venture Silicon Valley Network and distributed for free, the new 2011 Index of Silicon Valley reported bleak indicators and a gloomy outlook.

    The event provided Valley insiders a moment to reflect on the economic storm, and the mood was darkly optimistic. A persistent phrase tossed out was the “new normal,” old Wall Street jargon describing a repressed economic environment. Growth is too slow to bring down the unemployment rate, and government intervenes to save a struggling private sector.

    Tally of the Valley

    Certainly Silicon Valley has had its share of troubles suffering from poor state finances and severe global competition. Unemployment has hit nearly 10 percent, higher than when the recession started. The region’s population of three million, comprised of Santa Clara and San Mateo Counties, has continued to drop as talent leaves for opportunity in cheaper pastures. Foreign immigration, considered a critical factor in the region’s entrepreneurship, dropped by 40 percent to its lowest level in the last decade since 2009 and stayed flat through 2010.

    Adding to the woe, Silicon Valley towns are facing budget shortfalls and downsizing their public services. San Jose faces a 10th straight year of red ink, adding up to a gap of $110 million in the next fiscal year. Caltrain plans to close up to 16 stations to survive a record $30.3 million deficit – about one-third of the commuter rail’s operating budget.

    Education has also taken a big hit. The California college system is wheezing from tremendous budget cuts, calculated at $1.4 billion across the state, which hit all three levels of tertiary education. Foothill-De Anza Community College, one of the largest community college districts in the U.S., confronts roughly $10.9 million in cuts on top of drastic budget slashes from previous years.

    Further, the local housing market remains stagnant, and 2010 marked, due in part to a tough regulatory environment, the third consecutive year that Silicon Valley was the least affordable California region for first-time home buyers.

    In the Eye of the Beholder

    It’s a dismal state of affairs if you ask the local old guard. Judy Estrin, former chief technology officer of Cisco Systems, grumbled that one problem was outsourcing. Too many startups were adopting the practice in her view, and she told the audience, “Don’t automatically go to China.”

    Others were concerned that jobs were being shipped simply to towns east across the bay. Much ballyhooed and well-subsidized sectors, such as cleantech, would not produce enough jobs to be economically meaningful in the recovery. Attendees were fearful that the Valley has lost its edge.

    If those who know Silicon Valley best are somewhat pessimistic, the Valley looks golden for many looking from the outside. The day before the conference, President Obama sought money and advice from the Valley’s tech elite, including Steve Jobs of Apple and Mark Zuckerberg of Facebook. Obama’s agenda was to push innovation, and aside from escaping the U.S. capital now and then, it is tellingly that he turned first to Silicon Valley.

    The Valley has also inspired other city governments. New York City – which once boasted its own “Silicon Alley” was winning over the Valley’s decidedly suburban model – recently asked Stanford University to help train its urban talent. As one local reporter put it gleefully, New York is “hoping to replicate our Apple in The Big Apple”.

    Although financial analysts once considered Apple washed up as a stock less than 10 years ago, the technology company is now lauded for transforming the mobile and entertainment industry and turning Silicon Valley into a mobile mecca. Goaded by Apple, mobile manufacturing giant Sony Ericsson is shifting all its product development from Sweden to Silicon Valley. Nokia, the world’s largest mobile phone maker, is also reportedly considering plans to relocate its executives to the Valley.

    Growing Regional Value, Not Growth

    The prevailing question remains: how will Silicon Valley sustain its lead in innovation. For some the response is to either raise taxes or cut public services as a matter of survival. At the State of the Valley conference, the overriding call to action was to unite 110 local governments through centralized regional leadership. However, the notion of a regional governing body had been introduced before in the 1990s and failed instantly in California state legislation.

    So what might the future hold? Last year’s report card aside, financial analysts are cheery about the Valley’s prospects. Silicon Valley Bank’s Financial Group reports that technology spending is expected to grow by more than five percent in 2011. The majority of their clients finished 2010 in better financial shape than the prior year, and median revenues for all early and growth stage technology clients grew 50 percent from the year before.

    The IPO market has woken from its slumber. Seven tech IPOs have already occurred this year, raising $700 million in total, with an average return of 26.5%, according to research firm Renaissance Capital. Even the international press is writing about the next boom being led by Silicon Valley.

    For all the money being generated, Silicon Valley is not producing more jobs in the local economy. Many startups look to Facebook as a leader in the social media space. Its user base of 600 million has generated a massive population that dwarfs that of the U.S. Yet the company has only about 2000 employees. Facebook presents a conundrum. Is it an innovative global leader that has mastered the art of efficient scaling that is the beginning of a new era in Silicon Valley, or has Facebook become the antithesis of economic growth for the U.S. administration?

    Similar to Facebook, Apple is also spurning growth – at least as defined by the conventional measure of new jobs. The company has redefined the tech industry by creating new technologies and new solutions, but not necessarily creating new growth for the region directly. While Apple employs just 30,000 people, the subcontractor that actually assembles its products employs over a million workers, all in China. Developers for Apple’s software applications and hardware accessories are scattered around the world. Instead, Apple has fostered an ecosystem whose heart resides in Silicon Valley.

    Silicon Valley is changing perceptions and practices once again. Like the proverbial cat with nine lives, Silicon Valley has at least several more transformations ahead.

    Tamara Carleton, Ph.D., is a Fellow at the Foundation for Enterprise Development. Her research studies the organizational processes and structures that enable radical technological innovation.

  • What The Census Tells Us About America’s Future

    With the release of results for over 20 states, the 2010 Census has provided some strong indicators as to the real evolution of the country’s demography. In short, they reveal that Americans are continuing to disperse, becoming more ethnically diverse and leaning toward to what might be called “opportunity” regions.

    Below is a summary of the most significant findings to date, followed by an assessment of what this all might mean for the coming decade.

    Point One: America is becoming more suburban.

    For much of the past decade, there has been a constant media drumbeat about the “return to the cities.” Urban real estate interests, environmentalists and planners have widely promoted this idea, and it has been central to the ideology of the Obama administration, the most big-city dominated in at least a half century. “We’ve reached the limits of suburban development,” Housing Secretary Shaun Donovan opined last February, “People are beginning to vote with their feet and come back to the central cities.”

    Donavan and others cite such things as the energy price spike in the mid-aughts as well as the mortgage crisis as contributing to the “back to the city” trend. Yet in reality the actual numbers suggest that Donavan and his cronies may need a serious reality check. The Census reveals that, contrary to the “back to the city” rhetoric, suburban growth continues to dominate in most regions of the country, constituting between 80% and 100% of all growth in all but three of the 16 metropolitan areas reporting.

    This includes sprawling regions like Houston, “smart growth areas like Seattle and Portland  (where suburbs accounted for more than 80% of all growth over the decade) and Midwestern regions like St. Louis, which like Chicago saw a sharp decline in the urban population. The only exceptions have been Oklahoma City, Austin or San Antonio, with vast expanses still allowing for much of new development to take place within the city limits.

    To be sure, no one should pretend that urban fortunes have sunk to their 1970s nadir. Yet overall, central cities, which accounted for a 11% of metropolitan growth in the 1990s, constituted barely 4% of the growth in the last decade.  Some core cities, notably Chicago, have shrunk after making gains in the ’90s. Indeed Chicago — the president’s adopted hometown and the poster child of the urban “comeback” — took what analyst Aaron Renn humorously dubbed “a Census shellacking,” losing some 200,000 people, while the outer suburban ring continued to grow and diversify their populations. The Windy City’s population is now down to the lowest level since the 1910 Census.

    Point Two: America is becoming more diverse, and the diversity is spreading.

    The racial reordering of America is proceeding apace. Nowhere is this more clear than in Texas, where Hispanic and Asian populations have driven much of the state’s demographic growth. Latinos alone now account for roughly 38% of all Texans. Immigration rates in Dallas and Houston  are now higher than for Chicago, Washington, Seattle and Atlanta. Texas, notes long-time observer Candace Evans, is becoming the country’s premier laboratory for promoting a successful diversity.

    There are other major shifts in ethnic demographics. For one thing, minorities continue to head to the suburban rings around most major cities. African-Americans and even Latinos may be fleeing places like Chicago, but they continue to move in large numbers to suburban locales in surrounding Illinois counties. , especially south of the city.  Others appear to  have headed to places like the traditional black-opportunity magnet of Atlanta and or other southern hubs, such as Nashville.

    Another trend appears to be the migration of ethnic minorities to areas that, in the past, have been primarily white. This is clear in the thriving Indianapolis area, where the African-American population grew by 28% and the Hispanic population by 161%, or some 56,000 souls.   Look for more minority growth in such areas which have the advantage of affordable housing, robust economies and better than average job growth.

    3. The Shift to “Opportunity Regions”

    As the economy slid in the last years of the decade, population growth slowed, particularly in some Sun Belt states, such as Florida and Nevada, that thrived during the bubble. In contrast newcomers flocked to places, notably in the Texas cities, that offered better prospects. Austin, San Antonio, Houston and Dallas-Ft. Worth regions all grew by 20% or more over the decade.

    The key here seems to be affordability and jobs. As economist Mark Sharpe has illustrated, Texas private sector job growth last year was 2.7%, compared with 1% nationally. Unfortunately, unemployment remains over 8%, since of this growth was absorbed by newcomers. In contrast, places with the slowest, or negative growth, tend also to be losing jobs. For example, although the residential population of Chicago’s loop tripled in the past decade to 20,000,the famed business district lost almost 65,000 jobs.

    But it’s not just Sun Belt cities that are gaining on places like Chicago.  Indianapolis has emerged as a different kind of “opportunity region.” It lacks the dynamism and diversity of the Texas cities, but it has continued to attract people from all over the country, including the surrounding rural or old Rust Belt parts of the state. Overall the Indianapolis region grew nearly 15% over the decade, roughly 50% higher than the national average, as much as Portland and more than Seattle.

    In contrast, growth seems to be slowing in some formerly hot areas. Population increases for Seattle, Portland and Denver were around 14%,  about half the rate of the previous decade. Part of this may have to do with high unemployment, particularly in Oregon, and high housing prices. Still, these three areas continue to grow much faster than regions such as Chicago, St. Louis or Baltimore where growth struggled in the single digits

    Possible Long-term Implications

    These shifts suggest that the Obama administration might want to rethink its high-density and urban-oriented strategy. Despite all the media focus on an imagined “back to the city” movement, Americans continue to disperse to “opportunity regions” and toward the suburbs. As a result, expect generally conservative-leaning suburbs and exurbs to gain more power after reapportionment and core city influence to decline further.

    Yet the Census numbers also have some unsettling aspects for Republicans. The increasing minority population even in heartland states such as Indiana, not to mention Texas, could undermine GOP gains, particularly if the party listens to its strong nativist wing. Diversification in the suburbs could ultimately turn some of these areas to the center or even left.

    The new American generation arising in the census will be increasingly diverse. A growing portion will consist of the children of immigrants, and they will be predominately English-speaking.  This suggests a more active and engaged minority population, perhaps susceptible to a pro-growth GOP message and the economy of “opportunity regions” but likely hostile to overtly anti-immigrants posturing.

    Whatever your politics or economic interests, the Census suggests that the country is changing in dramatic way– if not always in the ways often predicted by pundits, planners or the media. It usually makes more sense  to study  the actual numbers, than follow the wishful thinking of largely urban-centric, big-city-based and often quite biased analysts.

    This piece originally appeared at Forbes.com

    Joel Kotkin is executive editor of NewGeography.com and is a distinguished presidential fellow in urban futures at Chapman University, and an adjunct fellow of the Legatum Institute in London. He is author of The City: A Global History. His newest book is The Next Hundred Million: America in 2050, released in February, 2010.

    Indianapolis Photo by IndySawmill

  • Census 2010: A Texas Perspective

    If you want to get a glimpse of the future of the U.S., check out Fort Worth, TX. Never mind the cowboy boots, but you might want to practice your Spanish.

    Texas is growing explosively and much of that growth is among Latinos.   The latest Census Bureau figures show the Lone Star State grew by 20%, to over 25 million people, recording about a quarter of the nation’s overall growth. The rate of growth was twice the national average. The implications are huge politically, as Texas stands to gain 4 new Congressional seats from this expansion, and Hispanic leaders want in.

    A majority of the Hispanic growth came from births to families already living here. While migration from other states and countries contributed about 45%.  

    The Texas story stands in contrast to the Rust Belt states and the Northeast, where overall growth is minimal.   Texas’s Hispanic-fueled growth spurt out-paced the entire countries, helped brace our housing market and our economy.

    A close look at Texas growth reveals much about   American’s home-buying habits. Rural areas got smaller – few want to live in the boonies of far west Texas while it appears suburban areas won over the most transplants.

    But arguably the biggest winner was Ft. Worth, or Cow Town as we call it. Fort Worth grew by a whopping 38.6%, the largest increase in the state, followed by Laredo’s 33%, Austin at 20.4%, and San Antonio at 16%. In contrast the city of Dallas, my home, grew by a scant .8% – a bit deflating to a city all puffed up about a $354 million arts center, a downtown park and greenway, and the $185 million Perot Museum of Nature & Science underway.

    Houston remains the state’s largest metropolitan area but sustained growth of only 7.5%, though Harris County – mostly due to growth in the suburbs – grew by 20%. As in Ft. Worth and elsewhere, Hispanics have been the driver, and now comprise 41% of the Harris County population. The biggest growth took place in formerly rural towns just outside the big cities, one-shop stop farmer’s crossings or granaries.  

    Curtis Tally shakes his head at how fast little Justin, north of Fort Worth, has grown. Subdivisions sprouted up on what was once farmland around his Justin Feed Co. in southern Denton County. From 1891 residents in 2000, Justin has 3,246 today.  

    "We were selling seed for pastures; now we’re selling seeds for lawns," Tally, 74, who has been in business in Justin since 1958, told the Fort Worth Star Telegram.

    If you think that’s amazing, wait ‘till you get to Fate, Texas, 25 minutes east of Dallas on Interstate 30. Ten years ago you would have missed Fate, a town of 500 so small the utility invoicing was done on postcards if you blinked while driving. Today, Fate is the fastest-growing town in the state, with 6,357 residents – an increase of 1,179%!  Residents who live there say it’s far enough away from Dallas to be in the country, but still close to the big city. Fate draws many first time homebuyers who are starting families (home prices range from $50,000 to $300,000) Here’s what Fate resident Tina Nelson told The Dallas Morning News:

    “My kids can go ride bikes all day long and I don’t have to worry too much about where they are,” said Tina. “It’s like the 1950s (here) the sun goes down and everyone’s porch light comes on.”

    On the western side of Lake Ray Hubbard, a few minutes from Fate and slightly closer to Dallas is Sunnyvale, another fast-growing little hick town where professionals are building $2 million dollar homes on a 124 acre family ranch turned into home sites called St James Park. They send their children to a two-year old, $50 million public school with the highest ratings in the state.

    The young man building homes on the 49 two acre estate sites is Jojy Koshy of Atrium Fine Homes. At 31, Jojy holds a masters in business from the University of Texas and tells me, with pride, how his parents immigrated to the Dallas suburb of Plano in 1986 from India.

    “My parents instilled a strong work ethic in us,” he says. “I know this market is challenging, but I believe that if I work longer, harder, and keep our clients completely satisfied, we will have a great business.”  

    It’s the same story across the state. The Interstate 35 corridor between Austin and San Antonio filled in with development as the cities merged closer to becoming one big schizophrenic metropolis. The string of counties along the Rio Grande, anchored by Brownsville and McAllen have been growing, and may be beneficiaries of the crime wave south of the border.   A sharp Dallas Realtor took out an ad in the Monterrey newspaper advertising homes for sale in Dallas and snagged several buyers. Even the wife of the Monterrey mayor moved to a Dallas suburb, escaping the cartel and seeking to be closer to her family here.

    Aside from escaping death in Mexico, what is driving people to Texas? Start with our rising star, Fort Worth. The city has both a cowboy pizzazz personality and a lower crime rate than Dallas. Fort Worth’s arts district has overshadowed Dallas’s for years, and the neighborhoods offer true community – places where the kids can still walk, not be bussed, to school. Rose Bowl winner Texas Christian University is on the upswing, downtown is charmingly vibrant, and an urban renaissance is taking hold on the city’s western edge called West 7th.   

    What are people seeking in Texas? I’d call it quality of life with room for upward mobility: affordable homes with mortgage payments that leave some money for recreation, good public schools for their kids and generally less onerous tax regime.

    Yet with our many gains, Texas faces great challenges. The state has the third-highest teenage pregnancy rate in the nation, which is actually an improvement from last year, when we were number two. There are a rising number of children are living in poverty in Texas. Many of these children may be anchor babies born to illegal immigrants who cross the border to ensure their children and ultimately, themselves, citizenship. In 2006, 70% of the women who gave birth at Dallas County’s Parkland Memorial Hospital were illegal immigrants.  

    Increasingly, Latinos, illegal or not, take those babies home to the suburbs. Texas suburbs are no longer lily-white.  This is true in working class places like Bedford, Texas, outside Fort Worth, where the black population has almost doubled. In affluent Southlake, the population this decade shifted from 95 percent Anglo down to 88 percent.   Looking for a great selection of Asian food? You’ll starve (or go broke) in downtown Dallas. Go north to Carrollton, Texas where you’ll find a 78,000 square foot Super H Mart in what was once a Mervyns department store. Inside you’ll find seven types of gray, fuzzy, Chinese long, acorn, spaghetti, butternut, and kombucha squash eight food stalls said to rival any of those found in Seoul and Singapore, two cities known for their gourmet street food. Manduguk, anyone?

    The new Texans are coming here not just to live, but to dig in economically.  

    In the end, we are seeing the birth of a Texas that is neither the white bread, big hair idyll of the cultural conservatives or the free market dystopia imagined by liberals. It is becoming more diverse, without losing its capitalist energy. With all its blemishes,  the emerging Texas may well become the model for how America evolves in the coming decades.

    Candy Evans is an independent journalist based in Dallas, Texas, She covers Texas for AOL’s HousingWatch and blogs at secondshelters.com.

    Photo by Rick

  • City of St. Louis Suffers Huge Population Loss

    According to just-released 2010 Census results, the city of St. Louis experienced an unexpected loss in population from 348,000 in 2000 to 319,000 in 2010. This was surprising since the latest population estimate was 357,000 (2009). The new population figure however provided exoneration for the Census Bureau, which had been challenged six separate times during the decade on its city of St. Louis population estimates. The higher 2009 population estimate was the cumulative effect of those six successful challenges. In fact however, without the challenges the city of St. Louis population would have been 311,000, much closer to the final count of 319,000 people.

    Among the world’s municipalities that have ever achieved 500,000 population non-have lost so much as the city of St. Louis. The new figure of 319,000 people is 63 percent below the 1950 Census peak of 857,000 people. Indeed, the 2010 population is nearly as low as the population in the 1870 census.

    Even so, the population loss of the last decade belies the progress that has been made in converting warehouse buildings, office buildings and other disused structures into urban residential areas, especially along Washington Avenue. These developments, among the largest in the United States, however, fell far short of preventing the population loss.

    The St. Louis Metropolitan area did much better. In 2010, the metropolitan area had a population of 2,813,000, up from 2,699,000 in 2000, a gain of four percent. The loss in the city was eight percent, while the suburbs gained six percent.