Blog

  • Hong Kong Response to High Housing Prices: Expand Land Supply

    Hong Kong financial chief John Tsang has promised to expand the city’s land supply for residential housing, "in response to rising public anger over soaring property prices and repeated warnings of a looming real estate bubble." Channel News Asia’s Hong Kong bureau indicated that the move was precipitated by the "sky-high" housing cost that have been drive by insufficient land for development and speculation (which routinely is intensified where demand for housing is permitted to outstrip supply.

    Buggle Lau, chief analyst at property firm Midland Holdings told Channel News Asia that he supported the expansion of the land supply "as a way to bring down house prices," adding "It’s simple economics – lower demand and higher supply will bring prices down." Channel News Asia noted that Hong Kong had been shown to be the most unaffordable metropolitan market in the recent (7th Annual) Demographia International Housing Affordability Survey.

  • New Metro GDP Data Released

    The Bureau of Economic Analysis yesterday released the 2009 data for metropolitan area GDP. Their headline, “Economic Decline Widespread in 2009,” should come as a surprise to no one.

    The BEA focuses on the year on year change. I’d rather look at the full span of the data that’s available, which is now 2001-2009. Here’s a look at percent change in total real metro area GDP during that time period:

    And here are the top ten metro areas over one million in population on this metric:

    Row Metro 2001 2009 Pct Change
    1 Portland-Vancouver-Hillsboro, OR-WA 81,505 114,028 39.90%
    2 Oklahoma City, OK 43,835 59,532 35.81%
    3 Austin-Round Rock-San Marcos, TX 55,466 75,136 35.46%
    4 Las Vegas-Paradise, NV 63,730 82,255 29.07%
    5 Orlando-Kissimmee-Sanford, FL 71,940 91,400 27.05%
    6 Phoenix-Mesa-Glendale, AZ 138,780 174,617 25.82%
    7 Washington-Arlington-Alexandria, DC-VA-MD-WV 294,656 368,793 25.16%
    8 San Jose-Sunnyvale-Santa Clara, CA 117,447 146,448 24.69%
    9 Salt Lake City, UT 48,157 59,603 23.77%
    10 San Diego-Carlsbad-San Marcos, CA 126,875 155,850 22.84%

    Per capita tells is a little bit different story. Here’s a map of US metro areas for percent change in real GDP per capita:

    The stunning collapse in real per capita GDP and also the erosion in per capita personal income relative to the nation is one of the key reasons I see Atlanta as a region with far more troubles than is generally assumed.

    Here are the top ten large metros again:

    Row Metro 2001 2009 Pct Change
    1 Portland-Vancouver-Hillsboro, OR-WA 41,256 50,863 23.29%
    2 Oklahoma City, OK 39,573 48,507 22.58%
    3 San Jose-Sunnyvale-Santa Clara, CA 67,299 79,604 18.28%
    4 San Diego-Carlsbad-San Marcos, CA 44,252 51,035 15.33%
    5 San Francisco-Oakland-Fremont, CA 63,260 72,259 14.23%
    6 Los Angeles-Long Beach-Santa Ana, CA 46,147 52,158 13.03%
    7 Washington-Arlington-Alexandria, DC-VA-MD-WV 59,801 67,344 12.61%
    8 Virginia Beach-Norfolk-Newport News, VA-NC 37,960 42,521 12.02%
    9 Buffalo-Niagara Falls, NY 31,160 34,472 10.63%
    10 New Orleans-Metairie-Kenner, LA 49,100 53,835 9.64%

    All I can say is, this data looks great for Portland. That city isn’t perfect to be sure, but on the GDP side of the house, the plan is working beautifully. Contrary to slacker stereotypes, high value work is increasingly being produced there.

    Aaron M. Renn is an independent writer on urban affairs based in the Midwest. His writings appear at The Urbanophile.

  • The Millennial Mosaic

    Esperanza Spalding, winner of the best new artist award at this year’s Grammys, personifies the ethnic trends reshaping America.  She is a fresh-faced 27-year old jazz bassist whose very name portrays her mixed ethnic and racial heritage as the daughter of an African-American father and a Hispanic, Welsh, Native American mother. Spalding first gained her deep interest in music watching French-born Chinese American classical cellist Yo Yo Ma on “Sesame Street,” a TV program that has perhaps contributed to ethnic acculturation in the U.S. as much as any other institution. Spalding’s formal musical training was originally classical, but at age 15 she decided that her passion was jazz, itself a quintessentially American 20th Century fusion of black rhythms and the melodies of European immigrants.

    The United States has gradually been becoming more diverse for decades, but Esperanza Spalding’s Millennial Generation (born 1982-2003) is most radically altering the nature of that diversity.  The entirely senior citizen Silent Generation (born 1925-1945) is 90% white. Baby Boomers (born 1946-1964) and Generation X (born 1965-1981) are a bit more diverse: 17% and 25% non-white respectively.  In contrast, four in ten adult Millennials are either African-American, Hispanic, Asian, or of mixed race. Among all Millennials of high school age or younger, about half now come from what was once called a minority group. Moreover, according to the 2009 Census population estimates, the under 18 population of Arizona, California, Hawaii, Maryland, Nevada, New Mexico, and Texas is majority-minority with Florida, Georgia, Mississippi, New Jersey, and New York poised on the brink of that benchmark.

    In 2008 the Census Bureau made these demographic trends “official” by forecasting that the United States will become a majority-minority country around 2040. By 2050, with an estimated 46% of the population, non-Hispanic whites will still remain the country’s single largest racial group, but Hispanics (30%), African-Americans (15%) and Asians (9%) will together comprise a majority of the U.S. population.

    Generational theory, first developed by William Strauss and Neil Howe, offers important historical insights on what this new majority-minority America might look like.    As we point out in our forthcoming book, Millennial Momentum: How a New Generation is Remaking America, we are in the midst of what Strauss and Howe have defined as a “fourth turning.” These periods have invariably been associated with the most intense social and political stress in US history: the American Revolution, the Civil War, and the Great Depression. Civic generations, heavily populated by the children of large waves of immigrants, are more ethnically diverse than older generations, contributing to the ethnic and racial tensions that have existed during each of these time periods. At the same time, because civic generations are comprised of group- and team-oriented, conventional and institution building individuals, ethnic absorption and acculturation also increases during and just after fourth turnings as each civic generation matures. This is in sharp contrast to “idealist” generations, such as the Baby Boomers, that reject the mainstream culture and often form movements promoting ethnic separatism.

    Ethnic tensions during previous similar generational changes rivaled those the country is experiencing today.  In the run-up to the Civil War, the rabidly anti-immigrant and anti-Catholic American or Know-Nothing Party captured close to a quarter of the national popular vote in the 1856 presidential election,and more than a third of the vote that year in all of the states that eventually comprised the Confederacy. In the 1930s, as the civic GI Generation children of the Eastern, Central, and Southern Europeans who comprised America’s last previous great wave of immigrants came of age to help elect Franklin D. Roosevelt, his most virulent opponents claimed that the president was really a Jew named “Rosenfeld” and derided his program as the “Jew Deal.”

    We see similar language in today’s discourse, at least on the fringes. Some extreme opponents of President Barack Obama accuse him of being foreign-born and a crypto-Muslim. In a more obscure way, if one searches Google for the seemingly innocuous phrase, “US majority nonwhite 2040,” two of the first three listings are from racist groups decrying this change and the third is from a liberal group advising the need to “understand” the fears of white people in a rapidly changing America.

    Fortunately civic generation Millennials have many characteristics that lead to ethnic acculturation and absorption The Civil War generation was critical to absorbing the Irish into the American mainstream, in part through the role played by Irish detachments in the Union Army, something that helped the Irish overcome the charge that they were an alien Papist force set on undermining a free Protestant nation.  Similarly, the GI Generation’s Poles, Italians, and Jews became acculturated during and after World War II, in part through their service in the armed forces or in the domestic war effort.  In sharp contrast to the anti-Semitic charges leveled against FDR, commentators on all sides of the political spectrum describe America as a “Judeo-Christian Nation.” Foods like bagels and pizza, once available only in urban ethnic enclaves, became commonplace, sold by pizza chains started by Irishmen and Greeks, or bagels marketed by brands such as Pepperidge Farm.

    In the current fourth turning, America’s newest ethnic minorities will also become acculturated and, in turn, shape the nation’s culture. A 2007 Pew survey indicates that while only 23% of first generation Hispanics speaks English “very well,” that percentage rises to 88% among those in the second generation and 94% within the third. At the same time, researchers at the University of California-Irvine and Princeton found that Latinos tend to “lose” their Spanish the longer they are in this country. This research indicates that although first generation Hispanics bring Spanish with them, by the second generation only a third of Latinos speak Spanish “very well.” By the third generation, that number drops to 17% among those with three or four foreign-born grandparents and to only 5% among those with just one or two foreign-born grandparents. ()  

    And, so as the United States endures the tensions and rancor of another generational fourth turning, it is important to realize that this too shall pass.  Millennials will, as have other civic generations before them, redefine what it means to be an American in ways both more diverse and inclusive than older generations may be able to imagine or appreciate.

    Morley Winograd and Michael D. Hais are fellows of NDN and the New Policy Institute and co-authors of “Millennial Makeover: MySpace, YouTube, and the Future of American Politics” and the upcoming “Millennial Momentum: How a New Generation is Remaking America.”

    Esperanza Spaulding photo by Andrea Mancini.

  • Seattle, Denver & Portland: Slowing Growth Rates & Convergence

    Just released 2010 Census data indicates that the growth rates of the Seattle, Denver and Portland metropolitan areas fell significantly in the 2000s compared to the 1990s.

    Seattle: Seattle metropolitan area population growth fell to 13 percent in the 2000s compared to 19 percent in the 1990s. The metropolitan area population in 2010 was 3,439,000, up from 3,041,000 in 2000. The historical core municipality of Seattle grew eight percent between 2000 and 2010 (from 563,000 to 608,000), while the suburbs grew 14 percent. The suburbs attracted 89 percent of the metropolitan population growth.

    Denver: The Denver metropolitan area experienced a decline in growth rate from 32 percent to 17 percent, while the population increased from 2,179,000 to 2,543,000. The historical core municipality of Denver grew eight percent, from 554,000 to 600,000. The suburbs grew 20 percent and accounted for 83 percent of the metropolitan area population growth.

    Portland: In the Portland Metropolitan area growth declined to 15 percent from 27 percent, with a population rising from 1,928,000 to 2,226,000. The historical core municipality of Portland grew 10 percent (from 529,002 583,000), while the suburbs gained 17 percent. The suburbs attracted 82 percent of the metropolitan population growth.

    Convergence: These slower population growth rates indicate a convergence with the growth rates achieved by middle American metropolitan areas for which data is available. Indianapolis grew 15 percent and Oklahoma City grew 14 percent, more than Seattle and slightly less than Denver and Portland.

  • Rahm Emanuel Wins The Right to Confront Chicago’s Problems

    Rahm Emanuel has won Chicago’s Mayoral election. He now must confront Chicago’s massive problems. The Chicago Sun-Times is already grim:

    Rahm Emanuel’s Round One victory gives him a running start on confronting problems so severe, the painful solutions could seal his fate as a one-termer.

    Whether Emanuel can avoid a one-and-done scenario — assuming he even wants to serve more than four years — will largely depend on how he tackles the biggest financial crisis in Chicago history.
    The city is literally on the brink of bankruptcy with a structural deficit approaching $1 billion when under-funded employee pensions are factored in.

    Mayor Daley borrowed to the hilt, sold off revenue-generating assets and spent most of the money to hold the line on taxes in his last two budgets. The city even borrowed $254 million to cover back pay raises long anticipated for police officers and firefighters.

    Last night’s election results could be a preview of Emanuel’s coming conflict with Chicago’s city workforce. Emanuel lost in some important wards where powerful city workers live. The government unions feel Emanuel might be too willing to cut their benefits and pensions. Alderman Ed Burke, Chairman of Chicago’s Finance Committee, will now be Emanuel’s biggest short-term problem (Burke’s 14th Ward didn’t support Emanuel). Does Emanuel have the votes in City Council to remove Alderman Ed Burke from his committee post? It’s too early to tell. Will Emanuel and Burke cut a deal?

    The new census numbers showed Chicago with population loss of 200,000 from 2000 to 2010. These Detroit style numbers show Rahm Emanuel will need all the help he can get. Chicago is in decline.

  • Census 2010: Urbanizing Indiana

    The first Census results for Indiana were recently released, painting a picture of an increasingly metropolitan state.  Indianapolis continues to be the growth champion as its strong economy attracted people from the rest of the state, as well as increasingly diverse populations.  Although  the core of Indianapolis fell well below expectations, its population did not fall like that of Chicago. In a switch from some other regions, the outer suburbs also lagged expectations while inner suburbs boasted a robust performance.

    Population Change in Indiana

    The map below shows how Indiana’s counties faired between Census 2000 and 2010, with counties gaining population in black, and those losing population it in red.

    Many rural and small industrial counties either shrank or posted anemic population growth while most metro counties, especially suburban ones, were standouts.  This is particularly illustrated by this map highlighting only those counties that grew faster than the statewide average:


    This list features heavily counties in suburban Indianapolis, Cincinnati, Louisville, and Chicago, as well as areas near midsized cities like Fort Wayne and Evansville.  Big Ten college towns Bloomington and Lafayette also did well.

    Metro Indianapolis: Indiana’s Growth Champion

    But the clear population winner was metro Indianapolis, which grew at a rate 15.2%, nearly double the US average and well above that of the state:

    The growth even extended even to the central city/county, with Marion County breaking the 900,000 barrier.   The 231,137 people added by metro Indy was fully 57% of total statewide growth, even though that region only contained 25% of the state’s population in 2000.  Unsurprisingly, metro Indy added 15,000 jobs during the last decade  while the rest of the state shed nearly 200,000 of them.

    Indy Suburban Migration Missed Expectations, But No Core Renaissance Either

    Indianapolis showed some of the same urban core patterns as Chicago, which bodes ill for the back to the city story at the national level.  There is a city-county consolidation in effect which muddies the waters here, but the old township boundaries that are still reported by the Census Bureau as minor civil divisions can serve as a proxy for old boundaries.  Center Township covers most of what used to be the old City of Indianapolis, while the remaining townships constitute the Inner Suburbs and the collar counties the Outer Suburbs.

    Those of us who are urban boosters were excited that the Census Bureau estimates showed Center Township’s decades long population slide ending and even hitting an inflection point during the 2000s. Alas, these Census results demolished that notion as Center Township was shown to have lost 24,268 people, falling well short of estimated population in 2009.  Like Chicago, the inner city also featured a large black exodus.

    But the Outer Suburbs didn’t fare that well either, especially Hamilton County.  Long ranked among the fastest growing in the entire United States, I had been waiting to see if growth there might have been slightly above trend as in the past and put them over the 300,000 mark. It turns out to be a very different story, as Hamilton County’s 2010 population was 274,659, actually coming in below the 279,287 the Census Bureau had estimated in 2009. Still, the majority of regional growth was still in the Outer Suburbs, although less than estimated.

    This of course means that the Inner Suburbs did better than expected, particularly the southern ones of Perry and Franklin Townships, which still have some greenfield development opportunities left.  As in cities across the US, older Inner Suburbs of Indy have been experiencing their own problems as they aged. But this shows that the problems may not be as bad as feared.  Though the economy doubtlessly affected this, nevertheless it still buys additional time for transformations driven by demographic growth and entrepreneurship among immigrants and a burgeoning black middle class to take root.

    More Diversity, But Still Not That Diverse

    Indianapolis and Indiana grew more diverse during the 2000s particularly with Hispanic immigration. But again the changes were concentrated in metro areas.  And Indianapolis, long a very white city with a black minority, showed very strong growth in diversity, but still not enough to make this a truly diverse place in the manner of New York or Los Angeles.

    As in Chicago, the core lost black-only population, but other than that it was a very different story.  Metro Indy added 48,824 new blacks, a growth rate of 22.8% that outpaced overall growth.  This boosted black population share by nearly one percentage point.   Unlike Chicago, where local journalists are asking what happened to the city’s incredible shrinking black population, leading Indy black talk show host Amos Brown issued a press related titled “Blacks Fueled Indy’s Growth in 2010 Census Reports” to trumpet the black numbers there. One big reason might be: in contrast to Chicago, Indianapolis’ African-Americans did not have to flee south for jobs or affordable housing.

    The black core population decline in Indy seems less driven by gentrification than the prosaic concerns that generally drive suburbanization, such as safer streets,  better housing and schools.  This migration pattern is very evident in places like the Inner Suburban Lafayette Square area, which in addition to becoming a thriving immigrant business district is also home to large numbers of black owned businesses that are helping to transform this once decaying area.

    The state’s black population as a whole remains heavily concentrated in large urban areas, with Marion and Lake Counties accounting for 62% of the state’s total black population.

    Indy’s Hispanic growth surged as well, with 66,715 new Hispanics representing a 161% increase, though this is less than some expected. Hispanic population growth was more evenly spread, though from a total numbers perspective Indy and northern Indiana dominated the growth, as illustrated by the following chart of total Hispanic population growth in the last decade:

    Indy’s Asian population also more than doubled to almost 40,000..  Add this all up and the metro area non-Hispanic white-only population share dropped by six percentage points, but remains at 74.6%.  The city of Indianapolis itself is pushing 40% minority, however.  Regardless, this is still a material change and shows that metro Indy is a strong magnet not just for whites, but for pretty much everybody.  Its challenge is to continue building on this for the future, while the state’s challenge will be to  pull itself up to Indy’s level of demographic and economic performance.

    Aaron M. Renn is an independent writer on urban affairs based in the Midwest. His writings appear at The Urbanophile.

    Photo by Carl Van Rooy

  • The Still Elusive “Return to the City”

    Metropolitan area results are beginning to trickle in from the 2010 census. They reveal that, at least for the major metropolitan areas so far, there is little evidence to support the often repeated claim by think tanks and the media that people are moving from suburbs to the historical core municipalities. This was effectively brought to light in a detailed analysis of Chicago metropolitan area results by New Geography’s Aaron Renn. This article analyzes data available for the eight metropolitan areas with more than 1 million population for which data had been released by February 20.

    Summary: Summarized, the results are as follows. A detailed analysis of the individual metropolitan areas follows (Table 1).

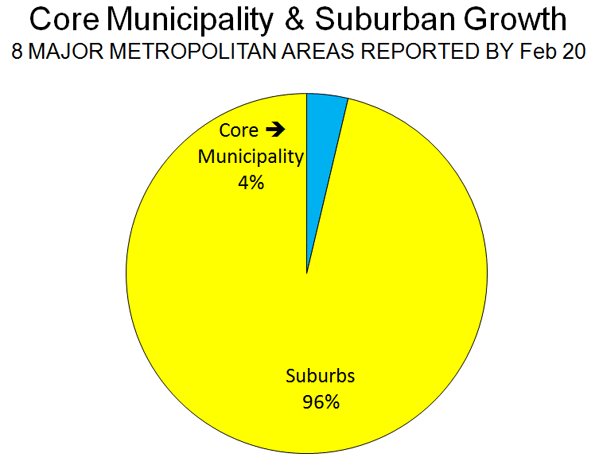
    • In each of the eight metropolitan areas, the preponderance of growth between 2000 and 2010 was in the suburbs, as has been the case for decades. This has occurred even though two events – the energy price spike in mid-decade and the mortgage meltdown – were widely held to have changed this trajectory. On average, 4 percent of the growth was in the historical core municipalities, and 96 percent of the growth was in the suburbs (Figure 1).
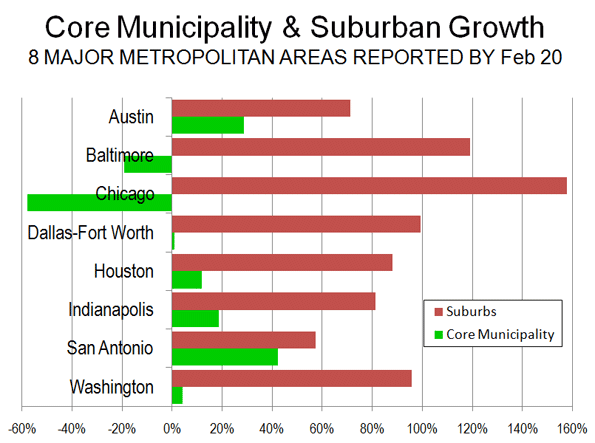
    • In each of the eight metropolitan areas, the suburbs grew at a rate substantially greater than that of the core municipality. The core municipalities had an average growth from 2000 to 2010 of 3.2 percent. Suburban growth was 21.7 percent, nearly 7 times as great.  Overall, the number of people added to the suburbs was 14 times that added to the core municipalities.
    Table 1:
    Metropolitan Area Population: 2000-2010
    2000 Population
    Historical Core Municipality Suburbs Metropolitan Area
    Austin              656,562            593,201         1,249,763
    Baltimore              651,154         1,901,840         2,552,994
    Chicago           2,895,671         6,053,068         8,948,739
    Dallas-Fort Worth           1,188,580         3,972,964         5,161,544
    Houston           1,953,631         2,761,776         4,715,407
    Indianapolis              860,454            664,650         1,525,104
    San Antonio           1,144,646            567,057         1,711,703
    Washington              572,059         4,181,934         4,753,993
    Total           9,922,757       20,696,490       30,619,247
    2010 Population
    Austin              790,390            925,899         1,716,289
    Baltimore              620,961         2,089,528         2,710,489
    Chicago           2,695,598         6,599,081         9,294,679
    Dallas-Fort Worth           1,197,816         5,173,957         6,371,773
    Houston           2,099,451         3,846,449         5,945,900
    Indianapolis              903,393            852,848         1,756,241
    San Antonio           1,327,407            815,101         2,142,508
    Washington              601,723         4,883,034         5,484,757
    Total         10,236,739       25,185,897       35,422,636
    Change: 2000-2010
    Austin              133,828            332,698           466,526
    Baltimore              (30,193)            187,688           157,495
    Chicago             (200,073)            546,013           345,940
    Dallas-Fort Worth                 9,236         1,200,993         1,210,229
    Houston              145,820         1,084,673         1,230,493
    Indianapolis               42,939            188,198           231,137
    San Antonio              182,761            248,044           430,805
    Washington               29,664            701,100           730,764
    Total              313,982         4,489,407         4,803,389
    Percentage Change: 2000-2010
    Austin 20.4% 56.1% 37.3%
    Baltimore -4.6% 9.9% 6.2%
    Chicago -6.9% 9.0% 3.9%
    Dallas-Fort Worth 0.8% 30.2% 23.4%
    Houston 7.5% 39.3% 26.1%
    Indianapolis 5.0% 28.3% 15.2%
    San Antonio 16.0% 43.7% 25.2%
    Washington 5.2% 16.8% 15.4%
    Total 3.2% 21.7% 15.7%
    Chicago excludes Kenosha County, WI
    Washington excludes Jefferson County, WV
    Indianapolis core municipality: Indianapolis & Marion County

    Analysis of Individual Metropolitan Areas: The major metropolitan areas for which data is available are described below in order of their population size (Figure 2 and Table 1).

    Chicago:The core municipality of Chicago lost 200,000 residents between 2000 and 2010. Suburban growth was 546,000, adding up to total metropolitan area growth of 346,000 people. The suburbs accounted for 158 percent of the metropolitan area growth. The core municipality decline was stunning in the face of the much ballyhooed urban renaissance in that great city. Yet this renaissance was limited enough as to not lead to an expanding population.

    The decline in the core municipality population represents a major departure from the 2009 Bureau of the Census estimates, which would have implied a 2010 population at least 170,000 higher (assumes the growth rate of 2008 two 2009).

    Instead all of the growth was in the outer suburbs, beyond the inner suburbs of Cook County.

    Dallas-Fort Worth: The historical core municipality of Dallas had a modest population increase of 9000, or less than 1 percent between 2000 and 2010. In contrast, the suburbs experienced an increase of 1.2 million, or 30 percent. Thus, approximately 1 percent of the metropolitan area growth was in the core municipality, while 99 percent was in the suburbs, most of it in the outer suburbs. The inner suburbs added 14 percent to their 2000 population, while the outer suburbs added 36 percent.

    The population figure for the core municipality of Dallas – consistently among the strong core areas –  was surprisingly low, at 9 percent below (117,000) the expected level. The suburban population was 1 percent (71,000) below expectations.

    Houston: The historical core municipality of Houston had comparatively strong population growth, adding 146,000 and 8 percent to its 2000 population. However this figure was 8 percent, or 174,000 below the expected figure. By contrast, the suburban growth was 39 percent, more than five times that of the central jurisdiction. The suburban population growth was 1,085,000, more than six times that of the core jurisdiction. The suburban population was 4 percent or 144,000 higher than expected.

    The core jurisdiction of Houston accounted for 12 percent of the metropolitan area growth while the suburbs s accounted for 88 percent. This was evenly distributed between the inner suburbs of Harris County and the outer suburbs. The inner suburbs added 38 percent to their population while the outer suburbs added 41 percent.

    Washington:Reversing a decade’s long trend, the historical core jurisdiction of Washington (DC) had a small population gain between 2000 and 2010. But the Washington, DC gain of 30,000 pales by comparison to the suburban gain, which was more than 20 times greater, at 700,000. The core jurisdiction accounted for 4 percent of the population gain, while the suburbs accounted for 96 percent.

    More than 60 percent of the growth in the metropolitan area was outside the inner suburban jurisdictions that border Washington, DC (Arlington County and Alexandria in Virginia, together with Montgomery County and Prince George’s County in Maryland), while the inner suburbs accounted for 36 percent of the growth. The population increase in the inner suburbs was 9 percent, compared to 37 percent in the outer suburbs.

    Jefferson County in West Virginia was not included in the analysis because data is not yet available.

    Baltimore: The historical core municipality of Baltimore, the site of another ballyhooed urban comeback, lost 30,000 people, or 5 percent of its 2000 population. Baltimore’s 2010 population was 4 percent or 16,000 below the expected level. The suburbs experienced a 10 percent or 188,000 person increase.  The region’s population increase was roughly equal in numbers between the inner suburbs and the outer suburbs, although the exurban percentage increase was nearly twice as large.

    San Antonio:The historical core municipality of San Antonio experienced the largest population increase among the eight metropolitan areas, at 183,000, a roughly 16 percent population jump. The city of San Antonio accounted 43 percent of the growth while suburbs in Bexar County and further out accounted for a larger 57 percent. However, the suburban population increase was 248,000 or 44 percent. This is something of a turnaround in trends that favored the city of San Antonio in the past because of its vast sprawl and predominant share of the metropolitan population.

    The city of San Antonio population was 5 percent or 65,000 people short of the expected 2010 level. The suburban population was 15 percent more or 104,000 more than the expected level.

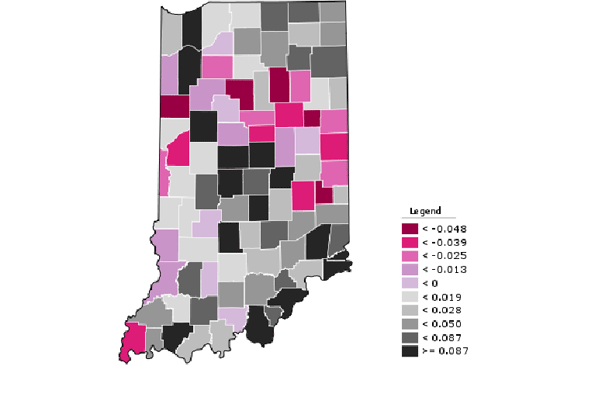
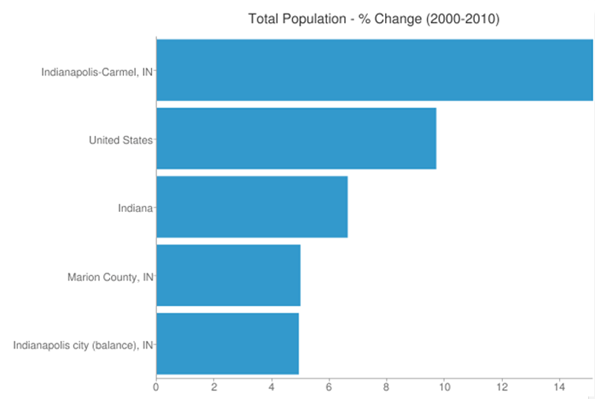
    Indianapolis:The historical core area of Indianapolis and Marion County (including enclaves within Indianapolis) grew 5 percent and accounted for 19 percent of the metropolitan area growth. In contrast, the surrounding suburbs grew 28 percent, representing r 81 percent of the metropolitan area growth. Overall, the core municipality added 44,000 people, while the suburbs added more than four times as many, at 188,000.

    Austin:The historical core municipality of Austin experienced the greatest growth of any core jurisdiction in the eight metropolitan areas, at 20 percent. Even so, growth in the suburban areas was nearly 3 times as high at 56 percent. The city of Austin accounted for 29 percent of the metropolitan area population growth, while the suburbs accounted for 71 percent. Overall, the central municipality grew 134,000, while the suburbs grew 2.5 times as much, at 333,000.

    Generally it is fair to say that, so far, suburban areas are growing far faster than urban cores. In addition, most of the fastest growing core municipalities are those areas that are themselves largely suburban, particularly in relatively young cities like San Antonio, Houston and Austin.
     
    Among the eight metropolitan areas analyzed, the older core jurisdictions (with median house construction dates preceding 1960) tended to either lose population or grow modestly. This is illustrated by the city of Chicago, with a median house construction date of 1945, Baltimore with a median house construction date of 1946 and Washington with a median house construction date of 1949 (Table 2). Generally, the central jurisdictions with greater suburbanization (with median house construction dates of 1960 or later) grew more quickly. For example, highly suburban central jurisdictions like Austin with a median house construction date of 1983 and San Antonio, with a median house construction date of 1970, grew fastest. So much for the long forecast, and apparently still elusive, “return to the city”.

    Table 2:
    Historical Core Municipalities: Growth & Median House Age
    Historical Core Municipality
    Growth: 2000-2010 Share of Metropolitan Growth Median House Construction Year
    Austin 20.4% 28.7% 1983
    Baltimore -4.6% -19.2% 1946
    Chicago -6.9% -57.8% 1945
    Dallas-Fort Worth 0.8% 0.8% 1974
    Houston 7.5% 11.9% 1975
    Indianapolis 5.0% 18.6% 1967
    San Antonio 16.0% 42.4% 1979
    Washington 5.2% 4.1% 1949
    Average 3.2% 3.7%

    Wendell Cox is a Visiting Professor, Conservatoire National des Arts et Metiers, Paris and the author of “War on the Dream: How Anti-Sprawl Policy Threatens the Quality of Life

  • What’s in a (Metropolitan Area) Name?

    Only two of the world’s megacities (metropolitan areas or urban areas with more than 10 million people) have adopted names that are more reflective of their geographical reality than their former core-based names. It is likely that this will spread to other megacities and urban areas as the core jurisdictions that supplied the names for most become even less significant in the dispersing urban area.

    The first metropolitan area to make a change was Jakarta which became "Jabotabek," a title derived from the names of four major municipalities in the metropolitan area, Jakarta, Bogor, Tangerang and Bekasi. However, since that name did not include letters from the fifth largest municipality, Depok, the metropolitan area is sometimes called Jabodetabek. But adding a couple of letters for municipalities could lead to an exceedingly long name. For example, a new municipality of South Tangerang was recently created, representing the sixth municipality with nearly 1,000,000 people or more in Jabotabek. Presumably there will be those who will insist on calling the metropolitan area Jabodetabekst, a more Russian than Indonesian sounding name.

    Further, a large part of the metropolitan area is not in one of the six larger municipalities and instead is in one of the many smaller jurisdictions. There is thus the potential of the name even longer than the present world record holder, "Taumatawhakatangihangakoauauotamateahaumaitawhitiurehaeaturipuk-
    akapikimaungahoronukupokaiwhenuakitanatahu
    ," which is the 105 letter name of a hill in the Hawks Bay area of New Zealand.

    The second mega-city with a new name is the Mexico City area. Mexico’s national statistics bureau, the Instituto Nacional de Estadística y Geografía (INEGI) has designated the Mexico City metropolitan area as the "Zona Metropolitana del Valle de México," which translates to the Valley of Mexico metropolitan area.

    Alternate names for metropolitan areas or urban areas are not unusual. One of the earliest may have been the "Southland," a name apparently given to the Los Angeles area or Southern California many decades ago by the Los Angeles Times. There are Tri-State areas, such as New York and Cincinnati and Seattleites refer to the Puget Sound area. However all of these names have varying definitions depending upon who is using them and none directly corresponds to the boundaries of either an urban area or a metropolitan area.

    Perhaps better defined is the Randstad area of the Netherlands, which includes at least the urban areas of Amsterdam, Rotterdam and The Hague. However this area is too large to be considered a single metropolitan area or a single urban area.

    Similarly, there is the Pearl River Delta, made up of Hong Kong, Shenzhen, Dongguan, Guangzhou, Foshan, Jiangmen, Zhongshan, Zhuhai and Macau. This area of virtually continuous urbanization is by far the largest in the world, but does not qualify as a metropolitan area or an urban area because each one of the jurisdictions is essentially a separate labor market. Further, despite the fact that Hong Kong and Macau are a part of China, the border controls between Shenzhen and Hong Kong and Zhuhai and Macau make it structurally impossible for those areas to merge into single labor markets.

    The Yangtze River Delta is another accurate title for a large area of urbanization. This includes the city/province of Shanghai, and up to 14 city/prefectures, such as Nanjing, Suzhou, Ningbo, Yangzhou and Hangzhou. However, as in the case of the Pearl River Delta each of these represents a separate labor market and urban area.

  • Dallas Charges Up for the Electric Chevy

    If they build it, will we come? Planners, utilities, auto industry execs, and retailers are hopeful that we will, as they get themselves ready for electric vehicles in the Dallas/Fort Worth Metroplex. This isn’t a pie-in-the-sky vision for the future. The reality is unfolding right now. In 2011, NRG Energy will install upwards of 70 car-charging stations across Dallas and Forth Worth. As the Nissan Leaf and the Chevy Volt begin to penetrate the D/FW market, NRG aims to capture the revenue stream from charging car batteries here, just it is doing in Houston. NRG’s news comes on the heels of electric utility TXU Energy’s announcement of its own installation of twelve public charging stations being allocated across Dallas and Fort Worth.

    I’ve been watching the wave for several years as part of my work with emerging companies. At numerous conferences on electric vehicles, I’ve observed stakeholders – many of them in competition with each other – come together to swap ideas, network, and hammer out standards. It’s been an education in the necessity of collaboration to foster sustainable development.

    Cooperation hasn’t been guided by idealism so much as by the urge to survive in a market that, until recently, was practically non-existent. Start-ups that have failed to collaborate have fallen by the wayside. As one conference speaker joked, “We’ve got to build up the market before we tear each other down.”

    Profit-making may be the motivation of electric-vehicle manufacturers, but others at the table have their own agendas for EV readiness. The city of Dallas, for example, is in Serious Nonattainment status for ozone pollution. The region risks losing funding if it doesn’t clean up its air. “Seventy percent of air pollution in Dallas comes from on-road/off-road vehicles, so EVs can play a substantial role in resolving this,” said Jennifer Cohen, Executive Director for the North Texas Clean Air Coalition. Cohen was an organizer of the Electric Vehicle North Texas Electric Vehicle Showcase last September at the State Fair of Texas.

    At the Electric Vehicle Showcase. Betsy del Monte, Director of Sustainability for Dallas-based construction giant BECK told a panel, “Mass transit alone cannot solve our problem. We also need to look at the broader picture in terms of development. Of the palette of materials that we have available, EVs are one of the tools we must come to rely on.”

    Tom Reddoch, Director of Energy Efficiency for Electric Power Research Institute, agreed: “This is a success story. EPRI is connecting two giants, the electric industry with the auto industry.” To assist stakeholders with the information they need to build communities that can sustain a transition to electric vehicles, EPRI sees three keys: regionally-driven consumer attitudes, the installation of charging infrastructure in order to ensure a positive response for the drivers’ first experiences, and utility readiness. “We have plenty of capacity to go around, especially if people charge at night,” said Reddoch, “but there could be localized effects where cars cluster. The construction community, developers, and architects need to address this together.”

    At a technical level, tools are emerging that can help integrate electric vehicles into the transportation landscape. “We’ve arrived at an interesting nexus between the power industry and the auto industry,” said Brad Gammons of IBM. “There is not going to be a dominant leader so we need standards across the value chain… Collaboration ensures that things happen efficiently.”

    Not all collaboration requires complex software. Some of it is happening on the ground, person to person. The installation of electric vehicle charging infrastructure in D/FW is giving two cities with a long (if friendly) rivalry a chance to mutually benefit by working together. “To get the mayor of Fort Worth to travel to Dallas to talk about EVs is huge,” said Jim Greer of Oncor electricity.

    Range anxiety continues to be a barrier to electric vehicle adoption, even though three-fourths of Americans commute less than 40 miles per day. “To handle range anxiety, we need to provide home-based charging capability,” said del Monte from BECK.

    At the same time, Half Price Books unveiled Dallas’ first public charging station. Granted, there’s not a line around the block for the EV charger yet. But just having it at one of Dallas’ most popular bookstores sends a tangible signal to drivers that the future is here and now.

    As the infrastructure falls into place, the question remains: Will drivers buy the cars? We’ll find out very soon. The Chevy Volt is scheduled to arrive on car dealers’ lots in Dallas-Fort Worth in March.

    Photo of the Chevy Volt, a plug-in electric vehicle by IFCAR

    Anna Clark is the author of Green, American Style and the president of EarthPeople. She lives in one of Dallas’ first residences to earn a Platinum-LEED certification from the U.S. Green Building Council.