Blog

  • Faith-Based City Planning: Exorcising the Suburban Dream

    We’re coming to the end of the season when we focus a great deal of attention on faith. What is faith? The Biblical definition calls it the substance of things hoped for; the evidence of things not seen (Hebrews 11:1, KJV). Humans have the capacity to firmly believe in something that cannot be explained by reason and is not visibly evident. Faith is the basis of the world’s major religions, and often is a cause for war, and today, terrorism. But though the season of faith may be winding down, there is still a place where faith remains strong year round: It is often the basis of the way we plan our communities.

    Over the past two decades, our city planning has become faith based. A new preacher has evolved in the form of the Architect or Planner who evangelizes to the congregation that they can all live in serenity if they have faith in the teachings. Their sermons of architectural commandments introduce dimensional ratios that can deliver a utopian existence, promising a wonderland for families.

    To enforce faith, you of course need an evil entity to oppose. The evil entity in the faith of land planning is The Suburbs. Those that believe in the suburbs are inherently evil and must be converted or they may spend eternity dammed to a cul-de-sac. The automobile is sacrificed on this altar, with the chant “Space – Space – Space”.

    Converts to this faith include many if not most, politicians (not just liberals), architects, planners, environmentalists, movie stars, and many in the press. Those that have not converted yet include land developers, builders, city council and planning commission members, and the majority of the home buying market.

    Some of the principles this faith are as follows:

    • Thou shalt build upon thy dwelling a porch of such magnitude that it can serve as a gathering place.
    • Thou shalt construct a path of 2 cubits (approximately 4 feet) wide near thy porch for followers to meet and pray that a cul-de-sac shall not influence thy offspring.
    • A place for chariots shall be placed upon the buttocks of thy dwelling. Thy chariot must not be nearer to the dwelling than 4 cubits or thee will be smitten.
    • Thou shall plant a tree half a cubit from thy curb and in front of thy porch.
    • Create a place for gathering no farther than 600 cubits from thy dwelling.
    • Thy dwelling shall have Craftsman trim.
    • The path to heaven is taken by bicycle, light rail, or walking, not by powered chariot.
    • A congregant must dwell in extreme closeness to thy neighbor.

    Myself? I’m a disbeliever; a heretic who thinks there is no place in the design of our cities and neighborhoods for this belief system to be regulated or enforced. If development companies are believers, then by all means let them develop their land in such a manner, as they will have the faith that homes will sell to those that also believe.

    The danger arises when Federal funding is tied to the faith, on the basis that developments of extreme density will surely result in less vehicular miles traveled and a more healthy environment for human creatures. Do not follow this faith, and good luck getting funded. Is this the American way?

    I do not believe the automobile is evil, and I’m thankful that I live in an era where I can think nothing of traveling 20, 30, 40 miles or even 400 miles. A hundred years ago my ancestors had no such luxury.

    I am thankful that I live in a place that offers a sense of space, yet is not too distant from neighbors and services. I am especially thankful for choice. Yes, there is a coffee shop about a 10 minute walk away, but a three minute drive will get me to a coffee shop that offers more tasty drinks at lower costs.

    Looking outside, I see two feet of new snow. I’m especially thankful that I do not have to use our icy walks in the sub-zero temperatures, and wait for the bus that connects downtown to the bus that would take me to within a ¼ mile of my office. Yes I’m thrilled to have a 5 minute drive to work instead of an hour bus ride (buses connect downtown, not in the burbs). Of course, those with faith believe that exposure to sub-zero weather and walking along icy surfaces is somehow healthier.

    I lack the faith that extreme density without car ownership is a better way. As a disbeliever, I cannot find the faith to believe children being brought up in high-density, high-rise projects have the same quality of life as those brought up in homes with a secure and safe yard to play in. I cannot find the faith that living in high rise rentals is an American Dream.

    I do believe the consumer will not flock to this new life of high density living. Yes, New York today is a somewhat exciting place to visit, but just a few decades ago it was a truly awful place. What will it be like two decades from now? Will it be a great place to live for those on the lower side of “middle income”?

    I believe there is no magic architectural solution to create a better society – none. There is no special setback, density, or building-to- street ratio that can somehow provide a better life. There is no software button one can press to analyze land use and, bingo, spit out a solution. To believe that any of formula of that sort could be workable takes faith, a faith that is apparently held by many.

    I also believe that it’s simply untrue that the suburbs are not walkable. In the southern states, most cities demand walks to be constructed on both sides of the street. Because of snow, as one ventures north, walkways become less mandated. I have visited (and not on a press tour) the developments of the faith of land planning: I’On, Kentlands, Celebration, SeaSide, WaterColor, etc. What I’ve observed is that there seem to be no more or less people walking than what I have seen in conventional suburbs. On these visits I have never seen a single person sitting on his or her front porch – not one.

    Yet I do believe that a full front porch is important for two reasons. The first is that it connects the living spaces to the street, and it can be used to congregate. But secondly, there is a warmth to a neighborhood of homes that have full porches. It adds character, compared to the coldness of a development lacking porches. So— how the porch is used is not the only measure of its success.

    The sooner we can get faith out of the design of our cities, the sooner we can implement sustainable solutions that have a positive effect on our living standards and help get our housing market (and our economy) back on track. And yes, I hope I’m dammed to a cul-de-sac for eternity!

    Photo by Will Hart of College Hill, Rhode Island – Looking North-East with The First Baptist Church in America (1775), 75 North Main Street in the foreground.

    Rick Harrison is President of Rick Harrison Site Design Studio and Neighborhood Innovations, LLC. He is author of Prefurbia: Reinventing The Suburbs From Disdainable To Sustainable and creator of Performance Planning System. His websites are rhsdplanning.com and performanceplanningsystem.com.

  • California’s Third Brown Era

    Jerry Brown’s no-frills inauguration today as California governor will make headlines, but the meager celebration also marks the restoration of one of the country’s most illustrious political families. Save the Kennedys of Massachusetts no clan has dominated the political life of a major state in modern times than the Browns of California. A member of this old California Irish clan has been in statewide office for most of the past half century; by the end of Jerry Brown’s new term, his third, the family will have inhabited the California chief executive office for a remarkable two full decades since 1958.

    Brown, at 72 the oldest governor in state history, may well determine the final legacy of this remarkable family. His biggest challenge will be to reverse the state’s long-term secular decline — a stark contrast to the heady days of the first Brown era, presided over by paterfamilias Edmund “Pat” Brown.

    Pat Brown was a committed progressive who actually believed in both social and economic progress. He did not focus on re-distributing wealth or expanding bureaucratic controls; his priority was to use government to help generate greater opportunities for Californians.

    Under Pat roughly 20% of the state budget was devoted to capital outlays. He expanded wealth creating infrastructure such as freeways and the State Water Project, which created vast expanses of new, highly fertile farmland. He also increased the state’s parklands so that middle-class Californians could enjoy the state’s unmatched natural beauty.

    Pat, as historian Kevin Starr notes, also transformed California into “a mecca for education.” Inexpensive and quality training — from the elite university to the extensive network of community colleges — fostered high-tech industries across the state. Under Pat Brown, California’s share of the nation’s employment rose from some 8% to 10% as its GDP swelled by a similar percent.

    Pat, not surprisingly, remains an iconic figure for many older Californians. What ended his career was not so much his embrace of big government — although its growing scope and cost concerned many voters  – but backlash against the 1964 “free speech” riots at Berkeley and the far deadlier civil unrest in Watts the following year.  Running as the candidate of law and order, as well as fiscal conservatism, Ronald Reagan in 1966 defeated Brown’s bid for a third term.

    Yet so great was the reservoir of affection for the Pat Brown that in 1974 the voters elected his 36-year-old son as Reagan’s successor. As the late Joe Cerrell, a key operative for both Browns, put it: “If he had run as Edmund G. Green, he wouldn’t have bet on his running in the top 14.”

    Jerry Brown turned out to be of a very different political hue than his father. Sometimes he sounded more anti-government even than Reagan. He disdained his father’s traditional focus on   infrastructure spending and instead preached about amore environmentally friendly “era of limits.”  Brown cut the percentage of spending on such capital improvements from roughly 10% of state spending under Reagan to barely 5%, where it remains mired today.

    Arguably Brown’s biggest mistake was signing legislation in 1978 that allowed collective bargaining for public employee unions. This opened the door for a power grab that eventually drove the state toward semi-permanent penury. Brown’s early embrace of environmentalism also set a pattern of state green engineering that, although clearly avant garde , also tipped the state’s competitive edge.

    Brown, however, also showed a pragmatic side.   Although initially opposed to Howard Jarvis’ 1978 Proposition 13 limits on property taxes, he later embraced it  so enthusiastically that the casual voter might have mistaken him for its author. In his second term Brown also evolved into an avid cheerleader for the state’s burgeoning high-tech industry.

    He also had good fortune to govern California at a time when surging Japanese investment, the high tech boom and, perhaps most important of all, the military buildup accelerated by the 1979 Soviet invasion of Afghanistan generated a remarkable economic boom. Between 1976 and 1980 aerospace and electronics-related employment jumped by a third. California’s share of the nation’s GDP, population and jobs rose steadily, while job growth surpassed the national average.

    The third Brown era, sadly, starts with far less favorable prospects. The state’s share of the nation’s economy and employment has been shrinking for at least a decade. Per capita income has fallen in comparison with the national average by nearly 20%. Once the nation’s high tech wunderkind, California’s share of new high-tech jobs has fallen to a fraction of the national average, while other states, notably Texas, Virginia, Utah and Washington have surged ahead.

    Things have been toughest on the state’s working class. Despite an ever-expanding welfare state, California’s 36 million people suffer a rate of poverty at least one-third higher than the national average when adjusted for cost of living.  Unemployment now is higher than any major state outside Michigan.

    Meanwhile, even as state social spending has surged, reminders of the heroic period — from the state system of higher education to the power, water and freeway systems — have fallen into disrepair. The state’s finances are in even worse shape. Under the feckless Arnold Schwarzenegger, state debt jumped from $34 billion to $88 billion. California now spends twice as much on servicing its interest (more than $6 billion annually) than on the University of California.

    Brown himself recently conceded that the state budget deficit may widen to $28 billion over the next 18 months while the state’s Legislative Analyst’s Office predicts that $20 billion deficits are likely to persist at least through 2016. Not surprisingly, once golden California suffers consistently near the worst debt rating of any state. And things are not likely to turn around quickly: State and local tax revenues in the third quarter of last year rose a paltry 0.6% compared with a 5.2 % gain nationwide.

    Brown’s proven taste for austerity could make him far more effective at addressing the state fiscal crisis than the clueless Terminator. His biggest problem on fiscal matters, one close advisor confided, may lie with his own Democrats in the legislature, many of whom are little more than satraps of the public employee interests.

    Brown’s support for the state’s increasingly draconian green polices may prove more problematic.  As Attorney General, Brown played the bully in enforcing radical green measures that seek to limit developments — industrial and residential — suspected of creating greenhouses gases. Brown suggested during the campaign that such policies would help create an estimated 500,000 green jobs, but few outside the environmental lobby take this seriously. Brownsupporter Tom Hayden points out that these jobs can only be created by higher energy prices and considerable tax increases — not exactly the elixir for an already weak economy.

    More troubling still, Brown, the Democratic leadership and their media supporters continue to deny that “progressive” policies have created  ”a hostile business climate.” Until they wake up to the reality of the state’s dire economic situation, little in the way of serious reform can be expected.

    To succeed, Brown must move beyond delusions and rediscover the pro-business pragmatism that characterized his second gubernatorial term. If not, we can expect the final obliteration of Pat Brown’s great  legacy of pro-growth progressivism, in no small part due to the misjudgments of his son and heir.

    Joel Kotkin is executive editor of NewGeography.com and is a distinguished presidential fellow in urban futures at Chapman University, and an adjunct fellow of the Legatum Institute in London. He is author of The City: A Global History. His newest book is The Next Hundred Million: America in 2050, released in February, 2010.

    Photo by Thomas Hawk

  • Overselling Transit

    A recent op-ed in the Los Angeles Times eloquently illustrated the limits of mass transit in modern societies. This is not to imply that that transit does not have its place, nor that it does not provide a most useful service where it can. The problem has been the overselling of a mode that has very serious limitations. This has led to misallocations of financial resources that could be more efficiently used for the roadway expansions that would relieve traffic congestion and reduce both air pollution and greenhouse gas emissions while encouraging greater job creation and economic growth.

    The op-ed in question was by Karen Leonard, a professor at the University of California, Irvine and Sarah Hays, a Los Angeles architect. The article noted the neighborhood opposition to the “Expo” Line (Exposition Boulevard line) and efforts by the authors to gain support for the line. The neighborhood in question is Cheviot Hills, a tony neighborhood with a median house price of $850,000 in the city of Los Angeles and located between Beverly Hills and Culver City.

    What is significant about the op-ed, however, is not so much the neighborhood as the concluding line and the author credits.

    “So we continue to walk our neighborhoods talking with our neighbors, hoping that this time the quiet majority will finally prevail and we will all gain the choice of leaving our cars at home.

    Karen Leonard is an anthropology professor at UC Irvine. Sarah Hays is a Los Angeles architect. They are co-chairs of Light Rail for Cheviot Hills (lightrailforcheviot.org).

    UC Irvine? It is doubtful that the Expo line will make it possible for anyone in the foreseeable future who lives in Cheviot Hills to “leave their car at home.” The University of California, Irvine is located in the middle of Orange County, approximately 50 miles from Cheviot Hills.

    It is useful to consider what leaving the car at home in Cheviot Hills would mean for a mythical professor at the University of California, Irvine once the Expo line is fully operational.

    On Monday*, the professor needs to be in class at 8:00 am, which requires arrival on campus by 7:45 a.m. On the assumption that the mythical professor lives in the middle of Cheviot Hills, the trip would involve leaving the house at 3:45 a.m. and walking 20 minutes to the transit stop. The favored Expo light rail line would likely not be available that early, so the first leg of the trip would be on a bus. (If the Expo line is operating early enough for the trip, the professor could leave home approximately 25 minutes later).

    Three transfers later, the mythical professor arrives at the campus, at 7:20 a.m., in plenty of time to have coffee and get to the classroom before 8:00. While the professor requires four hours from leaving his or her car at home to the necessary arrival time at campus, a neighbor could have driven nearly all the way to Las Vegas for breakfast.

    If it is assumed that the mythical professor is able to get out of a staff meeting at 3:00 pm, the return trip would take more than 3 hours, part of it on the Expo line.

    Tuesday would be little better, assuming a 10:00 a.m. class start and that the professor gets away by 5:15 p.m. The trip to Irvine would have the advantage of starting on the Expo line, but would still take more than 3 hours, door to door. The return trip, including bus rides, a Green Line ride, a Harbor Freeway Busway ride and an Expo light rail ride would be about 4 hours and 30 minutes, with little wait in Irvine for service.

    These transit commutes would hardly be comfortable or productive, though they would include all conventional forms of transit available in Los Angeles (there are no trolley buses, inclined planes or ferries in Los Angeles). The total door-to-door time would be up to 7.5 hours for a work day of 7 hours. Needless to say, it is unlikely that with this schedule, any professor would ever leave his or her car at home.

    Finally, there is a myth people cannot leave their cars at home and walk or take transit to work. In fact, there are probably no work locations in urban America where people cannot choose to live close enough to work to walk or take transit. But choosing to leave the car at home is not as important as other choices, even for advocates for transit improvements. Otherwise they would live close enough to leave their cars at home. Of course, most people value other things more than leaving the car at home, such as a nice neighborhood, a nice car, a low crime rate and a host of other considerations. Otherwise no professor would live in Cheviot Hills and work at UC Irvine. Indeed, they would probably live in the faculty housing made available by UC Irvine.

    All of this illustrates what transit cannot do; provide automobile competitive service for most of the trips that are taken in the modern American (and even European) urban area.

    It is also worth recognizing that transit has been substantially improved in Los Angeles over the past 20 years (whether it has grown cost effectively is dealt with in another article). Spending aside, these improvements have made it possible to make any one-way trip in the Los Angeles urban area in less than four hours, at least during the middle of the day. This is to the credit of the Metrolink commuter rail system, the subway, rapid busways and the more rapid of the light rail lines. But this is hardly tempting to Angelenos whose median commute time by car is 24 minutes. As elsewhere in the nation (and as in Western Europe, Canada and Australia), transit can sometimes compete with the automobile to core (principally downtown) locations. The suburban to suburban trips, however, largely are simply beyond transit’s capability.

    Of course, some drivers commute much longer, as in the case of the mythical professor at UC Irvine, whose trip would be between one and one and one-half hours each way. In Los Angeles, 8 percent of people in cars have commutes that are more than one hour. And virtually all of them find this commute, however maddening, is far shorter and more comfortable than a similar trip taken by transit.

    —-

    *Correction: The Monday trip from Cheviot Hills to UC-Irvine has been corrected to reflect a subsequently identified better itinerary. The article has been revised to assume this trip.

    —-

    Photograph: Interstate 5 (on the way to Irvine) in Orange County

    Wendell Cox trained on the Exposition corridor between the University of Southern California (USC) and Culver City (near Cheviot Hills) as a member of the USC cross country team. He was appointed to three terms on the Los Angeles County Transportation Commission (one of two agencies merged later to form the MTA) and participated in decisions to authorize the Green Line light rail line, the Harbor Freeway Busway, the Red Line Subway and Interstate 105, all used by the mythical professor commuting to UC Irvine.

  • The NFL: Running the Numbers in the Football Business

    Why does America — and I include myself — invest so much psychic energy, not to mention hard dollars, in professional football, a sport that on many levels combines the worst aspects of roller derby and professional wrestling?

    Sometimes when I am watching Dan, Boomer, Phil, Chris, Rod, Coach Cowher, Prime, Jamie, Mike, Shannon, and the rest, wearing those pink ties and crisp suits and seated on the high alters of cable television, I feel as if I am watching the Supreme Court deliberate on taunting, end-zone celebrations, the Raider Nation, clock management, Ochocinco, booth reviews, Cover Two, the wildcat, and Brett Favre’s shoulder, if not the ‘junk’ in his text messages.

    Sadly, most Americans are clearer on what happens in the red zone than they are about the decisions of the Supreme Court. The business of America is football, much more than it is Main Street stores, the national budget, or the small print of the Patriot Act.

    Maybe when the Decatur Staleys were playing the Chicago Cardinals, or when teams like the Massillon Tigers, the Shelby Blues, and the Ironton Tanks were on the field, football was a sport. It was played in local stadiums by players who worked in nearby steel mills and earned $25 a game.

    The forward pass, national television, and the deification of Vince Lombardi turned the sport into an $8 billion bonanza that, to cover expenses, relies upon subsidized stadiums, sky boxes full of corporate bonus babies, enough violence on the field to render many ex-players vegetables, and a relationship with television that has reduced the airing of the games to violent You Tube clips spliced around ads that blur the attractions of Cialis and McDonald’s (“I’m lovin’ it!”)

    What is the reality of football “franchises,” the right to own a team in a select market? Because football is absurdly given an antitrust exemption (as if the play of the Cincinnati Bengals is in the interest of national security), franchises are best understood as local protection rackets.

    Except for the Green Bay Packers, which is owned by its fans, most NFL teams are owned by corporate hierarchs who have paid millions to buy a team. Fair enough; free enterprise is in the playbook of capitalism.

    But instead of a sporting club that enjoys competition and fair play, what owners buy is a cooperative share of the national football monopoly. Its purpose is to browbeat cities and states for subsidized stadiums. Players are expected to perform under barbaric working conditions, and advertisers and television networks join a never-ending race for the rights to broadcast the spectacles on the Circus Maximus.

    If you are doubtful of football’s influence–peddling in smoke-free political rooms, consider this: President Obama appointed Pittsburgh Steelers owner Dan Rooney to be the U.S. Ambassador to Ireland, no doubt for his go-routes to the Democratic Party. Or that the insolvent state of New Jersey encouraged the Jets and the Giants to build a new $1.6 billion stadium in the Meadowlands, even though the state still owes $110 million on the stadium it replaced, which has since been torn down.

    Keep in mind that most NFL sweetheart deals are hidden as carefully as Jimmy Hoffa would have been spiked into the end zone at Giants Stadium. Revenue-sharing, sales tax increases, municipal bonds to buy stadium land, and parking-lot concessions are among the many ways local political establishments pay obeisance to team owners, who did not get their, on average, $1 billion in net worth by reaching into their own pockets.

    New Jersey loves to boast that the Jets and Giants paid privately for New Meadowlands Stadium. Actually, the fans paid, via PSLs (that’s personal seat licenses), and by paying $200 a pop for many seats. But the NFL owners chipped in $300 million, and the state has poured some $2 billion into the nearby Xanadu project (shops, offices, malls, etc.) that has little to show for the spent money except upgraded swampland, and a train line to the new stadium.

    To pay for their subprime stadium debts, NFL owners are now threatening to “lockout” the players from the 2011 season, unless the players’ union agrees to lower the league’s salary cap, which sets how much each team can spend on its players.

    The fans are told that the salary cap (59% of league revenue) is in place so that teams can compete as equals, and that “on any given Sunday,” every team has a chance of winning. Actually, the cap is just another example of the extent to which the NFL is a closed shop and exists to limit owners’ expenses.

    To be sure, football players are not like you and me, and are paid hundreds of thousands of dollars for relatively short careers. (Running backs last less than four years in the league.) But for all the stars that you read about getting $7 million in signing bonuses, most players earn the league minimum (about $400,000) and are cut, usually after suffering a career-ending injury.

    More life–threatening is the extent to which a career in football renders players prone to dementia: 6.2% of NFL players are affected, as opposed to 1.2% in the general population. In dealing with this issue, what most interests the owners isn’t player safety, but rather juking class-action liability, were it to be proven in court that NFL play causes dementia.

    The bling for NFL owners, along with those subsidized stadiums, is its $20 billion in television contracts from the various networks, including CBS, NBC, Fox, and ESPN. The owners divide this swag, and the networks parse the schedule: there are games on Sunday afternoon, Sunday night, Monday night, and often on Thursdays — roughly the slots of Gregorian rituals in the middle ages.

    Football’s thirty-two teams are a closed shop that enjoys antitrust exemption (hence, no competition), and the games are not “news”, and thus available to anyone to broadcast. Football is studio entertainment, played before a “live stadium audience.”

    Why do we need billion-dollar stadiums in each market, when a handful at Universal Studios would suffice? And they could be “themed” to simulate snow bowls, mud games, or even the Black Hole, Oakland’s biker digs.

    Ratings of televised football games continue to go up and up, dominating national life not just on Sundays, but increasingly on holidays, too. Strangers could easily get the impression that Mayflower pilgrims got together with local Indians to watch the Lions get stuffed yet again on Thanksgiving. Can an indebted nation really give up so many hours to the Bills and the Buccaneers?

    The biggest risk to football as we now know it is if new technology (will today’s mainstream networks really survive?) diminishes advertising from the NFL games and waters down the $20 billion in television contracts. And, although I have no proof or evidence, I wonder if another risk to the sport could be a gambling scandal.

    Developments that range from the NFL’s Red Zone broadcast to Fantasy Football have the feel of gimmicks that appeal to gamblers, who, like derivative traders, seek ways to bet on the fractional aspects of the games. One revelation of the Tiger Woods humiliations was the amount of time pro athletes spend in Vegas, rubbing shoulders with high rollers, if not cocktail waitresses. Didn’t the golfer Phil Mickelson once bet $20,000 on the 28-1 Ravens to win the Super Bowl?

    For the fans, the game is about their teams winning and getting to the Super Bowl. For the owners, it’s about maintaining membership in the football oligopoly (worth about $250 million a year for each team, including the woeful Cleveland Browns). For the hot money, the games are a variation on off-track betting.

    As a fan of the New York Jets, now in the forty-first year of their rebuilding program, I might take a bleak view of the NFL, as part of my denial over Mark Sanchez’s wobbly arm and his “happy feet.” Maybe I am remorseful for all the time I spend listening to Mike Mayock explain zone blocking schemes or the A gap.

    At the same time, I share the views of former French president Georges Clemenceau, about an earlier League, that “of Nations.” At the Peace of Paris in 1919, he said: “I like the League. I just don’t believe in it.”

    Photo of NY Jets v Eagles game by Ed Yourdon

    Matthew Stevenson is the author of Remembering the Twentieth Century Limited, a collection of historical essays. He is also editor of Rules of the Game: The Best Sports Writing from Harper’s Magazine. He lives in Switzerland.

  • The Poverty Of Ambition: Why The West Is Losing To China And India – The New World Order

    The last 10 years have been the worst for Western civilization since the 1930s. At the onset of the new millennium North America, Europe and Oceania stood at the cutting edge of the future, with new technologies and a lion’s share of the world’s GDP.  At its end, most of these economies limped, while economic power – and all the influence it can buy politically – had shifted to China, India and other developing countries.

    This past decade China’s economic growth rate, at 10% per annum, grew to five times that U.S.; the gap was even more disparate between China and the slower-growing  E.U.,  Yet periods of slow economic growth occur throughout history — recall the 1970s — and economies recover. The bigger problem facing Western countries, then, is a metaphysical one — a malady that the British writer Austin Williams has dubbed “the poverty of ambition.”

    This lack of ambition plagues virtually every Western country. The ability to act has become shackled by a profound pessimism that according to a recent Gallup survey contrasts with the optimism found not only in rising states like China, India and Brazil, but also deeply impoverished places like Bangladesh.

    Attitudes have consequences. The rising stars of the non-Western world — from the United Arab Emirates to Singapore and China — are building cities with startling new architecture and bold infrastructure. Their entrepreneurs are expanding their operations across the planet.

    Of course, you can chortle at the outrageous overbuilding in places like Dubai, but the Western world might do better to appreciate the scope of their ambition. Indeed, for years New York’s Empire State building, erected  during the Depression, was derided as  ”the empty state building.” Today it’s visionary developers like Iraqi-born Istabraq Janabi who are planning unlikely  new structures even  in  troubled places like Ramadi, Iraq.

    The difference in ambition can be seen clearly at airports, which now serve as the entry halls of the global economy. A traveler to John F. Kennedy Airport, Heathrow, Charles De Gualle LAX or Dulles passes through decayed remnants of fading late 20th century buildings and technology. In contrast, airports in Dubai, Hong Kong and Singapore offer clean, ultra-modern facilities with often impressive design.

    The West’s retreat from space exploration further underscores its metaphysical poverty. Today, Europe and the U.S., the world’s historic leader in the field, are cutting back on plans to explore the cosmos, which has included a manned operation to the moon. President Obama wants NASA to focus more on issues regarding climate change instead. In contrast, the rising countries of Asia, notably China and India, have begun plans for manned flights to the moon and beyond.

    This divergence is not about resources; it is about the growing conviction in the West that moving forward is an illusion or, as the British academic John Gray’s puts it, “progress is a myth.”  Victorian empire-makers and intellectuals, like their republican American successors, believed perhaps naively in the potential of humanity, economic and technological progress. Today our intellectual and political classes have gone to the other extreme.

    The West’s politics are in the grips of two profoundly retrograde mentalities. One, a small-minded conservatism, harks back to the “golden” age of the 1950s when Western power faced only a flawed Soviet challenge. The idealistic but flawed commitment to imposing democracy by force of the Bush years has faded; it has been replaced by an obsession with taming a bloated public sector. While this focus may be justified, it is fundamentally more reactive than proscriptive.

    The Left, which once portrayed itself as the bastion of scientific rationalism, increasingly embraces neo-druidism, a secular form of nature worship. This tendency’s roots can be traced back to the “Limits to Growth” ideology of the early 1970s which projected, mostly mistakenly, that the planet was about to run out of everything from food to oil. Concerns over climate change have transformed this dismal sentiment into a theology, with carbon emissions treated as a form of original sin.

    The anti-progress nature of the new Left is unmistakable. Rather than seek ways to control climate change, suggests The Guardian’s George Monbiot, environmentalism is engaged in “a battle to redefine humanity.” Monbiot believes the era of economic growth needs to come to an inevitable denouement; that “the age of heroism” will be followed by the decline of the “expanders” and the rise of the “restrainers.”

    Europe, particularly the U.K., suffers acutely from metaphysical angst.  Once touted as the new great power by its leaders and their American claque, the E.U. is quickly dissolving along cultural and historical lines; this is especially evident in the division between the  resilient countries of the north (something like the Hansa trading states of the late Middle Ages) and the weaker countries along the periphery. For the most part, Europe no longer seems capable of doing much more than finding ways to control an unaffordable welfare state without tearing about its social net. The once cherished notion of a multi-racial “new” Europe largely has dissolved as immigration has devolved from a source of demographic and cultural salvation to a widely perceived threat to the E.U.’s economic and social health as well as security.

    Such defeatism usually has less success in the United States. But America’s “progressive” left increasingly resembles its European cousins.  Obama’s science advisor, John Holdren, has been a long-time advocate of the idea of “de-development,” the purposeful slowing of growth in advanced countries in order to protect the environment. The critical infrastructure needed to accommodate upward of another  100 million Americans — new dams in the west, intelligent development of our vast natural gas reserves and building new cities, airports and ports  – are not at the center of either party’s platforms. These could be financed largely with private sources, given the right incentives.

    Fortunately the West’s decline is not at inevitable. China, India, Vietnam, Brazil, South Africa all deserve their day in the sun, but this does not mean that Americans or Europeans should cower in the shadows. Western countries still possess much of the world’s cutting-edge technology and leading companies; the combined GDP for the E.U., North America and Oceania stands at over $33 trillion, almost five times that of India and China together.

    More important still, the political and cultural institutions of the West — with their liberal values — represent the best hope for a stable world of self-governing peoples. Does anyone in the West, particularly the progressives in the media and academia, really want a world run by Chinese despotism?

    The current financial crisis should serve as both a warning and a spur for a new focus on economic expansion. But this can only occur if the West can restore its belief in its future. This does not necessitate a return to the colonial attitudes of the past, but rather a keener appreciation of our unique human, physical and political advantages.

    Only the United States – by far the richest, largest and most populous Western nation — can lead such a revival. For one thing, the U.S. remains the world’s leading immigrant magnet and most diverse large country, all of which makes it the natural center of an evolving global society. Although immigrants pose some serious issues, University of Chicago scholar Tito Sananji notes that the U.S., along with Canada and Australia, seems to be doing a better job educating their newcomers than the continental European states.

    The U.S., Canada and Australia also possess resources, most critically food, that could benefit from growing demand in developing countries. Both North America and some European nations — notably the new Hansa of the Netherlands, Germany and Scandinavia – remain world leaders in scores of industrial endeavors, as well as technology- and culture-based industries.

    Together these Western countries can do much more to shape the global future than is commonly understood. But to do so this century they will need how to recover the animal spirits that drove their remarkable rise in the last.

    Joel Kotkin is executive editor of NewGeography.com and is a distinguished presidential fellow in urban futures at Chapman University, and an adjunct fellow of the Legatum Institute in London. He is author of The City: A Global History. His newest book is The Next Hundred Million: America in 2050, released in February, 2010.

    Photo by Wally Gobetz

  • A Bump in the Road to Chinese Urbanization?

    China has been urbanizing at a break-neck pace. Between 1980 and 2010, nearly China’s urban areas have added 450 million people, nearly 1.5 times the population of the United States. Nearly one-half (47%) of the nation’s population now lives in urban areas and the figure is expected to exceed 60% by 2030, according to United Nations data.

    According to The Asia Times, 230 million of these new residents are temporary migrants. They are people who have migrated from rural areas to take jobs in factories or other generally lower paid occupations. Under the nearly 60-year old Chinese residency permit system (“hukou”) citizens have either rural or urban residency rights. A principal purpose of this system was to limit the flow of rural residents to the urban areas.

    As Deng Xiaoping’s reforms took effect in the early 1980s, industrial production and exports skyrocketed and this required rural labor to migrate to the urban areas. Migrants were granted temporary status, but not permanent. It is possible, but difficult to transfer one’s hukou from rural to urban. Yet the demand for such transfers has been overwhelming.

    Yet, an article in the national newspaper, China Daily could mean a slowdown in the trend. The issue is the cost of living. Reporter Wang Yan notes that, for the first time, there is now a growing demand for transferring hukou residential status from urban to rural. There are currently no routine national procedures for such transfers.

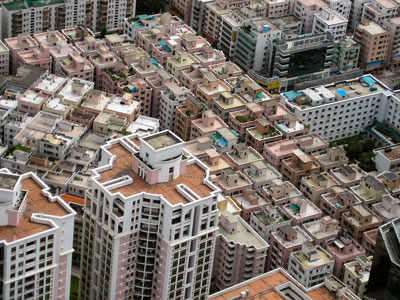
    A survey of 120,000 temporary migrant workers in urban areas working by the Chinese Academy of Social Sciences research center found that only 25 percent would be interested in trading their rural residency permits for urban residency permits. The survey covered working age adults in 106 prefectures with large urban areas.

    The driving factor is economic. As in the United States, where differences in housing affordability are strongly associated with domestic migration trends, costly urban housing in China could be fueling a new attraction for rural areas. The cost of housing has risen substantially in China’s urban areas. At the same time, the cost of housing is near-zero in the rural areas. Further, residents of rural areas within prefectures with large urban areas have the hope of selling their land for urban development in the longer run and making a substantial profit. However, this new-found affection for the countryside is likely to be limited to areas relatively close to urban centers, to which rural residents can commute for better paying jobs.

    The government has announced plans to reform the hukou residency permit system. According to Zhang Yi, director of the Chinese Academy of Social Sciences research center is a system that “ensures freedom of migration.”

    The United Nations projections may be right. The stated preferences identified in the Chinese Academy of Social Sciences survey may not ultimately reveal themselves in actual behavior. But predictions are no more than predictions.

    Picture: Shenzhen: Luxury Housing (foreground) and Migrant Housing (background)

  • Toronto: Three Cities in More than One Way

    The issue of income disparity in Toronto has once again been brought into the public eye by a December 15th report by University of Toronto Professor David Hulchanski. The report, “The Three Cities Within Toronto,” points to a growing disparity in incomes between Downtown Toronto, the inner suburbs, and the outer suburbs of the city. The report demonstrates that between 1970 and 2005 the residents of the once prosperous outer suburbs have been losing ground compared to the now wealthy downtown core. The results for the inner suburbs have been mixed.

    In 1970, 66% of city neighbourhoods were considered middle income. Only 15% were considered high or very high, and 19% were low or very low. In 2005, only 29% of neighbourhoods were considered middle income. The number of high or very high income neighbourhoods rose to 19%, while low and very low income neighbourhoods made up a staggering 54% of neighbourhoods.


    The news isn’t all bad. After all, the downtown core is now one of the most desirable places to live in North America, and many of the formerly low income neighbourhoods have gentrified, or are in the process of doing so. However, many of the city’s traditional suburbs have been decimated. The former cities of Etobicoke and Scarborough used to be middle class. Not so much anymore.

    In real dollar terms, even the majority of the very low income areas have become wealthier. The trouble with poverty statistics is that they focus on relative poverty, rather than absolute poverty. This means that if Etobicoke’s average income doubled tomorrow, the downtown core would all of a sudden be considered poor. This is a major limitation. Toronto isn’t exactly turning into a Canadian Detroit.

    The report rightly points to the need for greater mobility in the outer suburbs. Given that the most lucrative jobs are typically downtown, many young professionals and recent graduates living outside of the core need to be able to get downtown cheaply and quickly in order to build their careers. Where the report goes wrong is that it recommends stricter land use regulations, stronger rent controls, and the revival of the flawed Transit City plan that Mayor Ford vigorously campaigned against in the recent election.

    It is easy for academics to blame a lack of social welfare spending, or suburbanization for the problem. The real problem is the loss of local policy making power resulting from amalgamation. For the most part, the areas losing ground the fastest are the formerly middle class suburbs amalgamated into the city. In contrast the “exurbs” just outside of city boundaries have thrived. This is no coincidence. The real takeaway from this study is that the suburbs have different needs than the central core. By attempting to accommodate the needs of both, the megacity has benefitted neither. Short of de-amalgamation, the only hope for the city is to substantially decentralize policy making. No amount of spending can make up for the loss of local autonomy.

    Policies have different effects in different types of cities. Take the treatment of automobiles. It might make sense to discourage automobile usage in downtown Toronto, but the benefits of doing so in Vaughan or Pickering would be questionable at best. Similarly, mandating that every commercial establishment have a public washroom probably makes sense as a public health measure in downtown, where public urination is an issue, but not so much in suburban Markham, or Richmond Hill.

    Making sensible regulations for a small, relatively homogenous area isn’t all that difficult. Applying these regulations to a large, demographically diverse area can help some areas and hurt others. It’s not that regulations need to be a zero sum game. People in Etobicoke wouldn’t be affected if, say, maximum parking allotments were tightened in the downtown core. They would be affected if they were tightened throughout the entire megacity. Similarly, increasing maximum parking allotments might hurt the core and help the suburbs. The current one size fits all approach sometimes benefits the core and sometimes benefits the suburbs, but ever both.

    Perhaps more important than city wide regulations is the centralization of taxing power. Since the merger, the city now sets tax rates across the entire megacity. This also allows the city to control the ratio of residential to non-residential taxes. The city of Toronto has the highest ratio of non-residential to residential taxes in Ontario. This means that businesses carry a higher share of the tax load in the city than anywhere else in the province. The combination of tax and regulatory policies in the city have lead the Canadian Federation of Independent Businesses to rank Toronto as the second least business friendly city in Canada. On a scale of 1-100, Toronto came in at 33, slightly ahead of Vancouver’s 31. Meanwhile, the rest of the (Greater Toronto Area) GTA is near the top, at 61. Neighbouring Oshawa took the top spot in Ontario with 69.

    GTA Area Cities by CFIB Entrepreneurial Cities Policy Score

    Rank (Ontario)

    City

    Score

    Driving Distance to Yonge and Bloor

    1

    Oshawa

    69

    0:45

    6

    GTA (Excluding Toronto)

    61


        Mississauga

    61

    0:27


        Brampton

    61

    0:41


        Richmond Hill

    61

    0:32


        Markham

    61

    0:32


        Vaughan

    61

    0:32

    16

    Hamilton

    55

    0:58

    19

    Guelph

    54

    1:15

    24

    Barrie

    52

    1:16

    27

    Brantford

    51

    1:20

    30

    Kitchener

    48

    1:23

    33

    Toronto

    33


        Etobicoke

    33

    0:20


        Scarborough

    33

    0:21

    Now the share of non-residential to residential taxes in Toronto may actually make sense downtown. The core is home to the third biggest financial sector in North America. These jobs are heavily concentrated in the downtown core.

    Downtown Toronto isn’t competing with low tax Vaughan or Barrie for these jobs. They are competing with high tax cities like New York and Chicago. This means that employment in the core is not as easily chased off by taxes and regulations than in the suburbs. But in industries like wholesale and manufacturing, which are far more important outside of the core, employment can easily relocate to Barrie, Mississauga, Oshawa, and so forth. Indeed, jobs have been leaving the city since before the recession hit.

    Since 2004 Downtown and North York have prospered but the rest of the city has lost jobs. This should make the results of the Professor Hulchanski’s report unsurprising. The financial sector isn’t enough to keep the entire city employed or lift wages in the city-controlled suburban rings. As a a result despite the thriving financial sector, Toronto was dead last in the GTA in terms of median incomes.

    To turn this around, the city must decentralize decision making power so the suburban communities can come up with their own economic development strategies. No matter how much the city improves transit to the outer suburbs, they will not be able to significantly increase median incomes without creating more jobs. The financial sector will continue to grow, but many of jobs created in this sector require specialized training, and thus go to people from outside of the city. This doesn’t do much for former manufacturing workers in Scarborough and Etobicoke. Growth of the financial sector combined with the dispearance of blue collar jobs together guarantee continuing income disparities in the city.

    Below is previously published data from Professor Hulchanski that highlights how badly blue collar sections of the city have been hit.


    Fundamentally, a strong focus on financial and other so-called “creative class” jobs will do little for these areas. The above map was created by Richard Florida’s Martin Prosperity Institute. It shows that most creative class jobs are clustered around the subway, but this doesn’t mean that expanding rail transit will expand creative class employment. Building a light rail line through a neighbourhood doesn’t suddenly transform the residents into artists and physicians. It may attract more artists and physicians, but this could actually hurt local residents by driving up rent and property values without creating jobs for them. Below is a map of educational attainment by ward. The darker the colour, the higher the number of residents with a bachelor’s degree or higher.

    The real problem is that a focus on elite jobs creates exactly the kind of bifurcation that progressive complain about. Given that city wide business policies are tailored towards creative class type occupations, it is unlikely that price sensitive manufacturers will find any reason to locate within city boundaries, rather than setting up shop in Mississauga or Barrie.

    Indeed, for all the temptation by urbanists to point to Toronto’s suburban ring as an example of the decline of suburbia, the peripheral suburban areas outside of city limits have been booming. Here is a map of growth in the GTA between 2001-2006. While Toronto grew modestly, suburban cities Milton, Brampton, Vaughan, Richmond Hill, Markham, Ajax, and Whitby all grew by at least 20%. Even Oshawa, which was hit hard by the decline of the auto sector, has managed to survive, and indeed maintained a higher median income than Toronto during this period. Regional rival Mississauga eclipsed Toronto’s growth rate, and emerging regional player Barrie grew by over 20%.

    In short, despite its strong financial core, Toronto is losing its standing as the go-to destination in the GTA. And it could get worse. Mississauga is working hard to lure financial services and advanced manufacturing jobs from Toronto. Several other cities, such as Guelph and Waterloo are actually competing for the very creative types that Toronto’s policies are tailored to attract. Other cities, such as Barrie are working hard to cannibalize what is left of Toronto’s manufacturing and distribution sectors. Were it not for amalgamation, Etobicoke or Scarborough could just as easily have undertaken a similar strategy to attract blue collar jobs.

    The Three Cities report identifies serious regional disparities in Toronto. Unfortunately, it doesn’t provide much insight into how to fix the problem. Expanding transit options will only go so far towards this. Building more light rail may raise median incomes by attracting wealthier people to these neighbourhoods. Ironically, this will only widen the income gap. The real challenge is finding out how to create opportunities for blue collar jobs in suburban Toronto. Unfortunately, amalgamation has imposed one size fits all policies that may work downtown, but utterly fail in the suburbs and continue to drive people to the periphery outside the city limits. Ironically, the very policies that seek to halt “sprawl” may well end up exacerbating it.

    Toronto Skyline photo by Smaku

    Steve Lafleur is a public policy analyst and political consultant based out of Calgary, Alberta. For more detail, see his blog.

  • 2011: Jobs Vs The Deficit

    The roadmaps showing the way out of our 1.4 trillion dollar federal deficit almost always begin at the same starting points. During 2010, it became taken-for-granted that today’s record-setting red ink is a result of unrestrained government spending — especially stimulus spending. And the idea that the economic upturn in jobs and growth will begin with deficit reduction has become widely perceived as ‘common sense’.

    The December release of the federal debt panel’s Simpson-Bowles report crystallized a mass re-set of priorities, with politicians and pundits freely equating solutions to ‘the deficit crisis’ with economic recovery. While conservatives and liberals reacted differently to the report’s specifics, the assumption that immediate deficit reduction would be healthy and virtuous was largely accepted. The president has also pledged to follow this path.

    The media, meanwhile, geared up with a national debt counseling forum. November ended with three out of four of the lead columns in the Washington Post providing advice on the subject. US News and World Report called on the president to get busy and “name a deficit Czar”. Deficit reduction? There’s an app for that. A prominent New York Times feature titled “You Fix the Budget” included an interactive Iphone/Ipad application that urged readers to “Make your own plan and share it online”. Jobs and growth have inspired no such apps thus far.

    Are congressional free-spending ways really the problem? Counter-intuitive though it may seem, the strongest evidence indicates that the deficit is tied to many political expenditures that are mandated and locked in place, and not to any ‘spending spree’.

    Consider the sharp increase in expenditures for SNAP (the old “food stamps” program), or for unemployment benefits. While the guidelines to qualify for these benefits have stayed roughly the same, payments have ballooned — in the case of SNAP, 72 percent from 2007 to 2009, as detailed in a report from The Levy Economics Institute of Bard College. The federal government did not choose to increase this spending. And the financial threshold for receiving benefits was not lowered. But many more families slid out of the middle class and into the safety net. As the economy tanked, the recession itself automatically triggered increased federal outlays, which in turn fed the deficit.

    In other words, the system is performing as we originally intended, and hoped, that it would. Like a truck engine suddenly expected to haul a much heavier load, the federal budget is burning more gas… and by doing so, is able to continue uphill, carrying individuals, families, and businesses out of financial disaster.

    If calls to drastically reduce the deficit succeed, and federal spending is radically turned down now, the result will be comparable to cutting the engine’s fuel supply. The roll back downhill will be swift, horrific, and potentially out of control.

    For a glimpse of how deficit slashing could play out, take a look at Portugal. Already, there are signs that recent austerity measures will actually increase its government’s fiscal deficit, a consequence of falling tax revenue and rising social needs as a result of increased unemployment. Portugal’s central government lost ground in the first nine months of this year as its deficit rose by about $280 million, even as actions to restrain it were set in motion. The pursuit of yet more deflationary spending cuts and tax increases could continue the vicious cycle.

    Crisis-related spending, whether oriented toward businesses or households, has been trashed as costly. But shouldn’t it be obvious that business and household income and spending help the private sector, which needs to thrive for the economic growth we need?

    Liberal think-tanks are not alone in their view that running deficits is a logical and necessary response to a severe recession. Even David M. Walker, former CEO of the Peter G. Petersen Foundation, an anti-deficit think tank dedicated to austerity, has joined Lawrence Mishel of the Economic Policy Institute in acknowledging that the United States must address “jobs now and deficits later”; Mishel and Walker have called for two years of elevated deficits.

    And the public does not disagree, despite the Tea Party street-theater shows. In this autumn’s CBS News Poll, 54 per cent saw the Economy/Jobs as the nation’s most important problem, compared to 3 per cent for the Budget Deficit/National Debt; the CNN/ Opinion Research Corp figures were almost the same. Fox News and Bloomberg polls also showed that concerns about the economy and jobs considerably — by about 20 per cent — trumped the deficit and spending.

    Gestures to counteract deficits with measures such as the pay-freeze on federal salaries, or with anti-earmark legislation, are purely symbolic at best and, in the case of salaries, counterproductive.

    Similarly, calls for the deficit to be pegged to no more than 21 percent of Gross Domestic Product, as in the Simpson-Bowles report, or 20 percent, as suggested by Representative Mike Pence (R-Indiana), make no sense, and provoke one simple and as yet unanswered question: Why?

    We are indeed in a crisis. But the crisis is jobs, and the solution is to grow the economy. Deficit reductions would have a negative impact on both. The deficit hawks who demand chicken feed-sized cuts have yet to provide data — let alone logical arguments — that show how these cuts could lead to job creation and growth.

    The deficit should not be treated as the main problem when it is, in reality, only the product of a poorly functioning economy. There are many good reasons that a reasonable deficit reduction plan should be early on the agenda when the US economy is once again strong. But the austerity measures being floated today range from meaningless to ludicrously dangerous. There is no reason that this so-called crisis needs to be acted on while the economy is weak. In deficit reduction — as in navigating turns in the road — timing is everything.

    Photo by Premshree Pillai

    Dimitri B. Papadimitriou is President of The Levy Economics Institute of Bard College. He recently co-edited, with L. Randall Wray, The Elgar Companion to Hyman Minsky.

  • The Amazing Truth About PISA Scores: USA Beats Western Europe, Ties with Asia

    Once we correct (even crudely) for demography in the 2009 PISA scores, (PISA is the Program for International Student Assessment) American students outperform Western Europe by significant margins and tie with Asian students. Jump to the graphs if you don’t want to read my boring set-up and methodology.

    The main theme in my blog is that we shouldn’t confuse policy with culture, and with demographic factors.

    For instance, education scholars have known for decades that the home environment of the kids and the education levels of the parents are very important for student outcomes. We also know that immigrant kids have a more difficult time at school, in part because they don’t know the language.

    Take me as an example. The school me and my brother attended was in a basement in Tehran, had no modern resources, and largely focused on religious indoctrination. But we had a good home background. Our father attended a college in the west a few years (our mother didn’t, despite stratospheric scores test scores, because at the time you didn’t send a good Kurdish girl to another city to study). So we did well in school. Conversely, the first few years in Sweden I had bad grades, in part because I didn’t master the language.

    The point I am trying to make is that the school in Sweden was objectively superior to the school in Iran. But I scored lower in Sweden, because of factors outside the control of the education system. If you want to compare the effect of the school, you have to isolate those external factors and make an apples-to-apples comparison.

    However, this is not at all how the media is presenting the recent PISA scores. For example there is a lot of attention of the score of the kids in Shanghai, the according to the NYT is supposed to “stun” us or something.

    It’s dumb to compare one of the most elite cities in a country with entire nations, and to draw policy-inference from such a comparison. Shanghai has 3 times the average income of China! It is also naive to trust the Chinese government when they tell us the data is representative of the entire nation. Either you compare Shanghai to New York City, or you compare the entire country of China, including the rural part, with other large nations. Most of the news and policy conclusions we read about PISA-scores in the New York Times is thus pure nonsense.

    1. Correcting for the demography:

    In almost all European countries, immigrants from third world countries score lower than native born kids.

    Why? No knows exactly why. Language, culture, home environment, income of parents, the education level of the parents and social problems in the neighborhood and peer groups norms are among likely explanations. But it is generally not true that the schools themselves are worse for immigrants than natives. In welfare states, immigrants often (thought not always) go to the same or similar schools and have as much or likely more resources per student.

    So the fact that immigrant students in mixed schools do worse than Swedish kids used to a few decades ago in homogeneous schools does not it out of itself prove that Swedish public schools have become worse.

    Of course, the biggest myth that the media reporting of PISA scores propagates is that the American public school system is horrible.

    The liberal left in U.S and in Europe loves this myth, because they get to demand more government spending, and at the same time get to gloat about how much smarter Europeans are than Americans. The right also kind of likes the myth, because they get to blame social problems on the government, and scare the public about Chinese competitiveness.

    We all know that Asian students beat Americans students, which “proves” that they must have a better education system. This inference is considered common sense among public intellectuals. Well, expect for the fact that Asian kids in the American school system actually score slightly better than Asian kids in North-East-Asia!

    So maybe it’s not that there is something magical about Asian schools, and has more to do with the extraordinary focus on education in Asian culture, with their self-discipline and with their favorable home environment.

    There are 3 parts to the PISA test, Reading, Math, and Science. I will just make it simple and use the average score of the 3 tests. This is not strictly correct, but in practice it doesn’t influence the results, while making it much easier for the reader. (the reason it doesn’t influence the results is that countries that are good at one part tend to be good at other parts of the test.)

    The simplest thing to do in order to get an apples-to-apples comparison is to at least correct for demography and cultural background. For instance, Finland scores the best of any European country. However first and second generation immigrant students in Finland do not outperform native Swedish, and score 50 points below native Finns (more on this later).

    On PISA, 50 points is a lot. To give you a comparison, 50 points is larger than the difference between Sweden and Turkey. A crude rule of thumb here is that 50 points is 0.5 standard deviations.

    The problem is that different countries have different share of immigrants. Sweden in 2009 PISA data had 17%, and Finland 4%. It’s just not fair to the Swedish public school system to demand that they must produce the same outcome, when Sweden has many more disadvantaged students. Similarly schools with African-American students who are plagued by racism, discrimination, crime, broken homes, poverty and other social problems are not necessarily worse just because their students don’t achieve the same results as affluent suburbs of Chicago. In fact, the most reliable data I have seen suggests that American minority schools on average have slightly more money than white schools. It’s just that the social problems they face are too much to overcome for the schools. It is illogical to blame the public school system for things out of its hands.

    So let’s start by removing those with foreign background immigrants from the sample when comparing European countries with each other. I define immigrants here as those with a parent born outside the country, so it includes second generation immigrants. This is fairly easy for Europe.

    In the case of America, 99% of the population originates from other countries, be they England, Italy, Sweden, India, Africa, Hong-Kong or Mexico. If we want to isolate the effect of the United States public school system, we should compare the immigrant groups with their home country. For those majority of Americans whose ancestors originate from Europe, we obviously want to compare them with Europe. For some groups, such as Indians, this is inappropriate. The reason is that mainly the most gifted Indians get to migrate to America to work or study.

    However, as I have argued previously, there is strong reason to believe that this problem of so called biased selection does not apply to historic European migration to the United States at the aggregate level. The people who left Europe were not better educated than those who stayed. Immigrants were perhaps more motivated, but often poorer than average.

    So similar to my comparison of GDP levels, let us compare Americans with European ancestry (about 65% of the U.S population, and not some sort of elite) with Europeans in Europe. We remove Asians, Mexicans, African-Americans and other countries that are best compared to their home nations. In Europe, we remove immigrants.

    The results are astonishing at least to me. Rather than being at the bottom of the class, United States students are 7th best out of 28, and far better than the average of Western European nations where they largely originate from.


    The mean score of Americans with European ancestry is 524, compared to 506 in Europe, when first and second generation immigrants are excluded. So much for the bigoted notions that Americans are dumb and Europeans are smart. This is also opposed to everything I have been taught about the American public school system.

    For Asian-American students (remember this includes Vietnam, Thailand and other less developed countries outside Northeast Asia), the mean PISA score is 534, same as 533 for the average of Japan, South Korea, Singapore and Hong Kong. Here we have two biases going in opposite directions: Asians in the U.S are selected. On the other hand we are comparing the richest and best scoring Asian countries with all Americans with origin in South and East Asia.


    2. Policy-Implications

    Libertarians in the United States have often claimed that the public school system (which has more than 90% of the students) is a disaster. They blame this on government control and on teachers unions. However, it is completely unfair to demand that a public school in southern California where most of the students are recent immigrants from Mexico whose parents have no experience in higher education (only 4% of all Mexican immigrates have a college degree, compared to over 50% of Indian immigrants) should perform as well as a private school in Silicon Valley.

    The libertarians have no answer why European and Asian countries that also have public school systems score higher than the United States (unadjusted for demography). Top scoring Finland has strong teacher unions, just as California.

    Similarly, the left claims that the American education system is horrible, because Americans don’t invest enough in education. The left has no answer when you point out that the United States spends insanely more than Europe and East Asia on education. According to the OECD, the United States spends about 50% more per pupil than the average for Western Europe, and 40% more than Japan.


    Another policy implication is that Europe can learn from American public schools, which appear to be better than most European countries. I can only compare Sweden with the U.S, but I can tell you that from my experience, the American system is superior. I always thought this was just anecdotal evidence, but I am beginning to realize that American schools are indeed better.

    For example, we don’t have any real equivalent to Advanced Placements classes. We have cheaper and worse textbooks. The teachers on average have far less education. I could go on.

    Nor is it any longer a mystery to me why Americans spend so much more on education and (falsely appear) to get out less in output.

    But of course the biggest implication is that most Europeans and all American liberals have lost the bragging right about their side being smarter than Americans.

    3. Immigrant PISA scores compared to natives

    This is again the mean difference of the 3 parts of PISA.


    Australia is the only country with a negative gap, which means Australian immigrants actually score better than natives. Canada is similar. The Australian-Canadian skill based migration system is at work here, generating less inequality (even short term).

    The other pattern appears to be that the gap is almost constant in the remaining Western European countries. This may be important to keep in mind, whenever people claim that uniquely Swedish policies are causing poor immigrant educational outcomes.

    Tino Sanandaji is of Kurdish origins, and was born in Iran in 1980. In 1989 he moved together with his mother and brother to Sweden. He has a degree from the Stockholm School of Economics, his M.A in Economics from the University of Chicago and is expected to receive his PhD in Public Policy from the University of Chicago in 2011. His work has appeared in The Wall Street Journal, The New York Times, National Review, and numerous Swedish newspapers. Tino has been a resident of Hyde Park Chicago, since 2004.

  • A Billion Dollar Federal Grant to Reduce Travel Time by 48 Minutes

    The Illinois Department of Transportation has reached a cooperative agreement with Union Pacific and Amtrak that will permit the release of a $1.1 billion federal high-speed rail grant to the state of Illinois to fund passenger rail improvements between Chicago and St. Louis. The agreement was proclaimed by state and federal officials as “historic” and hailed as “one giant step closer to achieving high-speed passenger service between Chicago and St. Louis.” But stripped of its rhetoric, the announcement only reveals how inadequate and cost-ineffective the Administration’s “high–speed” program is turning out to be.

    The billion dollar program of improvements to be completed under the Cooperative Agreement will enable “higher-speed” trains to travel between Chicago and St. Louis in 4 hours and 32 minutes, cutting present trip time by 48 minutes when the planned improvements are completed by 2014. As the Springfield Journal Register pointedly observed, that is 22 minutes longer than the trip time of 4 hours and 10 minutes promised in the original grant application. A four-hour trip time was also pledged in the White House press release announcing the project last January.

    Currently Amtrak operates passenger service between Chicago and St. Louis at an average speed of 53 mph. The announcement is silent about the expected improvement in the average speed when the project is completed but our calculations suggest that the planned improvements would increase average speeds only by 9mph, to 62 mph. Of the 284-mile Chicago-St. Louis route, a total of 210 miles of track will be ready for 110 mph operation under the present grant. Upgrading the remaining 74 miles of the line, between Dwight and Chicago, would have to await further federal aid. The State of Illinois originally requested $3 billion to complete the total project.

    From what we can read between the lines, Union Pacific drove a hard bargain as a condition of signing the cooperative agreement. “Our priority in working out this agreement,” the company’s CEO, Jim Young said in a prepared statement, “was to protect Union Pacific’s ability to provide the exceptional freight service our customers need and expect. … This agreement allows us to deliver on those customer commitments.” The message is clear: UP’s freight operations will take precedence over passenger rail operations. The route, we are told, is expected to accommodate as many as 22 freight trains a day ultimately.

    Union Pacific also seems to have won out on another contentious issue. The cooperative agreement is silent about any penalties the railroad might face if on-time performance standards for passenger service are not met – a condition that the Federal Railroad Administration had insisted upon in its initial (and later withdrawn) guidelines concerning the terms of the cooperative agreements.

    The announcement, released on December 23, barely two weeks before a new Congress takes office, was meant to give a boost to a program that is barely limping along. The record speak for itself. Two major high-speed rail projects — in Wisconsin and Ohio — have been cancelled by the incoming governors because of the cost burden the operation of the new rail services would impose on the state taxpayers. The Florida Tampa-to-Orlando high-speed line is still in doubt as Gov.-elect Rick Scott ponders its cost and economics. The California high-speed rail program, with its starter line in the sparsely populated Central Valley, has been ridiculed as “the railroad to nowhere.” And several HSR cooperative agreements remain stalled in contentious negotiations. It’s not surprising that the Administration would be anxious to show progress and refute the widely held impression that the program is on its last legs. This is not how it was all supposed to end.

    Whether the program will, indeed, come to an untimely end will depend on the next Congress. To the incoming Republican lawmakers, eager to make good on their promise to cut federal spending, any unspent HSR funds will present a tempting target for rescission. In addition, future appropriations for the program will have to compete with other urgent transportation priorities amid pressures to trim discretionary spending and Congressman Mica’s announced intent to revisit the program and refocus it in ways that, in his words, “makes sense.”

    It is not a scenario that offers high-speed rail advocates much cheer in the New Year.

    Ken Orski is a former senior U.S. Transportation Department official and publisher of Innovation NewsBriefs, a transportation newsletter now in its 21st year of publication.