Blog

  • High Speed Rail: Fast Track To Nowhere

    Given that Warren Buffett ponied up $44 billion in cash and stock to take private the Burlington Northern Santa Fe Railroad, I wonder why President Obama is betting that the way to lift the country out of stagnant growth is to invest another $50 billion, in public funds, to swing aboard the dream of high-speed intercity rail.

    According to the administration, new money needs to be allocated to such high-speed rail (HSR) projects as those between San Diego and Sacramento, Orlando and Tampa, and — my personal boondoggle favorite — the DesertXpress between Los Angeles and Las Vegas, a $4 billion bet that getting high-rollers to the blackjack tables will lift the U.S. economy out of its doldrums.

    To establish some track cred, I spend much of my life dreaming about trains, consulting timetables on how to catch them, and plotting trips that might end up on night trains to Butterworth (the station for Penang) or Iasi (change in Ungheni, on the Moldovan border).

    More to the point, I have ridden nearly all the high-speed trains — in China, Japan, and France — that are being held as speeding examples of what the United States could build if Congress would fork over another $50 billion, and if the President could appoint a railroad czar with the acumen of E. H. Harriman.

    Painful as it is for me to admit, the $50 billion high-speed stimulus package is a way to lay track to nowhere.

    Take the rail link between Tampa and Orlando that imagineers hope will shuttle theme-parkers at speeds reaching 186 m.p.h. President Obama has already thrown $1.25 billion at the line. Presumably, the named expresses will be The Absentee Balloter and The Recount.

    Local officials have been busy buying rights-of-way and planning stations in their home districts, although, oddly, downtown Orlando is given a miss.

    When the stimulating project is finished for close to $3 billion, a family visiting Disney World can drive to the station, catch a high-speed train to Lakeland, pay a cab driver to take them to the Detroit Tigers spring training facility, and watch a game. After the game, to get back to their hotel, they would do the trip in reverse. Or they could drive to Lakeland in the hour projected on MapQuest. What would you do?

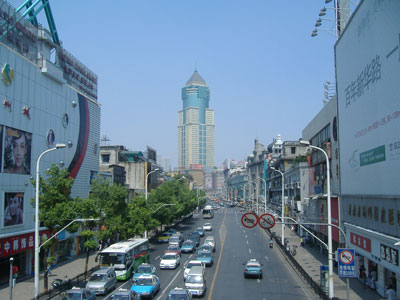
    The reason high-speed rail has more allure in Europe is because people live in cities. Nor do they like driving their cars on the cobblestones of historic quarters. In China, cities are megalopolises and few Chinese own cars or want to drive them across the vast country. France is a one-city country, so all rail lines lead quickly to Paris, as Louis XIV would have wanted.

    In Target-specked America, everyone has a car, lives out-of-town (“we like it here”), and, except for a few New Yorkers, drives everywhere, except when they fly. Orlando might be the most car-centric suburban cluster in the country.

    Not long ago, I had to drive from my Orlando motel just to find dinner. Is it remotely possible that Floridians will hop a high-speed train to rush them into downtown Tampa, which after 6:00 PM, when I was last there, looked like Death Valley?

    I can imagine Chicagoans taking a fast train to St. Louis, as opposed to flying out of O’Hare. But normal trains, and lots more of them, that reached the 100 M.P.H. speeds of the 1930s would suffice in most corridors.

    What logic explains betting public billions on a concept — intercity rail transportation — that the same government has devoted countless resources to destroying? Through most of the twentieth century, the American government used public money to lay down roads and interstates, and to subsidize airports, that choked off demand for passenger rail service.

    Federal bodies like the Interstate Commerce Commission, which regulated the profits out of the industry, killed off the national jewel that was the railroad network in the 1920s, with its 250,000 miles of track.

    It is doubtful whether the combined forces of the Texas Railroad Commission, Jay Gould, railroad baron Daniel Drew, and Leland Stanford, could have kept passenger service alive when confronted by a government that lived by the rail credo of William Vanderbilt, who said: “The public be damned.”

    Between the 1970 collapse of the Penn-Central and the 1980 passage of the Staggers Act — President Carter’s successful deregulation of the industry — most Class I railroads flirted with bankruptcy, earning less than one percent on their capital, and were unable to set rates competitively.

    The Staggers Act got the government off the rails; since then, the vital signs of the business have flourished to the point of attracting Warren Buffett’s capital. Trackage has been rationalized from 270,623 to 160,734 miles. Container traffic has grown from three to twelve million. Productivity has more than doubled, and, adjusted for inflation, prices are down (although the big coal companies hate deregulation, and they are forty-five percent of the business).

    I mourn the loss of such evocative railroad names as Grand Trunk, Boston & Maine, Nickel Plate, and Chicago & Alton (for which my grandfather worked). Nonetheless, from more than thirty failing companies, mergers have produced five thriving Class I railroads. The industry employs 164,439 works at an average annual wage of $72,836. Even the government made a profit by spinning off Conrail.

    Despite such a success story, renewed federal intervention threatens the freight revival. A Bushism called Positive Train Control, a computer system to reduce accidents and allow tighter spacing between trains, will cost the industry $15 billion, although there’s little proof that it will work better than what Casey Jones would have known as the “dead man’s hand” (a grip that stops the train if the engineer dies).

    The new stimulus package represents the government belief that it understands the passenger business better than either the industry or the capital markets, neither of which wants in on any high-speed rail action. (You would think the Vegas Highball would tempt Wall Street.)

    More to the point, the government’s record with Amtrak ought to disqualify it from any say in how to run a railroad.

    Freight companies are leery of high-speed rail because of what it might do to their rights-of-way. Many plans project HSR running on freight lines, which are notorious for “putting the varnish in the hole.” Meaning: let the passengers wait on a siding while a freight train goes through.

    I love trains, so I take Amtrak often and everywhere, and it’s an endless disappointment, with late trains, cold food, clogged toilets, and indifferent “customer service representatives.” Even though I collect its schedules and prowl its web site, Amtrak reminds me of Aeroflot.

    Nor is Amtrak’s meandering route system anything more than the arteries of a patronage network that would warm the heart of E.H. Harriman, who knew all about railroad patronage. Remember Mark Twain’s aside: “I think I can say, and say with pride, that we have some legislatures that bring higher prices than any in the world.”

    Before the United States rushes further into high-speed rail, it needs first to decide whether passenger rail service should be a public or private business. A white paper is due out this fall, but I am not holding my breath.

    Personally, I like the English model, flawed as it may be, in which BritRail (the U.K. Amtrak, but with cold pork pies) was privatized, and routes around the country were sold to private railways. A government corporation, albeit one starved for capital, held on to the track and infrastructure.

    On the surface, anyway, British trains are now shiny, clean, faster, and a pleasure to ride. The airline Virgin has some trains, and newer lines, like Eurostar, have come into business. It used to take BritRail ninety minutes to chug out to Cambridge from central London. Now two companies compete on the line, and the trip is forty-five minutes.

    I doubt that Warren Buffett wants to get the Burlington Northern back into the passenger business. His bet is that he can monopolize container traffic from Asia to Chicago and maybe, someday, with another deal, to New York.

    With proper incentives, why wouldn’t a private company bid for the line between Boston and Washington, or San Diego to Los Angeles? Or maybe Disney could integrate the Orlando-Tampa train into its monorail? At least it could fill the seats without stimulus money.

    Matthew Stevenson is the author of Remembering the Twentieth Century Limited, winner of Foreword’s bronze award for best travel essays at this year’s BEA. He lives in Switzerland (near the station).

    Photo: Amtrak (although this particular one is the Pacific Surfliner in Del Mar, California)

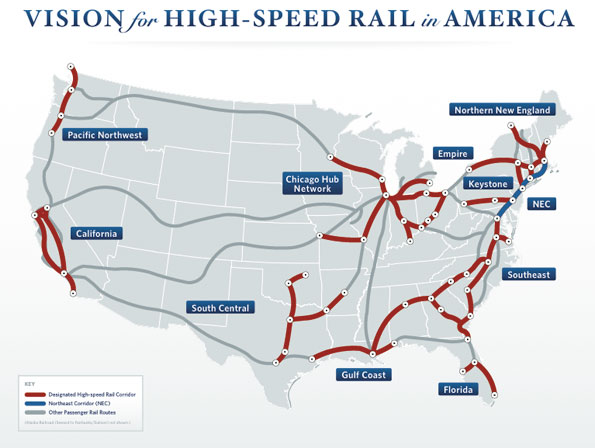
    Map: The White House

  • The Commonwealth Bank of Australia/UBS-Demographia Data Dispute

    The Age (Melbourne) headlined a story “CBA Accused of Choosing its Facts.” CBA is the Commonwealth Bank of Australia, while UBS is the Swiss investment house. Commonwealth produced a report comparing housing affordability in Australian metropolitan areas to international metropolitan areas (Australian Housing and Mortgages: CBA Mortgage Book Secure). According to The Age:

    Investment forums and housing blogs were alive with talk yesterday that an 18-page presentation used by the bank had replaced unfavourable housing affordability figures with data showing housing costs were not out of step with other cities in the world.

    One slide compared Australian housing affordability to several cities, citing figures from a combination of the US urban planning research house Demographia and the investment bank UBS.
    The slide showed housing in Sydney and Melbourne was more affordable than cities such as San Francisco, New York and Vancouver. But it used UBS data exclusively for the Australian cities, and Demographia data for the overseas cities.

    The data were not comparable. Commonwealth relied upon Median Multiple data (median house price divided by median household income) from the 6th Annual Demographia Housing Affordability Survey for international metropolitan areas. However, Commonwealth used a median/average multiple (median house price divided by average household income) calculated by UBS, the Swiss investment house, for Australian metropolitan areas. These are very different indicators.

    There would have been nothing wrong with having used the median/average multiple, had it been shown for all metropolitan areas, Australian and international. However, comparing the median/average multiple to the Median Multiple is invalid. Average household incomes are routinely higher than median household incomes and the use of an average income figure inappropriately biases Australian housing affordability relative to international metropolitan areas.

    For example, the UBS median/average multiple for Sydney is reported by Commonwealth to be 6.2. Commonwealth finds Sydney to be more affordable than San Francisco’s, which it indicates at 7.0. However, the San Francisco figure is the Median Multiple and the comparable figure for Sydney is 9.1, making Sydney less affordable than San Francisco

    In fact, had the UBS median/average multiple been used for all metropolitan areas, including the international metropolitan areas, it is likely that the gap between Australian metropolitan areas and international metropolitan areas would be of similar magnitude to that shown in the Demographia International Housing Affordability Survey.

    From time to time, various interests have suggested alternate measures of housing affordability for Australia and then compared or suggested comparison to our Median Multiple data. Of course, that is invalid.

    The Age article by Eric Johnston was carried in other Fairfax Media outlets such asThe Sydney Morning Herald and the Brisbane Times, and the subject has been covered by financial blogs.

    Note: Author Wendell Cox of Demographia.com and Hugh Pavletich of PerformanceUrbanPlanning.com are co-authors of the Demographia International Housing Affordability Survey.

  • Why Housing Will Come Back

    Few icons of the American way of life have suffered more in recent years than  homeownership. Since the bursting of the housing bubble, there has been a steady drumbeat from the factories of futurist punditry that the notion of owning a home will, and, more importantly, should become out of reach for most Americans.

    Before jumping on this bandwagon, perhaps we would do well to understand the role that homeownership and the diffusion of property plays in a democracy. From Madison and Jefferson through Lincoln’s Homestead Act, the most enduring and radical notion of American political economy has been the diffusion of property.

    Like small farmers in the 19th century, homeowners–and equally important, aspiring homeowners–now represent the core of our economy without which a strong recovery is likely impossible.  Houses remain as a financial bulwark for a large percentage of families, the anchor of communities, and, increasingly, home-based businesses.

    The reasons given for abandoning the homeownership ideal are diverse.  Conservatives rightfully look to diminish the outsized role of government in promoting homeownership.  Some suggest  that Americans would be better off  putting their money into things like the stock market or boosting consumer purchases.

    New-urbanist intellectuals like the University of Utah’s  Chris Nelson predict  aging demographics will lead masses to abandon their homes for retiree communities and nursing homes.   The respected futurist Paul Saffo predicts that as skilled laborers move from Singapore to San Francisco to New York and London, there is little need to “own” a permanent place. In the brave new future, he suggests, we will prefer time-sharing residences  as we flit from job to job across the global economy.

    Some of the greatest hostility towards homeownership increasingly comes from the progressive left, some of whom are calling for the total elimination of the homeowner mortgage interest deduction.  “The Case Against Homeownership,” recently published in Time,  encapsulates the current establishment’s  conventional wisdom: that homeownership is by nature exclusionist, “sprawl” promoting and responsible for “America’s overuse of energy and oil.”

    Yet for all the problems facing the housing market, homeownership–not exclusively single-family houses–is not likely to fade dramatically for the foreseeable future. The most compelling reason has to do with continued public preference for single-family homes, suburbs and the notion of owning a “piece” of the American dream.   This is why that four out of every five homes built in America over the past few decades, notes urban historian Witold Rybczynski, have less to do with government policy than “with buyers’ preferences, that is, What People Want.”

    What we are going through now is not a sea change but a correction from insane government and business practices.   The rise in homeownership from 44% in 1944 to nearly 70% at the height of the bubble reflected a great social democratic achievement. But by the mid-2000s government attempts to expand ownership–eagerly embraced by Wall Street speculators–brought in buyers who would have historically been disqualified.

    In some markets, prices exploded as people moved up too quickly into ever more expensive housing. Housing inflation was further exacerbated by “smart growth” policies, which limited new home construction in suburban areas and instead promoted dense, “transit oriented” housing with limited market appeal and economic logic.

    Rather than artificially constraining supply and protecting irresponsible borrowers,   we should let nature take its course. Home values need to readjust historic balance between incomes and prices. Over the past 60 years, notes demographer Wendell Cox, it took two to three years or less of median household income to purchase a median-priced home. At the peak of the boom, that ratio had ballooned to 4.6.

    The disequilibrium was the worst in regions like Los Angeles, Las Vegas, San Bernardino-Riverside and Miami. At the peak of the bubble, between 2006 and 2008, according to the National Homebuilders Association- Wells Fargo “Housing Opportunity Index,” barely 2% of families with a median income households in Los Angeles could afford to buy a median priced home; even in the traditionally affordable Riverside area, the number was roughly 7%. In Miami, barely 10% could afford such a purchase; in Las Vegas, often seen as one of the cheaper markets, only 15%.

    What a difference a market correction makes. The affordability number for Los Angeles is now 34%, 17 times better than two years ago, while Riverside is now near 70%. Miami’s affordability picture has improved to over 60% while in Las Vegas, it’s back over 80%.

    These lower prices–not Wall Street or federal gimmickry–will lure new buyers to the places that some new urbanists   have predicted will be “the next slums.” Already there’s evidence in places like Miami of a renewed interest in now-affordable suburban single-family homes while condos stay empty  or become rentals.

    Of course without a return to robust job growth, particularly in the private sector, the home market– and pretty much all mainstream consumer purchases–will remain weak. No matter how low prices get, people worried about losing employment do not constitute a promising new market for homes.

    But over the longer run most Americans will seek to purchase homes –whatever the geography. Increasingly this will be less a casino gamble, and more  a long-term lifestyle choice.  As America adds upwards of 100 million more Americans by 2050, the demand will stare us in the face.

    As boomers age, the two big groups that will drive housing will be the young Millenial generation born after 1983 as well as immigrants and their offspring. Sixty million strong, the millenials are just now entering their late 20s. They are just beginning to start hunting for houses and places to establish roots. Generational chroniclers  Morley Winograd and Mike Hais, describe millenials in their surveys as family-oriented young people who value homeownership even more than their boomer parents. They also are somewhat more likely to choose suburbia as their “ideal place to live” than the previous generation.

    These tendencies are even more marked among immigrants and their children. Already a majority of immigrants live in suburbia, up from 40% in the 1970s. They are attracted in many cases by both jobs and the opportunity to buy a single-family home. For an immigrant from Mumbai, Hong Kong or Mexico City, the “American dream” is rarely living in high density surrounded by concrete; if they wanted that, they could have stayed home.

    Over coming generations, changes in family and work life will make single-family homes, townhouses and other moderate-to-low density housing more attractive.  Contrary to the anonymity predicted by most futurists, your chosen place is becoming more important, as evidenced by numerous suburban and small town downtown revivals as well as growing local volunteerism.

    Equally important, multi-generational households are on the rise back to 1950s levels–in part due to immigrant lifestyle preferences. People are staying put; even before the bubble burst, mobility had dropped to the lowest level in over a half century. With the rise of new technologies allowing for dispersed work, the single family home increasingly houses not only residents, but part and full-time offices.

    Barring a long-term permanent recession or a national planning regime aimed at curbing single-family home construction, these factors should lead to a new surge in home buying starting later this decade. It may be too late to save many who overextended themselves in the bubble, but this resurgence could do much to propel our anemic economy, restoring the home to its rightful place one of the cornerstone not only of the American dream, but of our democracy.

    This article originally appeared at Forbes.com.

    Joel Kotkin is executive editor of NewGeography.com and is a distinguished presidential fellow in urban futures at Chapman University. He is author of The City: A Global History. His newest book is The Next Hundred Million: America in 2050, released in February, 2010.

    Photo by Wootang01

  • Unmanageable Jakarta Soon To Lose National Capital?

    Jakarta is the world’s third largest urban area with 22 million people (Note 1) and the second largest metropolitan area with 26.6 million people (Note 2). Jakarta is the capital of the world’s fourth most populous country, the Republic of Indonesia, which has 240 million people (following China, India and the United States). Jakarta is located on the island of Java, which covers slightly more land area than the state of New York and has 8 times the people (135 million). There is probably no smaller piece of real estate in the world that houses so many people.

    A Unique Metropolitan Name: Jakarta is the only megacity (urban area with more than 10 million people) in the world that has adopted a new name for its urban and metropolitan area: Jabotabek, which combines the beginning letters of Jakarta and the suburban jurisdictions of Bogor, Tangerang and Bekasi.

    Jabotabek is also one of the world’s fastest growing urban areas and the prospects are for even stronger growth. The United Nations expects Indonesia to add 90 million people to its urban areas over the next 40 years. If Jabotabek gets its present share of Indonesian urbanization, its population would double.

    Jabotabek’s Unmanageable Problems: For already crowded Jabotabek and its even more crowded core of Jakarta, this is bad news. Jabotabek covers nearly the same land area as Paris (more than 1,000 square miles), but has more than twice the population. And unlike Paris, with its well-planned streets and multi-story buildings, much of Jabotek is made up of low-slung, terribly crowded makeshift slums.

    Jabotabek may have the most intense traffic congestion in the world. One report says road speeds average little more than 5 miles per hour. The government has plans to expand the freeway system, which is already extensive for a developing world megacity. But, Jabotabek’s density is already far above the critical mass of dispersion required for automobiles to serve efficiently, especially in the longer run. Automobile ownership is reportedly rising as much as 15% annually.

    Of course, every public official’s answer seems to be transit. Sadly, Jabotabek has anything but a transit friendly urban form, despite its high population density. Jabotabek may be the ultimate, dispersed Asian urban area, with little of a commercial core (though larger Delhi has even less) and even that is spread out. There’s no concentration of buildings, for example, as dense as downtown San Diego. Thus, building the kind of hub and spoke transit system that could effectively serve a dense commercial core makes no sense since economic activity is already so dispersed.

    Exclusive busways have been built. But the construction of two monorails has been suspended and there are plans to build a metro (subway). Given Jabotabek’s commercial dispersion, nothing short of an 800 meter rapid transit grid could possibly make a difference. This would bring everyone within the international transit standard of 400 meters, which given Jakarta’s dispersion is the only way a rapid transit system would work.

    That would cost far more than all of the personal income in the area each year in capital and operating expense. Jabotabek falls short of the critical mass needed in a commercial or even a residential core to make transit a viable solution.

    Thus, Jabotabek sits in the broad no-man’s land ill suited for transit and too dense for cars. However, in Jabotabek, as in Mumbai and Bangkok, having the choice between a transit system that cannot get you where you need to go and being stuck in traffic, people opt for the traffic as soon as they can afford it.

    There are other massive problems. Jakarta city is on a lowland on the Java Sea and has severe drainage and flooding problems. Rising sea levels could make things even worse. Urban planner Yayat Supriyatna says that the present core of Jakarta should halve its present population of over 9 million.

    Move the Capital? The nation’s leaders think they have an answer: move the capital. President Susilo Bambang Yudhoyono has called upon the government to prepare a study of the options. The entire national government could be moved completely out of Jakarta, or most of the government functions could be moved to another part of Jabotabek. Traffic is high on the list of ills that the President justifiably cites.

    Others, such as Siti Zuhro of the Indonesian Institute of Sciences are concerned that the capital needs to be moved away from Jabotabek altogether, to escape its problems. Speaker of the House of Representatives Marzuki Alie has suggested moving the capital to Central Kalimantan province, on the island of Borneo (Figure 1). This location has the advantage of being centrally located geographically to the nation. It is also conveniently accessible to komodo dragons, but far away from the population center of Java. A 1.5 hour flight would be required, or a far longer ferry ride. Neither travel option seems likely to facilitate the effective operation of democratic institutions in a low income nation.

    The president has expressed doubts about moving the capital to Borneo. He has suggested locations within Jabotabek, such as to Jonggol, which is 30 miles southeast of Jakarta city in Bogor regency. Indeed, fifteen years ago, planning was well along for moving the capital to Jonggol, That move was cancelled because of the east Asian financial crisis in the late 1990s. Others have mentioned moving the capital the adjacent suburbs of Bekasi or Tangerang (Figure 2), the latter of which has the advantage proximity to Sukarno-Hatta International Airport (one of the most modern in the world).

    Learning From Others? There are no easy answers, and the record of national capital relocations provides little guidance.

    Brazil moved its capital to Brasilia in 1960 to honor a 70 year old provision for internal development in its constitution. Since that time, former capital Rio de Janeiro has nearly tripled in population and spread to occupy the flats beyond the mountains that used to constrain it. Pakistan’s relocated capital at Islamabad has considerable advantages over former capital and megacity Karachi. Yet, Karachi has added more than 10 million people since the government moved. National capitals can be moved from megacities, but that may not slow down megacity growth. Moreover, given Jabotabek’s dominance (6 times as large as second ranked Bandung), it seems inconceivable that the commercial heart of the nation would move or that rural migrants would stream into smaller urban areas, where incomes seem likely to remain lower.

    Some have suggested copying the Malaysian model of government offices to the suburbs (like Jabotabek’s Jonggol). However, Putrajaya was quickly engulfed by the urbanization of Kuala Lumpur. Strategies that might work on the urban fringe of a much smaller, slower growing, more affluent and more manageable urban area of 6 million people (Kuala Lumpur) may not be appropriate for an urban area adding the equivalent of a Kuala Lumpur every decade. Given Jabotabek’s explosive growth, any new government center would be quickly surrounded and many of Jakarta city’s problems would be replicated.

    Jabotabek: The Dimensions of Expansion: Jabotabek continues to grow and is on course to become the world’s largest urban area and metropolitan area by 2030.

    Meanwhile, Jabotabek is not only expanding its population and land area, it’s adding to its name. Many now refer to it as Jabodetabek, adding extra letters for the suburb of Depok. Recently, a new city was carved out of Tangerang regency, South Tangerang. Jabotabek’s continuous urbanization has now stretched eastward into Karawang regency.

    Jabotabek the unmanageable could become Jabodetasokabek the unpronounceable.

    —–

    Note 1: The most recent edition (July 2010) of Demographia World Urban Areas and Population Projections lists Jakarta as the second largest urban area in the world (July 2010). New United Nations data now shows Delhi to have risen above Jakarta, with a population of more than 22,100,000. The Jabotabek urban area (like the Manila urban area) is routinely shown by international sources to have a far smaller population, however such estimates exclude huge populations in continuous urbanization in suburban jurisdictions.

    Note 2: While there are no international metropolitan area standards, it is generally agreed that the Jabotabek metropolitan area is second in size only to the Tokyo metropolitan area. If Karawang Regency is included (into which Jabotabek’s continuous urbanization stretches), Jabotabek’s metropolitan population in 2010 rises to 28.7 million, approximately 50% more than that of New York. Metropolitan areas and urban areas are often confused. Unlike urban areas, metropolitan areas include rural areas from which people commute into the urban area for employment, while urban areas are limited to the continuous urbanization (development) within metropolitan areas. See Urban Terms Defined.

    —–

    Wendell Cox is a Visiting Professor, Conservatoire National des Arts et Metiers, Paris and the author of “War on the Dream: How Anti-Sprawl Policy Threatens the Quality of Life

    Photograph: Jakarta (photograph by author)

  • Missing the Point on Jobs: The “More Transit – More Jobs” Report

    The Transit Equity Network has just published a study called More Transit – More Jobs in which it suggests switching 50% of highway funding to transit in 20 metropolitan areas to create an additional 180,000 jobs over the next five years. Their basic thesis is that each kajillion in spending can produce more jobs in transit than in highways. We don’t comment on that, because, frankly, the purpose of transportation spending is neither to create transit jobs nor highway jobs.

    We spend on transit and highways because of benefits that extend beyond any direct employment. And, the extent of those benefits cannot be compared between the two modes. At current rates of spending each billion dollars spent on highways supports about 25 times as much personal mobility as one spent on transit. Beyond that, highway spending supports the movement of more than 1.25 billion ton miles of truck freight, which keeps product prices low and supports our affluent life style. Transit carries 0.0 ton miles of freight. Researchers such as Prud’homme & Chang-Wong and Hartgen & Fields have shown that the type of ubiquitous mobility provided by road systems produce greater economic growth. Moving money out of roads would increase traffic congestion, destroy jobs and increase product prices by slowing down trucks.

    Why, on earth, then would anyone make such a dubious proposal? To paraphrase Bill Clinton, “It’s the ideology, stupid.” As we wrote within the past week, much of transportation spending over the last 25 years has been solidly based in an anti-mobility ideology that has produced virtually nothing in return. Already, transit, which accounts for one percent of national travel and no freight movement, accounts for more than 20% of spending on highways and transit combined. Things would be better if that were raised to 60%?

    If the Transit Equity Network were right (which it is not), then why stop at 50% for transit? Why not take all of the transit and highway money and just employ people to dig holes with shovels and then fill them up again. The only costs would be wages, benefits, shovels and administration. We could save money by not buying concrete, rails, fancy trains or palatial administrative buildings. Another advantage is that the holes would require no longer term operating subsidies.

    So, we need to do more than dump the ideology. We need also to dump the stupidity. Government does not exist for the purpose of government services and transportation programs do not exist for the good of transportation employees or vendors. Each dollar of infrastructure expenditures should be used to facilitate the greatest economic benefit throughout society as a whole, not just among people employed in transit (or highways for that matter).

  • Urban Plight: Vanishing Upward Mobility

    Since the beginnings of civilization, cities have been crucibles of progress both for societies and individuals. A great city, wrote Rene Descartes in the seventeenth century, represented “an inventory of the possible,” a place where people could create their own futures and lift up their families.

    What characterized great cities such as Amsterdam—and, later, places such as London, New York , Chicago, and Tokyo—was the size of their property-owning middle class. This was a class whose roots, for the most part, lay in the peasantry or artisan class, and later among industrial workers. Their ascension into the ranks of the bourgeoisie, petit or haute, epitomized the opportunities for social advancement created uniquely by cities.

    In the twenty-first century—the first in which the majority of people will live in cities—this unique link between urbanism and upward mobility is under threat. Urban boosters still maintain that big cities remain unique centers for social uplift, but evidence suggests this is increasingly no longer the case.

    This process reflects a shift in economic and social realities over the past few decades. For example, according to a recent Brookings Institution study, New York and Los Angeles have, among all U.S. cities, the smallest share of middle-income neighborhoods. In 1980, Manhattan ranked 17th among the nation’s counties for social inequality; by 2007 it ranked first, with the top fifth earning 52 times that of the lowest fifth, a disparity roughly comparable to that of Namibia.

    President Obama’s hometown of Chicago shows much the same pattern, according to a recent survey by Crain’s Chicago Business. Conditions have improved for a relative handful of neighborhoods close to the highly globalized central businesses. But for many neighborhoods things have not improved, and in some cases have deteriorated. Even before the recession there were fewer jobs than in 1989 and fewer opportunities for the middle class, many of whom—including more than 100,000 African-Americans—have left the city over the past decade.

    This pattern does not reflect perverse conditions unique to the United States, as many academics and progressive pundits often suggest. Between 1970 and 2001, the percentage of middle-income neighborhoods in Toronto dropped from two-thirds to one-third, while poor districts had more than doubled to 41 percent. According to the University of Toronto, by 2020, middle-class neighborhoods could account for barely less than 10 percent of the population, with the balance made up of both affluent and poor residents.

    Similarly, Tokyo, once widely seen as an exemplar of egalitarianism, is transforming. The city’s post–World War II boom yielded a thriving middle class and remarkable social mobility. That is now giving way to a society where wealth is increasingly concentrated. The poverty rate, including some 15,000 homeless people, has risen steadily to the highest level in decades.

    Much the same process can be seen in great social democratic havens of Europe. In Berlin, Germany’s largest city, unemployment has remained far higher than the national average, with rates at around 15 percent. Some 36 percent of children are poor; many of them are from other countries. The city, notes one left-wing activist, has emerged as “the capital of poverty and the working poor in Germany.”

    To a large extent, urban poverty in Berlin and other European megacities is concentrated among Muslim immigrants. Muslims constitute at least 25 percent of the population of Marseilles and Rotterdam, 20 percent of Malmo, 15 percent of Birmingham, and 10 percent or more of London, Paris, and Copenhagen. Over the next few decades, according to a recent Pew Research Center study, Muslims will constitute a majority of the population in several of these European cities.

    The Case of London

    Perhaps nowhere is the growing class divide more evident than in London, perhaps the world’s most important megacity. Despite a massive expansion of Britain’s huge welfare state, the ladder for upward mobility seems broken, especially in London. This represents a dramatic shift from the period after World War II. In the ensuing decades, incomes for most Londoners grew, access to education expanded, and the sharply drawn and notorious class lines began to blur.

    But contemporary London’s emergence as the headquarters of globalization has had widely differentiated impacts on class. On the one hand, it has paced the emergence of the West End. Many once hardscrabble neighborhoods—including Shoreditch, Islington, and Putney—have gentrified. Yet walk a bare half mile or less from the Thames River, particularly to the south, and you encounter many marginal, and often dismal, districts. These areas have not much benefited from the global economy and are inhabited largely by those who survive at the expanding bottom of the wage profile.

    Equally troubling, globalization’s benefits have disproportionately accrued to those already possessing considerable means; the ranks of top professionals, according to a 2009 report by the British government’s social mobility task force, have been increasingly dominated by the children of the wealthiest families.

    Even less noted has been London’s deepening concentration of poverty. Today more than one-third of the children in inner London are living in poverty, as are one in five in the outer ring communities. London has the highest incidence of child poverty in Great Britain, even more than the beleaguered Northeast.

    Poverty also affects 30 percent of working-age adults, more than one-third of pensioners in inner London, and roughly one in five in outer London. The inner London rates are the worst in Britain. More than 1 million Londoners were on public support in 2002. These figures are certain to become worse as a result of the recession that began in 2008.

    The conditions are certainly not as extreme as those recorded in Friedrich Engels’s searing 1844 tome, The Condition of the Working Class in England, but there remains a macabre relationship between mortality and geography. Steve Norris, a former Conservative Party chairman and onetime head of London Transport, notes that public health data published by the King’s Fund demonstrates that life expectancy in the poorer parts of east London is 4.5 years lower than in West London. That’s six months for every station east of Waterloo on the Jubilee Line. This poverty, Norris adds, extends to many white Londoners. They often live cheek to jowl with immigrants, and feel themselves competing for housing, jobs, and government services. The rich, Norris adds, “Buy their way out of poor quality education and healthcare” while the working and middle classes “queue for public housing for themselves and their children.”

    Of note is the rise of the phenomena among the white working class described as “yobbism.” Large parts of Britain—including less fashionable corners of London—suffer among the highest rates of alcohol consumption in the advanced industrial world. London School of Economics scholar Dick Hobbs, who grew up in a hardscrabble section of east London, traces this largely to the decline of the blue-collar economy in London. Over the past decade, job gains in Britain, like those in the United States, have been concentrated at the top and bottom of the wage profile. The growth in real earnings for blue-collar professions—in industry, warehousing, and construction—generally has lagged those of white-collar workers.

    One other thing is clear: the welfare state has not reversed the growing class divide. Despite its proletarian roots, New Labour, as London Mayor Boris Johnson acidly notes, has presided over what has become the most socially immobile society in Europe.

    The Role of Housing and ‘the Green Factor’

    Housing costs have exacerbated these conditions. Due largely to restrictions on new housing on the periphery, London now ranks, next to Vancouver, as the most expensive city to buy a house in the English-speaking world. Estimates by the Centre for Social Justice finds that unaffordability for first-time buyers doubled between 1997 and 2007. This has led to a surge in waiting lists for government-funded “social housing”; by mid-2008, some 2 million households (5 million people) were on the waiting list for such housing. In London, this number reached one in ten in 2008.

    Broad-based economic growth might seem the most logical solution to this dilemma. In the past, socialists, liberals, and conservatives might vigorously have debated various approaches, but generally agreed about the desired end result: shrinking slums and expanding opportunity for the middle or working class. Today, however, many urban “progressives” do not trouble themselves overmuch about the hoi polloi. Instead, they are more likely to devise policies to lure the much-ballyhooed “creative class” of well-educated, often childless, high-end workers to their cities. This goes along as well with an increased focus on aesthetic and “green” issues.

    In many ways, these approaches actually work at cross-purposes with upward mobility. Green-oriented policies are often hostile to “carbon intensive” industries such as manufacturing, warehousing, or construction that employ middle-income workers. Green policies implicitly tilt towards industries such as media, entertainment, and finance that employ the best-situated social classes.

    Indeed, some climate change enthusiasts, such as The Guardian’s George Monbiot, see their cause in quasi-religious terms. In Monbiot’s words, he is waging “a battle to redefine humanity.” In his view, we must terminate the economic “age of heroism,” supplanting the “expanders” with anti-growth “restrainers.”

    This is not just the latest edition of British “loony Left” thinking. President Obama’s own science advisor, John Holdren, long has embraced the notion of what he calls “de-development” of Western economies to a lower level of affluence. Such approaches impose enormous costs on both the middle and working classes in European and North American cities, particularly given the unlikelihood of similar restrictions on competitors in China, India, Russia, and other countries. A huge shift to renewable fuels, for example, could quadruple the cost of energy in Britain, forcing a large percentage of the population into “fuel poverty.”

    Key Focus: Economic Growth

    The emerging class conflict in the great global cities ultimately could have many ill effects. Persistently high unemployment and underemployment in British metropolitan areas, for example, has spurred nativist sentiment and intolerance towards immigrants. This is true in America today as well. But views towards immigrants generally soften as an economy improves. Broad-based prosperity is a good antidote for intolerance.

    Attacking the class gap requires a redefinition of current views about the overused term “sustainability.” This concept needs to be expanded beyond its conventional environmental definition to reflect broader social and economic values as well. It is one thing to consider how, in an era dominated by dispersed work, core cities might still attract those elite workers needing direct “face-to-face contact.” It is quite another to develop strategies so that the vast majority will be able to find work doing anything other than servicing the needs of the upper echelons.

    In turning away from the fundamental issues of economic growth and upward mobility, these cities are in danger of permanently undermining the very thing that has made great cities so attractive over the centuries. The ultimate worth of urbanity lies in its ability to deliver a better life, not only to the established affluent and the most skilled, but to that broader population who, like others over the millennia, come to a big city to create a better life.

    This article originally appeared at The American.

    Joel Kotkin is executive editor of NewGeography.com and is a distinguished presidential fellow in urban futures at Chapman University. He is author of The City: A Global History. His newest book is The Next Hundred Million: America in 2050, released in February, 2010.

    Photo by ecstaticist

  • China: Two Modernizations (Decentralization and Living Away from the Job)

    American and European planners have long sought to improve the “jobs-housing” balance, seeking to place residents and jobs within walking or cycling distance. Of course, planners don’t place people anywhere. Not surprisingly, their efforts have largely failed, from the new towns of the London area, where people travel about as far to work as anywhere else, to fabled failures of Stockholm, where high rise housing close to suburban employment centers now houses migrants who tend to have far lower incomes than native Swedes.

    In the time of Mao Zedong, China had achieved perhaps the ultimate in the jobs-housing balance. Companies provided housing for their workers, who were able to walk to their jobs in the same compound. However, the economic reforms instituted by Deng Xiaoping and his successors has led to an abandonment of this model (Danwei housing) and millions of Chinese households have been lifted out of poverty into affluence. Most Chinese households do not aspire to “living on top” of the factory or office.

    Foxconn (Hon Hai Precision Industry), one of the world’s largest companies, is among the last to provide large amounts of housing to its workers. In its Shenzhen “Long Hua Campus,” which covers only one square mile, Foxconn employs 450,000 people (Figure). They are housed on the campus or nearby in company provided units.

    Shenzhen directly borders Hong Kong and Dongguan, which borders the Guangzhou-Foshan urban area. All together, these contiguous Pearl River Delta urban areas, along with others down the western shore to Macao have nearly 50 million people, more than live in any geographic area of the same size anywhere else in the world. These Guangdong province urban areas, along with the special economic regions of Hong Kong and Macau have become one of the world’s leading manufacturing and export areas. Shenzhen itself has been estimated to have a population of between 10 million and 15 million, depending on how the migrant workers are estimated. Shenzhen and other major manufacturing centers of China are estimated to house as many as 200 millions migrants from other parts of China (especially rural areas), coming to work in jobs that pay far higher wages than can be earned at home.

    Foxconn itself is the world’s largest manufacturer of consumer electronic technology, producing Apple’s I-Pod and I-Phone and making products for Dell, Hewlett-Packard, Sony, as well as the Nintendo, Wii entertainment systems.

    According to a report in The Wall Street Journal, Foxconn has plans to abandon its Danwei housing and move away from its “perfect” jobs-housing balance to the spatial arrangements that Chinese, Americans and Europeans routinely choose — to work where they like and live where they like.

    Foxconn has had its share of difficulties. There have been the multiple employee suicides at the Long Hua Campus. The company has faced rising costs in its Pearl River Delta operations, including higher wage costs. In its attempt to retain competitiveness, Foxconn is seriously rethinking its business model and appears likely not only get out of the housing business, but will also move many of its operations into central and western China, where costs and wages are lower. This also makes sense in relation to government policy, which seeks to develop the center and west.

    Overall, Taiwan headquartered Foxconn employs 920,000 people in China, the equivalent of the entire work force in the Portland or Kansas City metropolitan areas.

    Foxconn plans to increase its workforce in China from 920,000 to 1,300,000 and intends for many of its employees to be in new facilities in places like Chengdu (capital of Sichuan), Wuhan (capital of Hubei), Zhengzhou (capital of Henan) and Chongqing (capital of the provincial level Chongqing municipality). Foxconn’s decentralization, and the location of other new and expanded businesses in the center and west is strongly supported by China’s substantial infrastructure investment. The nation already has more than 40,000 miles of interstate equivalent highways. When all of the gaps are completed, trucks will be able to reach east coast ports from Zhengzhou or Wuhan in about days drive and little more than two days from Chongqing and Chengdu.

    At the same time, corporate executives can get to Beijing, Shanghai and the Pearl River Delta and other East Coast urban areas in 2.5 hours or less through some of the world’s most modern airports.

    Finally, the more decentralized operations will allow the migrant workers to live much closer to their homes, rather than having to travel all the way to the East Coast. This will make more frequent visits to rural villages and families possible.

    —-

    Photo: Wuhan (photo by author)

  • Fortress Australia: Groundhog Day

    A decade ago, politics in Australia lurched to embrace all things rural, happily demonizing urban interests. This happened in response to a renegade Politician – Pauline Hanson – who for a time captured public sympathy with populist anti-immigration sentiments, threatening to unseat entire governments in the process.

    Now the result of the recent National Election in Australia has seen not only the return of anti immigration sentiments, but the ascendency of anti-growth statements in mainstream politics. For a large country with only 24 million people, it’s a dangerous development.

    Two things are shaping in the aftermath of the 2010 Federal Election as portents of things to come for our economic future. One is the rise of an increasingly orthodox view that Australia at 24 million people is reaching its maximum sustainable population. The second is toward appeasing the agrarian socialism and social conservatism of rural politics. Together, this could mean we are about to usher in an era of low growth, high protection policies. Fortress Australia could easily become a reality no matter which side ultimately claims the keys to the Government benches.

    Prior to the recent Federal Election (August 2010) both major political parties have become shy of the country’s long term population growth patterns. In September 2009, Federal Treasurer Wayne Swan released some early findings of the Intergenerational Report, which predicted Australia could reach 35 million by 2050. Although this rate of growth was pretty much the same as the preceding 40 years, the figure was greeted with alarm by media, the community, and much of the political herd. ‘Australia Explodes’ went the headlines and the lemmings followed over an ideological cliff. (See this blog post from a year ago).

    A month later, then Prime Minister Kevin Rudd was proclaiming that he believed in ‘a big Australia’ but by mid 2010 his later nemesis Deputy Prime Minister Julia Gillard was proclaiming she ‘did not believe in a big Australia.’ Gillard replaced Rudd in a Labor Party coup, and then as Prime Minister declared we shouldn’t ‘hurtle’ toward 36 million but instead plan for a ‘sustainable’ population, renaming the recently created portfolio of ‘Population Minister’ the ‘Sustainable Population Minister’ in the process. The word ‘sustainable’ in this context stands for ‘slow down or stop.’

    Then came the election campaign with Opposition Leader Tony Abbot promising to ‘slash’ the ‘unsustainable’ immigration numbers (that his mentor John Howard had been responsible for as conservative Prime Minister for over a decade) and to ‘turn back the boats’ of illegal immigrants and asylum seekers, mainly from south east Asia or Afghanistan. Population growth was to be cut to 1.4% (a long term trend anyway) and migrants potentially forced to settle in rural areas (some dodgy form of zipcode migration policy).

    The message from both political leaders was clear: support for a ‘big Australia’ (35 million population by 2050 or the same rate of growth we’d seen in the last 40 years) was gone.

    Add to that the quixotic Australian entrepreneur Dick Smith and his population TV documentary ‘The Population Puzzle’ where he alleged Australia was at risk of running out of food, out of space and out of control, comparing us (oddly) with places like tiny Bangladesh (population 160 million). Smith might be mad but you can’t discount the impact he has on Australian popular opinion. People believe him, politicians included.

    Could it get any worse for the prospects of maintaining even modest levels of population growth in Australia? The last election outcome means the answer is yes. The balance of power in the Senate of the Australian Parliament will now be controlled by ‘The Greens’ (a left wing environmental party). The Greens’ view on population growth is clear: they don’t support it (unless oddly if you’ve arrived illegally, by boat). “This population boom is not economic wisdom, it is a recipe for planetary exhaustion and great human tragedy” said Greens leader Bob Brown when the Intergenerational Report was released last year.

    In the House of Representatives, the balance of power is now held by a handful of independents, representing rural seats. Socially conservative but economically protectionist, the independents’ views on population suggest they would lean toward the Abbot view: turn back the boats, and slow the overall rate of growth. They are quite likely to also push for a redistribution of economic riches to a range of projects for rural and regional areas. The irony that the election result hinged on big swings in urban seats but that a handful of rural independents are now trying to call the shots shouldn’t be lost on anyone.

    Joining the growing chorus of slow or no growth chants is municipal government. The Local Government Association of Queensland’s annual conference this year talked of limits on population growth unless bountiful riches are showered on local governments to cope with ‘unsustainable’ rates of growth. Association President Paul Bell says “councils cannot let population growth exceed infrastructure needs.”

    “Where we find water supplies no longer match the size of the community, where we find roads are congested, where we’re seeing other infrastructure whether it be health or education are falling behind,” he said, population growth was by implication to blame.

    The bottom line? Population growth is now a dirty word in politics and for any business which relies on growth for its prosperity, this is not good news. Everything from airports to property to construction to farming to retailers, manufacturers and tourism will be affected by slowing growth.

    Even social services could suffer if growth is deliberately slowed. Why? Because in 50 years time, without migration or natural growth, the ageing bubble of post-war baby boomers may mean there are two working adults for every five retired. You wouldn’t want to be one of those two and paying their tax bill in 50 years’ time or dependent on the kindness of those workers.

    How has this come about? The answer is simple: growth itself has never been the problem. Instead, it’s been a notoriously inefficient planning approach which has misdirected precious infrastructure spending, pushed up housing prices through artificial restraint on supply combined with usurious upfront levies, which now average $50,000 per dwelling in Queensland (often more) and considerably more in NSW.

    In the last decade, can anyone honestly claim that our planning schemes are now more efficient and quicker, or more easily understood, or better targeted, than a decade ago? I doubt it.

    Would it be too much to ask for a sensible, evidence-based approach that ties population growth to urban and regional strategies, which emphasises economic progress while maintaining lifestyle and environmental standards? How about some decent plans to link regional urban centres to major cities, based not on pork barrels to influential independents but based only on the business case and community mutual benefit? Or how about putting the ‘growth’ back into smart growth, with policies that allow our urban areas to expand in line with demand matched to infrastructure spending, rather than policy dogma?

    Those same questions were being asked a decade ago. Welcome to ground hog day.

    For those interested, here’s a couple of yarns from 10 years ago:
    Slicker Cities for City Slickers. October 1999.
    Nation Building and a National Urban Strategy. May 2001.

    Ross Elliott has more than 20 years experience in property and public policy. His past roles have included stints in urban economics, national and state roles with the Property Council, and in destination marketing. He has written extensively on a range of public policy issues centering around urban issues, and continues to maintain his recreational interest in public policy through ongoing contributions such as this or via his monthly blog The Pulse.

    Photo by Linh_rOm

  • Time to Hate Those HOAs (again).

    The foreclosure crisis has been devastating for millions of Americans, but it has also impacted many still working as before and holding on to their homes. Even a couple of empty dwellings on a street can very quickly deteriorate and become a negative presence in the neighborhood, at the least driving down prices further, sometimes attracting crime. Untended pools can allow pests to breed. Many animals have been abandoned and shelters report overflowing traffic. The resulting impacts on local governments have been particularly visible, as property tax assessments have fallen and revenues have also gone south.

    Less obvious is the impacts on home owner associations [HOAs], whose revenues have also taken a hit, albeit for rather different reasons. For the most part, HOA dues are not a function of the value of the home but rather the need to cover the costs of maintaining the common interests of the association: landscaping, security and so forth. These tend to be fixed, even if the values of the homes collapse, and may even rise if dwellings are empty and untended.

    Many HOAs, especially in the newer metropolitan areas like Phoenix and Las Vegas where foreclosures have been most concentrated, have taken a beating because the number of households paying into the association has been depleted, quite badly in some instances. The problem seems, from press reports, to cover the economic spectrum. Low-income first-time buyers may stop paying their dues as an economy measure, while more affluent owners are more likely to have pulled cash from their home and are walking away from their debts. There are also thousands of empty homes that were purchased as investments at the height of the boom and may have never even been occupied.

    The foreclosure debacle is now old news, but the HOA situation is receiving attention because association boards are now aggressively trying to recoup their debts, even from those who have walked away from their mortgages. The debt, they argue, is attached to the individual, not to the dwelling, and is being turned over to collection agencies. Now, this is hardly a novelty. Municipalities have been turning household utility debts over to third parties for years, often with some success, and without a murmur of protest. So why is it different if HOAs do it?

    The answer is that HOAs are extremely unpopular with two vocal constituencies. The first is the academic community, and its hostility is part of the professional opprobrium that is heaped on gated communities, privatization and pretty much anything connected with suburban development. Interestingly, while the design aspects of gated communities have caught the attention of planners and urbanists, relatively few have focused on the dimension of governance. Those that have written on the topic have tended to be critical of private clubs that are seen to exist at the expense of the municipal collective. For what its worth, I don’t think I’ve ever known of an academic colleague who lived in an HOA, in contrast to the bulk of my students, who live in one or grew up there.

    The second constituency is more rowdy. Academics just disdain HOAs, but this group is committed to exposing them as a vast conspiracy to subvert the American way of life. This may sound like another version of contemporary “Teamania” but it is has been around for at least the past decade, during which time I’ve been monitoring Internet posts and the like. To this group, any restriction on personal freedom — from the color of one’s drapes or exterior paintwork through the display of the national flag — is clearly anathema.

    Early this year, my research on neighborliness in HOAs was covered in the local paper, and by the end of the day there were dozens of online posts. In response to the basic finding — that there is little fundamental difference between HOA and traditional neighborhoods — we received a torrent of angry responses. With a single exception, they all dismissed the findings out of hand, using an example of someone’s experience (rarely their own) to prove the point, at least to their satisfaction. One reader even tracked down my email address in order to demand an assurance that no public funds were used to promote this nonsense.

    Like much in contemporary American politics, this leaves me confused. I don’t understand why an exclusive residential association, freely entered into, with explicit rules that are presented at the outset, offering services-for-cash, is un-American. After all, this is in contrast to a municipality that levies taxes for services from which one cannot opt out (if one has no children in the schools, for instance) and which may not be available to all (such as public transport), and which could easily be seen as a redistributive institution, an example of that socialism we keep hearing so much about.

    For the record, I am happy to pay my property taxes for services I don’t receive — its just part of the social contract. Nor do I live in an HOA. But I can understand why our research indicates that most people who live in them do prefer them (and, for example, often move from one HOA to another). Rather than displaying the angst of those who seem to get nervous if anyone tries to step on their toes, these residents embrace belonging to a small polity in which they have a voice. And we should remember that rules, like fences, make good neighbors. As these neighborhoods become more diverse, traditional and non-traditional households alike can find reassurance in the behavioral conformity demanded of neighbors by an HOA.

    This brings us back to the recent stories about management boards ‘hounding’ those who have not paid their dues. Similar accounts have shown up for years, and the thrust is always the same: punitive, out-of-control boards attack those already in financial distress. There is clearly a lot of the latter to go round, but it’s hard to see why HOAs are much different than any other organization that is looking at a handful of bad debts. Are the HOAs the victims here? Absolutely not. Many embraced the housing bubble, and permitted speculators to buy in, even though they had no intention of living in the properties. At the height of the madness, up to one third of all housing transactions in Phoenix were initiated by out-of-state buyers who drove up home prices precipitately, and eventually caused the median house price to double. This has since corrected. All CC&Rs (the rules of the HOA) that I have seen dictate however that the purchaser must live in the property and that rental units are not permissible. So, like all the other players, the HOA boards liked the price increases so much that they ignored their own rules and looked the other way, a lapse for which they are now paying the price.

    Still, it would be a mistake compounding a mistake to climb on the anti-HOA bandwagon, now joined by the ACLU, which has recently joined the fray over a fight about a homeowner’s right to fly the Gadsden flag (motto: “Don’t step on me”). Libertarians should recognize that no-one has ever been forced to live in an association and that whipping up the wrath of state legislatures to control HOAs is a bad idea: it encourages even more government intervention, and it messes with the neighborhood, a form of governance that the vast majority rightly supports, even in HOAs.

    Andrew Kirby has written about HOAs on several occasions, including the 2003 edited volume “Spaces of Hate”. He most recently wrote about ‘The Suburban Question’ on this site in February.

    Photo by monkiemag

  • The Livable Communities Act: A Report Card

    With much fanfare, the Banking Committee of the United States Senate approved the Livable Communities Act (S. 1619, introduced by Democratic Senator Dodd of Connecticut). A purpose of the act is expressed as:

    …to make the combined costs of housing and transportation more affordable to families.

    The Livable Communities Act would provide financial incentives for metropolitan areas to adopt “livability” policies, which are otherwise known as “smart growth,” “growth management” or “compact city” polices.

    “Livability” is the latest rallying cry for planners who want to draw lines around urban areas and force people out of their cars and into denser housing. Secretary of Transportation Ray LaHood has defined livability as “if you don’t want an automobile, you don’t have to have one.” This meaningless slogan presumes that people are forced to have cars. If you are rich enough, you can live without a car on the Upper East Side of Manhattan or Chicago’s Gold Coast. If you are poor enough, you cannot afford a car, which means fewer job prospects and higher retail prices from merchants serving a captive market.

    Perhaps someday we will be beamed from place to place as in Star Trek. However, in the interim, a serious alternative to the car – hopefully a far cleaner, more efficient version – does not loom on the horizon. For all but a privileged few, cars and the quality of life and cars will remain “joined at the hip”. This is why research shows a strong correlation between the automobile access in an urban area and economic growth.

    The Report Card

    It is not premature to issue a report card on the Livable Communities Act, since the effect of its favored policy prescriptions are already well known. Metropolitan areas more inclined toward the act’s menu of livability policies (such as Los Angeles, San Francisco, Portland, Washington and others) are compared to other metropolitan areas (such as Dallas-Fort Worth, Atlanta, Indianapolis, Kansas City and others). Our analysis shows that, for most people, livability policies produce less livability, in terms of higher costs and a lesser quality of life, especially in greater traffic congestion, longer travel times and more exposure to air pollution (Note 1). They will therefore be referred to as “so-called” livability policies.

    Housing Affordability: The Livable Communities Act seeks to make housing more affordable. Sadly, the record associated with such policies in terms of affordability is nothing short of dismal.


    The Livable Communities Act receives an “F” for home ownership affordability


    House prices are considerably higher in the metropolitan areas more inclined toward so-called livability policies. The so-called livable metropolitan areas have nearly 50% higher house prices, after adjustment for incomes (Figure 1). If house prices were at the same level relative to incomes as in the other metropolitan areas, the median price would be $80,000 less. This would mean about $5,000 less in annual mortgage payments. In the least affordable so-called livable metropolitan areas, fewer than 40% of households can afford the median priced house (Los Angeles, New York and San Jose). In all the other metropolitan areas, more than 70% of households can afford the median priced house (Note 2). It takes a lot of gasoline to equal that difference.

    The Livable Communities Act receives an “F” for rental affordability.

    Rents are also higher in the so-called livable metropolitan areas (Figure 2). The US Department of Housing and Urban Development “fair market rents,” (estimated at the 40th percentile of the rental market, including utilities) for a two bedroom apartment was 25% higher in the so-called livable metropolitan areas in relation to the fourth household income quintile (top of the bottom 25%).

    Why Housing is More Expensive in Livable Metropolitan Areas: The land use regulations typical of the so-called livable metropolitan areas force house prices up by prohibiting development on most available land (urban growth boundaries), imposing building moratoria or, in some cases, by requiring excessively large suburban lot sizes, making it impossible to build housing that is affordable to middle income households. All things being equal, prices increase where supply is restricted, as indicated by a broad economic literature.

    Transportation

    According to the findings in the Livable Communities Act the nation wastes 4.2 billion hours in traffic congestion and loses $87 billion annually from the costs of congestion. The congestion cost is principally the cost of time.

    Transportation Costs: Since commuting by transit nearly always takes longer than commuting by car (twice as long in 2007), any switch to transit is likely to increase costs (lost time is lost time, whether in a train or in a car). The balance of congestion costs are in excess fuel consumption, which would likely also increase under the so-called livability policies, because higher densities produce greater traffic intensities (this from Sierra Club based research), which means more congestion and slower travel speeds, which reduces fuel economy.

    The Livable Communities Act receives an “F” for transportation affordability

    Transportation Quality of Life: So-called livability policies worsen traffic congestion and air pollution. This is indicated by the latest INRIX traffic scorecard showing that average travel delays during peak travel periods are nearly 75% greater in the so-called livable metropolitan areas (Figure 3). Federal Highway Administration data indicates that the intensity of traffic is more than one-third higher in the so-called livable metropolitan areas (Figure 4)


    The greater traffic intensity also has negative health impacts. The American Heart Association noted that being close to congested roadways increases the likelihood of heart attack and stroke. The American Heart Association cites a study indicating that “a person’s exposure to toxic components of air pollution may vary as much within one city as across different cities.” Obviously, such exposure will be greater where traffic densities are higher.

    The Livable Communities Act receives an “F” on transportation related quality of life issues.

    Consumer Preferences

    In its findings, the Livable Communities Act says that the demand of new housing in dense, walkable (so-called “livable”) areas is 15 times the supply. This misses the extensive overbuilding of dense, walkable communities that ended in the huge condominium bust in Portland, Seattle, Los Angeles, Miami, Atlanta, Chicago and elsewhere. The supply of such housing exceeds the demand, particularly at the current price points.

    Consumer preferences are not revealed by planners’ delusions from surveys people answer in the abstract. For example, most people want shorter commutes, but they vastly prefer single family houses to apartments. In the real context of issues like costs, living space, or schools, people express their priorities.

    The “litmus” test of so-called livability is what people do, not what they say they might do. Households continue to vote with their cars and are moving away from so-called “livable” areas. According to 2009 domestic migration data compiled by the Bureau of the Census:

    • The so-called livable metropolitan areas lost more than a net 3,140,000 residents to other areas of the nation, while other metropolitan areas gained more than 1,000,000 and smaller areas gained nearly 2,000,000 (Figure 5).
    • Nearly 3,500,000 residents left the core counties of the so-called livable metropolitan areas for other parts of the nation, while the suburbs gained 340,000 residents.
    • In the other metropolitan areas, more than 1,000,000 residents left the denser core counties, while the suburbs gained 2,300,000 (Figure 6).


    The Livable Communities Act receives an “F” for consistency with consumer preferences

    The Report Card: Not Livable at All

    The Livable Communities Act report card is shown below. In other words, if enacted, it is likely to produce a failing grade for families even if it wins straights A’s with planners, academics and inner city developers.

                                     Report Card

    Livable Communities Act

    Subject

    Grade

    Home Ownership Affordability

    F

    Rental Affordability

    F

    Transportation Affordability

    F

    Transportation Quality of Life

    F

    Consistency with Consumer Preferences

    F

    Overall Grade

    F

    Additional Comments: The favored policies would reduce mobility to major parts of the metropolitan area, which would reduce access to potential employment opportunities and retail establishments with lower prices.

    Note 1: The analysis covers metropolitan areas with more than 1,000,000 population. The “so-called” livable metropolitan areas are classified as those with “more restrictive” land use regulation by Demographia. The other metropolitan areas have less restrictive land use regulation. See note 7 of http://www.demographia.com/db-overhang.pdf.

    Note 2: Calculated from the National Association of Homebuilders-Wells Fargo Housing Opportunity Index.

    Wendell Cox is a Visiting Professor, Conservatoire National des Arts et Metiers, Paris and the author of “War on the Dream: How Anti-Sprawl Policy Threatens the Quality of Life

    Photo: Overbuilding Dense Walkability in Miami (photograph by author)