Blog

  • Transit in Los Angeles: Celebrating the Wrong Thing

    Los Angeles area transit officials celebrated 20 years of urban rail at a Staples Center event on July 23. Over the past 20 years, Los Angeles has opened 2 metro (subway) lines, 4 light rail lines and two exclusive busways (though apparently busways aren’t worth celebrating). Surely, there is no question but that Los Angeles has been successful in opening a lot of new transit infrastructure.

    At the same time, however, The Los Angeles Times reported that Professor James Moore of the University of Southern California, blames the disproportionate financial attention paid to rail projects reduced transit ridership by 1.5 billion (with a “b”) over the same period. The reason is, as Tom Rubin put it, is that many more people can be carried for the same money on buses, “Had they run a lot of buses at low fares, they could have doubled the number of riders.” Rubin was chief financial officer of the Southern California Rapid Transit District, one of the two predecessors of the present transit agency (MTA). The other was the Los Angeles County Transportation Commission, to which I was appointed to three terms.

    Transportation experts were also quoted to the effect that the rail system has done little to reduce traffic congestion or increase the use of mass transit much beyond the level in 1985, when planning for the Metro Blue Line began. Indeed. Traffic congestion has gotten much worse, and traffic volumes have increased materially. Our recent article showed that transit market shares had declined.

    These results are in stark contrast to Houston, which in 1984 had the worst traffic congestion in the nation. Houston set about to solve the problem by expanding its roadway capacity. Since 1984, Houston’s traffic grew twice as fast as that of Los Angeles, and population grew three times as fast (at least in part because many Californians were moving to Texas). Houston also added freeway mileage at double the percentage rate of Los Angeles. The reward was an increase in traffic congestion less than one-third that of Los Angeles (Figure). The most recent INRIX Scorecard shows Los Angeles traffic congestion to be more than 2.5 times as intense as Houston’s.

    Spending money on the right things makes a big difference. One can only wonder how different things might have been if Los Angeles had invested in the capacity people need (more roads) rather than in politically correct transit facilities that have no potential to reduce traffic congestion or to improve mobility and economic performance.

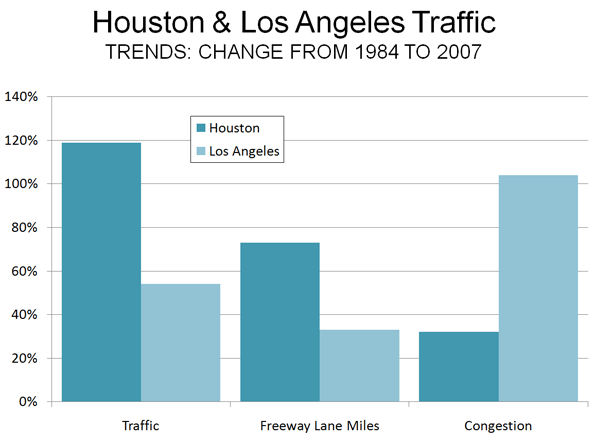
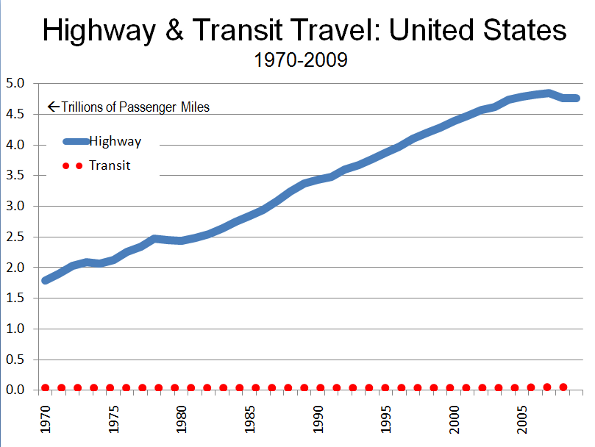
    There is a lesson from Los Angeles experience both for other areas and other government functions. The test of government performance is outputs, not inputs. Thus, it is appropriate to celebrate large transit market share increases or significant improvements in student achievement, not how many miles of rail are built or how much money is spent on education.

    Photograph: Los Angeles and the San Fernando Valley (by the author)

  • The Fifth Estate Clarifies US Driving and Transit Figures

    Late on July 26 (Washington time), The Fifth Estate corrected the attribution by Professor Peter Newman of Curtain University to the effect that driving was down 43% and transit up 65% in the United States. This issue had been the subject of my column on the same morning. It was a simple decimal error (in the reporting) and has now been corrected on the site. Driving is now reported as being down 4.3% and transit up 6.5%. Professor Newman provided slides with the data to Ms. Tina Perinotti, who forwarded them to me.

    While the new figures are less inconsistent with the official figures than the former, there are still material inconsistencies.

    Driving Trend: Official Data: The slides provided simply refer to the two figures as relating to the past year, without a source or specific period. The 4.3% driving decline is more than double the largest annual decline reported by the official source for such information, the Federal Highway Administration (Figure 1).

    Transit Trend: Official Data: We reviewed the data published from the official sources for transit data (the American Public Transportation Association and the Federal Transit Administration) and found no recent annual data indicating a 6.5% increase in ridership (either in boardings or in passenger miles). Much of the transit ridership gain from 2007 to the peak year of 2008 was lost in 2009, according to data posted by APTA in early March (Figure 2). A later first quarter report by APTA indicates further losses. Moreover, as we indicated in our article, the percentage decline in transit use since the peak year of 2008 is many times that of the decline in driving.

    Not All Percentages Are the Same: Care must also be used in comparing percentage changes between transit and driving, because so little travel is on transit. For example, a one percent increase in roadway urban travel converts to about one-third of a mile per person per day. A one percent increase in transit use converts to about 30 feet per person per day, about the same distance as walking from one side to the other of the average bedroom and back.


    Note: It is possible that the 4.3% driving decline was taken from an interim Federal Highway Administration report indicating that driving declined 4.3% in March 2008 compared to March 2007 (a monthly comparison, not a year on year comparison). This FHWA report, however, is subject to annual revision based upon the more comprehensive Highway Performance Monitoring System, which in 2009 revised the March 2008 such that the annual change became 2.7%.

  • A New War Between The States

    Nearly a century and half since the United States last divided, a new “irrepressible conflict” is brewing between the states. It revolves around the expansion of federal power at the expense of state and local prerogatives. It also reflects a growing economic divide, arguably more important than the much discussed ideological one, between very different regional economies.

    This conflict could grow in the coming years, particularly as the Obama administration seeks to impose a singular federal will against a generally more conservative set of state governments. The likely election of a more center-right Congress will exacerbate the problem. We may enter a golden age of critical court decisions over the true extent of federal or executive power.

    Some states are already challenging the constitutionality of the Obama health care program. Indiana, North Dakota, Mississippi, Nevada and Arizona joined a suit on March 23 by Florida Attorney General Bill McCollum to overturn the law. And Arizona’s right to make its own pre-immigration regulations has gained support from nine other states: Texas, Alabama, Florida, Nebraska, Pennsylvania, South Carolina, South Dakota, Michigan and Virginia.

    These may be just the opening salvos. If the Republicans and conservative Democrats gain effective control of Congress, the White House may choose to push its agenda through the ever expanding federal apparat. This would transform a policy dispute into something resembling a constitutional crisis.

    Such legal kerfuffles are unlikely to serve as precursors to armed conflict. But the political and rhetorical battles will certainly be heated. The federalistas can take heart from the the Civil War of a century and a half ago, which was decisively won by the union. They can also gain some encouragement from the ultimate success of the New Deal and of World War II.

    The federal government’s greatest bragging right–ending the absolute evil of slavery–was secured during the last war between the states. While most Union soldiers may have gone to war for the Union, the final result was an end to slavery. The consolidation of that gain during the 1960s also rests on expanded federalism.

    But the Civil War also was, as Karl Marx observed, a conflict between powerful economic interests. The Southern economy depended heavily on the export of commodities–primarily cotton, but also tobacco and other foodstuffs. It enjoyed profitable trading ties with the capitalistic superpower of the time, Great Britain. The North, in contrast, was an emerging industrial power for whom the British Empire represented the prime competitor.

    After the war the industrial capitalists ran the country virtually unchallenged. They overcame the Southern commodity producers politically and burdened them with high tariffs. By the 1890s American manufacturing surpassed Great Britain. The North became relatively rich while the South and much of the West remained backwaters until the 1950s.

    The economic map looks very different today. Generally speaking, states in relatively good economic shape are concentrated in an economic “zone of sanity” across the vast Great Plains. They are also in the least “fiscal peril,” according to a recent Pew study. Not surprisingly, these states see little reason to extend federal power and increase taxation in order to bail out their more profligate counterparts.

    To a large extent these states, according to Pew, are also the ones willing to reform their pension and other spending to keep down costs. Significantly, strong pension reforms have been enacted in some hard-hit sunbelt states–such as Nevada, Georgia, New Mexico and Arizona–which appear to be following the fiscal model of the zone-of-sanity states.

    In contrast those states most favorable to a more powerful Washington are often the ones suffering the worst fiscal situations. They also seem least willing to solve their structural budget issues. Free-spending, poorly managed states like New York, California, Michigan, Oregon and Illinois–all of which are controlled by the president’s political allies, need massive federal largesse to pay their bills without ruinous tax increases or painful cuts. Some localities in these states could become the Greeks of late 2010 as they head inexorably toward defaults.

    The differences between the states, however, extend beyond budget items. Many of the worst-managed also benefit from more federal spending on academic and medical research, and from subsidies for their often expensive green energy policies. They can also argue, with some justification, that the zone-of-sanity states have benefited in the past from federal crop supports, military spending and highway funding. Now it’s their turn for disproportionate time at the trough.

    Perhaps the most divisive issue will be the Obama administration’s proposed “cap and trade” legislation. For the most part, the strongest opposition comes from coal-dependent, industrial heartland states such as Indiana, whose governor, Mitch Daniels, has denounced the legislation as “imperialism” from Washington. Other keen opposition can be expected among members in both parties from energy-producing states like West Virginia, Texas, Louisiana, Oklahoma, North Dakota, Alaska and Wyoming.

    In contrast “cap and trade” seems less of a problem to the rapidly deindustrializing coastal states. Many of these states pride themselves as exemplars of an emerging low-carbon “information economy” and seem determined to limit their gas-spewing sectors like agriculture, manufacturing and transportation. A strong federal mandate on carbon emissions also would diminish the competitive gap between states like California, burdened by draconian local climate change policies, and less restrictive places like Texas.

    So who is likely to win the emerging new war between the states? Federal partisans might paint their opponents as the new “Confederates” fighting a protracted rear guard action, this time against science and social enlightenment. Certainly some demographic trends–youth attitudes on environmental issues, growing ethnic diversity and urbanization of “rural” states–favor the unionists.

    Yet you can argue that the fiscally strong states will be better positioned for the future. In contrast to the mid-19th-century Confederates, whose population growth paled compared with the Northern states, many of today’s demographic trends favor the anti-federalists.

    Over the past decade America’s population and enterprises have been shifting away from the unionist strongholds. Once depopulating states like Kentucky and the Dakotas are enjoying net in-migration from the rest of the country. Texas gradually threatens to supplant California as the leading destination for the young and ambitious.

    This suggests that after the 2010 census we could see something of a neo-confederate majority in Congress. Historical patterns may be repeating themselves, but they could produce a very different final result.

    This article originally appeared at Forbes.com.

    Joel Kotkin is executive editor of NewGeography.com and is a distinguished presidential fellow in urban futures at Chapman University. He is author of The City: A Global History. His newest book is The Next Hundred Million: America in 2050, released in February, 2010.

    Photo: Marxchivist

  • Going Underground in Australia

    Just over a decade ago, governments in Australia were immune to calls for accelerated infrastructure investment in our major urban centres. Plans for strategic reinvestment were rare. Much has changed in that time, maybe too much. It seems that enthusiasm for major urban infrastructure now runs ahead of impartial assessment of the cost, versus the claimed benefits. A proposed $8.2 billion underground rail loop for Brisbane, along with a new underground station for its busy downtown, provides one example of an over exuberant propensity to spend.

    The idea of new underground heavy rail lines to connect with the commuter rail system of southeast Queensland isn’t new. I can recall some 15 years ago proposing just that in a policy paper for the Property Council. The paper identified new stations in the CBD as a critical element in making use of rail transit more user friendly. The existing downtown stations, we argued, were barely downtown anymore, because the modern downtown (of close to 2 million square metres of office space, major retail, and entertainment hubs) had shifted toward the river and away from the stations.

    This large concentration of office workers should prove prime candidates for public transit, since they typically work regular hours (which helps with service schedules) and are concentrated at the centre of a hub and spoke system. But the walk from their workplace to the nearest stations, in summer heat or rain, represents (among other things) a disincentive to rail transit. So logically a new underground station (or even two) which brings the convenience of commuter rail closer to the workplace should encourage more people to make use public transport. Clearly, if you owned office buildings anywhere along the river edge of the ‘Golden Triangle’, you’d welcome this initiative with open arms and beg the Government to fast track the proposal.

    So it could indeed be a great idea. But first there are few unanswered questions about the economics of heavy rail commuter transport. The latest State Government figures show that every trip, by each and every commuter on the City Train network, is now subsidized to the tune of $10. That’s per trip, so for every daily return trip, the taxpayer is forking over $20 per commuter. And that’s after commuters have paid their fare – remember it’s only the subsidy. Even worse, the numbers of patrons are falling, from 60.7 million to 57 million in a year. (Worth reading the article “Taxpayers’ share of rail fares increases, while CityTrain passengers continue to decline” in The Courier Mail, June 15, 2010).

    The concern here is that under this failed pricing model, more commuters may also mean more subsidies and a greater tax burden on the taxpayer. In short, there doesn’t seem to be an economy of scale: if more people caught the train under the present system, it could cost more in subsidies, not less.

    Ironically, an online poll taken in connection with the above story revealed that 79% of respondents (out of 824) claimed that train fares are already too high. This is especially ironic for two reasons: commuters with jobs in the CBD market are, on average, paid more than their suburban counterparts and commuters who use the rail service are increasingly drawn from more affluent inner city and middle ring suburbs. The proportion of public transport users who begin their journey in lower income, outer suburbs, is relatively small.

    The evidence for this is found in papers by people such as Dr Paul Rees, School of Global Studies, Social Science & Planning at RMIT, and others. Various studies increasingly point to a rising correlation between rail (and tram in the case of Melbourne) use and proximity to central city workplaces. Put crudely, big chunks of that $10 each way subsidy are being paid for by low and middle income taxpayers in the outer suburbs (far from convenient train stations) so higher paid central city workers can have access to a convenient form of transport from their inner city or middle ring home, to work.
    As for the mooted new underground rail network, according to the Queensland Premier Anna Bligh, the network will service “Toowong, West End, the city, Newstead, Bowen Hills, Bulimba and Hamilton North Shore.” In Brisbane’s case, these are inner city areas which enjoy some of the highest real estate prices in the region. In short, this is where the rich people live and will also be subsidized.

    A further question needs to be raised about the potential growth in commuter rail traffic, notwithstanding the convenience of a new CBD station. With the exception of the new line to Springfield, there are no new lines being laid and no new stations proposed. The catchment populations around the various train stations that form the City Train network are variously touted as ‘TOD’ (transit oriented development) zones but … there’s been precious little development activity to show for a decade of discussion.

    In the end, simply building more housing around train stations won’t mean more commuters to the CBD because most of the jobs are in the suburbs in the first place, and getting more so. I am unaware of any State Planning Policy which aims to concentrate more office and retail workers in the CBD (indeed the pressure is on to decentralize). And without more workers in the CBD, there are simply not going to be more commuters wanting to go there. So you can have more housing around train stations but this won’t mean more people working in the city – unless there’s also going to be more jobs in the city (or the mode share rises).

    An additional brake on increasing patronage of the heavy rail network is the inability to get to a suburban train station in order to easily catch the train. If you live more than a kilometre from a train station (the overwhelmingly majority of all residents), you would need to drive your car to a station to ride. But stations have precious little in the way of parking for these commuters, and nearby residents justifiably object to having their streets turned into kerbside carparks for daily rail commuters. This is one of many practical realities holding back increases in mode share of rail as a percentage of all commuter trips. That proportion has remained stubbornly fixed at under 10% of all trips for Brisbane (rail and bus and ferry combined) while for the CBD the mode share sits at some 45% of all commuter trips (bus, rail and ferry combined).

    So while the notion of a new underground rail line with a new CBD station sounds like a terrific idea, you’d hope that those who are responsible for spending our money will be running some hard numbers on the feasibility. This cross river rail project is mooted to cost something like $8.2 billion dollars in today’s terms. By the time they get around to building it, it will no doubt cost more.

    Even if the cross river rail and new station managed to achieve the result of 100,000 new rail commuters, that still works out to $82,000 per extra commuter. And if those commuters are to continue to be further subsidised to the tune of $10 per trip, each way, every day, this could be the sort of infrastructure initiative which ends up costing the community a great deal.

    You’d hope the numbers are being compiled rationally, dispassionately and independently, and the proper questions asked. Quality, strategic infrastructure investment in our urban areas is an economic necessity. But irrationally conceived projects of dubious economic merit are not the way forward.

    Ross Elliott is a 20 year veteran of property and real estate in Australia, and has held leading roles with national advocacy organizations. He was written and spoken extensively on housing and urban growth issues in Australia and maintains a blog devoted to public policy discussion: The Pulse.

    Photo by monkeyc.net

  • Driving and Transit in America: Myths from Down Under

    I nearly fell off my bicycle when I read that driving had declined 43% in the United States and transit use had increased 65%. Australia’s The Fifth Estate attributes these figures to Professor Peter Newman of Sydney’s Curtin University at an event at the Hassell architectural and urban planning firm offices in Sydney. In speaking about a declining driving trend in Australia, The Fifth Estate reports Professor Newman as saying that:*

    “… new research from the United States shows this is not a localised trend – car use in the US has plunged 43 percent and there has been a 65 percent leap in public transport use.”

    As anyone remotely familiar with US transport trends knows, the statement is erroneous. The driving claim is more than 20 times (2,000%) the reality, while transit has seen no ridership increase remotely approaching 65% since World War II, when gasoline (petrol) and tires were rationed.

    Professor Newman is one of the world’s leading advocates of compact city policies (urban consolidation or smart growth policies), and was co-author of Cities and Automobile Dependence (with Professor Jeffrey R. Kenworthy). This 1990 volume broke new ground in reporting international transport data (one can take issue with commentary in the book, but the data is solid as have been subsequent revisions under Professor Kenworthy’s leadership). Professor Newman has also served as Sustainability Commissioner for the state of New South Wales (Sydney is the capital) and serves on the federal government’s Infrastructure Advisory Council.

    In view of Professor Newman’s prominence, Australian colleagues asked me for clarification on the matter. I contacted Tina Perinotti, author of the story (by whom I had been interviewed while on a national speaking tour of Australia in 2006). She indicated concern said she would investigate it and make any necessary correction. The last I heard, she had been referred to a Brookings Institution publication. I responded that nothing would be found at Brookings to support the absurd notion that driving is down 43% and transit is up 65% (since we all rely on the same authoritative data sources). Approaching one month after publication (July 24), the error has neither been retracted nor clarified.

    The actual data shows the following:

    Driving Trends in the United States: According to the Federal Highway Administration of the United States Department of Transportation, driving is down from its 2007 historic peak. The price of gasoline rose 90% from early 2007 to middle 2008, which combined with the worst economic downturn since the Great Depression (See Note), resulted in a 1.9% decline from 2007 to 2008. By comparison, the largest previous post-war decline in driving was 1.4% during the 1973-1974 energy crisis. The first five months of 2010 indicate a 1.7% reduction in driving from 2007, however driving has been up each of the last three months. The decline in urban areas (where transit operates) is smaller, at 1.1%. Either figure is a far cry from 42%.

    Transit Trends in the United States: Transit ridership increased, especially as gasoline prices rose. While skyrocketing gasoline prices produced a modest decline in driving from 2007 to 2008, transit ridership increased more than 5%. In context, however, the ridership increases were inconsequential (Figure), because transit accounts for such a small share of urban travel (under 2%). During the gasoline price spike, only 10% of the loss in urban highway passenger miles was transferred to transit. It seems likely that people just traveled less or combined trips. More recently, transit ridership has begun declining. Data from the American Public Transportation Association indicates that transit ridership (first quarter annualized) has declined 6% from its 2008 peak. Over the same period, urban driving declined by less than one-tenth of the transit rate, at 0.4%.

    Trends in Australia: As in the United States, modest driving declines occurred in Australia. According to data from the Bureau of Infrastructure, Transport and Regional Economics, driving declined 0.04% in the five largest capital cities (Sydney, Melbourne, Brisbane, Perth and Adelaide), as gasoline prices increased (from the peak in 2007 to 2008). Over the same time period, transit ridership was up 6%. A more recent annual report by the New South Wales Department of Transport indicated that driving had dropped 1%. However, the three year period covered (July 2006 to June 2009) included the gasoline price spike, which was an important factor in reducing driving. The same report found that automobile ownership in Sydney had increased over the same period, which would seem to evidence the lack of any cultural shift (though cultural shifts are not indicated by miniscule numbers).

    It is not surprising that neither Australians nor Americans have seen their streets and highways freed from congested traffic. Indeed, in Sydney one way work trips take just as long as before (34 minutes) and longer than any US metropolitan area except New York.

    * Subsequently corrected by The Fifth Estate

    —–

    Note: For a description of the connection between compact city policies (smart growth), US housing bubble, and subsequent international financial crises, see Root Causes of the Financial Crisis: A Primer.

    —–

    Photograph: Freeway and transit in Perth, Western Australia (by the author)

    Wendell Cox is a Visiting Professor, Conservatoire National des Arts et Metiers, Paris. He was born in Los Angeles and was appointed to three terms on the Los Angeles County Transportation Commission by Mayor Tom Bradley. He is the author of “War on the Dream: How Anti-Sprawl Policy Threatens the Quality of Life.

  • Chickens from Wal-Mart?

    As I arrived for a visit, my 90 year old father was perusing ads from his favorite big box store for chicken parts. Seizing the moment that all children savor, I sought to impress him with my declaration: “I buy my chicken parts – albeit at higher prices – at the natural foods store; you know daddy, where the chickens ate naturally off the barn yard floor like they did when you were a boy”? Not missing a beat and dashing my hope for an “at a boy,” he retorted: “I saw what those chickens ate off the barnyard floor and I’ll buy my chickens at Walmart(s)!”

    And so, in his own way, my father just about sums it up – and puts me in my place. For one, he certainly doesn’t long for the good old days that were anything but. He was raised poor in Appalachia Kentucky and likely had to work for his supper, wringing the neck of a chicken that ate whatever it could scrape from the dirt. He prefers the modern conveniences like the big box stores so hated by the urbane crowd. And, so we see the clash of the old versus the new; of culture that is good and culture that is changing to fit the times in which we live.

    How does that translate into the lives we lead and where we are going? Note that the “Walmart chicken man” is the same father who observed that computers were evil because they had put blue collar line workers like him on the street. So, in this the age of “technology as savior” and as the end all be all, we are alas seeing a revival of interest in local culture. We are seeing the dawn of small versions of big box stores and the “re-sizing” of American lifestyles. As The Economist (May 15, 2010) has noted, some really smart people may simply wish to live next door to cows and chickens even if my father does not. There’s a notion that small may appeal to people living in an outrageously outsized world. This can be seen in a renewed interest in coming home or staying home in the smaller towns of America.

    But, that return toward local culture goes only so far. The palpable interest in lifestyles that eschew the “cold flickering computer screen in the middle of the night” in favor of warmer and more nurturing places does not mean we can return to the past. Frankly, as my father reminds me, we might not want to. The new small town lifestyle is anything but complacent and “old fashioned.”

    There are stories abounding of telecommuters working for big east/west coast companies inventing software programs – inspired by the springtime hills alive with rosebud trees. There is even the former advertising executive, who commented upon hearing of friend’s involvement in a controversy: “There is always extraordinary life (in the countryside) beyond controversy … I am farming these days and stifling my leadership urges except for cows, goats and Border Collies.”

    As much as we might like to think that youthful retirees and young millennials will relocate to the mythic “Mayberry,” with its homespun values and slow deliberate quality of life, the successful Mayberry has to offer more than nostalgia. The pleasing camaraderie of neighbors is not enough. You also need educational opportunities, good health care and transportation. People may be seeking warmth and nurturance and bucolic scenes but we are demanding lot, fed by the 21st century to hold such contradictory views as shopping at Starbucks or Wal-mart while marching in the street for more locally-owned shops.

    So in the face of all this, how do we build a rural America that can sustain our small towns and offer an alternative lifestyle of Americans who yearn for one? We are accustomed to turning our “lonely eyes” to technology for all the answers and indeed it is critically important. But, the answer for small town rural America lies in merging the blessings of technology with the culture that makes the small town lifestyle so special.

    To put it bluntly: culture eats technology on any day of the week. Examples range from Afghanistan’s impenetrable and powerful ground level tribal network that thwarts the strongest armies – from the British to the Soviets to the US – to the puzzling rejection of educational attainment in Appalachia due to the reality of fear that “getting smart” will only encourage children to leave home. In the rougher part of the world, “staying close to home” is deeply rooted in ancient cultural ties to land and place.

    So, how do we combine the technology that will lift up economic prosperity and build wealth and while understanding better the role of local culture in creating the resilient rural communities of the future? I call it the ultimate “mash-up”. It will require the combination of the five Ps: PERSPECTIVE and hard-nosed research to know where you stand: who is coming to or staying in your community or region; investment in PEOPLE and their education and health and other documented needs; recognition and promotion of PLACE, PRESERVATION of what is dear in our culture; and finally putting all that together with technology that can bring economic PROSPERITY not only in dollars but in quality of life.

    We certainly need to take what technology offers, with its gift of allowing us to live and work anywhere. But this is a hollow benefit unless we imbue it with the culture that makes our lives special. It won’t be computers that will make our rural places unique. It will be the native music, crafts and stories and how we preserve and adapt them to modern times.

    Sylvia Lovely is an author, commentator and speaker on issues relating to communities and how we must adapt to the new landscape that is the 21st century.

    Photo by pfly.

  • The Decline and Revival of an American Suburb

    In 1952, a white Protestant couple from Pasadena, California along with their newly born first child, moved 22 miles east to a small town called Covina. There, among acres of open space and endless rows of orange, lemon, and avocado trees, the young family was able to purchase a plot of land and build a brand-new home with swimming pool for a total of $20,000.

    Not far away, in an unincorporated area of Los Angeles County straddled by the towns of La Puente, Baldwin Park and West Covina, a Mexican-American Catholic couple from central Los Angeles with two small daughters purchased a newly built 3-bedroom, 2-bath home with a large backyard for $15,000. The young husband had served in the Navy during World War II, allowing the couple to buy their home with the help of the G.I. Bill. The year was 1956.

    The two couples featured are my paternal and maternal grandparents. Both were young families of the prosperous post-war years claiming their stake on the middle class American Dream. My paternal grandfather worked as a sales representative for Drackett Products (the creators of Drano and Windex- now part of S.C. Johnson & Son) while my maternal grandfather worked as unionized welder at an aerospace plant in Burbank. Both grandmothers were career stay-at-home moms.

    The place they chose to call home is the San Gabriel Valley- a sprawling expanse east of Los Angeles comprised of 47 independent municipalities and unincorporated areas. Today, the region is a demographically diverse melting pot of more than 2 million residents. To a casual visitor heading east towards the Inland Empire on one of the Valley’s three main east-west arteries (the 210, 10 and 60 freeways), the separate municipalities-with names like Glendora, Rosemead, and Duarte-are virtually indistinguishable. Aside from Pasadena, the oldest city in the Valley and famous for its Rose Parade and accompanying Rose Bowl Game, most San Gabriel Valley cities are largely forgettable in terms of architecture or town planning.

    Such failings in the built environment were not a consideration back in the 50s and 60s. My father describes his childhood setting as ‘heaven on earth’ where he could ride his bike with friends for miles from his home exploring rolling hills, untouched rivers and endless citrus groves.

    My mother describes her childhood neighborhood as what Life magazine once dubbed ‘kidsville. She recalls the neighborhood kids playing a variety of games outside in the street after school. Most often, she would not even be allowed inside the house until 5 pm when dinner was promptly served. On special occasions, her parents would take her and her siblings, my aunt and uncle, to a new fast-food joint called In-N-Out Burger. The now iconic chain had their first location literally just around the corner from their home.

    By the mid 1970s, both of my parents had left the San Gabriel Valley for another valley in Northern California where they met and later got married. My younger sister and I were raised in the Bay Area’s Silicon Valley, but we would still make the drive down to Southern California at least once a year to visit relatives.

    This trip always prompted mixed feelings from my parents.

    My father later explained to me that over the course of 25 years the San Gabriel Valley had devolved from an idyllic bedroom community to a crowded and polluted assortment of endless strip-malls. The year he left, 1973, had one of the worst air-pollution levels on record. Most days it was impossible to even see the majestic San Gabriel Mountains towering over the Valley. Sometimes, my father tells me, his high school football practices had to be canceled due to the inability of the players to catch their breath.

    Today the air-quality is significantly improved (thanks in large part to the introduction of catalytic converters to automobiles).

    The demographic make-up is also drastically different. My mother’s childhood street, which was about 50-50 split between Mexican-Americans and white Americans is now predominately populated by Central American immigrants. Long gone are the children playing on the street and neighbors socializing with each other. Now, most homes have unkempt front lawns surrounded by chain-link fences and windows and doors with security bars on them. On commercial streets nearby, strip malls are dominated by small restaurants and grocery stores with signs in Spanish catering to the local Latino community.

    In the neighboring city of West Covina, the present demographics are markedly more mixed. About half of the population is of Hispanic origin while the remainder is split between white and Asian. The Asian influx to West Covina is a recent phenomenon, taking place over the past two decades. This is physically visible in several strip malls throughout the city catering to Chinese immigrants and Chinese Americans.

    The growing Asian population is part of a larger trend in the greater San Gabriel Valley region. Already, cities in the western part of the Valley, including Alhambra, Monterey Park, San Gabriel, and even the upscale enclave of San Marino, are majority Asian. Die-hard foodies of Southern California claim this area has the most authentic Chinese food in North America.

    I can’t blame my parents for wondering what happened to the suburban utopia of their youth. Many other Baby Boomers across the U.S. probably share similar sentiments about the communities where they grew up.

    Yet if the dream seems endangered, or even delusional, to many sophisticated Americans, many other people, particularly immigrants from outside of America’s borders, want a piece of it.

    Ultimately these newcomers may be the ones to save suburbs like those in the San Gabriel Valley. They are the ones now starting businesses, improving their houses, and building the new cultural institutions. This may not be the suburbia of my parent’s childhood but it is not the doomed dystopia imagined by many urbane observers.

    These newly energized suburbs will also not depend as much on the center city. More residents now work closer to home, and fewer commute to the core of Los Angeles, which has lost hundreds of thousands of jobs over the past decade.

    Instead these towns are reviving along the lines of ‘suburb as village’, building on now underutilized downtown areas with charming mid-century structures that once served as commercial hubs for their respective towns. A growing emphasis on locality, as well as a renewed interest in civic identity, may help these places find their individual character once again – even if the signs of revival may be in Mandarin or Spanish as well as English.

    Adam Nathaniel Mayer is a native of California. Raised in Silicon Valley, he developed a keen interest in the importance of place within the framework of a highly globalized economy. Adam attended the University of Southern California in Los Angeles where he earned a Bachelor of Architecture degree. He currently lives in China where he works in the architecture profession. His blog can be read at http://adamnathanielmayer.blogspot.com/

    Photo by BurlyInTheBay

  • BRT is ERP (or, Bus Rapid Transit is Enlightened Responsible Planning)

    Robert Sullivan’s recent article in New York magazine, “Subway on the Street”, marks a welcome addition to transportation discussions in New York City. New Yorkers are currently faced with seemingly paradoxical transportation plans that call for subway and bus service cuts, while relatively short and exceedingly expensive underground subways are being built (Sullivan discusses both).

    However, also at the same time, a monumental partnership between the city’s transit agency (MTA) and the DOT is taking root. The result is a new bus rapid transit line in the Bronx – Bx12 SBS, short for “select bus service” – the focus of Sullivan’s article.

    To be clear, bus rapid transit is not a New York innovation. Cities throughout the world, and in the United States, have experimented with bus rapid transit lines with general, albeit not absolute, success. But it is nonetheless refreshing to see the largest city in the United States accept buses as potential congestion relief tools.

    Jay Walder, a New Yorker named head of the MTA after holding a similar position in London, brought the same promise of a more fully integrated bus and rail system to his home city.
    Encouraging innovation, expanding applicability and increasing efficiency are not the exclusive domains of the private sector, even if it feels that way. New York is showing, as cities repeatedly do, the potential for public-sponsored reinvention as a result of resilience.

    Howard Kozloff is Manager of Development Strategies and Director of Operations at Hart Howerton, an international strategy, planning and design firm based in New York, San Francisco and London.

  • How Much of the World is Covered by Cities?

    For years, planners and others have raised concerns about the amount of land that urbanization occupies, especially in the United States and other developed nations. My attention was recently drawn to an estimate that 2.7% of the world’s land (excluding Antarctica) is occupied by urban development. This estimate, which is perhaps the first of its kind in the world, is the product of the Columbia University Socioeconomic Data and Applications Center Gridded Population of the World and the Global Rural-Urban Mapping Project (GRUMP) and would amount to 3.5 million square kilometers.

    While the scholars of Columbia are to be complimented for their ground breaking work, their estimate seems very high, especially in light of the fact that in the United States, with the world’s lowest density urban areas, only 2.6% of land is urbanized. Further, the data developed for our Demographia World Urban Areas and Population Projections would seem to suggest a significant overstatement of urbanization’s extent. Demographia World Urban Areas and Population Projections data are generally from national census authorities and examination of satellite photography.

    The GRUMP overestimation is illustrated by the following.

    GRUMP places the total of all urban extents in the United States at 754,000 square kilometers, more than three times the 240,000 square kilometers reported by the Bureau of the Census in 2000. This is despite the fact that GRUMP uses the same urbanization criteria as the Bureau of the Census. At the average GRUMP population density, most US urban areas would not even qualify as urban under the national standards used in countries such as the US, Canada, the UK and France.

    The overestimation can be illustrated by Cairo, which surrounded by desert land virtually devoid of urbanization. GRUMP places Cairo’s urban land area (“urban extent”) at 10,900 square kilometers. Cairo is well known among demographers as one of the world’s most dense urban areas. Yet the GRUMP urban density, at 1,550 per square kilometer would make Cairo no more dense than Fresno, though somewhat more dense than Portland. The Demographia Cairo urban area is estimated at 1,700 square kilometers, more than 80% smaller. The contrast between the GRUMP and Demographia land area estimates is illustrated in the figure. There are a numerous additional discrepancies of similar scope.


    One problem with the GRUMP estimates is their reliance on lights at night as observed from satellites. The problem is that lights illuminate large areas and any estimates based upon them would be likely to be inflated. Documentation associated with GRUMP acknowledges this effect, which it refers to as “blooming.”

    But “blooming” is not the only problem. The poorest urban areas tend to have fewer lights and are thus illuminated to a larger degree than more affluent areas. The result, in the GRUMP data is that some of the project’s most dense urban areas are in fact not the world’s most dense. For example, low income Kinshasa (former Leopoldville), in the Democratic Republic of the Congo is indicated by GRUMP to be 40% more dense than Hong Kong. The reality is that Hong Kong is twice the density of Kinshasa, the difference being the effect of “blooming,” combined with more sparse electricity consumption in the African urban area.

    Demographia World Urban Areas and Population Projections accounts for more than 50% of world urbanization and includes all identified urban areas with 500,000 population or more. These urban areas cover only 0.3% of the world’s land area. There is only the most limited data for smaller urban areas. However, it is generally known that smaller urban areas tend to be less dense than larger urban areas (which makes one wonder why the anti-sprawl interests have targeted larger urban areas). In the United States, the urban areas with less than 500,000 population average about one-half the density of larger urban areas. University of Avignon data indicates that the smaller urban areas of western Europe are about 60% less dense than the larger ones.

    If it the US 50% less factor is assumed, then urbanization would cover approximately 0.85% of the world’s land (1.1 million square kilometers).

    If the European 60% less factor is assumed, then urbanization would cover 1% of the world’s land (1.3 million square kilometers).

    By these estimates, the GRUMP urbanization estimates would be more than 200% high.

    GRUMP has contributed a useful term to the parlance of urban geography — the “urban extent.” An urban extent is simply continuous urbanization, without regard to labor markets or economic ties. For example,

    The Tokyo urban extent might be considered to run from the southern Kobe suburbs, through the balance of the Osaka-Kobe-Kyoto urban area, Otsu, Nagoya, Hamamatsu, Shizuoka and through the Tokyo urban area to the northern suburbs, a distance of 425 miles (GRUMP calls the Tokyo urban extent the world’s largest).

    China’s Pearl River Delta, with its physically connected but relatively economically disconnected, urban areas (including at least Hong Kong, Shenzhen, Dongguan, Guanzhou-Foshan, Zhongshan, Jiangmen, Zhuhai and Macao) is another example.

    Despite its difficulties, the GRUMP project is an important advance and it is to be hoped will produce more accurate estimates in the future.


    Note: The Demographia Cairo urban area is also the urban extent (the extent of continuous urban development). It includes the 6th of October new town and New Cairo, but excludes the 10th of Ramadan new town, which is physically disconnected from the Cairo urban extent.

    Photograph: In the GRUMP Cairo Urban Area (by the author)