Blog

  • Entrepreneurship Fuels Recession Recovery in Sweden

    In a time when many European nations are burdened by high debts and difficulties to get spending under control, the Swedish economy is amongst the most well managed in Western Europe.

    The nation’s GDP fell dramatically, by more than four percent, when the financial crisis struck. This decline was twice the average of the OECD-15 countries. Despite this, Swedish employment actually increased between the last quarter of 2006 and 2009.

    Sweden was hit hard by the crisis since the country relies heavily on exports. On the other hand, the new center-right government that was elected in 2006 has implemented considerable supply side reforms in terms of tax cuts and tightening of welfare and social insurance benefits. These reforms have encouraged work rather than dependence on handouts, balancing out much of the negative impacts of the crisis.

    This reformist trend is rarely acknowledged in the United States. However, during the last two decades both center-right and social democratic governments have implemented free market reforms, tax reforms, pension reforms, privatization of state owned firms and increased reliance on private production of public services such as education and health care.

    The country has also followed a surprisingly conservative fiscal policy. The welfare state remains, but Sweden is no longer an extreme case in terms of socialist policies. This now helps Sweden stay on top as Europe starts on the road to recovery.

    Bu what are Sweden’s long-term prospects for turning the crisis into an opportunity for growth? As history shows, when the macroeconomic shocks subside, growth to a large extent depends on innovation and entrepreneurship. Typically, entrepreneurship is not included as a factor in economic models. In real life however, the business climate matters.

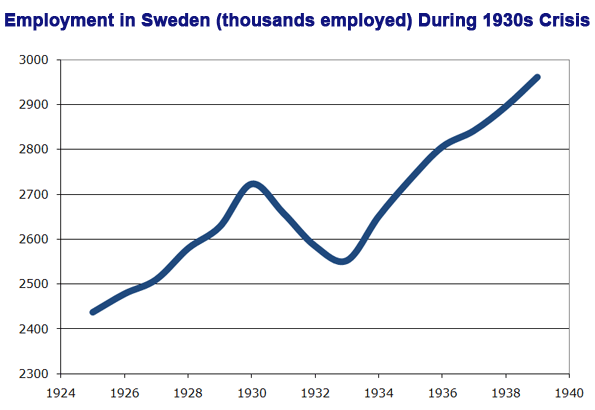
    This is illustrated by how well Sweden handled the great depression. Between 1930-33 170,000 jobs were lost, leading to a six percent drop in employment. However, the downturn soon turned to growth.

    At this time, Sweden was far from a socialist welfare state. The nation boasted low taxes, a flexible labor market and a good business climate. The solution for many who lost their jobs was to start their own business.

    Job creation spurred. Already in 1935 more people were employed compared to before the depression. One reason is that the Swedish economy already had gone through a recession in the 1920s, sparking structural changes.

    New and innovative ventures were started to replace the jobs that had been lost. Several famous Swedish firms, that still today remain as top employers, were formed during and shortly after the depression, such as: Volvo Aero, the mining company Boliden, Securitas and SAAB.

    Swedish social democrats have a surprisingly strong tradition of being quite pro-growth, and even pro-business. However, the hard left resurgence in the 1960s, culminating in the turmoil of 1968 radicalized the Social Democratic party. The tax level started climbing (through hidden taxes on labor and consumption), the labor market became dominated by labor union influence and regulations and the incentives for work, education and entrepreneurship were severely limited.

    As policy shifted, the growth of highly successful entrepreneurial ventures stagnated. A study by economist Sten Axelsson (Axelsson 2006) has examined the entrepreneurial ventures that had the highest revenues in Sweden in 2004. Only two out of 38 firms had been formed after 1970. If the firms were instead ranked after how many the employed, not a single one was shown to have been formed after 1970!

    Another study by economist Jonny Ullström (Ullström 2002) has looked at all the firms that were started in Sweden between 1986 and 1996. Among the 180,000 examined firms, 90 percent had fewer than five employees in 1997. Less than one among a thousand firms had 50 employees or more. Only eight of all the firms had 200 employees or more.

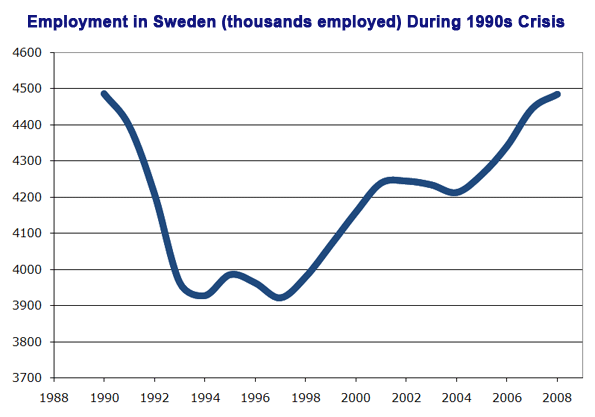
    The drop in entrepreneurship affected Sweden’s ability to deal with downturns. In the beginning of the 1990s, a new crisis hit Sweden. The global economy was growing strongly, but major obstacles faced the Swedish welfare state. Employment fell with almost twelve percent between 1990 and 1993. Within a few years the economy began to grow again. But employment stagnated. It remained until 2008 until Sweden reached the same level of employment as before the crisis.

    However, due to the previously mentioned reforms, the Swedish economy in 2008 was far more flexible than previous years, and thus better able to withstand the international downturn. Since the beginning of the 1990s, Swedish politicians amongst both the right and the left have realized the importance of moving towards greater share of economic freedom and following a generally fiscally conservative path In this time of worldwide crisis, this has helped Sweden’s economy to perform better than many others.

    This is not to say that more reforms are not needed to promote growth and entrepreneurship. Labor market regulations and taxes still depress successful entrepreneurship. For example, a person increasing her or his income with 100 Swedish Kronors has to pay fully 74 Kronors in hidden and visible taxes on employment and consumption taxes.

    Successful entrepreneurs are often highly educated people who already have a good career within large firms. But why spend time and energy on a new venture if up to three quarters of the gains are taxed away?

    Sweden is a nation with a strong history of entrepreneurship, great scientific institutions and strong working ethics. Today the nation stands stronger thanks to reforms towards greater level of economic freedom. But as long as taxes and labor market regulations block the way of growing businesses, the country cannot hope to repeat its stellar recovery course seen during the 1930s.


    Nima Sanandaji is president of the Swedish think tank Captus. He is the author of the book ”Entrepreneurs who go against the stream – what the 90s successful entrepreneurs can teach us” (Swedish title: ¨”Entreprenörer som går mot strömmen – vad 90-talets succéföretagare kan lära om dagens utmaningar”) for Fores.

    Photo by: jdlasica

    References:
    Axelsson, Sten (2006). ”Entreprenören från sekelskifte till sekelskifte – kan företag växa i Sverige?”, in Dan Johansson och Nils Karlsson (ed.), ”Svensk utvecklingskraft”, Ratio.

    Ullström, Jonny (2002). ”Det svenska nyföretagandet 1986-1997: förändringar i företagsstruktur och sysselsättningseffekter”,Vinnova.

  • San Francisco Considers the Country’s First Ban on Pet Sales

    Bay Area businesses beware, San Francisco is once again considering banning a common city commodity. This time it is not environmentalists, but city lawmakers who are howling for change. If San Francisco’s Commission of Animal Control and Welfare approves the proposed ordinance, it will be illegal to sell any pets in the city except for fish.

    Commission Chairwoman Sally Stephens, who seems to be the voice of pet sale opposition, claims that people buy small pets without thinking and end up giving them to shelters where they are euthanized. Those looking for an animal companion would have to buy one from a different city, adopt one from a shelter, or buy one through the classifieds. While this does make it that much harder to buy a pet on impulse, San Francisco residents would still be giving up their pets to shelters in the city. It also seems that many of the animals you would buy on impulse – guinea pigs, birds, and mice – do not typically go to shelters when they become difficult to manage or forgotten.

    Pet store owners around San Francisco are making a fuss as their major attractions are being threatened. Dogs can sell for a few hundred dollars or more at pet stores, and losing this income source would surely strike a blow to pet businesses. The Board of Supervisors has the final say, but pet lovers and owners around the city are piping up.

    As such a compact city, San Francisco seems to want to clear out any waste they set their sights on. Yesterday it was plastic bags, today it is animals. Who knows what San Francisco lawmakers will target next?

    Hat tip: Newsalert

  • SPECIAL REPORT: Move to Suburbs (and Beyond) Continues

    Anyone who challenges the notion that the long predicted exodus of people from the suburbs to the city has been wildly overstated is sure to generate some backlash from urban boosters. Alan Berube of the Brookings Institution contends in a New Republic column that “head counts” better reveal city trends than property trends or the massive condo bust. He points to a Brookings Institution analysis by Bill Frey, entitled “Texas Gains, Suburbs Lose in 2010 Census Review,” which compares trends in major cities and suburbs, but offers not a sentence demonstrating any actual population “loss” in suburbs (his point is that their growth rates have declined).

    However, Berube has a point. Head counts are the issue. The annual Bureau of the Census “head count” of domestic migration reveals that the suburban to urban core exodus is as elusive as it has ever been. Gross population totals reveal nothing with respect to movements between the suburbs and the core. There is no doubt that core city population trends have improved, and this is a good thing. However, there is not a shred of evidence that suburbanites are picking up and moving to the cores.

    Domestic Migration: This is indicated by a “head count” of migration trends during the decade and during the last year. Each year, the Bureau of the Census estimates the number of people who move between counties (domestic migration) and the number of people who move into metropolitan areas from outside the nation (international migration). The data is estimated at the county (equivalent) level, which means that, except where cities are counties (such as Baltimore, San Francisco and others), individual core city data is not available. Thus, the analysis has to rely on core versus suburban counties in metropolitan areas (Note 1).

    In short, the nation’s urban cores continue to lose domestic migrants with a vengeance, however are doing quite well at attracting international migration. Thus, core growth is not resulting from migration from suburbs or any other part of the nation, but is driven by international migration.

    The following analysis covers all but four (48) metropolitan areas with more than 1,000,000 population as of 2009. San Diego, Las Vegas and Tucson are excluded because they include only one county, so there is only a core county and no suburban county. New Orleans is excluded due to the special circumstances of the huge population losses from Hurricane Katrina.

    Generally, domestic migrants are leaving the nation’s largest metropolitan areas. Between 2000 and 2009, a net 1,900,000 domestic migrants moved to areas of the nation outside the largest metropolitan areas (Table 1). Domestic migration losses occurred 24 of the 48 metropolitan areas. In the last year (2008-2009), the net domestic out-migration for all 48 regions in total was 22,000, 90% below the 2000-2008 annual rate. A somewhat smaller number of metropolitan areas, 22, experienced domestic migration losses in the last year. Most observers, including Berube, trace this diminishing loss to the recession, which has made movement in any direction more difficult over the past two years.

    Table 1
    Domestic Migration: Major Metropolitan Areas
    2000-2009
    2008-2009
    Core County Classification
    Metropolitan Area
    Metropolitan Area
    Core
    Suburban
    Metropolitan Area
    Core
    Suburban
    1
    New York   (1,920,745)   (1,222,290)     (698,455)       (110,278)     (77,381)    (32,897)
    3
    Los Angeles   (1,337,522)   (1,102,202)     (235,320)         (79,900)     (76,674)      (3,226)
    2
    Chicago       (547,430)      (705,403)      157,973         (40,389)     (31,114)      (9,275)
    4
    Dallas-Fort Worth        307,907      (262,982)      570,889           45,241       (7,494)      52,735
    1
    Philadelphia       (112,071)      (154,338)         42,267           (7,577)       (5,496)      (2,081)
    4
    Houston        242,573        (69,736)      312,309           49,662       19,002      30,660
    4
    Miami-West Palm Beach       (284,860)      (297,637)         12,777         (29,321)     (25,142)      (4,179)
    1
    Washington       (110,775)        (39,814)       (70,961)           18,189         4,454      13,735
    3
    Atlanta        412,832            3,243      409,589           17,479         7,579        9,900
    1
    Boston       (232,984)      (100,485)     (132,499)             6,813             (32)        6,845
    2
    Detroit       (361,632)      (306,467)       (55,165)         (45,488)     (34,794)    (10,694)
    4
    Phoenix        530,579        404,840      125,739           12,441         4,651        7,790
    2
    San Francisco-Oakland       (343,834)      (245,796)       (98,038)             7,977           (207)        8,184
    4
    Riverside-San Bernardino        457,430        375,055         82,375               (616)       13,174    (13,790)
    3
    Seattle           42,424        (27,407)         69,831           17,035       11,053        5,982
    2
    Minneapolis-St. Paul         (22,865)      (138,395)      115,530           (2,503)       (1,989)          (514)
    1
    St. Louis         (42,151)        (62,990)         20,839           (4,532)       (3,197)      (1,335)
    4
    Tampa-St. Petersburg        254,650          89,385      165,265             4,663         2,630        2,033
    1
    Baltimore         (35,938)        (74,328)         38,390           (3,687)       (4,883)        1,196
    2
    Denver           61,108        (44,839)      105,947           19,831         6,369      13,462
    2
    Pittsburgh         (49,438)        (57,532)           8,094             1,144            401           743
    2
    Portland        120,437            3,811      116,626           16,320         7,053        9,267
    2
    Cincinnati         (18,313)        (87,976)         69,663               (384)       (2,833)        2,449
    4
    Sacramento        135,038          32,369      102,669             4,733       (1,185)        5,918
    2
    Cleveland       (133,679)      (151,448)         17,769         (10,191)     (10,875)           684
    4
    Orlando        218,108          46,341      171,767           (4,279)       (6,275)        1,996
    4
    San Antonio        175,552          96,856         78,696           18,984       10,797        8,187
    3
    Kansas City           30,181        (33,910)         64,091             3,929           (417)        4,346
    4
    San Jose       (233,133)      (226,545)         (6,588)           (5,361)       (4,829)          (532)
    3
    Columbus           32,087        (36,024)         68,111             5,018         1,907        3,111
    4
    Charlotte        243,399        104,402      138,997           19,211         8,299      10,912
    3
    Indianapolis           70,271        (53,039)      123,310             7,034       (1,209)        8,243
    4
    Austin        224,227          52,842      171,385           25,654       10,484      15,170
    2
    Norfolk-Virginia Beach         (19,172)        (19,391)              219           (8,052)       (3,559)      (4,493)
    2
    Providence         (50,151)        (38,129)       (12,022)           (6,736)       (4,939)      (1,797)
    3
    Nashville        120,684        (20,101)      140,785           10,826            128      10,698
    2
    Milwaukee         (72,668)        (89,476)         16,808           (2,336)       (3,585)        1,249
    4
    Jacksonville        125,881          17,866      108,015             1,758       (3,415)        5,173
    4
    Memphis           (8,834)        (61,325)         52,491           (5,276)       (7,867)        2,591
    3
    Louisville           33,700           (7,692)         41,392             2,122            262        1,860
    2
    Richmond           74,650           (4,839)         79,489             2,751                 3        2,748
    3
    Oklahoma City           41,523           (8,164)         49,687             8,798         3,236        5,562
    3
    Hartford           (9,385)        (22,089)         12,704           (1,847)       (1,949)           102
    3
    Birmingham           26,420        (26,550)         52,970             2,418       (1,424)        3,842
    3
    Salt Lake City         (32,760)        (43,779)         11,019               (164)           (911)           747
    4
    Raleigh        190,438        150,583         39,855           20,095       16,070        4,025
    2
    Buffalo         (53,191)        (47,780)         (5,411)           (1,711)       (1,806)              95
    2
    Rochester         (42,163)        (35,354)         (6,809)           (1,937)       (1,224)          (713)
    Total   (1,903,595)   (4,548,659)   2,645,064         (22,439)   (199,153)   176,714
    Major metropolitan areas: Population over 1,000,000 in 2009
    Core county classifications: See Table 2

    The core counties lost domestic migrants, often at very high rates. Between 2000 and 2009, more than 4,500,000 people moved out of the core counties. This is more people than live in the cities of Los Angeles and Washington, DC combined. The suburban counties did substantially better gaining more than 2,600,000 domestic migrants (nearly as many people as live in the city of Chicago), but not enough to negate the core losses. Over the past year, the core counties lost 200,000 domestic migrants, an annual rate approximately two-thirds less than the rate from 2000 to 2008. Suburban counties gained 175,000, a more than 40% reduction from the 2000-2008 annual rate. All of these rate changes are consistent with expectations in a recession, as fewer people move.

    If anything, the trends of the past decade indicate a further dispersal of America’s metropolitan population, with an additional 200,000 domestic migrants moving to the exurban counties adjacent to and beyond the major metropolitan areas (Note 2). Reflecting the effects of the recession, exurban areas lost 4,000 domestic migrants in the last year. This one year loss rate is less than 1/10th of the core county domestic migration loss rate over the same period. Another nearly 1.7 million domestic migrants left the major metropolitan areas and their exurbs altogether, moving to smaller metropolitan areas, smaller urban areas and rural areas.

    Between 2000 and 2008, 36 cores experienced domestic migration losses, compared to 10 suburban areas. The cores did better in the last year, with 29 losing domestic migrants, while 13 suburban areas lost domestic migrants. Further, more people moved into (or fewer moved out of) the suburbs from other parts of the country than to the cores in 42 of the 48 metropolitan areas between 2000 and 2009 and in 2008-2009.

    Moreover, not all urban cores are the same. Some, including most of the fast growing areas, are far more suburban than others. This is illustrated by a classification of core counties (Table 2) based upon the share of owner occupant housing built after 1949 (For for statistical purposes the beginning of automobile oriented suburbanization was with the census of 1950).

    Table 2
    Core County Classifications (Extent of Suburbanization)
    Core County Classification
    Share of Owner-Occupied Houses Built After 1949
      Dominant Urban Cores
    Less than 50%
      Moderately Suburban
    50% = <75%
      Substantially Suburban
    70% = <85%
      Predominantly Suburban
    85% & Over
    Data from 2000 US Census

    For example, in the core counties of the St. Louis and Boston metropolitan areas, there is little suburbanization, with more than 70% of houses having been built before 1950. Their growth truly reflects the attractiveness of traditional, relatively dense urban living. On the other hand, in the core county of the Austin metropolitan area, less than 10% of the houses were built before 1950, while in Phoenix, the figure is 3%. In these and other core counties that encompass large suburban areas, the vast majority of “urban” growth follows a highly suburbanized, auto-oriented model.

    The domestic migration results by core county classification are as follows:

    • Dominant Urban Core Central Counties (less than 50% of the housing stock built after 1949) lost 1.650 million domestic migrants, or 14.0% of their 2000 population. In the last year, the loss was 87,000.
    • Moderately Suburban Core Central Counties (50% to 69% of the housing stock built after 1949) lost 1.970 million domestic migrants, or 10.0% of their 2000 population. In the last year, the loss was 83,000.
    • Substantially Suburban Core Central Counties (70% to 84% of the housing stock built after 1949) lost 1.380 million domestic migrants, or 7.2% of their 2000 population. In the last year, the loss was 58,000.
    • Predominantly Suburban Core Central Counties (85% and more of the housing stock built after 1949) gained 450 thousand domestic migrants, or 2.0% of their 2000 population. In the last year, the gain was 29,000.

    By no stretch of the imagination, then, can it be validly claimed that the overall trend is people moving from the suburbs to the core. The evidence suggests that the more urban the core county, the greater are the domestic migration losses.


    International Migration: The real story with respect to core growth is international migration. The 48 metropolitan areas gained 6.4 million international migrants from 2000 to 2009 and 620,000 in 2008-2009. International migration, also impacted by recession, dropped by nearly a 15% drop from the 2000-2008 annual rate (Table 3).

    Table 3
    International Migration: Major Metropolitan Areas
    2000-2009
    2008-2009
    Core County Classification
    Metropolitan Area
    Metropolitan Area
    Core
    Suburban
    Metropolitan Area
    Core
    Suburban
    1
    New York     1,075,016      622,538      452,478        100,669     57,674      42,995
    3
    Los Angeles        803,614      628,303      175,311           75,062     58,557      16,505
    2
    Chicago        363,134      265,156         97,978           33,363     24,236        9,127
    4
    Dallas-Fort Worth        323,941      203,732      120,209           31,571     19,785      11,786
    1
    Philadelphia        122,733         50,761         71,972           12,944        5,560        7,384
    4
    Houston        289,648      252,098         37,550           27,996     24,371        3,625
    4
    Miami-West Palm Beach        506,423      318,888      187,535           51,548     32,380      19,168
    1
    Washington        310,222         23,112      287,110           31,904        2,096      29,808
    3
    Atlanta        207,238         42,082      165,156           20,288        4,093      16,195
    1
    Boston        191,014         64,359      126,655           19,250        6,522      12,728
    2
    Detroit           93,625         44,177         49,448             8,723        4,132        4,591
    4
    Phoenix        214,067      209,326           4,741           21,833     21,364           469
    2
    San Francisco-Oakland        257,318      161,324         95,994           24,376     15,373        9,003
    4
    Riverside-San Bernardino           90,652         46,829         43,823             8,464        4,313        4,151
    3
    Seattle        126,973         98,983         27,990           12,919        9,971        2,948
    2
    Minneapolis-St. Paul           84,440         69,262         15,178             8,234        6,756        1,478
    1
    St. Louis           29,782         11,794         17,988             2,928        1,112        1,816
    4
    Tampa-St. Petersburg           74,173         42,568         31,605             8,045        4,762        3,283
    1
    Baltimore           43,949         10,852         33,097             4,604        1,125        3,479
    2
    Denver           93,916         45,338         48,578             8,738        4,251        4,487
    2
    Pittsburgh           19,225         16,326           2,899             1,901        1,596           305
    2
    Portland           70,901         28,755         42,146             6,680        2,677        4,003
    2
    Cincinnati           22,364         12,754           9,610             2,245        1,260           985
    4
    Sacramento           64,275         47,169         17,106             6,056        4,420        1,636
    2
    Cleveland           28,002         20,168           7,834             2,826        1,987           839
    4
    Orlando           95,500         61,171         34,329           11,720        7,381        4,339
    4
    San Antonio           31,595         28,157           3,438             3,303        2,940           363
    3
    Kansas City           34,339         12,613         21,726             3,404        1,262        2,142
    4
    San Jose        170,452      168,009           2,443           16,347     16,116           231
    3
    Columbus           39,755         38,261           1,494             4,063        3,915           148
    4
    Charlotte           48,176         34,522         13,654             4,678        3,332        1,346
    3
    Indianapolis           27,676         22,058           5,618             2,809        2,239           570
    4
    Austin           65,958         56,828           9,130             6,406        5,516           890
    2
    Norfolk-Virginia Beach                421         (1,546)           1,967                867             81           786
    2
    Providence           34,926         25,547           9,379             3,753        2,741        1,012
    3
    Nashville           36,570         26,208         10,362             3,850        2,760        1,090
    2
    Milwaukee           26,814         22,612           4,202             2,706        2,292           414
    4
    Jacksonville           15,066         12,046           3,020             1,760        1,397           363
    4
    Memphis           19,845         17,801           2,044             2,093        1,874           219
    3
    Louisville           16,437         12,778           3,659             1,685        1,291           394
    2
    Richmond           17,061           4,161         12,900             1,805           440        1,365
    3
    Oklahoma City           23,717         18,698           5,019             2,394        1,878           516
    3
    Hartford           30,266         25,871           4,395             3,230        2,784           446
    3
    Birmingham           14,485         10,644           3,841             1,557        1,151           406
    3
    Salt Lake City           41,216         39,416           1,800             3,855        3,684           171
    4
    Raleigh           36,923         32,141           4,782             3,560        3,103           457
    2
    Buffalo             9,671           8,387           1,284                940           814           126
    2
    Rochester           12,796         11,657           1,139             1,243        1,123           120
    Total     6,356,310   4,024,694   2,331,616        621,195   390,487   230,708
    Major metropolitan areas: Population over 1,000,000 in 2009
    Core county classifications: See Table 2

    The core counties gained 4.0 million net international migrants between 2000 and 2009. The international migration gains in the dominant urban and moderately suburban core counties were not sufficient to compensate for the domestic migration losses (Figure 3). Surprisingly, the strongest gain in international migration from 2000 to 2009 was not in the more urban core counties, but rather was in the predominantly suburban core counties, at a 6.8% rate compared to 2000 populations.

    In 2008-2009, the core county gain was 390,000, approximately 15% below the 2000-2008 annual rate (Figure 4). The suburban counties gained international migrants, though fewer than the cores, adding a net 2.3 million between 2000 and 2009. Between 2008 and 2009, the suburbs added a net 230,000 international migrants, a 12% decline from the 2000-2008 annual rate.

    This of course measures only initial international migration. Over time many immigrants likely will head for the suburbs, which now are home to a majority. Core cities may be playing more of a “revolving door” role where they take in immigrants (and young people) for several years, then lose them, but replace the loss with newcomers.

    The Exodus: Elusive as Ever: The much ballyhooed suburban hegira has not begun, despite it having been announced repeatedly (Table 4). There is no doubt that the cores are doing better than in recent decades, particularly since the deep recession began. But the relative better urban performance may have more to do with stagnation than anything endlessly alluring about inner city life.

    Table 4
    Domestic, International & Total Migration: Major Metropolitan Areas
    PERSONS
    Net Domestic Migration: 2000-2009
    Net Domestic Migration: 2008-2009
    Net International Migration: 2000-2009
    Net International Migration: 2008-2009
    Net Total Migration: 2000-2009
    Net Total Migration: 2008-2009
    Core Counties (Share of Post-1949 Housing)   (4,548,659)     (199,153)      4,024,694         390,487        (523,965)     191,334
      Dominant Urban Core (Less than 50%)  (1,654,245)      (86,535)        783,416          74,089       (870,829)     (12,446)
      Moderately Suburban (50%-69%  (1,969,014)      (83,099)        734,078          69,759    (1,234,936)     (13,340)
      Substantially Suburban (70%-84%)  (1,377,714)      (58,419)        975,915          93,585       (401,799)       35,166
      Predominantly Suburban (85% & Over)       452,314        28,900     1,531,285        153,054     1,983,599    181,954
    Suburban Counties     2,645,064       176,714      2,331,616         230,708      4,976,680     407,422
    48 Major Metropolitan Areas   (1,903,595)       (22,439)      6,356,310         621,195      4,452,715     598,756
    Exurban Counties        198,294          (4,053)         364,498           36,740          562,792        32,687
    48 Metropolitan Areas & All Exurban Counties   (1,705,301)       (26,492)      6,720,808         657,935      5,015,507     631,443
    4 Excluded Metropolitan Areas          19,958         14,553         225,767           23,400          245,725        37,953
    All (52) Major Metropolitan Areas & Exurban Counties   (1,685,343)       (11,939)      6,946,575         681,335      5,261,232     669,396
    Smaller Metropolitan & Rural     1,685,343         11,939      1,678,369         173,570      3,363,712     185,509
    United States 0 0      8,624,944         854,905      8,624,944     854,905
    Major metropolitan areas: Population over 1,000,000 in 2009
    Excluded metropolitan areas: San Diego, Las Vegas & Tucson (no suburban county) and New Orleans (due to Hurricane Katrina)
    Exurban counties of excluded metropolitan areas are included (Las Vegas and New Orleans)

    As in Europe, people are moving to the urban cores. But also, as in Europe, they are moving there from across national borders, rather than from the suburbs (Figures 3 & 4). This will surprise urbanites who cannot imagine meaningful lives in the suburbs, but will not shock the many millions more suburban residents content enough not to move. The exodus from the suburbs to the core will not have begun until more moving vans head away from the suburbs than to them. To this point, this is simply not occurring. And when the economy recovers, history suggests that the gap between suburban and core growth rates may begin expanding again.


    Note: There is one core county in each metropolitan area, which is the county containing the first named city, except for in New York, where all five counties (boroughs) are included, in San Francisco-Oakland, where Alameda County (Oakland) is also included and in Minneapolis-St. Paul, where Ramsey County (St. Paul) is also included.

    Note: The exurban counties are those included in combined statistical areas (as designated by the Bureau of the Census), which have major metropolitan areas as their core.

    Photo: Suburban Minneapolis-St. Paul

    Wendell Cox is a Visiting Professor, Conservatoire National des Arts et Metiers, Paris. He was born in Los Angeles and was appointed to three terms on the Los Angeles County Transportation Commission by Mayor Tom Bradley. He is the author of “War on the Dream: How Anti-Sprawl Policy Threatens the Quality of Life.

  • Beijing on Track to Be World’s Busiest Airport

    For years, the world’s busiest airports in passenger volume have been Atlanta’s Hartfield-Jackson International and Chicago’s O’Hare. However, there are indications that this long dominance may be about to end. According to Airport Council International data for 2009, Chicago O’Hare had fallen to 4th position, following Atlanta, London-Heathrow and Beijing Capital International Airport.

    Beijing’s Capital International increased its passenger volume by 17% in 2009, while European and American airports were experiencing slight declines due to the recession. Beijing’s increase is more significant, because growth might have been expected to level off after the 2008 Olympics, which were held in Beijing. Between 2008 and 2009, Beijing rose from 8th in the world to 3rd, and from 20th place in 2004, when its volumes were approximately one-half the present level.

    Early 2010 data (first quarter) indicates that Beijing Capital International has become the second busiest airport in the world, trailing only Atlanta. Passenger volumes were up 10.5% from a year earlier. If the current rate of growth continues, Beijing should pass Atlanta in two to three years, even if the American economy improves.

    London’s 130 million annual passenger traffic was the greatest of any metropolitan area in the world in 2009 (distributed among five airports). The new Conservative-Liberal Democrat government seems determined, however, to forfeit this ranking, having banned further London airport expansions to combat what it calls “binge flying.”

    New York was second with passenger traffic of 105 million at its three major airports, while Tokyo was third at 95 million. “Binge flying” does not seem to be a concern in Japan, where Tokyo’s Haneda Airport is adding a fourth runway and will soon serve international flights again, providing competition to more distant Narita. Atlanta’s single airport handles an annual passenger volume of 88 million.

    Other airports in China are also growing. In the Pearl River Delta (the world’s largest “mega-region,” an area of adjacent urban areas), the four large airports, Hong Kong, Guangzhou and Shenzhen accommodated passenger traffic of more than 105 million in 2009. Traffic at Shanghai’s Pudong and Hongqiao grew 14% and 10% respectively.

    Overall Chinese air traffic is also growing rapidly. Over the past 10 years, annual passenger volumes have risen an average of more than 25%. This compares to an average annual growth rate of 3.2% in the European Union (EU-27), 1.6% in the United States and 1.1% in Japan (Figure). The US continues to be dominant in passenger volumes, at 940 billion annual passenger kilometers, compared to 560 billion in the European Union, 280 billion in China and 80 billion in Japan (data calculated from US, Europe, China and Japan national sources).

  • Stagnation in the City of Angels: Whatever Happened to Ideas?

    It’s only been a couple of years since a red-hot real estate market had our city riding high. The market turned out to be a bubble, of course, and it eventually burst. Gone is the giddiness that comes when folks convince themselves that real estate or high tech stocks or any other trend or commodity can defy gravity and continue upward forever.

    Yet giddiness isn’t the only thing that’s been lost. Ideas have disappeared from the political landscape of Los Angeles.

    That’s particularly unfortunate because there’s plenty of work to be done after bubbles burst—everything from big efforts on the macro-economic level to the everyday challenges of mending lives torn asunder by financial strains. Local government can play a key role in such efforts. That means that politics is part of the picture—and that means that our city’s politicians have a chance to help by coming up with new ideas on how to spur a recovery.

    Yet our recovery is dragging along in Los Angeles. The federal government’s own struggles and the dire straits faced by state officials surely complicate the job at the local level, but those don’t fully explain the malaise we’re living through right now.

    It’s more likely that our city suffers from a dearth of ideas because our politicians became addicted to the red-hot real estate market. It’s looking more and more as though that became their one and only idea. They skimmed off the rising tide of real estate, used the money to buy political points, and stopped thinking about any new ideas.

    It worked for 10 years or so. The values of homes and other properties went up, and so did the city’s revenue. Developers paid fees to build residential and commercial units, buyers paid higher property taxes in the rising market, homeowners borrowed against their houses and spent freely, paying sales taxes along the way.

    All of the action sent streams of revenue to various levels of government, and much of the money found its way to the city’s coffers. Local politicians used the money to take care of donors with favorable deals, satisfy labor unions by expanding payrolls and paychecks for city employees, and provide basic services to enough voters to maintain the status quo.

    Now the revenue streams have dwindled, and there’s not enough for our politicians to finance their old scheme.

    There have been many reactions to our city’s challenges, but not much in the way of ideas. Our politicians have jumped from budget projection to budget projection, cutting here, threatening to cut there. Outside City Hall is a different story, as the populace begins to sense that this is all reaction with no basic idea. Whatever happened last week means nothing this week because the next budget report could prompt any sort of reaction from the politicians. There are no guiding principles or declared values—no ideas—for our city.

    This became clear to me when I realized that our City Councilmembers and our mayor used to send out all sorts of press releases back in the days of the real estate boom. There were notices that some project had been completed or another had just started. They almost always involved the expenditure of city funds, and went on about the politician who flipped whatever switches made the money flow.

    Now the money has dried up, and press releases are few and far between.

    That makes sense—if you accept the premise that spending money is the basis of any and all ideas when it comes to public policy.

    The truth is that more ideas are needed when there’s no money to spend. Yet I can’t remember the last time I saw a press release about an idea from the mayor or a City Councilmember on how to save money without cutting jobs or programs. I don’t recall any notices of a new idea that will maintain services without adding costs. I haven’t seen any communications that indicate our politicians have come up with any new ideas to meet the challenges our city now faces.

    It appears that we have an entire generation of politicians who see spending money as the whole idea of government.

    Well, we’re out of money.

    We need to know if our politicians have any other ideas.

    And they shouldn’t worry if they’re all out—voters are getting a few ideas of their own.

    Jerry Sullivan is the Editor & Publisher of the Los Angeles Garment & Citizen, a weekly community newspaper that covers Downtown Los Angeles and surrounding districts (www.garmentandcitizen.com).

    Photo by: AndrewGorden

  • Economics: Green Shoots & Immigration

    A year ago we were hearing all about green shoots. Analysts claimed to find them everywhere.

    Today, we never see the term. In fact, there seems to be a growing malaise. By the end of June the first quarter’s Gross Domestic Product (GDP) estimate was revised downward a full half a percent, to 2.7 percent. Pundits are depressed. Our President and Secretary of the Treasury are telling the world that the United States cannot lead the world to sustained economic growth. Our Vice President announced that “there’s no possibility to restore eight million jobs lost in the Great Recession.” Our stock markets are down and volatile. Risk premiums have soared.

    What happened?

    Reality happened. The green shoots were always ephemeral, the result of massive government spending increases or temporary government programs. We had housing stimulus programs. We had Cash for Clunkers. We had foreclosure programs. We had bailouts.

    The increased spending and the various programs had an impact. Because of the way GDP is calculated, an increase in government spending results in an increase in GDP, but that is today’s GDP, not tomorrow’s. Tomorrow’s economic growth is a result of investment today, investment in physical capital, technology, and human capital.

    To the extent that government spending detracts from those investments, the growth we saw was cannibalized from the future. For example, the housing stimulus programs served only to change the timing of real estate purchases. Sales fell when the programs ended.

    Even worse, some programs resulted in temporary GDP growth, but were actually detrimental to long-term economic growth. The Cash for Clunkers program destroyed capital, since perfectly good cars were crushed. The foreclosure prevention programs delayed the needed decline in home ownership rates.

    The bailouts prevented assets from being transferred to more productive uses. Bailouts are inefficient, and they prolong periods of economic weakness. Uncertainty and risk premiums remain elevated, holding investment to a minimum, limiting short-term and long-term economic growth. They also leave a hangover of debt, which limits future growth.

    None of the programs addressed the underlying problems of the current economic circumstances, or paved the way for sustained economic growth. The immediate problem was that businesses, consumers, and governments were over-leveraged after September 2008’s asset-value collapse. The longer-term problem was insufficient investment, a result of years of credit-fueled consumption.

    What was needed was investment. What was provided was more credit-fueled consumption. You might be able to borrow your way to prosperity, but to do that you better be investing the borrowed funds. We didn’t do that. Instead we used the government as a bank to increase consumption. Credit-based consumption is not the way to long-term prosperity, regardless of who does the borrowing.

    And, while it appears that most of the decline in asset values has ended, over-leverage is still with us. Indeed, the increase in government leverage makes it more difficult to employ effective government intervention, government investment in productivity-enhancing capital and technology, and investment tax credits.

    Add to these factors the millions of American households, employed and unemployed, that remain over-leveraged. Millions of consumers have been unemployed for months, and many of those still working are uncertain about their future employment. Those who have the income to do so are attempting to pay down debt, and to reduce consumption in the process. The consumer is not likely to soon be a source of rapid economic growth.

    So, we have most or all of the problems of a year ago, but now, because of increased government debt, we have fewer options. Even worse, we now have new problems that were not present in September 2008.

    Today, sovereign default risks are significant and increasing. While potential sovereign debt problems in Europe have received a great deal of attention, the problems are not limited to the continent. Japan continues to have very high debt and deficits. Several U.S. states could also default. A failure of an American state is likely to have impacts very similar to the failure of a small European country.

    I don’t believe that the failure of a country is the most likely outcome, however. Instead, expect to see more international bailouts, just as you can expect to see the federal government bailout several American states.

    Our options are limited, but we do have one option that would provide immediate and sustained economic growth without increasing leverage. That option would be a massive increase in immigration.

    The initial benefits of a new wave of immigration would be seen remarkably quickly. Housing demand would increase, leading to renewed vigor in our real estate markets and the construction industry. Our inner cities would be renewed, as they always have been by immigration waves. New business formations would soar. The tax base would increase, helping to fund debt repayment and baby-boomer retirements.

    Many would oppose such an immigration increase. They worry about increasing job competition, unemployment, crime, and even more demand on welfare programs.

    These fears are misplaced. Criminals are easily sorted out by effective screening processes. People don’t migrate for welfare benefits, but if this is a concern, it is easy to deny immigrant access to social programs for some number of years after immigration. Similarly, people don’t migrate to be unemployed, and unemployment benefits can be denied to immigrants.

    People migrate to more effectively use their human and physical capital, their technology, and their labor. Effectively, immigration would provide new capital, technology, and labor. This is exactly what we need, and it is free. Immigration has served America well in the past. It can serve us well today.

    Red and Green, photo by Rupert Maspero

    Bill Watkins is a professor at California Lutheran University and runs the Center for Economic Research and Forecasting, which can be found at clucerf.org.

  • Demographics: The Elderly Dividend

    Some 40 million Americans are now over age 65, and about 6 million are over 85. In the land of Denny’s, anyone over 55 can order the senior platters. Would I be right in guessing that 30 million American children spend part of their time looking after their parents?

    Like many baby boomers, I spend a considerable amount of my time in the company of my ninety-something parents. That involves fixing meals, opening car doors, reading Maureen Dowd aloud from the newspaper, adjusting hearing aids, listening to doctors, cleaning out the garage, and cajoling them to eat more or less food.

    Many care days are a blur of pill administration, shopping, desk sorting, gas-filling, and lunch preparation, to the point that, instead of actually visiting with my parents, I become just another worker on the assembly line of old age.

    Keep in mind, too, that my parents are among the luckier senior citizens, in that they have savings to invest in their quality of life, and the time that I devote to them is, while considerable, part-time. Both are sustained by a devoted network of caregivers who do the heavy lifting into the showers or out of the chairs. .

    In the last four years, my mother has had several bouts of pneumonia, a broken hip, and memories closer to the summer of 1938 than to yesterday’s events. In January of this year she was consigned to hospice, only to “graduate” some weeks later. After the doctors stopped her medications, with only the medicine of love — daily visits from my father, the company of my sisters, and a companion — she willed herself more time, and even now walks to dinners.

    My father does not see, hear, or walk particularly well, yet thanks to his courage and his care group, he still occasionally commutes to his office in New York and leads inspirational seminars for those less fortunate than he is. On a recent visit, I took him to a New York City book party, a Revolutionary War museum, and a high school graduation. On his own, he attended a board meeting.

    In economic terms, my parents’ old age is a cottage industry, providing all sorts of work for aides, nurses, orderlies, doctors, hospital staff, gardeners, and the like. They live in a retirement community, which has many benefits, mostly the company of stimulating friends.

    Across much of the United States, golden years are seen in much the same way that Eskimos look upon a beached whale. It makes sense that the elderly would be easy marks. They have savings from a lifetime of work, are vulnerable and need help, and staying alive is a good use of their time and money.

    In the cost-benefit analysis of old age, is it worth it? This question came up during the recent health care debate, in which the specter of “death panels” was raised as a coded phrase to ask whether the elderly use up too much of society’s assets.

    The projection is that twenty percent of the population will be over age 65 in 2030, when the U.S. will have the same demographics that Florida has today. Like everyone else, I have watched the television reports about ninety-five year old patients, terminally ill with cancer, being given hip replacements.

    No wonder the annual budget of the American Association of Retired People is $5.5 billion, in part to block a rise in the retirement age to 70 or 72. When 65 was chosen, only two to three percent of the population lived beyond that age. Think of 85 today.

    As an investment, old age does not look like much of a deal. Caring for older people is ruinous to public and private balance sheets. Medicare and Social Security, if left unattended, will bankrupt the United States.

    Even if the country picks up some of the $51 trillion in projected medical and retirement benefits, families themselves will still pay billions for private nurses, retirement homes, and uninsured medical costs. Think of how many families lose their life savings in the last years of their parents’ lives. The nursing home “tax” precedes that of inheritance.

    Admirable as is the goal of universal health care, its bottom line is to transfer even more money into the accounts of those in the senior-citizen business. Health care is approaching twenty percent of the domestic economy, and a disproportionate amount of that money goes to profit centers that benefit from the elderly. Does America have crumbling infrastructure because its seniors are living well into their nineties?

    Here is a contrarian view: Rather than looking at old age as a bad investment, I tend to see it as a gift that cannot be measured in economic terms — something closer to Thomas Jefferson’s “life, liberty, and the pursuit of happiness” than to a negative cash flow statement.

    To be sure, looking after elderly parents is an emotional and physical strain. The days start early and end late, and involve sadness and frustration. I can say, however, that I enjoy my parents’ company, in their nineties, as much as I did when I was growing up or when they were in their fifties and sixties.

    For starters, older parents are great listeners, and mine love nothing more than the narrative of their children’s and grandchildren’s lives. I am just back from three weeks in their company, and in many ways all we did was talk—old age as a Viennese café. From friends I got snatches of conversation while they glanced at their iPhones or rushed off to meetings. From my parents I got hours, even days, of their undivided attention.

    Thanks to my parents’ old age, I have also learned a lot about the American Revolutionary War, as on each visit to them I lead an expedition to a New Jersey or Pennsylvania battlefield. In recent years, between all the medical crises, I have driven them to Monmouth, Valley Forge, Brandywine, Trenton, Princeton, Germantown, Morristown, Rockingham, and Somerville, and we have talked endlessly about Washington’s failings as a general, General Charles Lee’s court martial at Monmouth, and the British preoccupation with the spice islands, diverting subjects that we all prefer to dementia’s 36-hour day.

    I like also the laughter of old age. When not too tired, my sisters and I joke about the everyday amusements that we encounter. Ever the gracious hostess, my mother, during an early meeting with the hospice team, whispered to ask me if we had “any cheese and crackers” to serve them. In the hospital, she assumed that two of her doctors, in white lab coats, were hairdressers, and asked them, “How much for a trim?”

    More than the pills, I think it’s the shared company and the laughter that keeps my parents alive. I read Onion headlines to my father (such as “Supreme Court Upholds Freedom of Speech in Obscenity-Filled Ruling” or “Pope Forgives Molested Children”). While we were watching golf, my mother gave me a knowing look when the announcer mentioned Tiger Woods.

    During my mother’s illness this winter, we adult children rushed to her bedside. But then, as we had not been together in a while, we started talking and laughing amongst ourselves, even though the doctor had given her about three days to live. Although we were sitting around a hospital bed, it could have been the patio of our childhood home. Later that day, my mother said to my younger sister, “This is fun. We should do this more often.” She’s still with us.

    Flckr photo by Bensons

    Matthew Stevenson is the author of Remembering the Twentieth Century Limited,winner of Foreword’s bronze award for best travel essays at this year’s BEA. He is also editor of Rules of the Game: The Best Sports Writing from Harper’s Magazine. He lives in Switzerland.

  • The Need to Expand Personal Mobility

    Few books in recent memory have started from as optimistic or solid a foundation as Reinventing the Automobile: Personal Urban Mobility for the 21st Century. Reinventing the Automobile conveys a strong message that improved personal mobility is necessary and desirable:

    “Have we reached the point where we now must seriously consider trading off the personal mobility and economic prosperity enabled by automobile transportation to mitigate its negative side effects? Or, can we take advantage of converging 21st century technologies and fresh design approaches to diminish those side effects sufficiently while preserving and enhancing our freedom to move about and interact? This book concludes the latter.”

    The authors include William J. Mitchell, Professor of Architecture, and Media Arts and Sciences at the Massachusetts Institute of Technology directs the Smart Cities research group at the MIT Media Lab, Christopher Boroni-Bird, Director of Advance technology Vehicle Concepts at General Motors and Lawrence D. Burns, who consults on transportation, energy and communications systems and technology. The book is published by the MIT Press.

    Getting Urban Economics Right

    The authors start with getting the urban economics right. They recognize that the “freedom and prosperity benefits” of the automobile “have been substantial.” They note that the automobile industry “set the stage for the growth of the middle class,” something that has been labeled the “democratization of prosperity.” The authors say that the car “enabled modern suburbia” and “powered a century of economic prosperity.” This refreshing treatment is consistent with the overwhelming economic evidence that links personal mobility with prosperity, such as by Remy Prud’homme and Chang-Wong Lee, David Hartgen and M. Gregory Fields and others. It is also at considerable odds with the widely accepted, somewhat nostalgic planning orthodoxy that rejects private automotive transport as “unsustainable”, unaesthetic and anti-social. This ideology embraces the illusion that forcing people to travel longer, with less personal flexibility somehow will improve the economy and raise the standard of living.

    The Future of the Automobile?

    The authors envision a automobile characterized by a new “DNA.” It starts with smaller cars, fueled by electricity and hydrogen (fuel cell technology). It also begins with an understanding that the cars used in many mundane urban operations today – for example getting to the market or pick up the kids at school – are over-engineered. They are far larger than is needed for most trips, their capacity for speed exceeds urban requirements and their range between refueling is also more than needed.

    The authors would re-engineer urban vehicle to the needs of metropolitan dwellers, an “ultra-small vehicle” (USV). The designs proposed include far lighter cars that can be easily “folded” up to minimize parking space requirements. Cars would be connected to one another by wireless technology, all but eliminating the possibility of collisions. The cars would be small enough that they could be assigned special dedicated lanes on current freeways and streets. Travel would be less congested because the dedicated lanes would have a far higher vehicle capacity, while the interconnectedness would allow cars to safely operate closer to one another.

    The combination of electricity, hydrogen, wireless technology and the USV would bring additional benefits. This would permit improved vehicle routing, as drivers would be advised take alternate less congested routes. This would also, in time, lead to self-drive cars, about which Randal O’Toole has recently written, made possible by the use of wireless technology and that dedicated lanes would make possible.

    Empowering Transit Riders through Car Sharing

    Car sharing is an important part of this future, for dwellers of dense urban cores, according to Reinventing the Automobile. The author’s note that car sharing can solve the “first mile-last mile” problem making it possible for transit users to speed up their trips by not having to walk long distances to and from transit stops. Indeed, car sharing programs are set to be adopted in urban cores with some of the world’s best transit systems, such as Paris, and London. Privately operated car sharing systems have been established in a number of US metropolitan areas, such as Atlanta, Denver and San Francisco.

    Progress with Conventional Strategies

    The longer term vision of the MIT Press authors may take a while to unfold, but we can already see potential for progress. Just this week, “super-car” developer Gordon Murray announced development of an urban car (the T25), smaller than the “Smart,” which would achieve nearly 60 miles per gallon, with plans for marketing within two years. Volkswagen has developed a “1-litre” car, which would achieve 235 miles per gallon on diesel fuel. All of this makes the 51 mile per gallon Toyota Prius seem gluttonous by comparison

    These developments and the Reinventing the Automobile vision show that it is unnecessary to tell people in America (or Europe or the developiung world) that they must give up their automobiles. That is good news. The social engineering approaches requiring people to move from the suburbs to dense urban cores and travel by slower, less frequent transit are incapable of achieving serious environmental gains (see below) and can not seriously be considered progress or desirable by most people in advanced countries.

    The Superiority of Technology

    This is illustrated by recent developments in automobile technology and research (Figure).

    • Before the adoption of the new 2020 and 2016 new car fuel economy standards, the US light vehicle fleet was on track to increase its greenhouse gas (GHG) emissions nearly 50% from 2005 to 2030 (the green dotted line in the figure).
    • As a result of the new fuel economy standards, Department of Energy projections indicate that greenhouse gas emissions from light vehicles will be one-third less by 2030 compared to the 2005 fleet (the yellow dotted line), and this is at the standard projected driving increase rates that could well be high.
    • The smart growth strategies of land rationing, densification and discouraging driving would produce, at best, a marginal reduction in GHG emissions, using the mid-point of the recent proponent research (Moving Cooler), indicated by the solid blue line. Actually, this overstates the impact of smart growth, since it discounts the substantial GHG emissions gains that result from higher fuel consumption in more congested traffic produced by densification.
    • The potential for technological advance is illustrated by the green solid line, which estimates the GHG emissions from light vehicles in 2030 if the average fuel economy were equal to today’s best hybrid technology.

    Overall auto-centered technology-based strategies – such as the improved fuel economy standards and the hybrid fuel economy – would each produce about 15 times as much benefit as the smart growth strategies proposed by such studies as Moving Cooler. This approach would not only be far more productive in terms of environmental improvement but would not require interfering with people’s lives in ways that would require longer trips times, less convenience, seriously retarded job access and, inevitably, fewer jobs and lower levels of economic growth.

    Technology: The Only Way

    It would be a mistake – and likely political folly – to force a re-engineering our way of life in order to enact strategies with dubious environmental benefits. In the final analysis, personal mobility must be retained and expanded, because there is no alternative that is acceptable to people, whatever system of government they happen to live under. Reinventing the Automobile paints the most optimistic picture to date and, if given due serious treatment, could prove a debate changer.

    Photograph: Manila suburbs

    Wendell Cox is a Visiting Professor, Conservatoire National des Arts et Metiers, Paris. He was born in Los Angeles and was appointed to three terms on the Los Angeles County Transportation Commission by Mayor Tom Bradley. He is the author of “War on the Dream: How Anti-Sprawl Policy Threatens the Quality of Life.

  • Singapore’s Demographic Winter

    Over the past half century arguably no place on earth has progressed more than the tiny island state of Singapore. A once impoverished, tropical powder keg packed into 268 square miles at the foot of the Malay Peninsula, the Mandarin-led republic has ascended from its difficult founding in 1965 to one of the richest economies on the planet. Today, in terms of purchasing power, its per capita income stands higher than most European countries’ or Japan’s and is roughly equal to that of the U.S.

    But a catastrophic plunge in the country’s birthrate–a problem plaguing many of the world’s affluent economies–could undermine Singapore’s success. In 1965 Singapore’s leaders feared it could not survive an unsustainable fertility rate above 3.5 and embarked on a campaign encouraging citizens to have smaller families. Today the country’s fertility rate–the number of children per female–has sunk to roughly 1.2 , a rate lower than all but a handful of countries and well below replacement level.

    This pattern poses a threat to the republic’s continued progress over the coming decades. The dependency ratio between retired persons and those 15 to 64–far lower than Europe, America or Japan in the 1970s–will reach the unsustainable levels of places like Japan, Germany and Italy by 2030. By then there could well be more people over 65 than under 15.

    This shift in demographics is a common challenge for almost all advanced countries–even the U.S., which enjoys the healthiest demography of any major wealthy nation. In Europe and particularly Asia, once challenged by overpopulation, there is the looming prospect of what a new documentary calls the “demographic winter.”

    Of course, not everyone finds this “winter” a chilling thought. A growing chorus of environmentalists, particularly in Europe and the U.S., sees the shrinking numbers of “little monsters” a boon for the planet.

    Peter Kareiva, the chief scientist at the Nature Conservancy, one of the more levelheaded environmental organizations, has concluded that not having children is the most effective way of reducing “carbon scenarios” and becoming an “eco hero.” Meanwhile the more extremist Voluntary Human Extinction Movement promotes the lovely notion of terminating the species through voluntary childlessness.

    For their part, Singapore’s leaders have focused on providing parkland, building a functioning subway and recycling city wastes. But these pragmatists show little tolerance for such Western-style species self-hatred. A society proud of its accomplishments, its agglomerated cultures–Chinese, Indian, Malay–continue to value family as the supreme societal unit.

    At the same time, many leaders trace the depth of their demographic problem to their own campaign to limit families back in the 1970s. “We have been very successful in reducing the birthrate,” observes Lui Pao Chuen, adviser to the National Research Foundation and a prime architect of Singapore’s defense systems. “The society will die if it goes on like this. We want our society to live on.”

    In the past decade Singapore’s leaders have tried to change course, attempting to raise the birth rate by offering generous cash incentives and other inducements for baby-making. But so far, they admit, these efforts have had little effect.

    Part of the problem may lie with high densities, an inescapable reality in a city-state with literally no suburban periphery. Singapore’s public housing–80% of citizens live in government flats–is generally better and larger than those in other Asian countries. Still the prospect of raising children in a 1,000-square-foot, two-bedroom flat may seem less appealing than doing so, say, in a suburban housing estate in Australia, New Zealand, California or Texas.

    Equally intractable may be the very competitive spirit at the heart of the republic’s success. Singapore possesses two great natural advantages: a strategic location between the Pacific and Indian Oceans and a motivated population. The city’s leaders have done a brilliant job of capitalizing on both, developing one of the world’s largest ports and one of Asia’s best-educated, hardest-working populations.

    This in turn has created a population that often places education and career advancement over child-raising, marriage and even dating. Some 85% of singles still express a desire to get married, and nearly 80% want two or three children. But the pressure to succeed often prevails. “The pace of life has people putting things on hold,” admits NG Mie Ling, coordinating director for the government’s Family Development Group.

    Despite these challenges, Singapore may not be doomed to follow Europe and other advanced east Asian nations into the demographic dustbin. For one thing, the city’s bureaucracy is cleverer than most and may be able to change some policies–placing more emphasis on leisure time for mate-chasing and child-raising to building larger apartments–to reverse the current birth dearth.

    Singapore’s unique ethnic and national identity may prove an even bigger asset. Unlike its Asian rivals, Singapore–though mainly Chinese–remains a truly multiracial society. Like America, it is a nation of immigrants. Few can trace their local roots there more than two or three generations. This makes the Republic more suited for accommodating newcomers from China, India and Malaysia, as well as from countries like the Philippines or Vietnam.

    Newcomers can find a kindred ethnic or religious community. Many also intermarry with Singaporeans; over 40% of all marriages are between citizens and noncitizens, up from only 30% a decade ago. Interracial marriages are also increasingly common. Whereas it is virtually impossible to become Japanese or Korean, one can become a Singaporean.

    Immigration allows Singapore’s population and skilled workforce to grow at a healthy clip despite the low birth rate. Today barely 3.2 million of the current nearly 5 million Singaporeans are citizens; many others immigrate to enjoy the excellent schools, the high degree of safety and cleanliness and a political stability that is rare in the region. Last year 60,000 people were granted permanent residency and nearly 20,000 became citizens.

    “We are still trying to figure out what it is to be a Singaporean,” observes Calvin Soh, chief creative officer in Asia for the Publicis advertising company. This evolving identity may not be obvious in the city’s impressive but hardly unique office, hotel and condo complexes. It is best illustrated in the city’s remarkable neighborhoods with their open air markets and a strikingly diverse food culture flourishing both in small, family-owned restaurants and hawker stalls.

    The city’s internationally recognized food scene, Soh believes, could serve as a model for other cultural products, from media and fashion to product design. Ideally suited to serve as the crossroads culture of 21st-century Asia , Singapore can emerge like 14th-century Venice, which flourished by connecting Europe with the civilizations further to the east.

    Like their counterparts in other successful countries, Singapore’s executives and administrators face enormous demographic challenges. But if any Asian society can confront, or at least ameliorate, the great fertility crisis, it is this tiny island country with a track record of solving seemingly insurmountable problems.

    This article originally appeared in Forbes.com.

    Joel Kotkin is executive editor of NewGeography.com and is a distinguished presidential fellow in urban futures at Chapman University. He is author of The City: A Global History. His newest book is The Next Hundred Million: America in 2050, released in Febuary, 2010.

    Photo by FeebleOldMan

  • Phantom Exodus Driven by Phony Cost Comparisons

    If Tara Siegel Bernard of The New York Times is right, (city of) New Yorkers must be among the most irrational people in the world. In “High-Rise or House with Yard,” she describes the purported financial advantages of living in a co-op apartment in Brooklyn versus suburban South Orange, New Jersey.

    The irrationality is that, despite the money that households can save by staying in the city, a net more than 350,000 left for the suburbs between 2000 and 2007, as E. J. McMahon and I found in Empire State Exodus, which summarized IRS inter-county migration data. Indeed, each of the city’s five boroughs lost domestic migrants to the suburbs during the period. An analysis by The New York Times itself found that the city had lost net domestic migrants to every suburban county in the metropolitan area as well as to every county in newly exurban northeastern Pennsylvania. This includes Allentown-Bethlehem and Scranton-Wilkes Barre, toward which New Jersey land use regulations have driven new development.

    “High Rise or House with Yard” stands alone in claiming that New York City is less costly than its suburbs. The most recent (and authoritative) ACCRA cost of living index for Brooklyn is a full 40% higher than in the South Orange (the Newark-Elizabeth area). This is before considering the fact that the Brooklyn home is a 1,000 square foot coop apartment with two bedrooms and one bath, while the suburban home is a 2,000 square foot house in South Orange with four bedrooms and 2.5 baths. Smaller apples may well be less expensive than bigger oranges. The Times also assumes that the suburban resident will commute by train to Manhattan, at more than $400 per month. It is also possible that, like 80% of South Orange commuters, the new suburbanite may choose to work in the New Jersey suburbs. Maybe New Yorkers are not all that irrational after all.

    Moreover, people are moving even further than the suburbs and exurbs, with almost as many people moving from New York City even further away. The latest Bureau of the Census data indicates that every borough experienced a net domestic migration loss between 2000 and 2009. More than 1.2 million residents left New York City, nearly as many people as live in the cities of Washington and Boston combined.

    • Manhattan lost more than a 140,000 net domestic migrants, more people than live in the city of Hartford.
    • Brooklyn lost nearly 450,000 net domestic migrants, more people than live in the city of Miami.
    • Queens lost a 420,000 net domestic migrants, nearly as many people as live in the city of Cleveland.
    • The Bronx more than 200,000 net domestic migrants, more people than live in the city of Providence, Rhode Island.
    • Staten Island did much better, losing only 5,000 net domestic migrants. But then, much of Staten Island looks more like suburban New Jersey than New York City

    In the face of these losses of which at least some at The New York Times are aware, the article notes that “Many empty-nesters are giving up the high-maintenance house in the suburbs in exchange for the attractions of city life.” Not that many.

    Photo: New Jersey Suburbs