Blog

  • VITAMIN G

    I need a stronger dose of Vitamin G. No, not Riboflavin or Vitamin B2 as it is sometimes called, but Vitamin G: the Green Space Vitamin! Everyday there seems to be more data confirming my personal beliefs that being around, in and associated with green space promotes health, well-being and an enhanced social safety network (reducing stress, anger, frustration and aggression) in all of us. There is a strong, positive relationship found between the amount of green space in our living environment and physical and mental health and longevity.

    Researchers have been studying this issue for some time and have discovered that us, human beings, are “phytotrophic”- we are attracted to environments that include trees, grass and other natural elements.

    Much like a vitamin that you eat, drink or rub on your skin, Vitamin G can be taken in many ways. Research shows the benefit of nature broadens to varying avenues of exposure and beneficial contact with nature need not involve getting one’s hands dirty. Gardening is beneficial, but so is walking, jogging, biking or even canoeing through a natural setting.* Even non-nature focused activities, such as reading or playing basketball, in a relatively green setting is more beneficial than the same activities indoors or in a less green outdoor setting.* Even a simple window view has measurable effects. Also like a vitamin, evidence suggests that contact with nature is needed in frequent and regular doses.

    “Vitamin G seems to be beneficial regardless of its physical form. Research shows that the benefits of nature seem to extend to a tremendous variety of stimuli (e.g. large forests, small urban gardens, prairies, nature preserves, vest-pocket parks, mountains, landscapes with water features, an aquarium in an office, tree-lined city streets, shady back yards, and soccer fields).”* Seeing and being in any form of green space benefits us, regardless of its shape, size and texture.

    Unfortunately, many policy makers, at least up until now, view green space as a luxury good rather than as a basic necessity, overlooking the important and beneficial effects of green space on our health, well-being and safety. In fact, for those of us tied to our homes a bit more closely (elderly, children, low income adults), defined green spaces are even more important to our health! “The tight integration of natural elements into the urban fabric can now be thought of as preventative medicine – a public health measure designed to reduce physical, social, and psychological breakdown in urban dwellers.”

    For many of us that don’t have the opportunity (and that green peace of mind derived from this) of owning a cabin or destination green space, we need better policy, design and implementation to happen within our communities, in order to maximize our exposure to Vitamin G. I know in St. Louis Park, we try to incorporate many green items, for example we have a master sidewalk and trail plan (some of it still needs to be implemented, but it is planned for) that provides opportunities to experience green boulevards, parkways, wooded areas and other green features. We also provide many parks, of varying size, easily experienced by most folks, since all are within a quarter mile of any residence. But there is room for improvement in our attaining our recommended doses of our citywide Vitamin G.

    Vitamin G is a critically important vitamin. I hope Vitamin G becomes a daily staple of every community and person’s diet…our health and welfare depends upon it!

    Jim Vaughn is the Environmental Coordinator of the City of St. Louis Park, Minnesota. This blog originally appeared in the St. Louis Park Sun-Sailor.

  • Mr. Rudd’s Unproductive Ideas on Urban Productivity

    For urban planners, the compact city is a central dogma. All else hangs off it. There can be no planning without urban growth boundaries, the iron curtains beyond which urbanisation must cease.
    More to be dreaded than George Orwell’s nightmare vision, in Nineteen Eighty-Four, of “a boot stamping on a human face – forever” is the prospect of “a footprint stamped on a patch of earth – forever”. So much has the concept of “footprint”, in its “ecological”, “carbon”, “human” and other manifestations come to pervade the thinking of activists and planners, that all greenfield
    development is considered a violation of mother earth. They oppose it at any cost, endlessly recycling their stock of arguments.

    If environmental alarmism starts to pall, they will fret over the prospect of social alienation. If this falls flat, they turn to an economic angle. We’re told, increasingly, that compact planning will boost the economy’s productive capacity.

    “To … lift our urban productivity”, proclaimed Kevin Rudd in his famous “BigAustralia” speech, “we must establish new frameworks for how the different levels of government, along with businesses and the community, work together to build better cities and suburbs.”

    The argument runs along familiar lines. Traffic congestion is costing the economy around $10 billion dollars a year in delays and inefficiencies. The answer is to shift as many commuters and as much freight as possible from cars, vans and trucks and onto off-road modes like rail. In the case of commuters, many more of them should be using public transport. But the massive capital costs of constructing rail lines can only be justified if population densities are high enough to underpin acceptable rates of use. So people and firms should be concentrated in more compact centres and corridors serviced by fewer roads and more rail lines. Hey presto! Productivity gets a boost.

    Despite a degree of surface plausibility, the argument it wilts under closer scrutiny.

    Let’s consider the version presented by Mr. Rudd. His starting premises are that “road congestion by 2005 was contributing an avoidable cost of $9.4 billion”, that “if we fail to act, that cost will double in the next decade”, and, citing Sir Rod Eddington’s 2006 UK Transport Study, that “cutting travel time in Britain by just 10 percent could raise national productivity by as much as 1.2 percent.”

    Having noted that “one of the factors driving the increased reliance on road usage is the long-term underinvestment in public transport networks”, Mr. Rudd suggests some remedies. “[I]ncreasing density in cities is part of the solution to urban growth”, he says, and “forms of development need to be fully integrated with current and future transport networks.”

    So far, so typical. But the resort to Eddington’s study raises questions about context. Do his findings translate to Australian conditions? Eddington’s source for the productivity estimate is, in the words of Mr. Rudd, “leading British economist Professor Tony Venables”. More precisely, an analysis by Venables and Patricia Rice of the spatial causes of productivity in “the regions of Great Britain”. Essentially, they set out to measure how distances fro areas of high “economic mass” (or high economic density) interrelat with productivity levels. The analysis is static, and doesn’t addres the productivity impacts of measures to raise densities over time.

    Before coming to the estimate, Eddington is at pains to lay the contextual groundwork. Unlike Mr. Rudd, he concedes, on the role transport can play in lifting productivity, that “the literature has been largely unsuccessful in answering this question”. In a footnote, he says the work of Venables and Rice is “usefully beginning to inform debate”. No more.

    Eddington’s most telling observation, from an Australian perspective, is that “the contribution that transport can make to productivity is dependent on … the existing density of the area”. He says “not al firms and areas are equally agglomerated, and will therefore no benefit equally from a particular transport improvement”. Eddingto explains that “transport alone cannot generate clusters, it can play an important role in facilitating their expansion by reducing travel time and costs …”

    In other words, the extent to which transport infrastructure can boost productivity depends on existing densities, not target densities. This is the crucial point: Australian cities are much less dense than European, including British, cities. According to the City Mayors ranking of 125 cities by population density, London ranks 43rd with 5,100 people per square kilometre, Leeds/Bradford 57th with 4,050, Manchester 58th with 4,000 and Birmingham 64th with 3,800. Sydney ranks 113rd with 2,100 and other Australian cities don’t even make the list. Our cities also have some of the most dispersed commercial and industrial structures in the world, with relatively small CBDs accounting for around 12 to 20 per cent of urban jobs.

    British cities are denser for several reasons: a more compact land mass, a colder climate, a longer history of settlement stretching deep into the era before modern transportation, and, particularly in the case of South-East England and London, an economy dominated by business services and information technology, which thrive on “agglomeration effects”. These do feature prominently in Sydney’s economic mix, but nowhere near the scale of London, the world’s mecca of banking, finance and investment. Until recently, the London Stock Exchange was the largest in the world, accounting for 32 per cent of global turnover.

    The contrasts between British and Australian conditions are manifest, even if Sir Rod has lost sight of them since his appointment as Mr. Rudd’s infrastructure czar in 2008.

    Still, the heralded boosts to national productivity aren’t likely to materialize. In low density environments, transport projects have limited economy-wide impacts. A smaller proportion of individuals and firms are placed to exploit them. This is especially so in the case of rail infrastructure (of course, freight rail lines servicing particular port and production facilities warrant special consideration). At the same time, measures to raise densities could wipe out such productivity gains as there are. Zoning controls and urban growth boundaries, for instance, raise land values and rents, with knock-on effects for prices, the cost of capital, and wage and
    salary expectations.

    It makes little sense to trumpet new efficiencies in transport, if other costs have been jacked up to achieve them. That’s why the key concept in economic thinking about productivity is “total factor productivity” (TFP), the portion of output not explained by all the inputs used in production. Mr. Rudd wrongly isolates transport costs from the myriad other costs bearing on urban productivity, and accords them overblown status.

    The true path to urban productivity lies in empowering firms to choose their optimal location, taking account of their individual mix of costs and benefits. This means watering down regulations which restrict these choices, and improving access to as many points on th urban landscape as possible. Rail infrastructure is the least flexible option. There’s no way that planning bureaucrats, brandishing a few large-scale projects, can make better location decisions for thousands of businesses than the firms themselves.

    Perhaps Mr. Rudd should imitate one of his own team. Out of a soundly-based concern for the impact of planning and zoning laws on competition, particularly in the retail sector, small business minister Craig Emerson has launched an enquiry by the Productivity Commission. They can be expected to know what they’re talking about.

    This article first apeared at The New City Journal

  • The Real State of Metropolitan America

    The week opened with an important report on metropolitan demographics by the Brookings Institution, only to be followed by the Census Bureau’s annual report on migration, which contained a different message than the Brookings report. We offer yet a third analysis, since both the Brookings and the Census Bureau reports classify up to one-sixth of suburban population as not being in the suburbs.

    Brookings: The new Brookings State of Metropolitan America report examined trends in the 100 largest metropolitan areas using Census Bureau data between 2000 and 2008 (the census and the American Community Survey). Brookings highlighted findings that some “primary cities” were experiencing an increase in white population, while the rest of the metropolitan area (which it called suburbs) was becoming more diverse. Not uncharacteristically, the core city oriented press took the bait and embellished a bit on the findings. MSNBC characterized the report as indicating that “many younger, educated whites move to cities for jobs and shorter commutes.” Brookings, which largely shares and encourages the urbanist media spin, calls this movement of young, educated whites from suburbs to the cities “bright flight.”

    Brookings also expanded is previous finding that the majority of people in poverty live in suburbs to note that a majority of Hispanic and African-Americans now live in the suburbs. This is really not all that surprising, since suburban areas continue to grow faster and comprise the overwhelming share of metropolitan population.

    Census Bureau: Just a day or two later, the Census Bureau published its annual analysis of migration in the nation. The basis of this report is the Current Population Survey, which like the American Community Survey is conducted by the Census Bureau. The Census Bureau report received considerably less press attention than the Brookings report, perhaps it would be hard to characterize any of its findings as being consistent with the favored “death of the suburbs” line. The previous annual editions back to the beginning of the decade indicate little difference from the 2008-2009 migration trends in the current report.

    The Census Bureau analysis indicates that, almost regardless of the category, many more people are moving from “principal cities” to what it refers to as “suburbs.”

    • Every ethnic group is moving to the suburbs in greater numbers than to principal cities. Three times as many Hispanics are moving from principal cities to the suburbs as from the suburbs to principal cities. The same is true for twice as many African-Americans and Asians. Whites are moving to the suburbs at 1.5 times the rate of their moving to principal cities (Figure 1).
    • Every age group but one is moving to the suburbs at substantially above the rate of movement to the principal cities. There is strong movement among people aged from 20 to 25 to the suburbs rather than the principal cities (Figure 2). The one exception was that among people over 85 years of age, not exactly the epitome of the “bright flight” cited by Brookings and the media.
    • The overwhelming migration from principal cities to the suburbs, rather than from suburbs to principal cities was characteristic across all income categories.
    • There is, in reality, little “bright flight” to report. Among people with college and graduate degrees, nearly twice as many moved from principal cities to suburbs as moved from suburbs to principal cities (Figure 2). While the Census report does not provide mobility information on educational attainment by age, there was strong movement of young adults to the suburbs (noted above).


    The trends in the Census report are consistent with the domestic migration trends that we have previously reported.

    What is a Suburb? There are significant problems with definition of the term “suburb in each of the reports.

    The Office of Management and Budget (OMB), which establishes metropolitan area criteria switched to the “principal city” terminology for the 2000 census, partly to make it clear that principal cities were not inner cities or central cities. The criteria designates as principal cities, the largest in each metropolitan area, any city over 250,000 and any city with more than 50,000 population in which total employment exceeds the workforce.

    Among the 52 major metropolitan areas (those with more than 1,000,000 population), OMB designates 230 principal cities. The Census Bureau report calls everything outside a principal city a suburb. In fact, most of the principal cities are themselves suburbs, developed since World War II as urban areas and expanded outward from their cores.

    For example, principal city Schaumburg, Illinois is located well outside the core city of Chicago and contains a large suburban employment center (“edge city”). Bellevue, the large suburban employment center in the Seattle area is a principal city and not called a suburb by the Census Bureau. Cerritos, California is one of the 25 principal cities of the Los Angeles metropolitan area. Cerritos used to be called Dairy Valley, since it consisted largely of dairy farms until the middle 1950s.

    The Brookings report, in recognition of this problem, calls its non-suburbs primary cities and limits them to no more than three for any metropolitan area. Still, many suburbs are designated as primary cities and not counted in the suburban data, such as Mesa, Arizona (Phoenix), Arlington, Texas (Dallas-Fort Worth), and Cary, North Carolina (Raleigh).

    Suburban versus core analysis needs to be considerably more precise to be meaningful. It would be best to define the characteristics of the core and analyze metropolitan areas at the census tract level, rather than at the city level. However, the data at the city level is far more accessible and is thus predominantly used.

    What is a Core City? Even so, it is important to recognize that there are substantial differences among core cities (which are, broadly speaking, the only parts of urban areas that are not suburbs). Core cities may be divided into three broad categories:

    Pre-World War II Core Cities: These are core cities that have essentially the same boundaries as in 1950. There are 21 Pre-World War II Core Cities in the major metropolitan areas (See Table 2 below). These were largely built before the automobile became dominant, and once were predominately walking and transit cities. New York, Chicago, Boston, Philadelphia and San Francisco are probably the best examples.

    Pre-World War II Core Cities with Suburbs: Many pre-World War II core cities either included wide swaths of vacant developable land in 1950 or annexed substantial amounts of vacant or suburban land after 1950. These cities have cores that are similar to the Pre-World War II Core Cities, but also include suburbs that are little different than the inner suburbs outside the city. For example, in 1950, Los Angeles contained substantial amounts of non-urban land in the San Fernando Valley, which was eventually covered with suburban development. Other cities, such as Milwaukee, Portland, Seattle, Austin and Houston annexed considerable suburban land after 1950. These annexations did not always result in increased population. For example, Salt Lake City doubled its land area between 1950 and 2000, yet retained essentially the same population. Milwaukee nearly doubled its land area, yet lost 40,000 residents.

    Suburban Core Cities: A number of core cities developed predominantly after World War II and as a result, have little, if any pre-World War II core. The largest of these is Phoenix, which recently passed Philadelphia to become the nation’s 6th largest city. San Jose, Charlotte, Orlando and Las Vegas are also examples of Suburban Core Cities.

    Another Perspective: The following analysis (expanded version available here) is offered to indicate general trends in suburbs when non-suburban areas are defined to exclude demonstrably suburban areas. (This may sound circular, but both Brookings and the Census Bureau define some suburban areas as non-suburban.)

    Table 1
    Population Trends: Metropolitan Areas Over 1,000,000: 2000-2008 by Geography
    2000
    2008
    Change
    %
    Metropolitan Areas   152,382,483      166,564,617     14,182,134 9.3%
      Core Cities     43,818,674        45,922,606        2,103,932 4.8%
         Pre-WW2 Core Cities      20,172,850       20,219,342            46,492 0.2%
         Pre-WW2 Core Cities with Suburbs     18,472,298       19,723,295       1,250,997 6.8%
         Suburban Core Cities (Post WW2)        5,173,526          5,979,969          806,443 15.6%
      Suburbs   108,563,809      120,642,011     12,078,202 11.1%
        Suburbs Classified by OMB as Principal Cities    17,968,287       19,334,689       1,366,402 7.6%
        Suburbs Not Classified as Principal Cities    90,595,522     101,307,322    10,711,800 11.8%
    Calculated from US Bureau of the Census Data
    For classification of core cities, see Table 3
    2008 Population of "Suburbs Classified as Principal Cities" is slightly understated because there are no late official estimates for 7 "census designated places." (which are not cities): 2000 estimates used.

    Generally, suburbs continue to grow much faster than the core cities (Table 1 and Figure 3). Between 2000 and 2008:

    • Suburbs added 12.1 million residents, growing 11.1%.
    • Core cities added 2.1 million residents, growing 4.8%. The greatest growth was in the Post War (Suburban) Core Cities, at 15.6%. The Pre-War Core Cities with Suburbs grew 6.8% and the Pre-War Cities grew 0.2% (Figure 4).


    Virtually all of the core city growth was in the more suburban core cities, which is another indication that suburbanization is continuing. Further, the principal cities that are really suburban grew at a rate of 7.6%, more than double that of the core cities. This would seem to indicate that the migration data from the Census Bureau indicating a continued migration to the suburbs is, if anything, materially understated (by classification of some suburbs as principal cities).

    At the same time, the demographic trends and prospects in the nation’s core cities are better than in the past. The rampant lawlessness that drove so many out of the cities in the 1970s has been replaced by law enforcement strategies developed under former New York mayor Rudi Giuliani. Core cities would become more attractive to future residents with serious reform of school performance and business regulation. Until that occurs, however, it seems unlikely that the movement from the cities to the suburbs will be reversed.

    The city-centric media, with its faith-based demographics, continue to announce the demise of the suburbs. However, until migration data shows a net movement from the suburbs to the core cities, it will remain little more than disingenuous hype. At this point, it is not even close. From 2000 to 2008, suburban counties in major metropolitan areas gained 2,000,000 domestic migrants, while the core counties lost 4,600,000 domestic migrants (Note).


    Note: Domestic migration data is reported at the county level and is thus not available for core cities, except where they are coterminous with counties (Such as New York, San Francisco, Baltimore and Washington).

    Table 2
    Metropolitan Areas and Core Cities
    Metropolitan Area Core City (ies) Type of Core City
    Atlanta-Sandy Springs-Marietta, GA  Atlanta Pre-WW2 Core City with Suburbs
    Austin-Round Rock, TX  Austin Pre-WW2 Core City with Suburbs
    Baltimore-Towson, MD  Baltimore Pre-WW2 Core City
    Birmingham-Hoover, AL  Birmingham Pre-WW2 Core City with Suburbs
    Boston-Cambridge-Quincy, MA-NH  Boston Pre-WW2 Core City
    Buffalo-Niagara Falls, NY  Buffalo Pre-WW2 Core City
    Charlotte-Gastonia-Concord, NC-SC  Charlotte Pre-WW2 Core City with Suburbs
    Chicago-Naperville-Joliet, IL-IN-WI  Chicago Pre-WW2 Core City
    Cincinnati-Middletown, OH-KY-IN  Cincinnati Pre-WW2 Core City
    Cleveland-Elyria-Mentor, OH  Cleveland Pre-WW2 Core City
    Columbus, OH  Columbus Pre-WW2 Core City with Suburbs
    Dallas-Fort Worth-Arlington, TX  Dallas Pre-WW2 Core City with Suburbs
    Denver-Aurora-Broomfield, CO  Denver Pre-WW2 Core City with Suburbs
    Detroit-Warren-Livonia, MI  Detroit Pre-WW2 Core City
    Hartford-West Hartford-East Hartford, CT  Hartford Pre-WW2 Core City
    Houston-Sugar Land-Baytown, TX  Houston Pre-WW2 Core City with Suburbs
    Indianapolis-Carmel, IN  Indianapolis Pre-WW2 Core City with Suburbs
    Jacksonville, FL  Jacksonville Pre-WW2 Core City with Suburbs
    Kansas City, MO-KS  Kansas City Pre-WW2 Core City with Suburbs
    Las Vegas-Paradise, NV  Las Vegas Suburban Core City (Post -WW2)
    Los Angeles-Long Beach-Santa Ana, CA  Los Angeles Pre-WW2 Core City with Suburbs
    Louisville/Jefferson County, KY-IN  Louisville Pre-WW2 Core City with Suburbs
    Memphis, TN-MS-AR  Memphis Pre-WW2 Core City with Suburbs
    Miami-Fort Lauderdale-Pompano Beach, FL  Miami Pre-WW2 Core City
    Milwaukee-Waukesha-West Allis, WI  Milwaukee Pre-WW2 Core City with Suburbs
    Minneapolis-St. Paul-Bloomington, MN-WI  Minneapolis Pre-WW2 Core City
    Minneapolis-St. Paul-Bloomington, MN-WI  St. Paul Pre-WW2 Core City
    Nashville-Davidson–Murfreesboro–Franklin, TN  Nashville Pre-WW2 Core City with Suburbs
    New Orleans-Metairie-Kenner, LA  New Orleans Pre-WW2 Core City
    New York-Northern New Jersey-Long Island, NY-NJ-PA  New York Pre-WW2 Core City
    Oklahoma City, OK  Oklahoma City Pre-WW2 Core City with Suburbs
    Orlando-Kissimmee, FL  Orlando Suburban Core City (Post -WW2)
    Philadelphia-Camden-Wilmington, PA-NJ-DE-MD Philadelphia Pre-WW2 Core City
    Phoenix-Mesa-Scottsdale, AZ  Phoenix Suburban Core City (Post -WW2)
    Pittsburgh, PA  Pittsburgh Pre-WW2 Core City
    Portland-Vancouver-Beaverton, OR-WA  Portland Pre-WW2 Core City with Suburbs
    Providence-New Bedford-Fall River, RI-MA  Providence Pre-WW2 Core City
    Raleigh-Cary, NC  Raleigh Suburban Core City (Post -WW2)
    Richmond, VA  Richmond Pre-WW2 Core City with Suburbs
    Riverside-San Bernardino-Ontario, CA  Riverside Suburban Core City (Post -WW2)
    Rochester, NY  Rochester Pre-WW2 Core City
    Sacramento–Arden-Arcade–Roseville, CA  Sacramento Pre-WW2 Core City with Suburbs
    Salt Lake City, UT  Salt Lake City Pre-WW2 Core City with Suburbs
    San Antonio, TX  San Antonio Pre-WW2 Core City with Suburbs
    San Diego-Carlsbad-San Marcos, CA  San Diego Pre-WW2 Core City with Suburbs
    San Francisco-Oakland-Fremont, CA  San Francisco Pre-WW2 Core City
    San Francisco-Oakland-Fremont, CA  Oakland Pre-WW2 Core City
    San Jose-Sunnyvale-Santa Clara, CA  San Jose Suburban Core City (Post -WW2)
    Seattle-Tacoma-Bellevue, WA  Seattle Pre-WW2 Core City with Suburbs
    St. Louis, MO-IL  St. Louis Pre-WW2 Core City
    Tampa-St. Petersburg-Clearwater, FL  Tampa Pre-WW2 Core City with Suburbs
    Tucson, AZ  Tucson Suburban Core City (Post -WW2)
    Virginia Beach-Norfolk-Newport News, VA-NC  Norfolk Pre-WW2 Core City with Suburbs
    Washington-Arlington-Alexandria, DC-VA-MD-WV Washington Pre-WW2 Core City
    See: Core City Classification Definitions

    Wendell Cox is a Visiting Professor, Conservatoire National des Arts et Metiers, Paris. He was born in Los Angeles and was appointed to three terms on the Los Angeles County Transportation Commission by Mayor Tom Bradley. He is the author of “War on the Dream: How Anti-Sprawl Policy Threatens the Quality of Life.

    Photograph: Suburban core city: Phoenix

  • So Much for Europe’s Superiority

    For much of the last quarter century, European pundits, particularly in France, have been promoting the notion that the old continent sat on the verge of a grand resurgence. The events of the past month—culminating in a trillion dollar rescue of the Euro—should, at least, put that dodgy notion to rest.

    Although the financial crisis may have originated on Wall Street, it’s been Europe and the Euro that now represent the big threat to drive world markets back into recession. The show stealers are India, China and Brazil. Still the big boy on the block, the American economy is growing, albeit not spectacularly.

    What a change from the heady predictions of the European elites just a decade ago. Back then Jacques Attali, eminence grise for former French President Francois Mitterrand, asserted that “Japan and Europe” would likely “supplant the United States as the chief superpowers wrangling for global economic supremacy.” More recently, author Jeremy Rifkin wrote a book about what he defined as The European Dream, a green-tinged, social democratic ode to enlightened diversity that he predicted would supplant the declining dirty, unruly model forged by the United States on the world stage.

    You can blame the spendthrift Greeks for this trouble, or even the lack of geeks in Europe (anyone found a continental Google or Apple lately?). But Euro-stagnation is nothing new. It’s deeply rooted and longstanding. Indeed, since 1970 it has not been the U.S. that has faded before the onslaught from the East, but the core 15 nations of the European Union. Over that 40-year period the EU-15’s share of world GDP has plummeted from roughly 37 percent to under 28 percent; the American chunk, roughly 27 percent, has stayed remarkably even. Basically Asia, and particularly China and India’s gain, largely has been at Europe’s expense, not our’s.

    In stating the case for European superiority, much has been made by boosters of Europe’s different institutional framework, tax or regulatory structure. No question these have advantages and disadvantages compared with those of the United States, but there’s little case for arguing that the “Euro-model” has been a rip-roaring economic success. It’s imploding on its weak periphery, and the collapse is threatening even bigger players, including the United Kingdom.

    Europe’s problems extend well beyond policy, into the realm of culture and demographics. Even in France, people and what they do actually matter more than abstract ideas. A culture that believes in itself, not only to have children, but also start businesses and innovate will overcome one, however theoretically well managed, that does not. This is the fundamental problem of Europe as whole, although it does not apply equally to every individual country in the union.

    One key element is demographics. According to the most conservative estimates, the United States by 2050 will be home to at least 400 million people, roughly 100 million more than live here today. In contrast, the populations of much of the EU, as well as most of East Asia, will be stagnant or falling over the next few decades. Like other advanced countries, the United States will be aging but not nearly as quickly. By 2050, there may be close to 40 percent of the population in Japan and Germany over 65; in the United States that proportion should be closer to 25 percent.

    If there’s going to be a European dream, they better start importing people or creating them. Otherwise, the European workforce will be dying out, literally. Between 2000 and 2050 the population of the U.S. between 14 and 64 is projected to expand by some 44 percent, while that of the EU contracts by 25 percent and Japan’s by over 40 percent.

    With its growing workforce, the United States will require substantial economic growth in order to stave off downward mobility of its young population. Europe’s prime challenge will be to pay for its aging population with a diminished workforce, and perhaps find ways to invest in faster growth economies. Europe’s future may be as the world’s coupon-clippers, consultants and waiters.

    Yet this may not be the fate of all Europe, particularly if the grand neo-Bonapartist European is allowed to fizzle and national characteristics can reassert themselves. The aptly named PIGS (Portugal, Italy, Greece and Spain) make clear that you can not enjoy a Scandinavian welfare state with a Mexican-style economy. You have to earn the right to six weeks of vacation and Porsche-level heath-care plans.

    This contrasts with the productive, disciplined countries of the north—roughly today’s version of the Medieval Hanseatic League—who continue to export goods and services enough to sustain their expansive, and generally less corrupt, welfare states. Essentially you have the sunny, good food and times countries—an arc from Portugal to Spain—and the gloomier places like Scandinavia, the Netherlands and Germany.

    A secular kind of Protestant ethic is alive and well in post-Christian Europe. In some countries like Sweden and Denmark, blond and red-haired baby-making is making a modest comeback, lifting the future prospects for these countries. As for the Mediterranean crowd, get used to African or Arab chefs cooking your pasta. It might not be too bad, as long as the weather holds up.

    This article originally appeared in The Daily Beast.

    Joel Kotkin is executive editor of NewGeography.com and is a distinguished presidential fellow in urban futures at Chapman University. He is author of The City: A Global History. His newest book is The Next Hundred Million: America in 2050, released in Febuary, 2010.

    Photo by alibaba0

  • City Rankings: An Alternative View

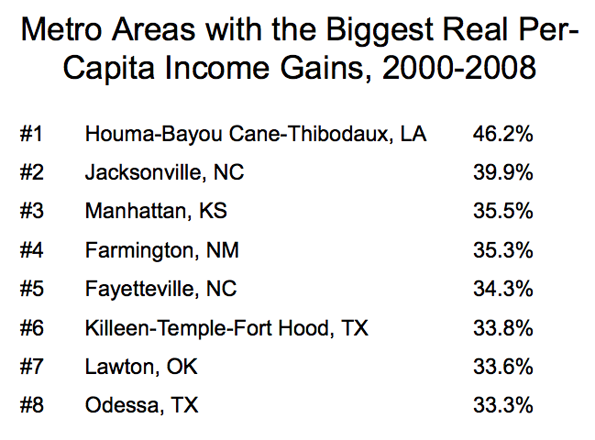
    Why is Austin, Texas the inevitable winner or runner-up on every ranking of the most “livable” cities in the United States? The downtown is a wasteland, the hip barbecue joints are dismal, and the bookstores, despite the population’s admirable intellectual mix, are heavy with espresso westerns.

    If Austin were in Europe, its place in the power rankings would be just ahead Bratislava but behind Faro, which, in turn, would be way down the list of great European cities.

    Herewith is an idiosyncratic assessment of Europe’s most livable cities, based on my continental wanderings (I live in Switzerland). Confession: I haven’t, sadly, been recently to Paris, and I often judge a city by its rail service and bookstores. Put simply, I see cities as works of art, and wonder in which paintings I might like to live:

    Geneva: I love it because it’s home. But it’s not really a city. Swiss cities are villages that have gelled together, like drifting icebergs. Geneva works because it’s a civil society. The public schools impressed even Benjamin Franklin, and Calvin ended the practice of lawn mowing on Sundays.

    Berlin: It’s flat, so it is perfect for biking, has many open spaces, affordable housing (thanks to the worker flats left behind by the German Democratic Republic), history from every tragic era, superb public transportation, enough museums to fill up a month of Sundays, ethnic food, three airports, and a diverse economy. Downside: the North European climate is unspeakable.

    Moscow: It has, by far, the greatest metro in the world, with fast trains every minute, easy changes, and mosaics of the Great Patriotic War, not to mention Stationmaster Lenin. In winter, Moscow is an ice bowl. In summer it has bright nights, terrific walks, a wild west economy, quirky museums (one is devoted to border guards), and funky modern architecture. Caveat: the traffic is becoming Asian, housing is expensive, and only the quick and the dead can cross the wide boulevards, not to mention the mafia.

    Cambridge, England: The streets are uncrowded, the colleges world class, and the bookstores exhaustive. I get around by bike. London is now less than an hour by privatized rail, and the Fens, the nearby marshlands, are enchanting for walks. The only “new” roads are Roman.

    Barcelona: Easily Europe’s favorite summer city, if you don’t mind dinner after midnight. The tourist crowds are oppressive, and the sidewalks crowded. There’s a beach downtown, trade from Europe and Africa, and cultural links to Madrid and Paris.

    Prague: Go in April, and you will love it. Go in August, and you will flee the crowds in desperation. For a weekend the old town in Prague rivals Venice and St. Petersburg, although native son Franz Kafka caught the dark undertones.

    Rome: Classical history; quirky neighborhoods — I try to like Rome for these reasons. But I despair at its devious taxi drivers, dirty sidewalks, Basil Fawlty hotel clerks, and overpriced and often bad meals. Nor do I like the airports or the railroad stations. That said, I go often. It’s the price for wallowing in the shadows of Cicero and Hadrian.

    Bucharest: It’s the European leader in vacant lots. I love the Hotel Rembrandt, the outdoor ethnographic museum, the Romanian railways, with their sleepers to Transylvania and Iasi, and I love the sense that the city is starting over after communism. The history museum could have more exhibits about the Russo-Turkish war of 1877-78, but I can’t ask for everything.

    Edinburgh: It has a great station hotel, a castle, the moors and highlands nearby, the aura of golf, many great companies, historic if insolvent banks, Harry Potter, single malt Scotch, Robert Louis Stevenson, and a new parliament building. I should like it more than I do. When it’s rainy, windy, and cold, which is often, it feels like the end of the earth.

    Dublin: I hated the banks and their balance sheets, the pubs and the spilled booze sticking to the sidewalks, and the forlorn neighborhoods, Ulysses notwithstanding; and I hated my hotel, which reeked of cigarette smoke and felt like a hangover.

    Athens: For $10 billion of Olympics money, all Athens gained was a tram. Don’t harbor any allusions that it works as a city. Like the economy, the train station is a dead end. Further, the small hotels are crummy, the tourist food inedible, and the traffic a nightmare. Business meetings all take place at midnight, in a haze of smoke. But to gaze at the illuminated Parthenon, even from a gridlocked taxi, is to look up at heaven.

    Istanbul: Economically it faces north-south and east-west, and it’s the only city both in Europe and Asia. The traffic is stifling, the touts are everywhere, the population is on a Los Angeles scale — but it’s hard to beat for its visual and historical sweep. The ferry views rival those of Hong Kong, and the climate is close to ideal, with cool nights and warm days. It has trains to Berlin and Tehran, a nonstop parade of ships on the Bosphorus, and the sultan’s harem (to accommodate his speed dating habits).

    Amsterdam: I try and try with Amsterdam, but am close to writing it off. I guess it would help if I were interested in recreational drugs, Heineken beer, red light districts, or the art of Van Gogh. I do love canals, the Anne Frank house, anything to do with bicycles, and Dutch landscape paintings. But what a terrible climate, and, to paraphrase Spiro Agnew, if you have seen one cobblestone street, you have seen them all.

    London: What’s not to love about the Globe Theatre, the bookstores, the Underground, the Imperial War Museum, the double-decker buses, the walks along the Thames, the pubs in Chiswick, business lunches in the City, or the morning phalanx of newspapers?

    What’s my ideal European city? It would look something like Venice, but have the Moscow metro and lots of sidewalks and bike lanes. The climate would be that of Rome. The city population, like that of Geneva, would not exceed 500,000, and the last stop on the metro, as in Munich, would be a lake with terraced cafes and little beaches. To get to work, everyone would bike, walk, or ride the underground. Electric cars and buses would transport the elderly. The ferries would run all night, as in Istanbul, and serve fresh orange juice and tea on deck.

    The business day would end at 2:00 PM when, as in Barcelona, many would take lunch overlooking the sea. There would be several grand railroad stations, operated by the Swiss, and affordable overnight rail connections to London, Berlin, Florence, and Madrid. At night, there would be concerts in the parks, as in Vienna in summer, or book lectures, as in Oxford.

    Tourists would take breakfast on small balconies. Coffee and wifi would be free. The local industries would be several universities, a teaching hospital, book publishing, glass blowing, cartography, high-tech, ship building, and railways. Night ferries would connect the city to the Greek islands. The library would be open all hours, and many cafes and bookstores (all open late) would have well-fed cats.

    Photo by Suzanne Bouron: Pause Café, 100% Aribica

    Matthew Stevenson is the author of Remembering the Twentieth Century Limited, and editor of Rules of the Game: The Best Sports Writing from Harper’s Magazine.
    He lives in Switzerland, commutes on a bike, dreams about night trains, and loves long weekends in places like Chisinau, which did not make this list.

  • Florida and Oil

    By Richard Reep

    Some say it took Mrs. O’Leary’s cow to make Chicago the city of great architecture that it is today: after the fire of 1871 that destroyed many of its buildings, leading citizens recognized the critical importance of their built environment. Today, we have a city that boasts some of the world’s best architecture. If BP’s oil disaster is a new millennium cow starting another conflagration, the nation may ironically benefit from seeing the ominous oil slick spreading across the gulf, spelling the end to our dependence on oil as the dominant energy source for the nation.

    Cries of “drill baby drill” are suddenly silent as the horror of rusty streaks spreads from MC252, and Florida’s governor Charlie Crist has already viewed the oil slick twice – aware that the tourism industry, already on its knees, will suffer yet another blow amid unemployment, the credit freeze, and state depopulation. The massive disaster looming in the Gulf of Mexico appears to be a giant, ugly metaphor for some choices that America will make in the near future. If we are going to stay dependent upon oil as our energy source of choice, we better grit our teeth, clean it up, and hope for a technological fix to reduce the risk of this happening again.

    Instead of reducing our dependence upon foreign oil, this disaster is causing many in Florida to question whether we should depend on oil at all, foreign or domestic. Ironically, in a state that has consistently banned offshore drilling to prevent such as disaster, Florida’s beaches are likely to suffer from environmental damage anyway. 4,000 or so oil rigs exist in the Gulf of Mexico making this event likely to occur again in the future, and as the engineers experiment with one repair after another it is evident that we are a long way from making these rigs risk-free.

    Over in Florida, the dismay over this event is palpable, and since nothing can be done about it, there is only speculation about what direction to head in the future. Despite the “sunshine state” moniker, the oil industry’s grip on the state is so strong that solar energy is losing market share rather than gaining as an energy resource. The legislature, starved for money to balance the budget, had to kill a rebate program that subsidized building owners when they add solar energy systems to their property. Florida, despite its abundance of renewable energy potential, has yet to see policy that diversifies the energy needs of the state, and sources like solar energy require extraordinarily heavy subsidies to be palpable to most owners.

    While the recession is pushing most prices downward, energy costs are rising across the country, whether fossil fuels or notFlorida is heavily dependent upon fossil fuels, making renewable energy resources someone else’s profit center, judging from California, Oregon, Washington, and Minnesota’s contribution to the top ten cities using renewable energy. Florida, with vast agricultural lands beset by freezes that destroyed much of the cold-sensitive citrus crop this year, has yet to consider energy crops like sugar cane, sorghum, switchgrass, or other biofuels.

    So while Florida sits and watches the oil slick move closer to its shores, some big questions deserve to be asked, and answered. Individuals without the means are generally conserving energy by driving less, biking more, and slowing their lives down to match the pace of their income. All of this is natural conservation of energy is occurring without nannies and big brother shaking a code book at people and may, in the long run, do more to reduce energy consumption than anything else.

    It will take a fundamental shift in thinking to really abandon oil, foreign or otherwise, in Florida or elsewhere. It will take recognition of the incredible abundance of other forms of energy that exist and a passion to seek out ways to use this energy effectively for our needs. This will be only successful with a combination of grass roots and top-down thinking, and perhaps the disaster in the Gulf of will have a legacy similar to the 1969 Santa Barbara oil spill, after which came the Environmental Protection Agency, the Clean Air and Water Act, and a galvanizing of the fledgling environmental movement.

    Sustainability is about preserving the future generation’s ability to choose its own destiny. With this criterion, we should move forward with a pluralist approach to finding energy sources, and consciously step towards them. We won’t abandon oil tomorrow, or the next day, but we can begin to say goodbye to atrocious wastes of nature like the one unfolding in the Gulf of Mexico right now, and we can begin to say hello to a transformation of our lifestyle to embrace different forms of energy for different needs. If this disaster is truly Mrs. O’Leary’s cow, then future generations must truly benefit from the event in order for it to have meaning.

    Richard Reep is an Architect and artist living in Winter Park, Florida. His practice has centered around hospitality-driven mixed use, and has contributed in various capacities to urban mixed-use projects, both nationally and internationally, for the last 25 years.

    Photo by Fabio – Miami

  • Jobs, Environmental Regulation, and Dead French Economists

    The debate over the repeal of California’s global-warming regulation, AB32, has degenerated into a shouting match, each side claiming economic ruin if the other side wins. A couple of long-dead French economists can help us think about the debate.

    The great French economist Leon Walras (1834-1910) showed that perfect markets result in an allocation of goods and services that can’t be improved on, in the sense that no one could be made better off without someone else being made worse off.

    Of course, we don’t have completely unfettered markets. In fact, they have never existed. They will never exist. In particular, we economists like to talk about what we call negative externalities. These occur when I do something, but an unintended consequence is that it hurts you, and you have no recourse.

    An example may make things clearer. Suppose I have a factory that spews out a deadly chemical, one that destroys all life downwind for ten miles. Obviously I’ve reduced the property values for the downwind property owners. (We’re simplifying here. There are many other issues.) There is no market for the damage I’ve done, and downwind landowners may not be able to afford to sue me, and there was a time when they would have likely lost such a case.

    Society’s solution to the problem of negative externalities has been regulation. Until recently, the concept of negative externalities has been the rationale for most environmental regulation. Negative externalities’ victims have also been extended to include non-humans: flora, fauna, and “mother earth.”

    Climate change regulation, though, is a bit different. In the first place, we don’t know how much of its justification, the claim of manmade global warming with long-term negative economic impacts, is accurate. Some, the “non-believers” completely deny the possibility of man-caused global warming. Others, “the believers” believe in man-caused global warming with a fervor that matches that of any religious zealot. Another group, me included, believes that manmade global warming is a possibility that should be considered as a factor in making long-term economic policy.

    If manmade global warming was a certainty, you could reasonably argue that negative externalities justify regulation, the parties being hurt are just not yet born. That’s essentially what the believers are trying to say when they point to the imminent destruction of all life on earth.

    However, once the existence of manmade global warming becomes a probability, it becomes an insurance question. This dramatically increases the level of complexity of the problem, and it dramatically complicates the political problem of reaching consensus about what to do.

    So, proponents of climate-change regulation have tried to simplify the issue. One approach has been to turn everyone into believers, either by attempting to convince the skeptical—as it turns out by using gross exaggeration if necessary—or, failing conversion, excommunicating even the mildest skeptics from civil society.

    Climate-change regulation proponents have also tried, with success, to use the novel argument that climate-change regulation is not only costless but will generate economic growth. The most enthusiastic proponents of this argument, California’s Governor Schwarzenegger among them, describe a utopian future of happy people enjoying previously-unknown prosperity in a pristine earthly heaven.

    Sadly, this better-than-a-free-lunch deal is not likely to materialize. It is true that clever economists have constructed models where such an outcome is possible—models having to do with large-scale inefficiencies existing because of historical accident—but large-scale unrecognized opportunities are unlikely in today’s economy.

    It is also true that some economists have found some evidence of small un-captured gains. I’ve participated in this literature. However, those gains are also unlikely to be of the scale necessary to achieve the promised new economic age. Indeed, most economists doubt their existence, arguing, reasonably, that the researchers failed to measure all of the relevant costs. Economists have a hard time believing that markets are so bad that unrecognized profitable opportunities exist in abundance.

    Today, California is considering the repeal or postponement of its landmark global-warming regulation, AB32. Oddly, both sides are using the same argument. The forces arguing against the repeal of AB32 argue that the repeal will cost jobs. Those arguing for the repeal argue that failure to repeal will cost jobs.

    They are both correct, and they can both prove it with their warring models, which brings us to our second great dead French economist.

    Frederick Bastiat (1801-1850), not long before his death, wrote a piece What is Seen and What is Not Seen. In the essay, Bastiat gives the example of jobs created by breaking windows. The broken window creates work for the glazier, a multiplier is attached to that work, and it looks as if economic activity has increased. However, society is not better off. The problem is that we see, and account for, the work, but we do not see or count the costs associated with the initial destruction of capital.

    So it is with California’s regulation. Proponents of the regulation have research to support their claim of job creation. The “green jobs” created by the regulation are seen and counted. The jobs lost to the regulation are not seen and are not counted.

    The opponents of California’s regulation have estimated the jobs lost to the regulation, mostly a consequence of higher energy costs, but that research—the portion I’m aware of at least—has been criticized for ignoring the jobs created by the regulation. More importantly, they do not see the jobs that might be lost if global warming kills jobs. They only see, and show, the jobs lost to failure to repeal the regulation.

    Creating jobs is easy; creating real economic growth is harder. Banning the use of any productivity-enhancing technology will create jobs, but this could occur at the cost of societal well being. We could achieve full employment by banning all agricultural technology created after the 17th century. There is no unemployment in a Malthusian economy. We’d all have “idyllic” jobs on the farm, yet this would in reality be back-breaking work. Many people would live on the edge of starvation. I don’t think anyone really wants that outcome. It is also easy to create subsidized jobs, even if those jobs add nothing to, or worse detract from, society’s well being.

    Instead of jobs, the argument should focus on such things well being, consumption, income, probabilities, and the like. It is complicated by the uncertainty surrounding the theory of manmade global warming, and the uncertainty surrounding the economic impacts of any warming. But, the stakes are high. People’s lives will be changed. The debate deserves a higher-level of discourse than we’ve seen. Frenetic predictions of job losses or overly optimistic projections of employment created by a green economy will not do. Instead, let’s recognize the complexity of the issue and have a reasoned discussion.

    Bill Watkins is a professor at California Lutheran University and runs the Center for Economic Research and Forecasting, which can be found at clucerf.org.

    Photo by Diogo Martins.

  • LA the Least Gentrified Major City?

    Los Angeles has been “gentrified” and made more stable in many of its areas by immigrant settlement, but the phenomenon of Anglo “gentrification” – what used to be “yuppies” or their more contemporary counterparts (original “yuppies” are now in their 50s) upgrading a formerly “bad” neighborhood by pushing up rents and squeezing out existing relatively poor folks – is rarer in Los Angeles than in almost any other American city.

    The closest thing to it has occurred in a few “paleo-urbanist” beach communities. (“Paleo-urbanist” means planned to New Urbanist specifications, but nearly a century ago!) And I think the reason for it has to do with the massive projects by the Irvine Company especially in the 60s and 70s. These projects, plus the nearby existence of Newport Beach – already a “watering spot” for the WAS (WASP but including Catholics, this being California) – plus the riots of 1965, plus the perception that the air in the Irvine and Newport region was less polluted at a time when smog was worse than now, led to a massive secessio patriciorum, a secession of the patricians, It was a physical manifestation of Christopher Lasch’s The Revolt of the Elites. Corporate headquarters relocated en masse. Second homes near Newport Bay often became first homes. Many of the people that might otherwise be gentrifiers in Los Angeles were removed to the first great Edge City, at the head of Newport Bay.

    Los Angeles proper ultimately recovered from the Great Secession. It did so with the help of immigrants on the one hand, and the entertainment industry on the other. In days of old “Hollywood” and “Los Angeles” had been two separate cities occupying the same space. Outsiders who were concerned with the film industry often didn’t refer to “LA” at all, but to “Hollywood” or “The Coast.” “LA” was the rather bourgeois city that happened to occupy the same physical space.

    I remember, for example, when Los Angeles magazine was socially conservative enough to declare, “Why is it they never organize against the popular smut [pornography] – movies like Beach Party, for instance?” This is unimaginable now. I also remember how few were the movie stars in attendance at the openings of the major Music Center (now LA Performing Arts Center) in 1964 and 1967.

    It is now recognized that Hollywood is at the center of cultural life in Los Angeles. The two largest political parties in the state are the Hollywood Democrats and the Eastside LA Democrats, with quite different social priorities. The third party, the Republicans, is desperately trying to hold on to its veto on taxation and the budget. As a matter of fact, the terms Westside and Eastside are used a lot more now. When I lived in Hancock Park in my high school years, I had somewhat of a perception that I was in the exact middle. Wilshire Boulevard, the grand prestigious street of Los Angeles, had, because of foolish zoning, a strip of vacant lots where it went by the Hancock Park residential district (not to be confused with the city park of the same name, two miles west, where LACMA and the Page Museum are}. These lots were not built on until the 70s, when condos were allowed there.

    The so called “Park Mile” did provide a separation between the Miracle Mile on one side and the Wilshire Center – not in those days Koreatown, and in fact a serious rival to Downtown – but the separation between West and East has grown sharper as the Miracle Mile has faded a bit, and Koreatown is what it is and not a rival of Downtown any more. The perceived border between Westside and Eastside LA seems to run near Vine Street, through Old Hollywood and Hancock Park.

    Pasadena and Santa Monica, both singularly uncool places 40 years ago, have become among the coolest parts of the city. Remarkably, Pasadena and nearby areas were the main source of the secessio patriciorum of 40 years ago. The vacuum has been filled in a very interesting way!

    In contrast, downtown San Diego feels a lot like downtown Denver, except with palm trees and water. Both of those downtowns fill up on weekends at night with hard-partying young Anglos, not exactly to be seen on Broadway in LA at any hour. If there was a secessio patriciorum in San Diego, it was only to the UCSD area near La Jolla, much closer. If the secessio had gone, say, to Carlsbad, and upper class San Diegans had relocated to Carlsbad and La Costa en masse, downtown San Diego might be the ethnic wonderland Downtown LA now is. Carlsbad may be 30 miles away but the few Carlsbadians I know seem a lot more loyal to San Diego than OCers are to Los Angeles. Who knows?

    Howard Ahmanson of Fieldstead and Company, a private management firm, has been interested in these issues for many years.

  • Australia: Housing Soars Down Under

    Finally, an important turning point has been reached for Australians in the housing market: on 22 April 2010 the Council of Australian Governments endorsed a new housing supply and affordability agenda.

    The shift in attitude is long overdue. The population of Australia has passed the 22 million mark and is growing at 2.1 per cent per annum. Until now, planning policies based on higher densities have been seen as the solution for this population increase. Such policies are variously euphemistically termed “smart growth”, “urban consolidation” or, more recently, “urban renewal”.

    The deleterious results of high-density policies on both people and the environment are becoming more and more apparent. Australian cities, especially Sydney, are starting to exhibit the downside effects of what might be the most aggressive high-density policies in the world. The general public has not yet comprehended how tight the link is between these restrictive planning policies and the increasing prevalence of community problems.

    The Australian strategy of high-density has had two components. The first has been to artificially strangle the land supply. Residential land release in Sydney has been reduced from a historic average of 10,000 lots per year to less than 2,000, thereby radically reducing the number of dwellings available from greenfield sites.

    The second component of the high-density strategy has required each municipal council to submit a rezoning plan that increases population density to government satisfaction; otherwise, that municipality is adversely impacted. These tactics force high-density onto communities originally designed for low densities.

    Smart-growthers claim a plethora of benefits resulting from high-densities. But any clear-headed examination shows that high-density is detrimental to the public good. Greenhouse gas emissions per person are greater in high-density. The policy overloads infrastructure; choking traffic congestion and longer travel times result. Sewers overflow, electricity supply reaches a breaking point, and there are chronic water shortages. Concrete, tiles and bitumen replace trees, gardens and public open space. Sustainability is adversely affected.

    And, of course, high-density policies create land shortages that result in unaffordable housing. This is the darkest side to the impetus for Smart Growth. The resulting increase in the overall cost of housing is sobering. Even the global financial crisis had very little effect on house prices in Australia. Prices continue to rise, and the Australian Federal Government has become concerned about the impact of increasing housing costs on the economy. The Governor of the Australian Reserve Bank has said that the price of a marginal block of land is too high for a time when interest rates are low and credit is available , and similar sentiments have been expressed by other officials.

    Time series data for Australian cities shows a strong correlation between inadequate land release and excessive housing cost. The land component of the price of a dwelling in Sydney has increased from 30% to 70%. It is apparent that strangling the release of land on the outskirts in order to force high-density has resulted in a shortage and, in the face of ever-increasing demand, the price of land has risen dramatically.

    The 6th Annual Demographia Housing Affordability Survey of six countries portrays a widespread relationship between high housing cost and overly restrictive planning. In the chart below, housing cost is measured as years of family income needed to purchase a house. This year the picture is somewhat complicated by the collapse of the housing bubble in some prescriptive jurisdictions resulting in a substantial reduction of previous high prices.


    Median house price divided by gross annual median household income.

    Only about seven per cent of Australians wish to live in apartments. In spite of this, smart growth policies have resulted in apartments being the only type of housing available to most new entrants to the housing market. These apartments command higher prices than otherwise would be the case, due to an inadequate supply of competing single-residential housing resulting from the scarcity of available sites. This provides the potential for apartment developers to make large profits. Such profits provide the resources for developers to make large donations to the political parties.

    Over the previous five years, the ruling New South Wales Labor Party received donations from the development industry of $9 million, while the Liberal opposition party netted $5 million. These donations exceeded the total contributions to all political parties over the same period from the gambling, tobacco, alcohol, hotel, pharmaceutical and armaments industries combined.

    Numerous documented cases show a large donation being made shortly before permission is granted for a particular development. In response to long-term escalating public anger, the New South Wales Government in December 2009 passed legislation to prohibit donations from property developers. However, the public cynically consider this will not solve the problem and that “donations” will be given in other ways.

    In the face of criticism, state governments maintain that recent land releases have been sufficient. The New South Wales Minister of Housing has stated that land for 131,000 homes has been released in Sydney. Yet the shortage continues to get worse. One reason is the tortoise-like progression of the rezoning process.

    Another is market manipulation. As the Demographia survey points out, governments flag well in advance which greenfield areas will be zoned for developments. Sellers then realise they are cushioned from competition and can command higher prices for their land. Purchasers – developers — know they can pay substantial premiums compared to what would be the case if land release were not so predictable.

    It appears that developers (both government and private) then carefully control the rate at which these greenfield sites are made available to home buyers. It has been reported that the Melbourne government development agency is sitting on a stockpile of 25,000 house blocks that have been zoned for residential approval, but is selling just 700 per year. Private developers and landholders currently hold almost 70,000 house blocks, yet only 1400 of these are available to the market . In the current situation of high demand, it is evident that housing land is being drip fed onto the market, thus keeping prices high.

    The Council of Australian Governments seems to have taken cognisance of this situation, as the review will examine large parcels of land “to assess the scope for increasing competition and bringing land quickly to the market”.

    The Council’s review indicates a welcome change in thinking. Up to now it has not been generally recognised that planning policies are a significant factor in excessive housing cost. Other adverse effects of these policies still need to be acknowledged. One hopes that this review will represent the beginning of a broader appreciation of the downside of high-density policies.

    Photo: A strip of ‘Sydney Lace’in Balmain, Sydney, New South Wales

    (Dr) Tony Recsei has a background in chemistry and is an environmental consultant. Since retiring he has taken an interest in community affairs and is president of the Save Our Suburbs community group which opposes over-development forced onto communities by the New South Wales State Government.

  • A Bad Business Cycle for the Creative Economy

    Here’s a simple question for you…which metro areas did prospered the most during the past business cycle? (2000-2008)  Were the winners the highly-educated communities that make up the Creative Economy?  Or did someone else zoom ahead?

    I asked myself these questions when I was preparing for a talk that I was giving at the Rochester Institute of Technology on innovation and economic development.  Being a man of numbers,  I calculated the gains in real-per capita income for all metro areas. Who do  you think was #1, and who do you think was #366 (out of 366)?

    A bit surprising, isn’t it?  The common themes are guns and oil. The big gains in the #1-ranked Houma region are mainly connected with the increase in oil drilling, since BLS data shows that wages in the mining/oil industry in Terrebonne Parish, where Houma is located, soared from $58K a year to $78K from 2005 to 2008.  #2 Jacksonville (NC) is the location of Camp Lejeune. Fayetteville (NC). #5 Fayettville (NC) is home to Fort Bragg, one of the larget military bases in the world. #6 Killeen is obviously home to Fort Hood.  #8 Odessa, Texas, is  riding the oil boom.

    Now let’s look at the metro areas which were the biggest losers in real per-capita income, 2000-2008.

    Uh, oh.  This is not the list you might have expected, in a world where brains and innovation are supposed to be important. There’s Silicon Valley at the top (or the bottom) of the list, where incomes didn’t recover from the popping of the tech bubble that peaked in 2000.  But other tech-type metro areas, such as Raleigh and Austin were hit hard as well.

    Brains and education did not seem to count too much in success in the last business cycle. Overall, the top ten cities, measured by growth in per capita income, had an average college graduate rate of 17.7% The bottom ten cities had a college graduate rate of 31.8%.

    Is this inverse relationship between growth and education going to persist into the future? Impossible to say. My personal view is that the lack of rewards for education–which show up in the individual income statistics as well–is correlated to the lack of commercially-successful breakthrough innovations, which would immediate sop up all the excess college graduates.

    To put it another way, innovative industries tend to locate where they can get a lot of college graduates. That means high education areas attract new companies, boosting growth.

    But without innovation,  the whole economic development dynamic changes. You can’t attract growing innovative companies because they are few and far between. For their part,   companies are more likely to view cost as a main consideration in deciding where to locate.  Goodbye San Jose and Austin, hello China and India.

    Mike Mandel is Editor-in-Chief of Visible Economy. This post originally appeared on his blog “Mandel on Innovation and Growth.”