Blog

  • Numbers Don’t Support Migration Exodus to “Cool Cities”

    For the past decade a large coterie of pundits, prognosticators and their media camp followers have insisted that growth in America would be concentrated in places hip and cool, largely the bluish regions of the country.

    Since the onset of the recession, which has hit many once-thriving Sun Belt hot spots, this chorus has grown bolder. The Wall Street Journal, for example, recently identified the “Next Youth-Magnet Cities” as drawn from the old “hip and cool” collection of yore: Seattle, Portland, Washington, New York and Austin, Texas.

    It’s not just the young who will flock to the blue meccas, but money and business as well, according to the narrative. The future, the Atlantic assured its readers, did not belong to the rubes in the suburbs or Sun Belt, but to high-density, high-end places like New York, San Francisco and Boston.

    This narrative, which has not changed much over the past decade, is misleading and largely misstated. Net migration, both before and after the Great Recession, according to analysis by the Praxis Strategy Group, has continued to be strongest to the predominately red states of the South and Intermountain West.

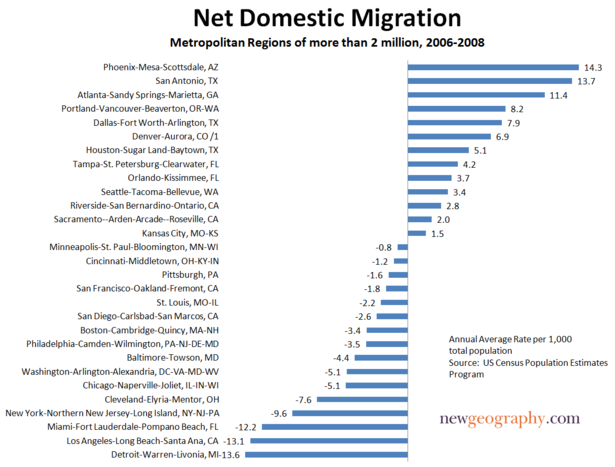
    This seems true even for those seeking high-end jobs. Between 2006 and 2008, the metropolitan areas that enjoyed the fastest percentage shift toward educated and professional workers and industries included nominally “unhip” places like Indianapolis, Charlotte, N.C., Memphis, Tenn., Salt Lake City, Jacksonville, Fla., Tampa, Fla., and Kansas City, Mo.

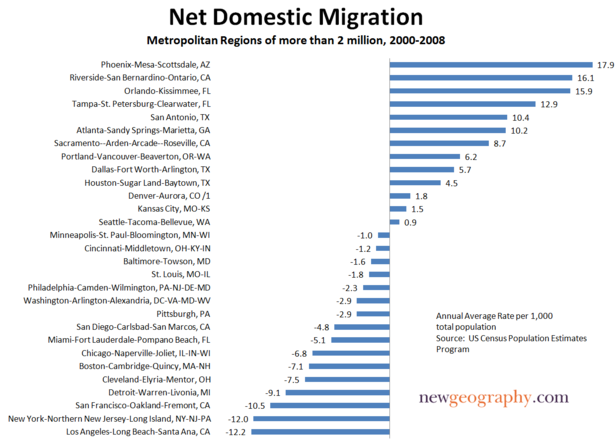
    The overall migration numbers are even more revealing. As was the case for much of the past decade, the biggest gainers continue to include cities such as San Antonio, Dallas and Houston. Rather than being oases for migrants, some oft-cited magnets such as New York, Boston, Los Angeles and Chicago have all suffered considerable loss of population to other regions over the past year.

    Much the same pattern emerges when you look at longer-term state demographic patterns. A recent survey by the Empire Center for New York State Policy found that the biggest net losers in terms of per capita outmigration between 2000 and 2008 were, with the exception of Louisiana, all blue state bastions. New York residents lead in terms of rate of exodus, closely followed by the District of Columbia, Michigan, Pennsylvania, Massachusetts and California.

    An even greater shock to the sensibilities of the insular, Manhattan-centric media, the report found that most of the movement from the Empire State was not from the much-dissed suburbia, but from that hip and cool paragon, New York City. This can not be ascribed as a loss of the unwanted: According to the report, those leaving the city had 13% higher incomes than those coming in.

    How can this be, when everyone who’s smart and hip is headed to the Big Apple? This question was addressed in a report by the center-left, New York-based Center for an Urban Future. True, considerable numbers of young, educated people come to New York, but it turns out that many of them leave for the suburbs or other states as they reach their peak earning years.

    Indeed, it’s astonishing given the many clear improvements in New York that more residents left the five boroughs for other locales in 2006, the peak of the last boom, than in 1993, when the city was in demonstrably worse shape. In 2006, the city had a net loss of 153,828 residents through domestic out-migration, compared to a decline of 141,047 in 1993, with every borough except Brooklyn experiencing a higher number of out-migrants in 2006.

    Of course, blue state boosters can point out that the exodus has slowed with the recession, as opportunities have dried up elsewhere. True, the flood of migration has slowed across the nation. Yet it has only slowed, not dried up. When the economy revives, it’s likely to start flowing heavily again.

    More important, the key group leaving New York and other so-called “youth-magnets” comprises the middle class, particularly families, critical to any long-term urban revival. This year’s Census shows that the number of single households in New York has reached record levels; in Manhattan, more than half of all households are singles. And the Urban Future report’s analysis found that even well-heeled Manhattanites with children tend to leave once they reach the age of 5 or above.

    The key factor here may well be economic opportunity. Virtually all the supposedly top-ranked cities cited in this media narrative have suffered below-average job growth throughout the decade. Some, like Portland and New York, have added almost no new jobs; others like San Francisco, Boston and Chicago have actually lost positions over the past decade.

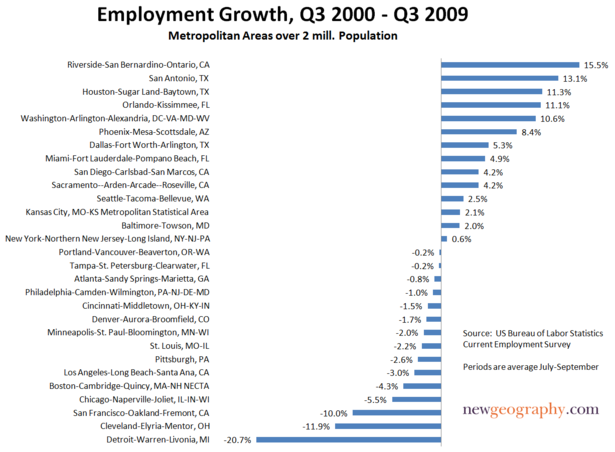
    In contrast, even after the current doldrums, San Antonio, Orlando, Houston, Dallas and Phoenix all boast at least 5% more jobs now than a decade ago. Among the large-narrative magnet regions only one–government-bloated greater Washington–has enjoyed strong employment growth.

    The impact of job growth on the middle class has been profound. New York City, for example, has the smallest share of middle-income families in the nation, according to a recent Brookings Institution study; its proportion of middle-income neighborhoods was smaller than that of any metropolitan area except Los Angeles.The same pattern has also emerged in what has become widely touted as America’s “model city”–President Obama’s adopted hometown of Chicago.

    The likely reasons behind these troubling trends are things rarely discussed in “the narrative”–concerns like high costs, taxes and regulations making it tough on industries that employ the middle class. One clear culprit: out of control state spending. State spending in New York is second per capita in the nation (anomalous Alaska is first); California stands fourth and New Jersey seventh. Illinois is down the list but coming up fast. Over the past decade, while its population grew by only 7%, Illinois’ spending grew by an inflation-adjusted 39%.

    The problem here is more than just too-large government; it lies in how states spend their money. Massive public spending increases over the past decade in California, New Jersey, Illinois and New York have gone overwhelmingly into the pockets and pensions of public employees. It certainly has not flowed into such basic infrastructure as roads, bridges and ports that are needed to keep key industries competitive.

    The American Association of State Highway Transportation, for example, ranked New York 43rd in the country and New Jersey dead last in terms of quality of roads. Some 46% of the Garden State’s roads were rated in poor condition, compared with the national average of 13%, even as the state’s spending reached new highs. The typical New Jersey driver spends almost $600 a year in auto repairs necessitated by the poor conditions of the roads.

    In contrast, states in the South and parts of the Plains tend to pour their public resources into productive uses. Cities like Mobile, Ala., Houston, Charleston, S.C., and Savannah, Ga., have been investing in port facilities to take advantage of the planned widening of the Panama Canal. The primary goal is to take business away from the increasingly expensive, overregulated and under-invested ports of the Northeast and West Coast. Similarly, places like Kansas City and the Dakotas are looking to boost their basic rail and road networks to support export-heavy industries.

    Even in the face of the Obama administration’s strongly urban-centric, blue state-oriented economic policy, these generally less than hip places appear poised to grow as the economy recovers. Virtually all the top 10 economies that have withstood the recession come from outside the “youth-magnet” field: San Antonio; Oklahoma City; Little Rock, Ark.; Dallas, Baton Rouge, La.; Tulsa, Okla., Omaha, Neb.; Houston and El Paso, Texas. The one exception to this rule, Austin, also benefits from being located in solvent, generally low-tax Texas.

    This continued erosion of jobs and the middle class from the blue states and cities is not inevitable. Many of these places enjoy enormous assets in terms of universities, strategic location, concentrations of talented workers and entrenched high-wage industries. But short of a massive and continuing bailout from Washington, the only way to reverse their decline will be a thorough reformation of their governmental structure and policies. No narrative, no matter how well spun, can make up for that reality.

    This article originally appeared at Forbes.com.

    Joel Kotkin is executive editor of NewGeography.com and is a distinguished presidential fellow in urban futures at Chapman University. He is author of The City: A Global History. His next book, The Next Hundred Million: America in 2050, will be published by Penguin Press early next year.

  • Contributing Editor SUSANNE TRIMBATH in The Real Deal regarding commercial real estate

    “‘With declining property values, banks are afraid to lend because they fear the new loans will soon be underwater, not unlike the loans they made last year,’ said Susanne Trimbath, CEO of STP Advisory Services in Omaha, Neb.”

    Susanne in The Real Deal

  • Executive Editor JOEL KOTKIN in the LA Times regarding California

    “Today’s public benefits fail that test, as urban scholar Joel Kotkin of NewGeography.com and Chapman University told the Los Angeles Times in March: ‘Twenty years ago, you could go to Texas, where they had very low taxes, and you would see the difference between there and California. Today, you go to Texas, the roads are no worse, the public schools are not great but are better than or equal to ours, and their universities are good. The bargain between California’s government and the middle class is constantly being renegotiated to the disadvantage of the middle class.’”

    November 2, 2009

  • Executive Editor JOEL KOTKIN on POLITICO regarding economic populism

    “You would think, given the massive dissatisfaction with an economy that guarantees mega-bonuses for the rich and continued high unemployment, that the GOP would smell an opportunity. In my travels around the country — including in midstream places like suburban Kansas City and Kentucky — few, including Democrats, express any faith in the president’s basic economic strategy.”

    Joel on POLITICO

  • Executive Editor JOEL KOTKIN on The Kansas City Star regarding Kansas City

    “This is not supposed to happen to Kansas City. However, yesterday, Joel Kotkin, on a national radio program, yes national, told the national audience how he thought Kansas City is beautiful, settled, stable….this really worries me. ”

    Joel on The Kansas City Star

  • Executive Editor JOEL KOTKIN on The City Journal regarding California

    As Joel Kotkin of NewGeography.com wrote last year, “California can still attract many newcomers, particularly young and ambitious people who dream of a career in Hollywood or Silicon Valley. The problem is that when you grow up and have failed to secure your own dotcom or television series, life in Texas, Arizona, North Carolina, or even Kansas starts looking better.”

    Joel on The City Journal

  • Executive Editor JOEL KOTKIN on Al.com regarding Mobile, Alabama

    “I’ve been very impressed with what you’ve been doing here, investing in your ports and infrastructure, and working to bring in more manufacturing jobs,” Joel Kotkin, a professor at Chapman University in Orange, Calif., told the crowd at Envision Coastal Alabama’s annual meeting at the Grand Hotel Marriott Resort.

    Joel on Al.com

  • Riding Out the Recession in the Forty Strongest Metropolitan Economies

    A few days ago BusinessWeek released a list of the top 40 metropolitan economies based on data compiled at the Brookings Institution’s Metromonitor project. But, as many old media sites tend to do, they’ve locked the list behind a slow-loading slide show in a cheap attempt to drum up page views. Many of the commenters to the original article couldn’t even find the list.

    So, in the interest of usability, here’s the top 40 in boring list format:

    1 San Antonio, TX
    2 Austin-Round Rock, TX
    3 Oklahoma City, OK
    4 Little Rock-North Little Rock-Conway, AR
    5 Dallas-Fort Worth-Arlington, TX
    6 Baton Rouge, LA
    7 Tulsa, OK
    8 Omaha-Council Bluffs, NE-IA
    9 Houston-Sugar Land-Baytown, TX
    10 El Paso, TX
    11 Jackson, MS
    12 McAllen-Edinburg-Mission, TX
    13 Washington-Arlington-Alexandria, DC-VA-MD-WV
    14 Columbia, SC
    15 Pittsburgh, PA
    16 Harrisburg-Carlisle, PA
    17 Des Moines-West Des Moines, IA
    18 Virginia Beach-Norfolk-Newport News, VA-NC
    19 Honolulu, HI
    20 Rochester, NY
    21 Buffalo-Niagara Falls, NY
    22 Scranton-Wilkes-Barre, PA
    23 Augusta-Richmond County, GA-SC
    24 Colorado Springs, CO
    25 Madison, WI
    26 Albuquerque, NM
    27 Syracuse, NY
    28 Albany-Schenectady-Troy, NY
    29 Kansas City, MO-KS
    30 Raleigh-Cary, NC
    31 Ogden-Clearfield, UT
    32 Boston-Cambridge-Quincy, MA-NH (tied)
    32 New Haven-Milford, CT (tied)
    33 Bridgeport-Stamford-Norwalk, CT
    34 Denver-Aurora-Broomfield, CO (tied)
    34 Baltimore-Towson, MD (tied)
    35 Poughkeepsie-Newburgh-Middletown, NY
    36 Hartford-West Hartford-East Hartford, CT
    37 Indianapolis-Carmel, IN
    38 Memphis, TN-MS-AR

    Trends? Looks like energy economies, state capitals, university-heavy towns, generally affordable regions that avoided the housing boom, and a few old industrial centers that suffered the brunt of decline 25 years ago and now may be positioned for an up-swing.

    Here’s an explanation of the list methodology:

    The Brookings Institution ranked the 100 largest metros by averaging the ranks for four key indicators: employment change, unemployment change, gross metropolitan product, and home price change. Employment was measured by the change from the peak quarter for each metro to the second quarter of 2009. The peak was the quarter in which the metro had the most jobs during the past five years. Unemployment was ranked by measuring the percentage-point change from the first quarter of 2009 to the second quarter of 2009. Gross metropolitan product was measured from the peak quarter to the second quarter of 2009. And the ranking of home prices compared the second quarter of 2009 to the previous quarter. The employment data were provided by Moody’s Economy.com, the unemployment data were collected from the U.S. Bureau of Labor Statistics, and the home price index came from the Federal Housing Finance Agency.

    Source: The Brookings Institution’s MetroMonitor

  • Housing Design: Create The Next Classic

    I often compare home marketing to automotive marketing, not because I was raised in Detroit and am somewhat of a motor head, but because these are two very big ticket items that have been developed and marketed in very different ways. You may think that auto companies are huge corporate conglomerates, and builders are mostly small, local companies selling a home or two, but the major builders certainly are not small concerns. A major builder selling 50,000 homes at $250,000 each would generate the same total income as a small auto company selling 500,000 cars at $25,000 each. Yet, there has been much more product research, development, testing, and marketing on cars, SUVs or trucks than on homes.

    To “drive” this comparison home consider the following: Compare the specifications on a $140,000 (adjusted for inflation) 30 year old Ferrari 308 which was state of the art in 1980, and even the most basic car, for example a Hyundai Genesis Coupe. The two passenger 300 horsepower Ferrari would do 0-60 in 6.8 seconds with a top speed of 142 HPH, slower than the $25,000 Hyundai ‘s 0-60 in 5.5 seconds, top speed at 149 MPH. The Hyundai would actually make that hairpin turn with a computer assisted 0.90g lateral acceleration, while the Ferrari would slide into the roadside ditch at only 0.81g.

    And the list goes on. The Hyundai adds 10 more highway MPG to the Ferrari’s 16 MPG. Watch out for deer? At an emergency stop from 60 MPH the Hyundai takes only 111 feet, a whopping 42 feet less than the Ferrari which plows right through Bambi. After adjusting for inflation, the specifications of the Hyundai blow past the Ferrari for 80% less money. Reliability? Not even close. The Ferrari 308 owner will be on a first name basis with his or her mechanic, and probably even know his family.

    So… while it seems stagnant at times, the auto industry has still made tremendous progress. From a style, materials, and overall design standpoint, any of today’s cars and trucks render those built in the early 1980s obsolete. The industry offers an astonishingly better product than it did twenty-five years ago. This is despite a few moments when auto manufacturers lost their way. Remember 1981 — a recession with car showrooms in shambles and the government rescuing Chrysler — and Lee Iacocca touting the “K” Car? My, auto makers have come a long way!

    Now let’s compare the 1980 suburban single family home to the 2006 (the height of the housing market) suburban single family home.

    From National Association of Home Builders data we see that the average 1980 house was just over $76,000 and averaged about 1,800 square feet. Adjusted for inflation, that 1980 home would be approximately $190,000 in 2006 dollars. This equates to approximately $105 a square foot. The 1980s were also the age of large sprawling suburban lots; 10,000 sq.ft would have been considered, in some areas, too small. Suburban densities of two units per acre were typical in the north, with higher densities in the three to four unit per acre range as one traveled south. The 1980’s home price included a spacious lot.

    Fast forward through 26 years (of evolution?). Homes gradually increased in size to an average of 2,414 sq.ft. (again, NAHB data). The typical home in 2006 cost $264,000, or $109 a square foot. Essentially, the home built at the peak of the market cost only slightly more than the home built in 1980. Lot areas generally have come down in size. In the south where densities were already higher, the lot size reduction was minimal, but in the north that 1980 10,000 sq.ft. lot that was once considered small would today be considered quite large.

    The 1980s home would have been built to a lower standard with little in energy conservation; it was wasteful. The home built 25 years later — at the height of the market in 2006 — would have been built to much higher standards, both in construction and in energy efficiency.

    Today’s consumer may favor the older, 1980s suburban home. It is likely built in an area with mature landscaping, local conveniences, and established schools, and it is probably located closer to town (employment), on a larger lot. Yes the home is slightly older, but not significantly visually different than the more recent home, at least to the naked eye. The transition from the previous three decades, 1950 to 1980, was drastic. But it was not so in the past 30 years.

    The new suburban home in today’s market is typically on the outer edge of urbanization. The confidence level that services and schools will be developed in a timely manner is much lower. There simply has not been a significant change in housing during the past three decades. The garage-forward 1980s home that proudly displays massive garage doors that define the streetscape is similar to the suburban homes built today, except the home built today might also include the obligatory porch sitting next to the garage.

    Three decades ago Chrysler responded to market changes with the K car, a cheap car that was commercially successful. Notice how many K cars you see on the road today? Longevity, reliability and quality were not its strong points. Cars are temporary. They are disposable and recyclable. Today’s home builders are largely responding to the housing market with a K car attitude of scrimping that will only make the homes built on yesterday’s developments seem even more attractive.

    But housing stock cannot survive on temporary solutions that respond to short trends. The lot that is sold today is likely to be around for many centuries. The home will likely be remodeled over time, but its foundation may last as long as the lot. There are no junk yards for houses…well there are, and they’re called slums.

    Builders rely on suppliers to develop products that improve the housing stock. For example, the vinyl cladding era of the 1980s has been (somewhat) replaced by more attractive concrete based products and wood alternatives. The problem is that these vinyl alternatives are often more expensive – in some cases, much more.

    It’s time for builders to respond by following the automotive industry. That means offering enough of a design revolution to attract new customers. Investing in research and development at a time when banks turn away builders and developers might seem an impossible task. As a design and technology company, we know that first hand. We have a huge investment in future technologies that will not be available until the beginning of 2010.

    Before the recession, we typically invested 10% of our gross income (designing new developments) in new technologies. Planning and architecture is not exactly a thriving industry today. Banks are not interested in funding anything related to land development, sustainability, or software. To keep development on track, our investment now represents over 50% of our total income.

    Getting through this period has been tough, but at the end of the day we will have a revolutionary product with a new range of services that will benefit development-related industries. Architects can respond to a down market by investing their down time in experimentation and development of better design methods to increase the value of housing, instead of sitting around waiting for a client to call.

    During this past decade people got used to making a new home purchase to supplement their income, assuming that home values would rise several thousands of dollars annually. Those days are gone. Give consumers a new reason to buy: a better product. When future housing customers have the opportunity to significantly increase their living standards by purchasing new homes vs. staying where they are, they will want to buy new again.

    Rick Harrison is President of Rick Harrison Site Design Studio and author of Prefurbia: Reinventing The Suburbs From Disdainable To Sustainable. His website is rhsdplanning.com.