“”They have done everything they can to build a good business location,” says noted California writer, demographer and lecturer Joel Kotkin about the community of Ontario, Calif. “They have built the infrastructure.” In addition to a thriving logistics scene, the environs of LA/Ontario International Airport also include such developments as the Ontario Airport Towers, above, developed by PGP Partners and Deutsche Asset Management.”
Blog
-
Executive Editor JOEL KOTKIN on Las Vegas Weekly regarding Las Vegas
“Fortune, of “America’s Most Livable Cities” fame, recently published a protest of all such rankings. Urbanist Joel Kotkin says he prefers cities of “ambitious migrants, families and entrepreneurs” to those promising “safety, sanitation or homogeneity.” Or advanced degrees, let’s say. Kotkin finds an urban standard in 17th-century Amsterdam, which Rene Descartes described as “an inventory of the possible.” Whatever its failures, Las Vegas passes that test.”
-
Contributing Editor MICHAEL LIND on The Daily Doubter regarding economics
“The minimum wage in the United States today is far below what it was a few decades ago, thanks to inflation. At the same time, in the last generation wages have stagnated while roughly half of the gains from economic growth have gone to a tiny number of rich Americans. Many conservative economists and business executives argue that companies cannot afford high wages for ordinary workers. Aren’t high salaries and bonuses costs as well? ”
-
Editors JOEL KOTKIN and WENDELL COX on the New America Foundation
“Wendell Cox, Joel Kotkin, James Heartfield, and Mark Pennington have devastating presentations on the effects of smart growth on housing (the Antiplanner talks on this subject as well).”
-
Eros Triumphs…At Least in Some Places, Mapping Natural Population Increases
As with other advanced capitalist societies, the US population is aging. About 30 percent of US counties experienced natural decrease – more deaths than births – in the 2000-2007 period.
Nevertheless, the most exceptional feature of the United States remains its unusually high level of natural increase, and significant degree of population growth. This is often attributed to the high level of immigration, especially from Mexico, illegal as well as legal, and their high fertility. This process is indeed critical, even though most of the migration is in fact legal, and the share from Mexico is not as high as commonly perceived. Also most of the Hispanic population in the United States is native, not immigrant.
Perhaps a more important feature of US society contributing to a smaller decline in fertility than in most other advanced countries is the extraordinary cultural traditionalism of perhaps half the American population. This is reflected in the so-called “culture wars”: a more educated modernism, pejoratively dubbed as “secular humanist,” versus a more traditional, religion-observing “moral majority.”
Conservatives campaign against abortion and even contraception, and maintain an amazingly high level of religiosity and skepticism of science, creating a climate favorable to a level of fertility above replacement levels (2.1 per female). The super pro-child Mormon Church alone claims millions of members, and evangelical groups boast even more. This creates a fascinating, future-influencing tension between a younger-growing, more educated population choosing lower fertility on average, and a more traditional population more successful at reproducing themselves!
Natural increase, then, can be expected in the following kinds of areas. One is heavily Hispanic areas. Those with more recent immigrant stock have higher fertility, but above replacement fertility seems to persist for several generations. Another lies in Native American Indian areas. The explanation here is controversial, but there is perhaps a sense of the need for more children as a reaction to a perceived threat of loss of identity.
For areas with more vibrant economic growth, attracting and maintaining young workers constitute another focal point for natural increase. These are overwhelmingly urban, even metropolitan. Note that these areas may not have above replacement fertility, but will have natural increase, simply because of the younger age structure of the population.
Other strong candidates for natural increase include military base areas, because of the prevalence of young families. Likewise Mormon areas, and fundamentalist religion areas, at least where there remain sufficiently young populations.
Seventy percent of counties had natural increase, differing from counties with natural decrease by higher immigration, much higher levels of urban population, a much younger population, and far higher levels of racial and ethnic minorities, especially Hispanics.
A little more than half (1193) of counties with natural increase had net domestic out-migration – more people leaving than moving into the county, and of these the majority (702) lost population, while in the other 492 natural increase was greater than the out-migration loss, resulting in population gains. Out migration counties differ from in-migration counties ONLY because of the markedly higher ethnic and racial minority shares, obviously reflecting much weaker economic performances. The population losing counties had especially high African American population shares and were more rural.
The net in-migration counties (1093) are usefully separated into those in which natural increase exceeded the net in-migration (only 272 counties) and those in which net in-migration was dominant (821). The former had slightly higher minority shares, and were somewhat more urban.
Geography of Natural Increase
Figure 1 maps natural increase by five levels, with cooler colors having a small natural increase (here in the simple sense of the excess of births over deaths as a share of the base population), and warm colors indicated high levels of natural increase. Rates of over 10 percent are really startlingly high.
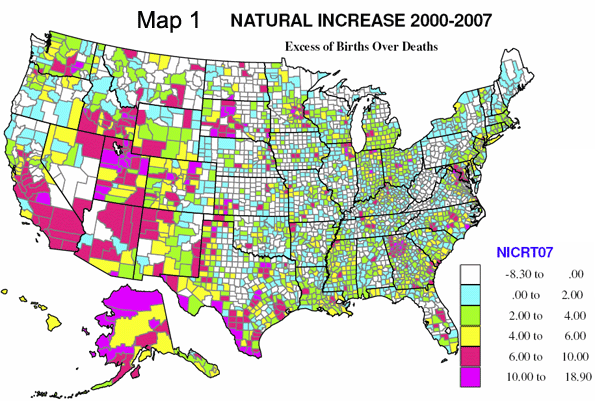
Natural increase prevails over much of the country, with the exception of much of the Great Plains, from Texas to Canada, and northern Appalachia. High levels of natural increase, over 6 percent (orange and magenta on Map 1) occur in five kinds of areas that are really highly predictable.
- First, areas of high Hispanic population, mainly from Texas to southern and central California, but also in parts of eastern Washington and southwestern Kansas.
- Second, Native American Indian reservation areas, most obviously in Alaska, New Mexico, South Dakota, Arizona but also Montana and North Dakota.
- Third, the Mormon “culture belt,” spreading from the “Zion” of Utah to Idaho, Nevada and Wyoming.
- Fourth, rapidly growing suburban and exurban counties, most notably around Houston, Dallas, San Antonio, Austin, Atlanta, Washington DC, Chicago, Minneapolis, Charlotte and Denver, and
- fifth, in counties with military bases, for example, in North Carolina, Georgia, Kansas, Oklahoma and several other states.
Above average natural increase, from 4 to 6 percent, is typical of many modestly growing metropolitan areas, both central and suburban and exurban counties, and in a scattering of rural-small town counties, especially in the west (western Colorado is notable). Low natural increase, under 2 percent, is very widespread across both urban and rural areas, and is often indicative of slow-growing economies with out-migration (please see Map 2), and in areas moderately attractive to older migrants, thus depressing births, but not enough to cause natural decrease.
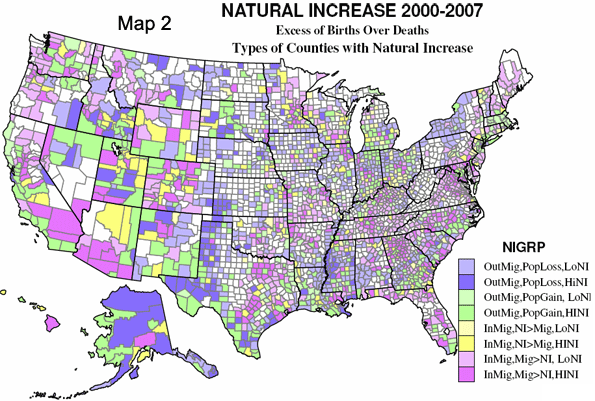
Map 2 sorts counties according to in or out migration, population gain or loss, and the role of natural increase versus net in-migration. Four basic types are mapped, but then divided into high or low natural increase. Rapidly growing counties with net in-migration even greater than high natural increase (dark pink) are especially typical of suburban and exurban counties of large metropolises, and of fast-growing smaller metropolitan areas. Lower natural increase is more common for rural and small town amenity areas, as well as far exurban counties. Natural increase greater than in-migration (yellow) is not very common, and tends to occur in rural-small town counties, including several counties with high Mormon shares. Counties with out-migration but enough natural increase to permit overall population growth (green) are common in three kinds of areas. First are large central metropolitan counties – such as those containing Los Angeles, Houston, Dallas, and Miami – with high non-Hispanic white out-migration, but high Hispanic in-migration. The second type are border region counties with high Mexican in-migration, and the third are Native American Indian areas. Those counties experiencing population loss (purple) are much more like counties with natural decrease: dominantly rural or declining rust belt metropolitan areas.
Finally, what areas have the highest rates of natural increase? These see increases of 16 to 19 percent from the base population. They are Wade-Hampton, Alaska (west of Bethel); Webb, Texas (Laredo); Utah (Provo); Hidalgo, Texas (McAllen); Loudoun, Virginia (Leesburg, northwest of Washington DC); Starr, Texas (Rio Grande City); and Madison, Idaho (Rexburg). Three are Hispanic, two Mormon, one Alaska native, and one fast growing suburban.
Natural increase has remained higher than forecast 40 years ago due to far higher immigration, above replacement fertility even among the affluent and educated, and high teenage pregnancy in connection with constraints on abortion – i.e., America’s very high religious traditionalism. The unknowns ahead include the rate of future immigration, whether 2nd and 3rd generation Hispanics will reduce fertility markedly and whether education and modernism will reduce the power of tradition.
See Richard’s similar piece on natural decreases in US population.
Richard Morrill is Professor Emeritus of Geography and Environmental Studies, University of Washington. His research interests include: political geography (voting behavior, redistricting, local governance), population/demography/settlement/migration, urban geography and planning, urban transportation (i.e., old fashioned generalist)
-
Our Euro President
Barack Obama’s seemingly inexplicable winning of the Nobel Peace Prize says less about him than about the current mentality of Europe’s leadership class. Lacking any strong, compelling voices of their own, the Europeans are now trying to hijack our president as their spokesman.
There’s a catch, of course. In their mind, Obama deserves the award because he seems to think, and sound, like a European. In everything from global warming to anti-suburbanism to pacifism, Obama reflects the basic agenda of the continent’s leading citizens–in sharp contrast to former President George W. Bush.
Indeed it’s likely that if Obama wanted to run for presidency of the E.U., he could mail it in. Unfortunately for him, he presides over a country that faces a very different future from that of Europe.
This is not to say we cannot learn from Europe in certain areas–namely fuel economy and health care. Republicans dropped the ball on both of these issues, and as a result both our health care system and automobile efficiency pale next to those of the continent.
Still, the reality is that America and Europe are very different, which would necessitate disparate policy approaches. Our growing divergence with Europe spans everything from demographics to economic needs and basic values. In all these areas, the gap is likely to increase over time.
This is why the Obama Administration’s Europhilia, now likely to become more pronounced, represents a dangerous temptation. For one thing, Europe’s generally ultra low birth rates–compared with those in the U.S.–imposes structural limits on how their economies can grow and even if they even need growth.
If our core problems come from over-consumption and irrational financial-sector exuberance, Europe’s sluggishness stems from the lack of an expanding workforce and consumer base. This means Germany–by far the most important E.U. country in terms of population and gross domestic product–must rely on exports to maintain its generally slow growth rate. More important, as the current generation in their 50s retire, the workforce is likely to shrink dramatically in almost all European countries, making even modest growth difficult.
In a rapidly aging society like Germany’s and those of other E.U. countries you can make a case for slow growth, limited work hours, early retirement and a strict regulatory regime. But for America, with its growing workforce and population, slow economic growth simply is not socially sustainable.
More broadly, we are talking about two different mindsets. As one writer puts it, Europeans “emphasize quality of life over accumulation” and “play over unrelenting toil.” In contrast, most Americans seem ill-disposed to relax their work ethic, which has been central to the national character from its earliest days.
Of course, the European approach is celebrated by some Americans, particularly those who already have achieved a high level of affluence. It plays very well in “little Europes” of America, cities like San Francisco, Portland and Boston, places with relatively few children and generally slow-growing populations.
But most Americans do not seem ready for a lifestyle buffeted by regulations and limitations. Still attached to their aspirations, they seem no less satisfied with their way of life than do Europeans. Even amid the recession, 70% of Americans still embrace the idea that they can get ahead through hard work.
There are other critical differences. Americans remain more religiously minded. One analyst, David Hart, has spoken of Europe’s “metaphysical boredom.” Half or more of Europeans never attend church, compared with barely 20% in the U.S.
Among younger Europeans, the loss of traditional Christian identity–with its focus on long-term commitments, sacrifice and responsibility–is virtually complete: According to one Belgian demographer, barely one in 10 young adults in the E.U. maintains any link to an organized religion. In contrast roughly 60% of Americans, according to a Pew Global Attitudes survey, believe religion is “very important,” twice the rate of Canadians, Britons, Koreans or Italians and six times the rate of French or Japanese.
Some observers, both in America and abroad, see this spiritualism, particularly among evangelical Christians, as reflecting a kind of social retardation. Yet belief in America is remarkably varied, extending beyond groups that are easily classified as liberal or conservative. In America, a broad “spiritual” focus–dating from the earliest founders and continuing through the transcendentalists and Walt Whitman–persists as a vital force. Even President Obama, whose base tends to be secular, has made much of his religious ties.
In Europe, the only truly rising faith appears to be the secular religion of the environmental zealots. Often almost theocratic in its passion, the green movement tends to be hostile to even modest population growth and economic progress. It’s no coincidence that the last American to win the Nobel Prize was the climate change high priest himself, former Vice President Al Gore.
To be sure, Americans also care about the planet, but they seem more disposed to see technological innovation, not abstinence, as the best way to confront ecological problems. The kind of highly restrictive regulatory environment common in Europe–and sadly in such places as California—simply is not well-suited for a country that must produce much more wealth and millions more jobs in order to sustain itself.
Even though they may espouse secular ideals, this more growth oriented mentality also attracts a sizable number of talented and ambitious young Europeans to the U.S., as well as Australia and Canada. Although influential social commentator Richard Florida has claimed that the bright lights and “tolerance” of Europe are luring large numbers of skilled Americans, actual migration trends tell quite the opposite story. By 2004 some 400,000 E.U. science and technology graduates were residing in the U.S. Barely one in seven, according to a recent European Commission poll, intends to return.
Perhaps the president should speak to these young Europeans. They still buy the notion of America as a country open to innovation and striving for upward mobility. Europe, in contrast, perhaps as the result of two debilitating wars in the last century, understandably craves peacefulness and social stability over all else.
When he goes to Oslo next month, Obama should remember that America’s future is not to become a bigger version of Norway, a tiny country fat with fossil fuels that can afford its air of moral superiority. We are also not latter day versions of Britain, France, Germany or Russia–all of them worn empires exhausted by history.
Ultimately America is about hope and aspiration. It is, if you will, a country based on an ideal, not a race or cultural legacy. As the British writer G. K. Chesterton once put it, the U.S. is “the only nation…that is founded on a creed.” That creed is not so much religious as aspirational, and it will become more important as we attempt to cope with our own growing diversity as well as the rising powers from the developing world.
So even as he enjoys his popularity on the continent, Obama must be careful not to succumb to those who urge him to reshape America in Europe ‘s image. Take this prize, Mr. President, and then shelve it.
This article originally appeared at Forbes.com.
Joel Kotkin is executive editor of NewGeography.com and is a distinguished presidential fellow in urban futures at Chapman University. He is author of The City: A Global History
. His next book, The Next Hundred Million: America in 2050, will be published by Penguin Press early next year.
Official White House photo by Pete Souza
-
Go to Middle America, Young Men & Women
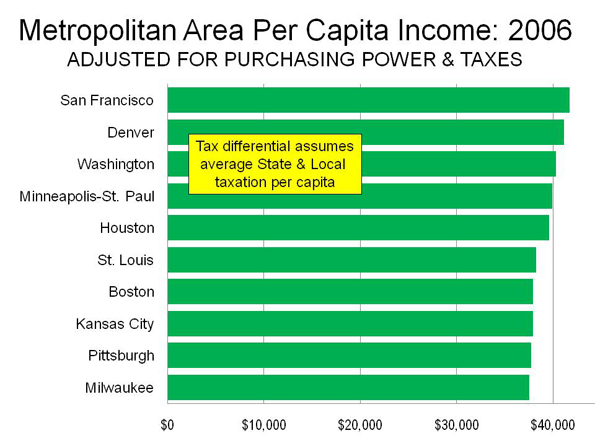
A few weeks ago, Eamon Moynihan reviewed economic research on cost of living by state in a newgeography.com article. The results may seem surprising, given that some of the states with the highest median incomes rated far lower once prices were taken into consideration. The dynamic extends to the nation’s 51 metropolitan areas with more than 1,000,000 population (See Table).
There is a general perception that the most affluent metropolitan areas are on the east coast and the west coast. Indeed, 8 of the 10 metropolitan areas with the highest nominal per capita income in 2006 were on the two coasts. These included San Francisco, San Jose and Seattle on the west coast and Washington, Boston, New York, Hartford and Philadelphia on the east coast. Middle-America is represented by Denver and Minneapolis-St. Paul. However, as anyone who has lived on the coasts and Middle America knows, a dollar in New York or San Francisco does not buy nearly as much as a dollar in Dallas-Fort Worth or Cincinnati.
Per Capita Income: Purchasing Power Parity US Metropolitan Areas over 1,000,000 Population 2006 Per Capita Income Rank Metroplitan Area Purchasing Power Adjusted Nominal Nominal Rank 1 San Francisco $46,287 $57,747 1 2 Washington $45,178 $51,868 3 3 Denver $44,798 $44,691 8 4 Minneapolis-St. Paul $44,326 $44,237 9 5 Houston $42,815 $43,174 11 6 Boston $42,571 $50,542 4 7 Pittsburgh $41,716 $38,550 20 8 St. Louis $41,613 $37,652 27 9 Milwaukee $41,572 $39,536 19 10 Baltimore $41,451 $43,026 12 11 Seattle $41,448 $45,369 6 12 Kansas City $41,329 $37,566 28 13 Hartford $41,104 $44,835 7 14 New Orleans $40,935 $40,211 16 15 Philadelphia $40,725 $43,364 10 16 Dallas-Fort Worth $40,643 $39,924 17 17 Cleveland $39,997 $37,406 30 18 Indianapolis $39,843 $37,735 26 19 Chicago $39,752 $41,591 14 20 Richmond $39,282 $38,233 22 21 New York $39,201 $49,789 5 22 Birmingham $39,057 $37,331 31 23 Cincinnati $38,691 $36,650 36 24 Nashville $38,680 $37,758 25 25 Detroit $38,670 $38,119 24 26 Charlotte $38,632 $38,164 23 27 Miami $38,555 $40,737 15 28 San Jose $38,505 $55,020 2 29 Jacksonville $38,413 $37,519 29 30 Louisville $38,262 $36,000 41 31 Oklahoma City $38,156 $35,637 42 32 Las Vegas $37,691 $38,281 21 33 Salt Lake City $37,381 $35,145 45 34 San Diego $37,358 $42,801 13 35 Rochester $37,066 $36,179 38 36 Columbus $37,058 $36,110 39 37 Atlanta $36,691 $36,060 40 38 Memphis $36,501 $35,470 44 39 Tampa-St. Petersburg $36,260 $35,541 43 40 Portland $36,131 $36,845 35 41 Buffalo $36,091 $33,803 48 42 Norfolk (Virginia Beach metropolitan area) $35,418 $34,858 46 43 Raleigh $35,087 $37,221 32 44 San Antonio $34,913 $32,810 50 45 Providence $34,690 $37,040 34 46 Austin $33,832 $36,328 37 47 Phoenix $33,809 $34,215 47 48 Sacramento $32,750 $37,078 33 49 Los Angeles $32,544 $39,880 18 50 Orlando $32,095 $33,092 49 51 Riverside-San Bernardino $25,840 $27,936 51 Source: http://www.bea.gov/scb/pdf/2008/11%20November/1108_spotlight_parities.pdf Purchasing Power Parity: Things change rather dramatically when purchasing power is factored in. Some years ago, international economic organizations, such as the Organization for Economic Cooperation and Development, the World Bank and the International Monetary Fund began using costs of living by nation to compare national economic performance, rather than currency exchange rate. This practice, called “purchasing power parity” is based upon the recognition that there may be substantial differences in the cost of living between nations.
This can be illustrated by comparing Switzerland and the United States. For years, Switzerland has had a higher per capita GDP than the United States on an exchange rate basis. Switzerland’s gross domestic product per capita was $53,300 in 2006, nearly 30% above that of the United States ($42,000). However price levels in Switzerland are so high that incomes do not go nearly as far as the exchange rate would suggest. Once adjusted for purchasing power parity, the Swiss GDP per capita in 2006 drops to $39,000, well below that of the United States. Much of the difference has to do with regulation. The more liberal economy of the United States produces a lower cost economy than in Switzerland, or for that matter most of Western Europe. The US economic advantage would be even greater measured on a household basis, since US households include nearly 10% more members (generally children) than those in Western Europe.
The same concept was applied by the Department of Commerce Bureau of Economic Analysis researchers in their review of purchasing power parities between US metropolitan areas in 2006. When purchasing power is factored in, five of the top metropolitan areas in nominal per capita income (not adjusted for purchasing power) drop out and are replaced by other metropolitan areas rarely thought of as among the nation’s most affluent.
Among the three west coast nominal leaders, San Francisco remains as #1, in both nominal and purchasing power adjusted per capita income. Seattle dropped from 6th to 11th position. However, the real surprise is San Jose, which dropped from 2nd position to 28th.
The east coast regions ranked among the top 10 metropolitan areas in nominal income also were decimated by their high costs, with only Washington (which rose from 3rd to 2nd) and Boston (which fell from 4th to 6th) remaining. New York fell from 5th to 21st, Hartford from 7th to 13th and Philadelphia from 10th to 16th.
The two non-coastal metropolitan areas in the nominal top 10 remain, with Denver rising from to 3rd and Minneapolis-St. Paul rising from 9th to 4th.
It can be argued that Middle-America replaced the five metropolitan areas dropping out of the top ten. Houston, long one of the most disparaged metropolitan areas among urbanists, occupies the 5th position (compared to its 11th ranking in the nominal list). Three of the new entrants are confirmed members of the Rust Belt: Pittsburgh (7th), St. Louis (8th) and Milwaukee (9th). Finally, there is a new east coast entrant, blue-collar Baltimore (10th).
The Impact of Taxes: But that is just the beginning. Taxes also diminish the purchasing power of households. Unfortunately, there is virtually no readily available information on state and local taxation by metropolitan area. There is, however state and local government taxation data at the state level. If it is assumed that this data is representative of metropolitan differences (weighted proportionately by state in multi-state metropolitan areas), there would be changes in rank among the top 10. Denver would displace Washington in the number two position, closing more than one-half the gap with San Francisco. Even more surprisingly, St. Louis would move ahead of both Boston and Pittsburgh to rank 6th. Kansas City would leap over #11 Seattle, Baltimore, Milwaukee and Pittsburgh to rank 8th, trailing #7 Boston by $25, not much more than the price of a Red Sox standing room ticket. Pittsburgh would occupy the #9 position and Milwaukee #10 (See Figure).
More than Housing: The largest differences in purchasing power stem from housing, with east coast and west coast metropolitan areas having generally higher housing costs. As a result of the housing bust and the larger house price drops in those areas, purchasing power adjusted incomes could recover relative to those of Middle America. However, the high cost of living on the east and west coasts extend to more than housing prices. Generally, according to proprietary (and for sale) ACCRA cost of living data, the west coast and east coast metropolitan areas have higher costs of living even without housing. These differences are largely in grocery costs, which probably reflects the anti-big box store planning regulations and politics that exist in many of these areas. Grocery costs in the more affluent middle-American metropolitan areas tend to be lower.
Other Surprises: Outside the top 10 most affluent metropolitan areas, there are other surprises. Urban planning favorite Portland ranks 40th, just above Buffalo. Rust Belt Cleveland ranks 17th, a few positions above New York. Kansas City, with its highly decentralized civic architecture, ranks 12th, just behind Seattle. Indianapolis (17th) is more affluent than Chicago (18th) and both are more affluent than New York.
Five of the bottom 10 metropolitan areas are in the south, including Virginia Beach, Raleigh, Austin, San Antonio and Orlando. But perhaps the biggest surprise of all is that four of the five lowest ranking metropolitan areas are in the southwest: Phoenix (47th), Sacramento (48th), Los Angeles (49th) and Riverside-San Bernardino (51st).
The Dominance of Middle America: But among the 10 most affluent metropolitan areas in the nation, six or seven may be counted as Middle-America (depending on how Baltimore is classified). Only three are from the original group that supplies 8 of the top metropolitan areas when purchasing power is not considered.
Related articles:
Gross Domestic Product per Capita, PPP: World Metropolitan Regions
Gross Domestic Product per Capita, PPP: China Metropolitan RegionsPhotograph: Pittsburgh
Wendell Cox is a Visiting Professor, Conservatoire National des Arts et Metiers, Paris. He was born in Los Angeles and was appointed to three terms on the Los Angeles County Transportation Commission by Mayor Tom Bradley. He is the author of “War on the Dream: How Anti-Sprawl Policy Threatens the Quality of Life.
”
-
Obama’s Home Town
Hyde Park, in Chicago, is where President Obama called home before moving to Pennsylvania Avenue.
I once called 5118 S. Dorchester home.
Hyde Park is a college town surrounded by – but not really part of – a big city. The University of Chicago, founded in 1890, is the heart of the community. The campus was built of Indiana limestone, fake Gothic, and made to look old from its very inception. Some people like it.
In 1893, Hyde Park hosted the World’s Columbian Exhibition (a year late). This showcased the new campus, and also what is now the Museum of Science & Industry, at the northern edge of Jackson Park. The Midway Plaisance – as in carnival midway – then a canal traversed by Venetian gondolas, now marks the southern boundary of Hyde Park.
The tradition continued with Robert Maynard Hutchins and Mortimer Adler – the latter founder of Encyclopedia Britannica, and both authors of the Great Books model of liberal arts education. Subsequent residents have included Muhammad Ali, William Ayers, Saul Bellow, and Barack Obama.
The community is bordered on the east by Lake Michigan, on the west by Washington Park (as in green grass – where few white residents dare to picnic), on the south by the ghetto community of Woodlawn, and to the north by Kenwood – also mostly a ghetto. The formal northern boundary is Hyde Park Blvd (51st St.), but really the neighborhood extends a couple of blocks north into Kenwood. Including this (say to 49th St.), Hyde Park is less than two square miles, and has about 30,000 people.
To preserve its integrity as a college town, the area is separated as much as possible from the surrounding ghetto. As a result, public transportation to and from Hyde Park is poor to anyplace besides the Loop. It is difficult to get to Hyde Park from nearby communities. This is what gives it the feel of a separate village. It takes half an hour to get to the rest of Chicago.
The Illinois Central tracks bisect Hyde Park along Lake Park Ave. East of the tracks is a lakeshore community, traditionally Jewish. Here are high-rise condos such as one would find on the North Side. The famous and impressive Shoreland Hotel has become a college dormitory. Hyde Park Blvd. turns south, east of the tracks, and is a very impressive avenue leading to the Museum of Science & Industry. A pedestrian tunnel leads under Lakeshore Drive to the marvelous Hyde Park Point – a peninsula jutting out into the lake. This offers the very best view of the Chicago skyline from anywhere in the city. Drive to the very end of 55th St. and you’re there.
The town-gown divide runs right along 55th Street: south is gown (and mostly white), north is town (and majority Black). The entire community is racially integrated – one of the defining features of Hyde Park. Nevertheless, east of Woodlawn and south of 55th Street is mostly faculty and graduate student housing. Conversely, the northwest part of town is predominantly Black.
55th Street itself is very boring – the victim of urban renewal in the 60’s and 70’s. The only interesting place is the Lutheran School of Theology at Chicago, a modern but very satisfying building. (On my last visit the building looked to be in disrepair).
The commercial main street is 53rd Street from Woodlawn to Lake Park. I am pleased to say that while individual businesses have come and gone, the character of this street is mostly unchanged over the past 30 years. Half white and half Black, half university and half blue-collar, the street is a great place for people-watching. The center is a small shopping area known as Harper Court. When I last visited, the Valois Cafeteria (53rd and Blackstone) was still there – great place!
Four blocks south is 57th Street, the main street of the campus neighborhood. This used to be justly famous for fantastic bookstores, and probably still is. Please visit the Seminary Co-op Bookstore at the corner of 58th and Woodlawn. (It’s inside the Chicago Theological Seminary building, in the basement; there are small signs.) A less interesting branch is along 57th Street. A small used bookstore on 57th Street just before the tracks is still there (called Powell’s, but probably unrelated to the Portland store). I’m certain all the other independent bookstores are gone.
The university proper starts at Woodlawn and extends west. The impressive Rockefeller Chapel is on Woodlawn south of 58th Street. Frank Lloyd Wright’s justly famous Robie House is at 58th and Woodlawn. The main quad of the university extends from 57th and University all the way to 59th and Ellis. It is well worth exploring. If you can, go into the Harper Library. And walk past the Divinity School. The unforgivably ugly Regenstein Library is across 57th Street – classic brutalism.
West of Ellis is a huge medical complex: the University of Chicago hospitals. This neighborhood is very different still, as neither nurses nor patients live in Hyde Park. The academic core of the university extends west of Ellis as well, and now includes a Science Quad.
By the time one gets to Cottage Grove – the western boundary of Hyde Park and the eastern limit of Washington Park – one is actually in the ghetto. I never felt safe walking along Cottage Grove. Indeed, except for the university campus, I rarely ventured west of Ellis. Otherwise I walked around town at all hours of the day or night.
The campus has crossed the Midway Plaisance, and now includes a row of large buildings along 60th Street – notably the law school. This is a wall against impoverished (and increasingly uninhabited) Woodlawn.
I understand that one additional building needs to be built in Hyde Park: the Obama Presidential Library. Please let the White House know where you think they should put it. The matter is of some urgency.
I’m hoping they can start construction no later than 2013.
Daniel Jelski is Dean of Science & Engineering State University of New York at New Paltz.
-
British Taxpayers Pick Up the Tab for the “Worst. Climate. Campaign. Ever.”
Climate change threatens popcorn prices, air planes, and outdoor hockey. And, in the latest tax-payer funded advertising from the UK, climate change will tell you bedtime stories of a drowning dog and the coming apocalypse:
From the Register, Britons spent £6 million in public funds for an ad campaign which Nature simply calls the Worst. Climate. Campaign. Ever. The advertisement depicts a father and daughter sharing in a bedtime story describing “a land where the weather was very, very strange.” It continues with a sophomoric overview of the causes of climate change, and describes the consequences in a cartoonish overture. The Times reports that “the advertisement attempts to make adults feel guilty about their legacy to their children.”
With all their various predictions of the Earth’s demise – 100 months? 96 months? Four months? – and tons of carbon spent hauling scientists and politicians to climate change conferences all around the world – climate change campaigners still have the time to make us feel guilty for trying to make a modest living – all at the expense of the already deeply in debt UK taxpayers.
Is this movie about to get played on televisions here in the USA? After all, we have plenty of money to spend on propaganda here as well.
-
There’s No Place Like Home, Americans are Returning to Localism
On almost any night of the week, Churchill’s Restaurant is hopping. The 10-year-old hot spot in Rockville Centre, Long Island, is packed with locals drinking beer and eating burgers, with some customers spilling over onto the street. “We have lots of regulars—people who are recognized when they come in,” says co-owner Kevin Culhane. In fact, regulars make up more than 80 percent of the restaurant’s customers. “People feel comfortable and safe here,” Culhane says. “This is their place.”
Thriving neighborhood restaurants are one small data point in a larger trend I call the new localism. The basic premise: the longer people stay in their homes and communities, the more they identify with those places, and the greater their commitment to helping local businesses and institutions thrive, even in a downturn. Several factors are driving this process, including an aging population, suburbanization, the Internet, and an increased focus on family life. And even as the recession has begun to yield to recovery, our commitment to our local roots is only going to grow more profound. Evident before the recession, the new localism will shape how we live and work in the coming decades, and may even influence the course of our future politics.
Perhaps nothing will be as surprising about 21st-century America as its settledness. For more than a generation Americans have believed that “spatial mobility” would increase, and, as it did, feed an inexorable trend toward rootlessness and anomie. This vision of social disintegration was perhaps best epitomized in Vance Packard’s 1972 bestseller A Nation of Strangers, with its vision of America becoming “a society coming apart at the seams.” In 2000, Harvard’s Robert Putnam made a similar point, albeit less hyperbolically, in Bowling Alone, in which he wrote about the “civic malaise” he saw gripping the country. In Putnam’s view, society was being undermined, largely due to suburbanization and what he called “the growth of mobility.”
Yet in reality Americans actually are becoming less nomadic. As recently as the 1970s as many as one in five people moved annually; by 2006, long before the current recession took hold, that number was 14 percent, the lowest rate since the census starting following movement in 1940. Since then tougher times have accelerated these trends, in large part because opportunities to sell houses and find new employment have dried up. In 2008, the total number of people changing residences was less than those who did so in 1962, when the country had 120 million fewer people. The stay-at-home trend appears particularly strong among aging boomers, who are largely eschewing Sunbelt retirement condos to stay tethered to their suburban homes—close to family, friends, clubs, churches, and familiar surroundings.
The trend will not bring back the corner grocery stores and the declining organizations—bowling leagues, Boy Scouts, and such—cited by Putnam and others as the traditional glue of American communities. Nor will our car-oriented suburbs replicate the close neighborhood feel so celebrated by romantic urbanists like the late Jane Jacobs. Instead, we’re evolving in ways congruent with a postindustrial society. It will not spell the demise of Wal-Mart or Costco, but will express itself in scores of alternative institutions, such as thriving local weekly newspapers, a niche that has withstood the shift to the Internet far better than big-city dailies.
Our less mobile nature is already reshaping the corporate world. The kind of corporate nomadism described in Peter Kilborn’s recent book, Next Stop, Reloville: Life Inside America’s Rootless Professional Class, in which families relocate every couple of years so the breadwinner can reach the next rung on the managerial ladder, will become less common in years ahead. A smaller cadre of corporate executives may still move from place to place, but surveys reveal many executives are now unwilling to move even for a good promotion. Why? Family and technology are two key factors working against nomadism, in the workplace and elsewhere.
Family, as one Pew researcher notes, “trumps money when people make decisions about where to live.” Interdependence is replacing independence. More parents are helping their children financially well into their 30s and 40s; the numbers of “boomerang kids” moving back home with their parents, has also been growing as job options and the ability to buy houses has decreased for the young. Recent surveys of the emerging millennial generation suggest this family-centric focus will last well into the coming decades.
Nothing allows for geographic choice more than the ability to work at home. By 2015, suggests demographer Wendell Cox, there will be more people working electronically at home full time than taking mass transit, making it the largest potential source of energy savings on transportation. In the San Francisco Bay Area and Los Angeles, almost one in 10 workers is a part-time telecommuter. Some studies indicate that more than one quarter of the U.S. workforce could eventually participate in this new work pattern. Even IBM, whose initials were once jokingly said to stand for “I’ve Been Moved,” has changed its approach. Roughly 40 percent of the company’s workers now labor at home or remotely from a client’s location.
These home-based workers become critical to the localist economy. They will eat in local restaurants, attend fairs and festivals, take their kids to soccer practices, ballet lessons, or religious youth-group meetings. This is not merely a suburban phenomenon; localism also means a stronger sense of identity for urban neighborhoods as well as smaller towns.
Could the new localism also affect our future politics? Ever greater concentration of power in Washington may now be all the rage as the federal government intervenes, albeit often ineffectively, to revive the economy. But throughout our history, we have always preferred our politics more on the home-cooked side. On his visit to America in the early 1830s, Alexis de Tocqueville was struck by the de-centralized nature of the country. “The intelligence and the power are dispersed abroad,” he wrote, “and instead of radiating from a point, they cross each other in every direction.”
This is much the same today. The majority of Americans still live in a patchwork of smaller towns and cities, including many suburban towns within large metropolitan regions. There are well over 65,000 general-purpose governments, and with so many “small towns,” the average local jurisdiction population in the United States is 6,200, small enough to allow nonprofessional politicians to have a serious impact.
After decades of frantic mobility and homogenization, we are seeing a return to placeness, along with more choices for individuals, families, and communities. For entrepreneurs like Kevin Culhane and his workers at Churchill’s, it’s a phenomenon that may also offer a lease on years of new profits. “We’re holding our own in these times because we appeal to the people around here,” Culhane says. And as places like Long Island become less bedroom community and more round-the-clock locale for work and play, he’s likely to have plenty of hungry customers.
This article originally appeared in Newsweek.
Joel Kotkin is executive editor of NewGeography.com and is a distinguished presidential fellow in urban futures at Chapman University. He is author of The City: A Global History