Blog

  • Bloomberg Endorses “City of Aspiration” Report Recommendations in New Middle Class Plan

    Earlier this year, the Center for an Urban Future published an extensive report about the mounting challenges New York City faces in both retaining its middle class and elevating more low income residents into the ranks of the middle class. One of our key recommendations from that report, titled Reviving the City of Aspiration, was that “city and state officials must embrace community colleges as engines of mobility and dedicate the resources necessary to strengthen these institutions and ensure that a greater number of middle class, poor and working poor New Yorkers can attend these schools and complete their degrees.”

    City officials are now running with our suggestion. Today, Mayor Bloomberg announced a “Gateway to the Middle Class” plan that focuses on boosting community colleges. The mayor’s proposal aims to “move more New Yorkers into the middle class by increasing the number of city residents that graduate from community colleges and training them for higher wage jobs in growing industries.” The plan will invest an additional $50 million over the next four years to improve the system’s quality, accessibility, affordability, and accountability.

    The new attention and resources for community colleges is an important step in the right direction for the city. Our report found that community colleges in New York are overshadowed by virtually every other facet of the education system and have not received the financial support needed to effectively educate students that come from a wide variety of backgrounds and often require academic remediation. Click here to read the section of our report about community colleges, titled “A Platform For Mobility.”

  • California Wastes Its Public Space

    California’s favorable climate makes it a haven for outdoor activity. Enlightened and forward-looking planning has largely preserved the waterfronts for public access and set aside a lot of space for public use and activity. Yet despite this, there are few great urban gathering spaces. This is most obvious in the two largest population centers – Los Angeles and San Francisco.

    As a result, potentially great urban districts are dragged down by a dearth of desirable activity, something exacerbated by an already damaging real estate slump. Although all is not lost in these cities, some of the most high profile public spaces fail to attract large numbers of visitors on a daily basis, particularly when no special events are planned.

    Pershing Square, Los Angeles – Located in the heart of downtown, Pershing Square is poorly designed, both as its own project and in a contextual sense. In an already warm climate made even hotter by its CBD location, there is too much hardscape. Extensive softscape, whether flowers, grass, and/or trees, would provide a cooling effect. There are also too many symbolic structures serving no purpose. These are expensive to install and maintain; they provide very little benefit. Also, an already bad relationship to the street was made worse by restricting access points and hiding the interior space. Although some changes over the past several years have softened the space somewhat, it still lacks some basic creature comforts, such as adequate lighting and clean restrooms, to make it a daily destination for the scores of office workers within easy walking distance.

    County Mall, Los Angeles – County Mall, located west of Los Angeles City Hall between Broadway and Grand Avenue, is in the unenviable position of being relatively unknown. Poor graphics and signage do little to improve its profile. Although there was extensive softscape in the design, many of the original shrubs and flowers have eroded. Further, the large space is not properly organized to allow and encourage different types of activity. Adjacent uses alone are not enough to sustain the park. Unlike in Pershing Square, the design here is not the primary issue. Instead, more programming and better maintenance would make County Mall successful, and provide for a dramatic promenade connecting City Hall and the Los Angeles Music Center.

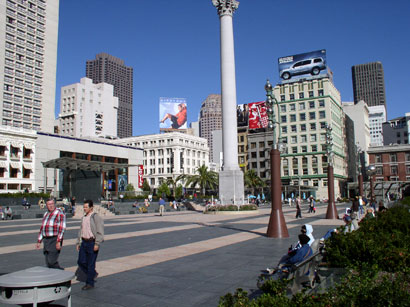
    Union Square, San Francisco – Despite an expensive redesign nearly five years ago, Union Square is still not the central urban gathering space for San Francisco. Although it does serve as an incidental focus of pedestrian activity within the immediate neighborhood, the primarily hardscaped design is too fussy and too formal to encourage casual passive use and extended stays, except, perhaps, within limited zones at the fringes. The little available seating is poorly designed, intended to prevent homeless use rather than to promote use by casual park visitors. Primarily a concrete space with grass at the corners, Union Square lacks the “warmth” that makes such spaces comfortable. Imagine a Union Square with a great lawn in the middle, rather than cold (and expensive) hardscape.

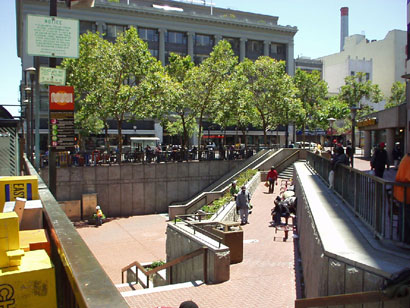
    Market Street, San Francisco – Punctuated by intermittent triangular plazas along most of its downtown stretches, portions of Market Street’s public space are more the domain of homeless panhandlers than workers, residents, strollers, and the like (it should be noted, however, that some parts of Market Street, such as in the Financial District, can be pleasant at times). The plazas, quality architecture, and mix of uses create potential. But the pedestrian environment discourages extended dwell times, except by the homeless, panhandlers and drug dealers, many of whom, the city has documented, commute daily to Market Street from elsewhere in the Bay Area. The design offers little in the way of seating options and softscape. Sanitation and maintenance need to be substantially upgraded and programming is needed.

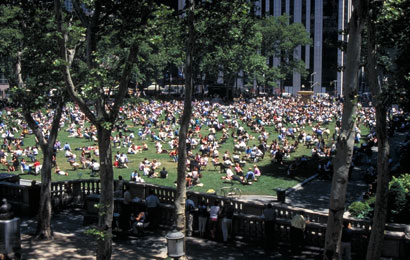
    Proper seating, adequate lighting, and extensive horticultural displays would serve to populate these public spaces. Proper management and maintenance would ensure long-term success. Places such as Bryant Park in Midtown Manhattan, itself the beneficiary of a remarkable turnaround masterminded by Daniel Biederman of the Bryant Park Restoration Corporation, have shown what visionary management can do to struggling urban public spaces. [Kozloff worked for BRV Corp., Biederman’s private consulting company that is independent of the Bryant Park Restoration Corporation, from 2001-2004.] Although once run on a city budget of $200,000, Bryant Park is now managed on a privately-funded budget. Biederman turned Bryant Park – once the domain of drug dealers and other such undesirables – into Manhattan’s premier address without using public coffers.

    Given the warm weather, long growing seasons, and urban renaissance occurring in adjacent portions of Los Angeles and San Francisco, even in the midst of our current downturn, there are opportunities to improve the public realm so that it serves its intended purpose, including boosting civic pride and, in turn, encouraging public stewardship. And, these improvements could be made without costly redesigns and extensive capital construction. Urban environments do not need places that drain public funds and then are shunned by the citizenry; there are enough other issues for urban mayors to deal with. Great cities need comfortable and inviting gathering places that both anchor and bolster civic pride, and simultaneously provide backdrops for special events and day-to-day activity.

    Howard Kozloff is Manager of Development Strategies and Director of Operations at Hart Howerton, an international strategy, planning and design firm based in New York, San Francisco and London. Kozloff is also a lecturer on Urban Real Estate Markets at the University of Pennsylvania.

  • Report: Florida Losing Population

    This should be filed with other improbable stories under the subject “beach running out of sand.” The St. Petersburg Times reports that Florida has lost population for the first time since 1946. University of Florida demographers are due to release a report that the state lost 50,000 residents in the year ended April of 2009. This is in stark contrast with the state’s addition of more than 300,000 residents in every year of the decade through 2006

    The article cites housing price increases as driving out families with children and the resulting housing contraction with driving out construction workers. Florida’s housing bubble related price increases were perhaps the highest in the nation, following California.

    There had already been ominous signs, with the United States Bureau of the Census reporting net outward domestic migration in 2008. As late as 2005, there had been a net gain in domestic migration of 267,000.

  • Mapping Industry Employment Trends by State

    Mark Hovind at Jobbait.com has released another fascinating set of maps and data on industry employment trends by state over the past few months. Here’s a taste:

    The maps below show the employment trends by state and industry sector for the 12 months ending June 2009 (July will be available August 21). Green is growing faster than the workforce. Grey is growing slower. Red is declining. Black is declining more than 8%. White is not available.

    Head over to Jobbait.com for the full analysis.

  • Is the Stage Set for Another Housing Bubble?

    Both the world and the nation remain in the midst of the greatest economic downturn since the Great Depression. But with all the talk of “green shoots” and a recovery housing market, we may in fact be about to witness another devastating bubble.

    As we well know, the Great Recession was set off the by the bursting of the housing bubble in the United States. The results have been devastating. The value of the US housing stock has fallen 9 quarters in a row, which compares to the previous modern record of one (Note). This decline has been a driving force in a 25 percent or a $145,000 average decline (inflation adjusted) in net worth per household in less than two years (Figure 1). The Great Recession has fallen particularly hard on middle-income households, through the erosion of both house prices and pension fund values.

    This is no surprise. The International Monetary Fund has noted that deeper economic downturns occur when they are accompanied by a housing bust. This reality is not going to change quickly.

    How did the supposedly plugged-in economists and traders in the international economic community fail to recognize the housing bubble or its danger to the world economy? It is this failure that led Queen Elizabeth II to ask the London School of Economics (LSE) “why did noboby notice it?”. Eight long months later, the answer came in the form of a letter signed by Tim Besley, a member of the Monetary Policy Committee of the Bank of England (the central bank of the United Kingdom) and Professor Peter Hennessey on behalf of the British Academy.

    The letter indicated that some had noticed what was going on,

    But against those who warned, most were convinced that banks knew what they were doing. They believed that the financial wizards had found new and clever ways of managing risks. Indeed, some claimed to have so dispersed them through an array of novel financial instruments that they had virtually removed them. It is difficult to recall a greater example of wishful thinking combined with hubris.

    The letter concluded noting that the British Academy was hosting seminars to examine the “Never Again” question.

    Among those that noticed were the Bank of International Settlements (the central bank of central banks) in Basle, which raised the potential of an international financial crisis to be set off by a bursting of the US housing bubble. Others, like Alan Greenspan, noticed, telling a Congressional Committee that “there was some froth” in local markets. Others, across the political spectrum, like Nobel Laureate Paul Krugman, Thomas Sowell and former Reserve Bank of New Zealand Governor Donald Brash both noticed and understood.

    Missing the Housing Market Fundamentals: The housing market fundamentals were clear. With more liberal credit, the demand for owned housing increased markedly, virtually everywhere. In all markets of the United Kingdom and Australia, house prices rose so much that the historic relationship with household incomes was shattered. The same was true in some US markets, but not others (Figure 2).

    On average, major housing markets in the United Kingdom experienced median house prices that increased the equivalent of three years of median household income in just 10 years (to 2007). The increases were pervasive; no major market experienced increases less than 2.5 years of income, while in the London area, prices rose by 4 years of household income. In Australia, house prices increased the equivalent of 3.3 years of income. Like the UK, the increases were pervasive. All major markets had increases more than double household incomes.

    Based upon national averages, the inflating bubble appears to have been similar, though a bit more muted in the United States, with an average house price increase equal to 1.5 years of household income. But the United States was a two-speed market, one-half of which experienced significant house price increases and the other half which did not. In the price escalating half, house prices increased an average of 2.4 times incomes. The largest increases occurred in Los Angeles, San Francisco and San Diego, where house prices rose the equivalent of 5 years income. In the other half of the market, house prices remained within or near historic norms relative to incomes. A similar contrast is evident in Canadian markets. In some, house prices reached stratospheric and unprecedented highs, while in others, historic norms were maintained.

    Underlying Demand: Greater Where Prices Rose Less: The difference between the two halves of the market was not underlying demand. Overall, the half of the markets with more stable house prices indicated higher underlying demand than the half with greater price escalation. Overall, the housing markets with higher cost escalation lost more than 2.5 million domestic migrants from 2000 to 2007, while the more stable markets gained more than 1,000,000 (Calculated from US Bureau of the Census data).

    The Difference: Land Use Regulation: The primary reason for the differing house price increases in US markets was land use regulation, points that have been made by Krugman and Sowell. This is consistent with a policy analysis by the Dallas Federal Reserve Bank, which indicated that the higher demand from more liberal credit could either manifest itself either in house price increases or in construction of new housing. Virtually all of the markets with the largest housing bubbles had more restrictive land use regulation.

    These regulations, such as urban growth boundaries, building moratoria and other measures that ration land and raise its price collaborated to make it impossible for such markets to accommodate the increased demand without experiencing huge price increases (these strategies are often referred to as “smart growth”). In the other markets, less restrictive land use regulations allowed building new housing on competitively priced land and kept house prices under control. The resulting price distortions leads to greater speculation, as has been shown by economists Edward Glaeser and Joseph Gyourko.

    A Wheel Disengaged from the Rudder: The normal policy response of interest rate revisions had little potential impact on the price escalating half of the housing market, because of the impact of restrictive state, metropolitan and local housing regulations. These regulations materially prohibited building on perfectly suitable land and thus drove the price up on land where building was permitted. So, while Greenspan and the Fed saw the “froth” in local markets, they missed its cause. The British Academy letter to the Queen is similarly near-sighted. Restrictive land use regulation has left central bankers in a position like a ship’s captain trying to steer a massive vessel with a wheel that is no longer connected to the rudder

    The Bubble Bursts: When teaser mortgage rates expired and other interest rates reset, a flood of foreclosures occurred, which led to house price declines that negated much of the housing bubble price increases in the United States. The most significant of these took place in restrictive markets, especially in California and Florida. By September of 2008, the average house had lost nearly $100,000 of its value in the more restrictively regulated half of the market, and averaged $175,000 in these “ground zero” markets. These losses were unprecedented and far beyond the ability of mortgage holders to sustain. This led to “Meltdown Monday,” when Lehman Brothers collapsed and the Great Recession ensued.

    By comparison, the losses in the more stable half of the market were modest, averaging approximately one-tenth that of the price escalating half.

    Can We Avoid Another Bubble? The experience of the Great Recession underscores the importance of having a Fed and other central banks that not only pay attention, but also understand. This requires “getting their hands dirty” by looking beyond macro-economic aggregates and national averages.

    This does not require an increasing of authority of the Federal Reserve or other central banks. As Donald L. Luskin suggested in The Wall Street Journal, we “don’t want the Fed controlling asset prices.” All we really need is for the Fed and other central banks to notice and understand what is going on, not only in housing, but in other markets as well.

    A public that depends upon central banks to minimize the effect of downturns deserves institutions that are not only paying attention, but also understand what is driving the market. The Fed should use its bully pulpit, both privately and publicly, to warn state and local governments of the peril to which their regulatory policies imperil the economy.

    There are strong indications that future housing bubbles could be in the offing. Not more than a year ago, the state of California enacted even stronger land use legislation (Senate Bill 375), which can only heighten the potential for another California-led housing bust in the years to come, while reducing housing affordability in the short run. There is a strong push by interest groups in Washington to go even further (see the Moving Cooler report), making it nearly impossible for housing to be built on most urban fringe land. This is a prescription for another bubble, this time one that would include the entire country, not just parts of it.


    Note: Quarterly data has been available since 1952 from the Federal Reserve Board Flow of Funds accounts


    Wendell Cox is a Visiting Professor, Conservatoire National des Arts et Metiers, Paris. He was born in Los Angeles and was appointed to three terms on the Los Angeles County Transportation Commission by Mayor Tom Bradley. He is the author of “War on the Dream: How Anti-Sprawl Policy Threatens the Quality of Life.

  • Immigrants Are ‘Greening’ our Cities, How About Giving them a Break?

    Debate about immigration and the more than 38 million foreign born residents who have arrived since 1980 has become something of a national pastime. Although the positive impact of this population on the economy has been questioned in many quarters, self-employment and new labor growth statistics illustrate the increasingly important role immigrants play in our national economy.

    There has also been an intense debate within the environmental community about the impact of immigrants. Yet there has been relatively little research done about how immigrants get to work and where most immigrants live. As the ‘green’ movement in the U.S. has increasingly pushed for higher-density housing and transit-oriented development in order to improve public transportation (specifically rail), few have considered how immigrants use transit and what might be the best way to accommodate their needs. In fact, all too often, “green” policies advocate transit choices – favoring such things as light rail over buses – that may work against the interests of immigrant transit riders.

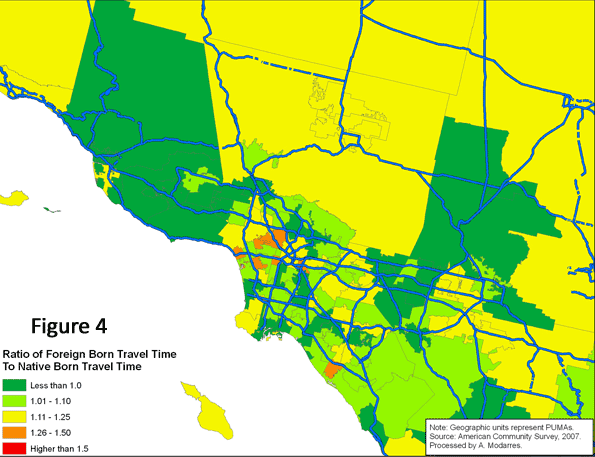
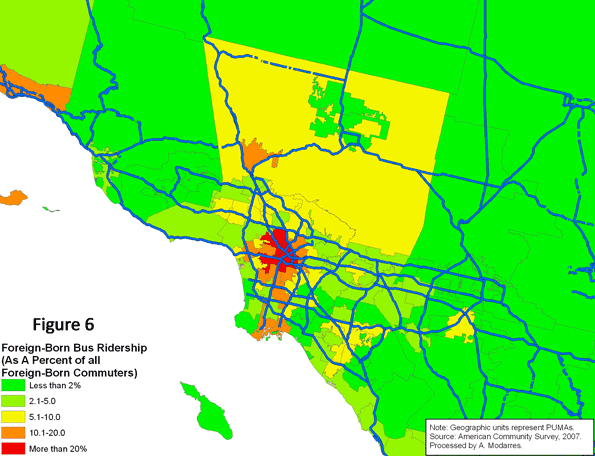
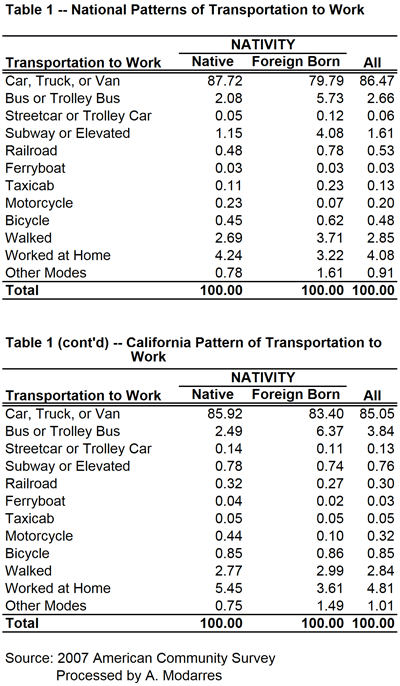
    Based on the 2007 American Community Survey, 117.3 million native-born and 21.9 million foreign-born individuals commuted to work. As Table (1) illustrates, a higher percentage of immigrants rode buses (5.7% vs. 2.1%) and subways (4.1% vs. 1.2%) and many walked to work (3.7% vs. 2.7%). A much smaller percentage drove to work (79.8% vs. 87.7%). Unfortunately, despite their higher usage of alternate means of transportation to work, or perhaps because of it, the commute to work time was on average longer for the foreign-born commuters than their native-born counterparts (28.8 minutes versus 24.7).

    Clearly in terms of using public transportation, immigrants are a bit greener than those born here. But why? Is this habit formed elsewhere? In that case, are recent immigrants even more likely to use public transportation than those who immigrated earlier? Or is it their income that affects their transportation choices?

    Table (2) provides the answer to the first question. Recent arrivals are clearly less likely to drive to work and have a higher propensity toward using public transportation, compared to all foreign-born individuals (and significantly more than the native-born). Additionally, over 6% of the immigrants who have arrived since 2000 walk to work.

    Overall, more than a quarter of the immigrants who have arrived since 2000 use an alternative mode of transportation to work. If the rest of America could do the same, we’d be a bit ‘greener’ already. However, it seems that as immigrants stay longer, they eventually tend to use cars more often because automobile usage allows for access to better jobs, better shops, and better schools. For example, immigrants who arrived in the U.S. in the 1970s (which means they have been here over three decades) drive a bit more and use public transportation less.

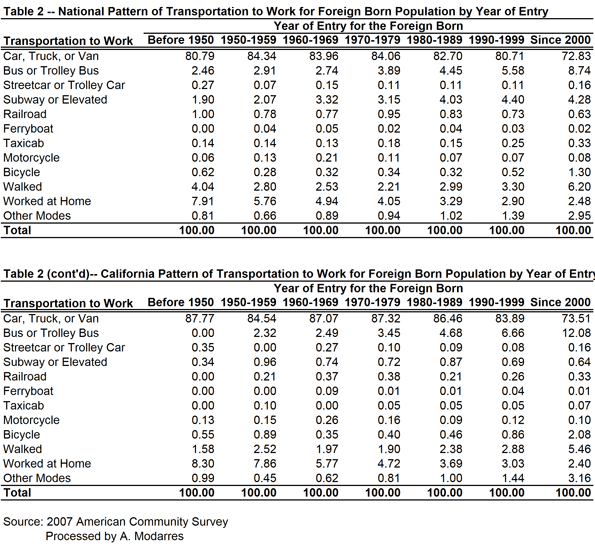
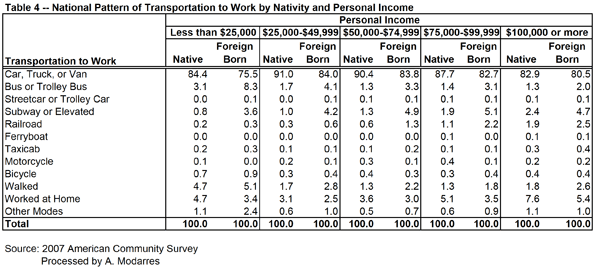
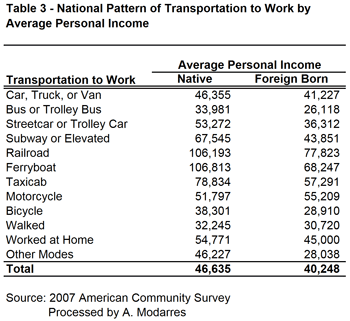
    Even so, their rates are still slightly better than the native-born (compare Tables 1 and 2). This may be in part because of their lower incomes (see Table 3) yet at every level of income they are still more likely to take transit. Table (4) illustrates this point by grouping commuters into income categories and their nativity. In every income category, immigrants use their cars less and are more likely to use public transportation, even though their car ridership increases with income.

    The message from these statistics is loud and clear. Immigrants are more likely to ride public transportation than those born in the U.S., regardless of their income. The ones arriving more recently are even more likely to do so. Overall, this suggests that familiarity with public transportation, combined with the effects of income and place of residence, has made the immigrants’ lives in the U.S. a bit ‘greener’ than those of the native-born. In fact, one factor that may contribute to their higher usage of public transportation stems from their living in neighborhoods whose densities are, on average, 2.5 times higher than those of the native-born. Immigrants, in essence, are doing precisely what planners want the rest of us to do.

    Moving to Southern California

    Southern California still stands as the icon of immigration and multiculturalism and is home to a large number of immigrants in the urban region that extends from eastern Ventura County to the southern tip of Orange County and the Inland Empire. As Figure (1) illustrates, in a number of neighborhoods in Southern California, the foreign-born population outnumbers the native-born by large margins. For example, in areas west and south of downtown Los Angeles, immigrants are more than three times as numerous as the native-born.

    A comparison of Figures (2) and (3) suggests a wide geographic difference between the native-born and the foreign-born and how long it takes them to get to work. The foreign-born population experiences much longer commutes in highly urbanized areas around downtown Los Angeles and the San Gabriel Valley. Conversely, in the more rural areas, such as northern Ventura County, the foreign-born population experiences shorter commutes compared to their native-born counterparts.

    Figure (4) provides a clear comparison of average travel time to work for both populations (visually comparing Figures 2 and 3). In all areas appearing in the darkest shade of green, the foreign-born population experienced shorter commutes compared to the native-born. These shorter commutes, however rarely occur in high density areas (compare with Figure 5). Conversely, in areas such as Santa Monica, the Wilshire corridor, East Los Angeles, and southern sections of downtown Los Angeles, the foreign-born population experiences much longer commutes than the native-born.


    Statistically speaking, there is a positive relationship between average travel time and density – i.e., the higher the density, the higher the reported average travel time. For the foreign-born population who live in higher density areas, this means much longer commutes, a problem caused by a number of factors, including their dependency on slower public transportation systems and the long distances they have to travel to reach job centers outside the city center.

    Figure (6) illustrates the geographic pattern of bus ridership among the foreign-born commuters. As with national patterns, immigrants in Southern California are more likely to settle in high density areas and use public transportation to work, but unfortunately, they also suffer much longer commutes.

    What should the policy responses be? One may be to promote increased car ownership among immigrants and low-income populations in the U.S. This may be objectionable to some environmentalists and planners, but it’s clear that those people who live by the principles of higher density and public transportation use are not rewarded and indeed suffer longer commutes.

    An even more relevant question is why advocates for public transportation focus disproportionately on rail, when buses are so frequently used by low income populations, including immigrants. In California, these riders outnumber the native-born on buses. The situation is reversed on rail and subways. An intelligent policy response to public transportation planning would suggest that buses should receive much more attention. Major metropolitan areas have become polycentric in their employment patterns, and most major employment centers are located at long distances from the central city. Specially-designed buses for reverse commutes could help alleviate transportation problems while helping working immigrants reach their destinations more quickly.

    This challenges the priorities of some public transport advocates, who tend to focus on very expensive rail projects designed primarily to draw more middle class, largely native-born riders who commute to places like downtown Los Angeles. Meanwhile those ‘new’ Americans who already live by a number of ‘green’ standards suffer from the misallocation of transit resources. Those who are already doing what we hope the middle class will do deserve better.

    Ali Modarres is an urban geographer in Los Angeles and co-author of City and Environment.

  • Why The ‘Livable Cities’ Rankings Are Wrong

    Few topics stir more controversy between urbanists and civic boosters than city rankings. What truly makes a city “great,” or even “livable”? The answers, and how these surveys determine them, are often subjective, narrow or even misguided. What makes a “great” city on one list can serve as a detriment on another.

    Recent rankings of the “best” cities around the world by the Economist Intelligence Unit, Monocle magazine and the Mercer quality of life surveys settled on a remarkably similar list. For the most part, the top ranks are dominated by well-manicured older European cities such as Zurich, Geneva, Vienna, Copenhagen, Helsinki and Munich, as well as New World metropolises like Vancouver and Toronto; Auckland, New Zealand; and Perth and Melbourne in Australia.

    Only Monocle put a truly cosmopolitan world city – Tokyo – near the top of its list. The Economist rankings largely snubbed American cities – only Pittsburgh made it anywhere near the top, at No. 29 out of 140. The best we can say is most American cities did better than Harare, Zimbabwe, which ran at the bottom. Honolulu got a decent No. 11 on the Monocle list and broke into the top 30 on Mercer’s, as did No. 29 San Francisco. But regarding American urban boosters, that’s all, folks.

    To understand these rather head-scratching results, one must look at the criteria these surveys used. Cultural institutions, public safety, mass transit, “green” policies and other measures of what is called “livability” were weighted heavily, so results skewed heavily toward compact cities in fairly prosperous regions. Most of these regions suffer only a limited underclass and support a relatively small population of children. In fact, most of the cities are in countries with low birthrates – Switzerland’s median fertility rate, for example, is about 1.4, one of the lowest on the planet and a full 50% below that of the U.S.

    These places make ideal locales for groups like traveling corporate executives, academics and researchers targeted by such surveys. With their often lovely facades, ample parks and good infrastructure, they constitute, for the most part, a list of what Wharton’s Joe Gyourko calls “productive resorts,” a sort of business-oriented version of an Aspen or Vail in Colorado or Palm Beach, Fla. Honolulu is an exception, more a vacation destination than a bustling business hub.

    Yet are those the best standards for judging a city? It seems to me what makes for great cities in history are not measurements of safety, sanitation or homogeneity but economic growth, cultural diversity and social dynamism. A great city, as Rene Descartes wrote of 17th century Amsterdam, should be “an inventory of the possible,” a place of imagination that attracts ambitious migrants, families and entrepreneurs.

    Such places are aspirational – they draw people not for a restful visit or elegant repast but to achieve some sort of upward mobility. By nature these places are chaotic and often difficult to navigate. Ambitious people tend to be pushy and competitive. Just think about the great cities of history – ancient Rome, Islamic Baghdad, 19th century London, 20th century New York – or contemporary Los Angeles, Houston, Shanghai and Mumbai.

    These represent a far different urbanism than what one finds in well-organized and groomed Zurich, Vienna and Copenhagen. You would not call these cities and their ilk with metropolitan populations generally less than 2 million, “bustling.” Perhaps a more fitting words would be “staid” and “controlled.”

    Peace and quiet is very nice, but it doesn’t really encourage global culture or commerce. Growth and change come about when newcomers jostle with locals not just as tourists, or orbiting executives, but as migrants. Great cities in their peaks are all about this kind of yeasty confrontation.

    Alas, comfort takes precedence over dynamism in these new cities. Take the immigration issue: Unlike Amsterdam in its heyday or London or New York today, most northern European countries have turned hostile to immigration and many have powerful nativist parties. These are directed not against elite corporate executives or academics, but newcomers from developing countries. In some cases, resentment is stoked by immigrants taking advantage of well-developed welfare systems that worked far better in a homogeneous country with shared attitudes of social rights and obligations.

    Of course, these cities aren’t total deadweights. After all, Switzerland has its banks, Helsinki boasts Nokia and Denmark remains a key center of advanced and green manufacturing technology. For its part, Vancouver gets Americans to shoot cheap movie and TV shows with massive tax breaks and will host the Winter Olympics. But none can be considered major shapers of the modern world economy.

    The one American city favored by The Economist, Pittsburgh, represents a pale – and less attractive – version of these top-ranked European, Canadian or Australian cities. Its formerly impressive array of headquarters has shrunk to a handful. Once the capital of steel, it now pretty much depends on nonprofits, hospitals and universities.

    You will be hearing a lot more about Pittsburgh – the city has a prodigious PR machine funded largely by nonprofit foundations and universities – as it gets ready to host the G-20 meeting next month. Fans claim that the former steel town has developed a stable – if hardly dynamic – economy. Its torpidity is being sold a strength; boom-resistant in the best of times, it’s also proved relatively recession-proof as well.

    In this sense, Pittsburgh represents the American model of the slow-growth European city. This may appeal to those doing quality-of-life rankings, but not to those who have been fleeing the Steel City for other places for generations. Immigrants are hardly coming in droves either – Pittsburgh ranks near last among major metropolitan areas in percentage of foreign-born residents. As longtime local columnist and resident Bill Steigerwald notes, since 1990 more Pittsburghers have been dying than being born. If this represents America’s urban future, perhaps it’s one that takes its inspiration from Alan Weisman’s “A world without us.”

    Yet the future of urbanism, here and abroad, will not be Pittsburgh. Based on current preferences, something like 20 million – or more – people will have moved to U.S. cities by 2050. Most will likely settle in more dynamic places like New York, Los Angeles, Houston, Phoenix, Dallas, Chicago and Miami. These cities have become magnets for restless populations, both domestic and foreign-born. They also contain all the clutter, constant change, discomfort and even grime that characterize great cities through history.

    But it’s economics that drives migrants to these dirtier, busier metropolitan centers. Many of the cities at the top of the livability lists, by contrast, are also among the world’s most expensive. They generally also have high taxes and relatively stagnant job markets.

    Many U.S. cities, however, offer far more materially to their average residents than their elite European counterparts do. American cities, when assessed by purchasing-power parity, notes demographer Wendell Cox, do very well indeed. Viewed this way, the U.S. boasts eight of the top 10 – and 37 of the top 50 – metropolitan regions in terms of per capita income.

    The top city on Cox’s list, San Jose, Calif., epitomizes both the strengths and weaknesses of the American city. The heartland of Silicon Valley, the San Jose region has generated one of the world’s most innovative – and well-paid – economies. On the other hand, its mass transit usage is minuscule, its cultural attributes measly and its downtown hardly a tourist destination.

    Meanwhile, pricey and scenic Zurich, No. 2 on the Mercer list and No. 10 on The Economist rankings, comes in 74th when considering adjusted per capita income. Economist favorite Vancouver, one of the most expensive second-tier cities on the planet, ranks 71st. For the average person seeking to make money and improve his or her economic status, it usually pays not to settle in one of the world’s “most livable” cities.

    This is not to say that rambunctious urban centers like Los Angeles, New York or London couldn’t learn from their more “livable” counterparts. Anyone who has braved the maddening crowds in Venice Beach, Times Square or London’s Piccadily knows a city can have too much of a good thing. Los Angeles could use a more efficient bus system. Better-maintained subways and commuter trains in New York would be welcome by millions as they would in Greater London.

    Ultimately great cities remain, almost by necessity, raw (and at times unpleasant) places. They are filled with the sights and smells of diverse cultures, elbowing streetwise entrepreneurs and the inevitable mafiosi. They all suffer the social tensions that come with rapid change and massive migration. New York, Los Angeles, London, Shanghai, Mumbai or Dubai may not shoot to the top of more elite, refined rankings, but they contain the most likely blueprint of our urban future.

    This article originally appeared at Forbes.

    Joel Kotkin is executive editor of NewGeography.com and is a presidential fellow in urban futures at Chapman University. He is author of The City: A Global History. His next book, The Next Hundred Million: America in 2050, will be published by Penguin early next year.

  • Can Obama be deprogrammed?

    In my first foray into political life in the 1970s, I worked during college on the staff of a liberal Democrat in the Texas state Senate. Only a few years earlier, Patty Hearst had been kidnapped and brainwashed by the Symbionese Liberation Army, and a moral panic about cults seducing college kids was sweeping the nation. One result was the rise of a new, thankfully ephemeral profession: “deprogrammers” who for pay would kidnap a young person from a cult and break the spell, by means of isolation, interrogation and maybe reruns of “The Waltons.”

    A reactionary Republican state senator from the Houston area, who was heartily despised by my senator, introduced a bill granting parents the right to hire deprogrammers to kidnap adult children who belonged to what the parents regarded as cults and then confine them in motels for several weeks, subject to psychological coercion, without notifying the authorities. Needless to say, this deprogramming law was the greatest threat to the tradition of habeas corpus until another reactionary Texan was installed in the White House in 2001. The bill was laughed to death, when, during a hearing, the sponsor was asked if it could be used to deprogram young people who had joined a certain well-known cult. “Why, yes, Senator,” the Republican replied, “it would apply to cults like the Unitarians.”

    Boy, do we need deprogrammers now, to liberate Barack Obama from the cult of neoliberalism.

    By neoliberalism I mean the ideology that replaced New Deal liberalism as the dominant force in the Democratic Party between the Carter and Clinton presidencies. In the Clinton years, this was called the “Third Way.” The term was misleading, because New Deal liberalism between 1932 and 1968 and its equivalents in social democratic Europe were considered the original “third way” between democratic socialism and libertarian capitalism, whose failure had caused the Depression. According to New Deal liberals, the United States was not a “capitalist society” or a “market democracy” but rather a democratic republic with a “mixed economy,” in which the state provided both social insurance and infrastructure like electric grids, hydropower and highways, while the private sector engaged in mass production.

    When it came to the private sector, the New Dealers, with some exceptions, approved of Big Business, Big Unions and Big Government, which formed the system of checks and balances that John Kenneth Galbraith called “countervailing power.” But most New Dealers dreaded and distrusted bankers. They thought that finance should be strictly regulated and subordinated to the real economy of factories and home ownership. They were economic internationalists because they wanted to open foreign markets to U.S. factory products, not because they hoped that the Asian masses some day would pay high overdraft fees to U.S. multinational banks.

    New Dealers approved of social insurance systems like Social Security and Medicare, which were rights (entitlements) not charity and which mostly redistributed income within the middle class, from workers to nonworkers (the retired and the temporarily unemployed). But contrary to conservative propaganda, New Deal liberals disliked means-tested antipoverty programs and despised what Franklin Roosevelt called “the dole.” Roosevelt and his most important protégé, Lyndon Johnson, preferred workfare to welfare. They preferred a high-wage, low-welfare society to a low-wage, high-welfare society. To maintain the high-wage system that would minimize welfare payments to able-bodied adults, New Deal liberals did not hesitate to regulate the labor market, by means of pro-union legislation, a high minimum wage, and low levels of immigration (which were raised only at the end of the New Deal period, beginning in 1965). It was only in the 1960s that Democrats became identified with redistributionist welfarism — and then only because of the influence of the New Left, which denounced the New Deal as “corporate liberalism.”

    Between the 1940s and the 1970s, the New Deal system — large-scale public investment and R&D, regulated monopolies and oligopolies, the subordination of banking to productive industry, high wages and universal social insurance — created the world’s first mass middle class. The system was far from perfect. Southern segregationist Democrats crippled many of its progressive features and the industrial unions were afflicted by complacency and corruption. But for all its flaws, the New Deal era is still remembered as the Golden Age of the American economy.

    And then America went downhill.

    The “stagflation” of the 1970s had multiple sources, including the oil price shock following the Arab oil embargo in 1973 and the revival of German and Japanese industrial competition (China was still recovering from the damage done by Mao). During the previous generation, libertarian conservatives like Milton Friedman had been marginalized. But in the 1970s they gained a wider audience, blaming the New Deal model and claiming that the answer to every question (before the question was even asked) was “the market.”

    The free-market fundamentalists found an audience among Democrats as well as Republicans. A growing number of Democratic economists and economic policymakers were attracted to the revival of free-market economics, among them Obama’s chief economic advisor Larry Summers, a professed admirer of Milton Friedman. These center-right Democrats agreed with the libertarians that the New Deal approach to the economy had been too interventionist. At the same time, they thought that government had a role in providing a safety net. The result was what came to be called “neoliberalism” in the 1980s and 1990s — a synthesis of conservative free-market economics with “progressive” welfare-state redistribution for the losers. Its institutional base was the Democratic Leadership Council, headed by Bill Clinton and Al Gore, and the affiliated Progressive Policy Institute.

    Beginning in the Carter years, the Democrats later called neoliberals supported the deregulation of infrastructure industries that the New Deal had regulated, like airlines, trucking and electricity, a sector in which deregulation resulted in California blackouts and the Enron scandal. Neoliberals teamed up with conservatives to persuade Bill Clinton to go along with the Republican Congress’s dismantling of New Deal-era financial regulations, a move that contributed to the cancerous growth of Wall Street and the resulting global economic collapse. As Asian mercantilist nations like Japan and then China rigged their domestic markets while enjoying free access to the U.S. market, neoliberal Democrats either turned a blind eye to the foreign mercantilist assault on American manufacturing or claimed that it marked the beneficial transition from an industrial economy to a “knowledge economy.” While Congress allowed inflation to slash the minimum wage and while corporations smashed unions, neoliberals chattered about sending everybody to college so they could work in the high-wage “knowledge jobs” of the future. Finally, many (not all) neoliberals agreed with conservatives that entitlements like Social Security were too expensive, and that it was more efficient to cut benefits for the middle class in order to expand benefits for the very poor.

    The transition from New Deal liberalism to neoliberalism began with Carter, but it was not complete until the Clinton years. Clinton, like Carter, ran as a populist and was elected on the basis of his New Deal-ish “Putting People First” program, which emphasized public investment and a tough policy toward Japanese industrial mercantilism. But early in the first term, the Clinton administration was captured by neoliberals, of whom the most important was Treasury Secretary Robert Rubin. Under Rubin’s influence, Clinton sacrificed public investment to the misguided goal of balancing the budget, a dubious accomplishment made possible only by the short-lived tech bubble. And Rubin helped to wreck American manufacturing, by pursuing a strong dollar policy that helped Wall Street but hurt American exporters and encouraged American companies to transfer production for the U.S. domestic market to China and other Asian countries that deliberately undervalued their currencies to help their exports.

    By the time Barack Obama was inaugurated, the neoliberal capture of the presidential branch of the Democratic Party was complete. Instead of presiding over an administration with diverse economic views, Obama froze out progressives, except for Jared Bernstein in the vice-president’s office, and surrounded himself with neoliberal protégés of Robert Rubin like Larry Summers and Tim Geithner. The fact that Robert Rubin’s son James helped select Obama’s economic team may not be irrelevant.

    Instead of the updated Rooseveltonomics that America needs, Obama’s team offers warmed-over Rubinomics from the 1990s. Consider the priorities of the Obama administration: the environment, healthcare and education. Why these priorities, as opposed to others, like employment, high wages and manufacturing? The answer is that these three goals co-opt the activist left while fitting neatly into a neoliberal narrative that could as easily have been told in 1999 as in 2009. The story is this: New Dealers and Keynesians are wrong to think that industrial capitalism is permanently and inherently prone to self-destruction, if left to itself. Except in hundred-year disasters, the market economy is basically sound and self-correcting. Government can, however, help the market indirectly, by providing these three public goods, which, thanks to “market failures,” the private sector will not provide.

    Healthcare? New Deal liberals favored a single-payer system like Social Security and Medicare. Obama, however, says that single payer is out of the question because the U.S. is not Canada. (Evidently the New Deal America of FDR and LBJ was too “Canadian.”) The goal is not to provide universal healthcare, rather it is to provide universal health insurance, by means that, even if they include a shriveled “public option,” don’t upset the bloated American private health insurance industry.

    Education? In the 1990s, the conventional wisdom of the neoliberal Democrats held that the “jobs of the future” were “knowledge jobs.” America’s workers would sit in offices with diplomas on the wall and design new products that would be made in third-world sweatshops. We could cede the brawn work and keep the brain work. Since then, we’ve learned that brain work follows brawn work overseas. R&D, finance and insurance jobs tend to follow the factories to Asia.

    Education is also used by neoliberals to explain stagnant wages in the U.S. By claiming that American workers are insufficiently educated for the “knowledge economy,” neoliberal Democrats divert attention from the real reasons for stagnant and declining wages — the offshoring of manufacturing, the decline of labor unions, and, at the bottom of the labor market, a declining minimum wage and mass unskilled immigration. One study after another since the 1990s has refuted the theory that wage inequality results from skill-biased technical change. But the neoliberal cultists around Obama who write his economic speeches either don’t know or don’t care. Like Bill Clinton before him, Barack Obama continues to tell Americans that to get higher wages they need to go to college and improve their skills, as though there weren’t a surplus of underemployed college grads already.

    Environment? Here the differences between the New Deal Democrats and the Obama Democrats could not be wider. Their pro-industrial program did not prevent New Deal Democrats from being passionate about resource conservation and wilderness preservation. They did not hesitate to use regulations to shut down pollution. And their approach to energy was based on direct government R&D (the Manhattan Project) and direct public deployment (the TVA).

    Contrast the straightforward New Deal approaches with the energy and environment policies of Obama and the Democratic leadership, which are at once too conservative and too radical. They are too conservative, because cap and trade relies on a system of market incentives that are not only indirect and feeble but likely to create a subprime market in carbon, enriching a few green profiteers. At the same time, they are too radical, because any serious attempt to shift the U.S. economy in a green direction by hiking the costs of non-renewable energy would accelerate the transfer of U.S. industry to Asia — and with it not only industry-related “knowledge jobs” but also the manufacture of those overhyped icons of the “green economy,” solar panels and windmills.

    While we can’t go back to the New Deal of the mid-20th century in its details, we need to re-create its spirit. But short of confining them in motel rooms and making them watch newsreels about the Hoover Dam, Glass-Steagall, the TVA and the Manhattan Project, is it possible to liberate President Obama and the Democratic leadership from the cult of neoliberalism?

    This article first appeared at Salon.com

    Michael Lind is Whitehead Senior Fellow at the New America Foundation and Director of the American Infrastructure Initiative.

    Official White House Photo by Pete Souza.

  • Origins and Growth of Al Capone’s Outfit: Chicago’s First Ward Democratic Organization and its Aftermath

    Barack Obama ran for President with his headquarters in downtown Chicago. Obama’s election night victory speech was just blocks away in Chicago’s Grant Park. To historians of organized crime both locations are located in a significant place: Chicago’s old First Ward. This valuable plot of land is where Chicago’s Democratic Machine and Al Capone’s criminal organization both began. The connection between the two is of great historical significance. Why? Because the Chicago Mob is nothing but an outgrowth of Chicago’s old First Ward Democratic Organization.

    The First Ward contained not only the big office buildings of downtown Chicago but also the near south side which contained the Levee (which was America’s premier vice district for prostitution and gambling) in the early part of the twentieth century. Crime researcher Ovid Demaris explains the origins of the First Ward in the first decade of the Twentieth Century:

    The chain of command on the levee started at the top with committeeman Michael “Hinky Dink” Kenna and Alderman Bathouse John Coughlin, bosses of the First Ward, the wealthiest plot of real estate (it contains the Loop) in the Midwest. Their bagman was Ike Bloom, a ward heeler and proprietor of a busy dance hall. The next in command was Big Jim Colosimo, an Italian pimp and restaurateur, who started out as a street cleaner. When he married a madam with a pair of dollar houses, Hinky Dink made him a precinct captain in charge of getting out the Italian vote.

    By 1912, Jim Colosimo owned 200 brothels, many located in the First Ward. Colosimo is considered by the FBI to be the first head of the Chicago Mob. His base – organizing street sweepers – presaged the powerful role of public unions in Chicago nearly a century later.

    Another important First Ward Democratic precinct captain with connections to Kenna and Coughlin was Harry Guzik. Guzik, like Colosimo, was a pimp who passed his political connections on to his son, Jake. Jake Guzik, also a pimp, became the Chicago Mob’s accountant until his death in 1956. Guzik (note 1) was considered the number two man in the Chicago Mob and the financial brains behind the operation until his death in 1956.

    In 1909, Colosimo reached out for help in running his expanding empire. New York street gang leader John Torrio came to Chicago to help manage Colosimo’s empire from Colosimo’s Cafe at 2126 South Wabash Avenue at the south end of the First Ward.

    In 1919, on the eve of Prohibition, Torrio wanted the operation to expand into bootlegging. Colosimo was content with the money he was making from the existing rackets. So, Torrio had Colosimo executed. Before Colosimo was executed, Torrio had brought to Chicago a street thug he mentored in New York: Al Capone. With Colosimo, out of the way, Torrio moved the operation headquarters a few blocks away to the 2222 S. Wabash. Capone acted as the underboss of the operation.

    Torrio and Capone no longer needed to take orders from Kenna and Coughlin of the First Ward. Over time, as the Chicago Mob became wealthy, they began to tell Kenna and Coughlin how to operate. Jake Guzik became the de facto political boss of the First Ward issuing orders to Kenna and Coughlin.

    By 1925, Torrio stepped down as boss after an assassination attempt and left Chicago. Al Capone took over. The mob extended its political influence into other Chicago wards, to the surrounding suburbs of Chicago and even downstate.

    Capone’s reign only lasted until 1932, but his legacy and organization were just beginning. Robert Cooley and Hillel Levin in their monumental book When Corruption Was King explain:

    Oddly enough, far less is known about his successors and their grip on the city during the last half of the twentieth century. But that is when Chicago’s Mafia became the single most powerful organized crime family in American history. While Mob bosses knocked each other off on the East Coast, in Chicago they united into a monolithic force called the Outfit…By the Seventies, the FBI reported that Chicago’s Mob controlled all organized criminal activity west of the Mississippi – including and especially Las Vegas. Millions were skimmed from casinos like the Tropicana and the Stardust, and bundles of cash, stuffed in green army duffel bags, found their way back to the Outfit’s bosses.

    By the 1950s, the Chicago Mob realized it would be more efficient to send one of their own “made members” to City Council (Note 2). John D’Arco was a high ranking made member elected to City Council in 1951. D’Arco also became the First Ward Democratic Committeman, the boss of the precinct captains. He got caught by the FBI meeting with Sam Gianciana near Chicago’s O’Hare Airport, in 1962, and stepped down from City Council but kept his ward committeemanship until the 1990s. He was a regular visitor to Mayor Jane Byrne’s office in the late 1970s and early 1980s.

    In 1968, the Chicago Mob sent Fred Roti, one of their most effective high ranking made members, to the City Council. Roti grew up in the First Ward just blocks away from Capone headquarters. He was a precinct captain for John D’ Arco. Roti’s success on City Council surpassed John D’Arco. By 1982, the Chicago Tribune reported that Roti was Chicago’s most powerful City Council member:

    Roti’s name is always called first during council roll calls, and he revels in that privilege. His initial response gives other administration aldermen their cue as to what Roti – and, therefore, the mayor – wants. It’s often said that roll calls could stop after Roti votes – the outcome is already known. Roti, an affable fellow, controls the Chicago City Council with an iron fist.

    According to the Justice Department, Roti was an important co-conspirator in turning a large segment of Chicago’s organized labor movement into a racketeering enterprise.

    In the 1980s, criminal defense lawyer Robert Cooley wore a wire on Alderman Roti and his boss Pat Marcy. Cooley became the star witness in a series of sensational trials from an investigation titled Operation Gambat. Roti was indicted in 1990 and “was convicted of RICO conspiracy, bribery and extortion regarding the fixing of criminal cases in the Circuit Court of Cook County, including murder cases involving organized crime members or associates, and was sentenced to 48 months’ imprisonment.” John D’Arco’s son was also indicted and convicted of taking bribes. John D’Arco Jr. was the Chicago Mob’s man in Springfield, rising to the position of Assistant Majority Leader of the Illinois Senate.

    The Chicago Mob was never the same. Without Roti and Marcy, the judges could no longer be bribed into allowing the mob hitmen back on the street. The regular killings, to get people in line, stopped. The First Ward got mapped out of existence in the early 1990s. Senior FBI agent William Roemer explained the devastation to the Chicago Mob by Robert Cooley’s “Operation Gambat”:

    As a result of Gambat, Tony Accardo’s people were deeply wounded. For decades Pat Marcy and John D’Arco, Sr., has been to Accardo what Hinky Dink and Bathhouse John were to Colosimo, Capone, and Nitti. Since 1950 – some forty years – John D’ Arco had been there. They were themselves a great one-two punch for Accardo and for Greasy Thumb…

    So, the Chicago Mob has been in retreat. But, it still exists and has great access to power.

    In 1999, at Fred Roti’s funeral, his best friend on City Council Alderman Bernard Stone spoke. Alderman Stone, set the record straight in case there was any illusion of how important Fred Roti was in the history of Chicago:

    “Our skyline should say ‘Roti’ on it,” Stone said at the funeral. “If not for Fred Roti, half the buildings in the Loop would never have been built.”

    At the time of his indictment in 1990, Roti was Chairman of the City Council Buildings Committee. This is the key committee in Chicago that determines the height of buildings.

    After Fred Roti’s funeral, his body was laid to rest at the Mount Carmel Cemetery in the Chicago suburb of Hillside. Roti was buried in Section 34 of the Cemetery. Just a short walk from Roti’s casket in Section 35 of the Cemetery is Al Capone’s grave.

    The man who brought down the First Ward, FBI informant Robert Cooley, is back in the news. Days after Governor Rod Blagojevich was arrested, WLS TV reported that according to Cooley, Blagojevich was bookmaker for the Chicago Mob. WLS TV did a follow up report in which a former senior FBI agent confirmed that Cooley made bookmaking allegations about Blagovich in the 1980s. This isn’t the only mob tie concerning Blagojevich. His wife is related to the recently deceased Chicago Mob Consiglerie Alphonse Tornabene.

    Lurking in the background of the Blagojevich criminal case is a casino license that was to be auctioned off. The license was by far the most valuable asset Blagojevich had control over. Blagojevich wanted the casino built in the Chicago Mob dominated suburb of Rosemont. The Chicago Mob also wanted the casino built there. In November of 2005, Blagojevich brought in Eric Holder to give Rosemont a clean bill of health. Holder and Blagojevich had a news conference outside the Thompson Building, which is in the old First Ward.

    The mob connection extends beyond the Blagojevich case. In their drive to retain President Obama’s U.S. Senate seat, the frontrunner is Obama’s friend, Alexi Giannoulis. He is so tainted by Chicago Mob allegations that Illinois Democratic Party Chairman Mike Madigan refused to endorse him in a past race for State Treasurer.

    As the Senate race heats up, these connections between the Chicago machine and the mob could prove embarrassing at least for the man the machine has helped elevate to the White House.


    Note 1: Jake “Greasy Thumb” Guzik earned his nickname from counting stacks of money and bribing public officials.

    Note 2: In preparation for this article, a former FBI agent identified John D’ Arco Sr. as a high ranking made member of the Chicago Mob. His status was at the level of a capo in which he was allowed to run a political crew.

    Steve Bartin is a resident of Cook County and native who blogs regularly about urban affairs at http://nalert.blogspot.com. He works in Internet sales.