Blog

  • Tracking Business Services: Best And Worst Cities For High-Paying Jobs

    Media coverage of America’s best jobs usually focuses on blue-collar sectors, like manufacturing, or elite ones, such as finance or technology. But if you’re seeking high-wage employment, your best bet lies in the massive “business and professional services” sector.

    This unsung division of the economy is basically a mirror of any and all productive industry. It includes everything from human resources and administration to technical and scientific positions, as well as accounting, legal and architectural firms.

    Overall there are roughly 17 million professional and business services jobs, 4 million more than manufacturing. This makes it twice as big as the finance sector and five times the size of the much-ballyhooed tech sector. While its average salary – roughly $55,000 a year – is somewhat lower than in those other elite sectors, its wages are still higher than those in all the other large sectors, like health. The sector’s $1 trillion in total pay per year accounts for nearly 20% of all wages paid in the nation; finance and tech together only account for $812 billion.

    More than that, the business and professional services sector has encompassed the fastest-growing part of the high-wage economy. Employment in lower-wage sectors like education has also grown quickly. But employment in other sectors that pay their employees well, such as technology, has remained stagnant; jobs in some, such as manufacturing, have fallen sharply. Critically, the business services sector – particularly at the better-paying end – seems to have weathered the current recession better than these other high-wage sectors.

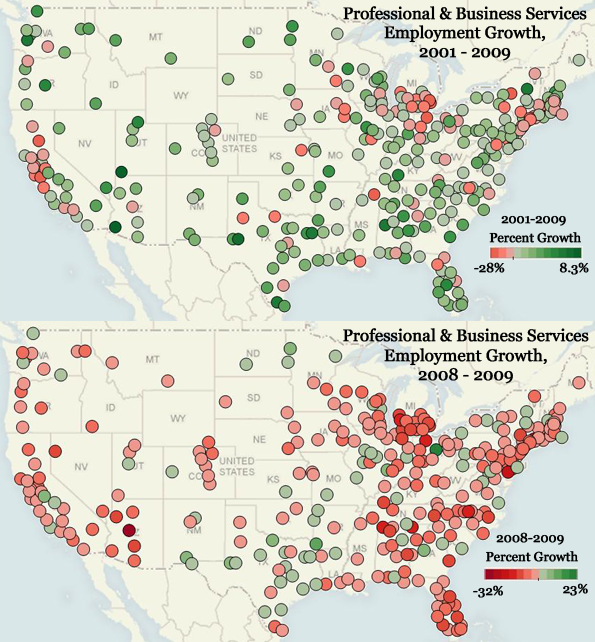
    The crucial question remains: In what regions is this critical economic cog booming? In a new analysis with my colleagues at the Praxis Strategy Group, we examined Bureau of Labor Statistics employment data for this sector, keeping an eye on trends over both the last year and the last decade. Some of the metropolitan areas that boasted short-term growth in this sector also maintained steady employment success over the long-term, which suggests that these particular cities have sturdy economies that aren’t as prone to intense boom-bust cycles.

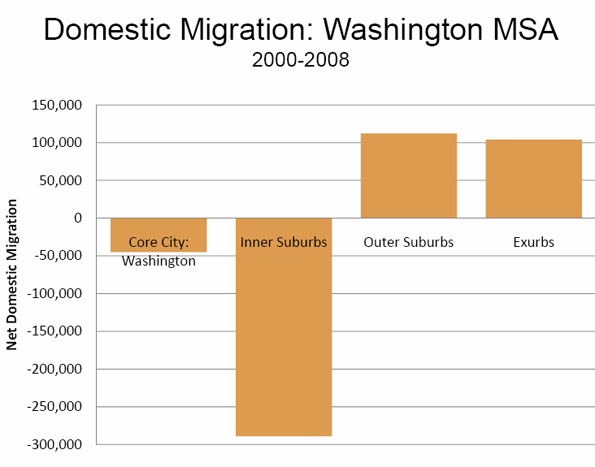
    At the top of our list of best places is greater Washington, D.C., and its surrounding suburbs in Virginia and Maryland. Government jobs may drive that economy, but it is the lawyers, consultants and technical services firms who harvest the richest benefits. As New York University public policy professor Mitchell Moss observes, Washington has emerged as the “real winner” in the recession – not just for public-sector workers but private-sector ones too.

    Fastest Growing Professional and Business Services Sectors
    Area Name Jobs in Sector 2009
    (thousands)
    Sector Share of Jobs 2009
    (percent of total)
    Growth 2008 – 2009
    (percent growth)
    Cumulative Growth 2001 – 2009
    (percent growth)
    2001-2009 Job Change (thousands) 2008-2009 Job Change (thousands)
    Northern Virginia, VA 355.2 27.2% 1.5% 22.4% 65.0 5.2
    Washington-Arlington-Alexandria, DC-VA-MD-WV 558.7 23.0% 0.9% 22.8% 103.6 5.1
    Austin-Round Rock, TX 112.4 14.4% 3.3% 18.7% 17.7 3.6
    Houston-Sugar Land-Baytown, TX 382.3 14.7% 0.9% 19.2% 61.5 3.2
    Virginia Beach-Norfolk-Newport News, VA-NC 106.6 14.0% 2.8% 8.0% 7.9 2.9
    Bethesda-Frederick-Rockville, MD 125.7 21.9% 2.1% 9.0% 10.4 2.6
    Wichita, KS 31.5 10.1% 3.5% 16.4% 4.4 1.1
    Chattanooga, TN-GA 25.9 10.6% 4.3% 11.8% 2.7 1.1
    Peoria, IL 23.0 12.1% 4.5% 43.2% 6.9 1.0
    Rochester, NY 61.8 11.9% 1.5% 1.9% 1.1 0.9
    Augusta-Richmond County, GA-SC 31.0 14.5% 3.0% 7.5% 2.2 0.9
    Mansfield, OH 5.1 9.1% 19.4% 4.1% 0.2 0.8
    Kennewick-Pasco-Richland, WA 20.8 22.2% 4.2% 20.2% 3.5 0.8
    St. Louis, MO-IL 195.4 14.6% 0.4% 3.9% 7.4 0.8
    Fayetteville-Springdale-Rogers, AR-MO 33.5 16.2% 2.2% 34.2% 8.5 0.7
    Macon, GA 12.1 11.9% 5.5% 31.2% 2.9 0.6
    Pittsburgh, PA 158.9 13.9% 0.4% 14.5% 20.1 0.6
    Fresno, CA 30.7 10.3% 1.9% 23.3% 5.8 0.6
    Provo-Orem, UT 23.3 12.4% 2.5% 16.7% 3.3 0.6
    Charleston-North Charleston-Summerville, SC 42.2 14.3% 1.3% 31.1% 10.0 0.5

    Over the past year, parts of northern Virginia – ground zero for the so-called “beltway bandits” who work in industries the government depends on to do its job – have enjoyed the fastest growth in business and professional services, adding over 5,200 jobs despite the current downturn.

    Other areas around the nation’s capital have also seen strong growth. The Washington D.C.-Arlington-Alexandria area, for example, came in second on our list, gaining nearly 5,100 positions, while No. 6 the Bethesda-Frederick-Rockville, Md., metro area added 2,600. In addition, yet another Virginia area – No. 5-ranked Virginia Beach-Norfolk-Newport News, a center for military-related industries – gained nearly 2,900 jobs in this sector.

    It’s far too early to thank the free-spending ways of Barack Obama’s administration for all this growth. As anyone can tell you, the Bush White House and its Republican Congress were not exactly models of fiscal restraint. Plus, Washington and Northern Virginia have seen growth in their business services sectors over the last several years, in the period stretching from 2001 to 2009. Together those two metros added over 165,000 new jobs in this critical, high-wage sector.

    Of course, you don’t have to head to Washington to find a high-paying job – although you might not be able to escape unpleasant summer weather. The other major group of business-services hot spots includes Austin, Texas, at No. 3, and Houston, at No. 4. These Lone Star local economies have continued to thrive not only during the current recession but also over the last decade.

    The others winners include farther-afield locales in Kansas, Tennessee, Illinois and New York. These areas could be gaining both from companies seeking to lower costs and from the new capabilities for remote work due to the Internet. Even though they didn’t make our list, a host of smaller communities – like Mansfield, Ohio; Provo, Utah; and Charleston, S.C. – also enjoyed significant growth in the business services sector over the past year.

    So if these are the places where this segment of the economy is growing and high-paying jobs are easier to come by, where is the opposite true? The worst cities on our list span three archetypes: Rust Belt basket cases, Sunbelt flame-outs and expensive big cities. Perhaps the toughest losses were in Michigan: Detroit and the Warren-Troy metro area suffered big setbacks both in the last year and over the last decade.

    Fastest Declining Professional and Business Services Sectors
    Area Name Jobs in Sector 2009
    (thousands)
    Sector Share of Jobs 2009
    (percent of total)
    Growth 2008 – 2009
    (percent growth)
    Cumulative Growth 2001 – 2009
    (percent growth)
    2001-2009 Job Change (thousands) 2008-2009 Job Change (thousands)
    Phoenix-Mesa-Scottsdale, AZ 289.2 16.0% -10.8% 7.9% 21.2 -35.1
    Warren-Troy-Farmington Hills, MI 202.5 18.5% -12.0% -21.2% -54.4 -27.7
    Chicago-Naperville-Joliet, IL 633.6 16.8% -4.1% -2.9% -19.0 -27.0
    Los Angeles-Long Beach-Glendale, CA 574.7 14.3% -4.2% -3.4% -20.4 -25.2
    Atlanta-Sandy Springs-Marietta, GA 390.3 16.4% -5.9% -1.3% -5.1 -24.4
    Orlando-Kissimmee, FL 170.9 16.2% -8.5% 7.7% 12.3 -16.0
    Santa Ana-Anaheim-Irvine, CA 261.9 18.0% -4.7% 4.0% 10.2 -12.8
    Minneapolis-St. Paul-Bloomington, MN-WI 253.4 14.4% -4.6% -4.6% -12.2 -12.3
    Edison-New Brunswick, NJ 164.5 16.3% -6.7% -2.6% -4.4 -11.9
    Detroit-Livonia-Dearborn, MI 108.9 14.7% -9.5% -20.9% -28.8 -11.4
    Indianapolis-Carmel, IN 120.3 13.4% -8.3% 13.6% 14.4 -10.8
    Riverside-San Bernardino-Ontario, CA 133.7 11.2% -6.5% 36.0% 35.4 -9.2
    Tampa-St. Petersburg-Clearwater, FL 223.2 18.5% -3.7% 12.3% 24.5 -8.6
    New York City, NY 595.7 15.8% -1.4% -0.8% -5.1 -8.4
    Newark-Union, NJ-PA 163.5 16.0% -4.7% -0.5% -0.8 -8.0
    Bergen-Hudson-Passaic, NJ 130.6 14.6% -5.8% -9.1% -13.0 -8.0
    Milwaukee-Waukesha-West Allis, WI 107.6 12.9% -6.6% -1.7% -1.8 -7.6
    Miami-Miami Beach-Kendall, FL 139.1 13.4% -4.7% 2.2% 3.0 -6.8
    Oakland-Fremont-Hayward, CA 158.0 15.6% -4.0% -7.1% -12.2 -6.7
    Las Vegas-Paradise, NV 108.2 12.1% -5.8% 38.1% 29.9 -6.6
    Boston-Cambridge-Quincy, MA 308.8 18.2% -2.0% -6.8% -22.5 -6.4
    Sacramento–Arden-Arcade–Roseville, CA 106.1 12.3% -5.6% -1.8% -1.9 -6.3
    Cleveland-Elyria-Mentor, OH 137.8 13.3% -4.3% -5.2% -7.6 -6.1
    Denver-Aurora-Broomfield, CO 207.0 16.9% -2.9% 4.0% 8.0 -6.1

    Consistent job losses in business services in these areas – some 54,000 in the Troy area since 2001 – reveal the clear connection between employment in business services and in the region’s fundamental auto industry. It turns out that elite services often prove dependent on basic industry. When industrial plants shut down, it’s not just blue-collar workers and company executives that suffer; as a result, these firms will use fewer lawyers, accountants, architects and technical consultants.

    A similar picture emerges in cities like Phoenix, which lost about 35,000 business-services jobs in just one year. This loss stems from the collapse of the housing bubble, which powered the rest of the regional economy. The same meltdown caused smaller but still significant reversals in one-time boomtowns like Orlando, Fla., Atlanta and Southern California’s Santa Ana region, which encompasses Orange County, where business service employment dropped by double-digit rates over the past year.

    Yet these same areas should see some recovery, perhaps more so than the traditional auto manufacturing-focused towns. Phoenix, Orlando and other Sun Belt locations – including a host of other areas in Florida – all saw increasing employment in business services over the past decade. If the economy comes back, along with a stabilization of the residential real estate market, business-services job growth will likely begin to take off again. After all, the fundamental reasons for the success of these areas, such as warm weather, lower costs and the need to serve a growing population, have not fundamentally changed.

    Perhaps most perplexing is the fate of some of the other places on our worst cities list, particularly the biggest metropolitan areas. The professional and business services sector is widely considered ideal for large, cosmopolitan centers, since lots of industries require support. But Chicago experienced a huge chunk of job losses – almost 25% – in this sector during the last year. Other big cities, including Los Angeles, Minneapolis and New York, also suffered.

    This is not a new phenomenon. These and other big cities, like Boston and San Jose, San Francisco and Oakland in California, have been shedding these types of jobs since 2001. These losses, however, have been concentrated at the lower-wage end of the business service pyramid, in areas like human resources and administration. These are the positions that companies can fill more easily and cheaply using the Internet or by hiring in less expensive outposts.

    That’s why Washington and its environs, which has seen across-the-board business growth, remain the great exception. Many business-services jobs outside the beltway appear to be becoming more nomadic, based in places where firms face lower costs and where workers can afford to live well on middle-income salaries. Even the long-term resiliency of higher-wage employment like law and accounting in traditional business hubs like New York could be at risk over time, with some jobs shifting to less expensive locales or even overseas.

    The changing nature of business services presents a boon to some communities and a challenge to others as they seek to survive and thrive in spite of the current recession. How some cities manage to grow this segment of their economies may well presage which parts of the country will thrive best during the years of recovery – and beyond.

    This article originally appeared at Forbes.

    Joel Kotkin is executive editor of NewGeography.com and is a presidential fellow in urban futures at Chapman University. He is author of The City: A Global History. His next book, The Next Hundred Million: America in 2050, will be published by Penguin early next year.

  • Washington, DC: The Real Winner in this Recession

    No matter how far the economy falters, there is always a winner. And no city does better when the nation is at the brink of disaster than Washington, DC. Since December 2007, when the current recession formally began, the nation has lost approximately 6 million jobs. Only two states, Alaska and North Dakota, have lost a smaller percentage of jobs than Washington, DC, which has seen a job loss of 0.6%, or 4,400. Simply put, Washington has done better in this recession than 48 of the fifty states when it comes to job performance.

    This is not the first time that Washington flourished while the rest of the nation suffered. For the first few, largely prosperous decades of the 19th Century, the district was a backwater, growing more slowly than the national average. It was widely reviled as fetid, swampy place with little in the way of commerce, industry or culture. Even its great buildings were compared to “the ruins of Roman grandeur.”

    It was only during arguably our greatest national tragedy – the Civil War – that the District of Columbia grew into an urban center, more than doubling in population from 1860 to 1870. Soldiers from the northern states flocked to the District of Columbia before going to battle, a new military force was established to guard against a Confederate attack, and the management of the war itself became a major federal enterprise. Slavery was abolished in Washington prior to emancipation, and freed slaves added to the District’s growing population.

    During the 1930s, FDR created an entirely new set of federal agencies designed to create jobs by financing projects across the country. At the same time, to prevent abuses on Wall Street, Congress created new regulatory agencies, such as the Securities and Exchange Commission, which hired droves of young accountants and lawyers unable to find work in other cities across the country.

    The Second World War and the Cold War also played to Washington’s advantage, as a vast military-industrial complex rose to the fore. So it’s not surprising that now, with the nation in the midst of its worst downturn since the Great Depression, that Washington appears about to indulge in yet another orgy of growth.

    Washington has always been a one industry town: that’s why it has an intrinsically self-absorbed monotonic culture. Everyone there depends on government for their livelihood. It is fundamentally not a city of competitive industries, but a giant taxpayer-funded office park, surrounded by museums and memorials. The great presidents: Washington, Lincoln, and Jefferson, have their own monuments, while more recent leaders have concert halls and office buildings named after them.

    Today Washington, DC appears much as the twenty-first century version of a gold mining town, even if the gold, so to speak, is coming from taxpayers as well as foreign buyers of our increasingly debased US currency. The Bush Administration kicked off this boom when it created the third largest cabinet department, the Department of Homeland Security, (by consolidating unrelated federal agencies into one super-sized department) and made it the employer of airport baggage and security inspectors across the nation. A new federal agency deserves a new headquarters, of course. DHS is now rising on the site of St. Elizabeth’s Hospital in southeast Washington DC, a pre-stimulus stimulus for the District of Columbia.

    The passage of the American Recovery and Reinvestment Act may be only slowly stimulating the nation’s economy but it is already working wonders in DC. Everyone wants a piece of the action. There is a surge in the lobbying industry, with every school board, regional transit agency and county government hiring a lobbyist to guide them through the new federal grant programs.

    Tourism may be temporarily down in DC, but the hotels are filled with local law enforcement officials, university bureaucrats, and housing advocates all trying to create jobs with federal dollars. The National Telecommunications and Information Administration and the US Department of Agriculture have just nineteen months to spend $4.7 billion on broadband communications.

    To evaluate the thousands of proposals for federal funding, expert panels will convene in Washington, DC. Where else? Communities across the country may receive grants, but the hotel and restaurant industry in the nation’s capital will also prosper from this new federal program.

    The same process will follow other Obama initiatives. Health care and climate change legislation will produce the same rounds of hearings, a growing cadre of regulators and the corps of tassel-shoed lobbyists who will try to influence them.

    The heightened emphasis on transparency in government has compelled every federal department to build sophisticated websites to engage the public, to distribute information, and to conduct the entire process of awarding grants and contracts. The demand for website designers and managers has grown so quickly that a Los Angeles-based interactive advertising agency, “Sensis,” a minority owned and operated corporation, recently opened an office in the District of Columbia just to “capitalize on the federal government’s new interest in digital communications.”

    There is one unambiguous measure that signals the growth of business activity within a city. Until recently, taxi fares in the nation’s capital were based on zones. These made it very inexpensive for members of Congress to go to and from the Capital. Today, every DC taxi has a meter and the old-fashioned zone-based system has been abolished. Both the municipal government and taxi drivers understand that there are more dollars to be made from those seeking to influence government than those who actually make the laws.

    Ben Smith of Politico.com has recently pointed out that five new Washington-based reality television shows are in the planning stages, with Bravo ready to launch “The Real Housewives of Washington, DC.” It is no accident that the entertainment industry has discovered the District of Columbia. A city that thrives in a recession may become the Fantasyland of our generation.

    Mitchell L. Moss is Henry Hart Rice Professor of Urban Policy and Planning at NYU Wagner School of Public Service.

  • Recession Analysis: When will the job market fully recover?

    No one knows this answer for sure, but the data show some interesting trends for what’s possible. This analysis takes two approaches to answer this question, including:

    • Total employment: suggests recovery in 2012
    • Employment growth rates: suggests recovery in mid-2010 … but …

    This is a work in progress. Tomorrow the future will change.

    Current status

    June 2009 was the 18th month of the current and the longest recession since 1940. There were 14.7 million unemployed, more than double two years earlier, and the most since 1940 (the previous high was 12 million in 1985). Unemployment was 9.5%, almost double two years earlier, but less than the previous high of 10.8% in 1982.

    For most of the workforce, this is the worst recession of their lifetimes, and what some are calling the “Great Recession.”

    Total employment Anaysis

    The graph below shows total nonfarm employment (blue line) and the statistical average (green line). Two additional lines were added to show the normal high/low ranges. The blue dot is the BLS total nonfarm employment projection for 2016.

    Notice that total employment in June 2009 was significantly below the normal range for the first time since 1940. In fact, we have been below this normal range for about one year.

    The next graph (below) shows the same total nonfarm employment (blue line), the statistical average (green line), and adds two possible recovery timelines – fast (black) and slow (brown) – estimated from previous recovery timelines on the graph.

    When we plot the fast and slow recovery timelines starting in July 2009 and until we reach the average, here is are the results.

    • Fast recovery => beginning of 2012
    • Slow recovery => beginning of 2018

    The requirements for a fast recovery are high. The most jobs ever created in one year was 5 million in 1984 and 1941. To recover by 2012, the US would have to add 5 million jobs per year (400,000 per month) for the next two and a half years – and this has never been done before. We’ve added jobs at 400,000 per month, but never for two and a half years in a row.


    Employment growth rates

    Employment growth is the annual rate of change between a given month and 12 months earlier. These monthly data points are plotted on the graph below, and include the employment growth (blue line), the statistical average (green line) and the recessions (red dots that cover up the blue line).

    Then we added two possible recovery timelines – fast (black) and slow (brown) – estimated from previous recovery timelines on the graph.

    When we plot the fast and slow recovery timelines starting in July 2009 and until we reach the average, here is are the results.

    • Fast recovery => middle of 2010 (read the next paragraph)
    • Slow recovery => beginning of 2014

    HOWEVER, AND THIS IS IMPORTANT, the current recession has now lasted longer than one year, and the employment growth rates only look back 12 months. This introduces a cumulative effect that has not been compensated for in this graph. This makes both recovery estimates too optimistic. Plus, even when growth rates return to the average, we will have a backlog of millions who have yet to find a job.

    Employment growth rates are a revealing trending tool with some interesting benefits:

    • This graph comes close to a “real feel.” We can tell at a glance how difficult it is to find a job.
      • When employment growth is above the green line, jobs are relatively easy to find because demand exceeds supply. A case-in-point is the late-1990s.
      • When employment growth is between the green line and zero, jobs are harder to find, even though employment is growing, because job growth is not keeping up with workforce growth.
      • When employment drops below zero, jobs are difficult to find. Supply exceeds demand.
    • Notice that the deep recessions of the 40s, 50s and early 60s recovered quickly, and shallow recessions like 1991 and 2001 recovered slowly. This may seem like good news given that we’re in a deep recession (this should recover quickly), but there’s more – deep recessions cycle quickly, going from highs to lows every 4 years (two good years followed by two bad years). By contrast, the last 6 recessions were shallow and separated by about 8 years.
    • Notice that the recessions (red dots that cover up the blue line) almost always start as soon as the blue line crosses the green line on the way down. This seems to be a much better and real time indicator than waiting for the
      NBER to formally announce the beginning of a recession – always many months after the recession has already begun. (last time it took them 11 months)
    • Notice that in almost every case, the end of a recession occurs as soon as the blue line turns back up. This too is a much better and real time indicator than waiting for the NBER to formally announce the end of a recession, months after the fact.

    The current recession appears to be slowing down significantly.

    Notice that the distance between the red dots (monthly growth rate changes) has been getting smaller in recent months. The data are hard to see, and a small piece of the graph above is blown up here on the right.

    The smaller distance between the most recent three or four red dots indicate a slowing in our decline – what some call “getting less bad.” When the red dots are spaced far apart, as they were earlier, employment was declining quickly.

    When the blue line on our employment growth rate graphs turns up, chances are high that we’ve hit the bottom. However, this has not happened yet.

    Interestingly, some forecast the end of the recession for 2009, and they could be right! It’s not the end that matters so much, it’s how long it will take to recover – there are millions of unemployed that need to get back to work, and our workforce is expanding at about 1.5 million per year.

    Post recession unemployment changes

    Between 1950 and 1984, the unemployment rate dropped immediately after the “official” end of every recession. In the last two recessions (1991 and 2001) unemployment increased by less than 1%, shown with brown circles.

    It remains to be seen what will happen to unemployment after the end of the 2009 recession. From these data, one might conclude that it will rise a maximum of 1%. However (read the Total Employment analysis at the top of this page), we are outside the normal limits of employment variation for the first time.

    The take-away

    1. This is the worst recession of a lifetime for almost everyone in the workforce
    2. We’re not at the bottom yet, but we could be close – this recession could end in 2009
    3. The most likely “fast” recovery date (to be fully recovered) is the beginning of 2012

    If you’d like to join a discussion about this page on July 21st,
    click here and sign up … it’s free.

    This report was written by Mark Hovind, President of JobBait. Mark helps six and seven figure executives find jobs by going directly to the decision-makers most likely to hire them. Mark can be reached through www.JobBait.com or by email at Mark@JobBait.com.

  • Prince Charles is Britain’s Master-eco-fraudster

    Thomas Paine was born in Thetford, Norfolk, in 1737. He understood that history is made. Aged 39, writing his Common Sense, he noted that Britain is constituted of ‘…the base remains of two ancient tyrannies, compounded with some new republican materials.’ These were:

    ‘First. – The remains of monarchical tyranny in the person of the king

    Secondly. – The remains of aristocratical tyranny in the persons of the peers.

    Thirdly. – The new republican materials, in the persons of the commons, on whose virtue depends the freedom of England.’ (1)

    Since Britain’s reformist politicians in the House of Commons have shown no republican virtue, in 2009 we now also suffer the “aristocratical tyranny” of the House of Lords being augmented with life peers. These political appointees must give their allegiance to the monarchy, even if they imagine they serve the majority. In contrast to reformists today, the revolutionary republican Paine had the “common sense” to ask:

    ‘How came the king by a power which the people are afraid to trust, and always obliged to check? Such a power could not be a gift of a wise people, neither can any power, which needs checking, be from God.’ (2)

    The king in waiting, Prince Charles, certainly believes in God, and entertains the myths of many Gods, but his claim to the throne in 2009 is that he understands and represents “the natural order”. He has been arguing like this for 30 years. He reiterated his claim in the 2009 Richard Dimbleby Lecture. His is the 33rd lecture held in honour of the veteran broadcaster who died in 1965. Charles had warned in March 2009 that there were only 100 months in which to avoid disaster. (3) He reminded the BBC audience on 8 July that there were 96 months left. The imagined catastrophe he hopes to avoid is otherwise due in July 2017. (4)

    The full lecture is available to see on BBC iPlayer.

    It does not matter if Charles Windsor is “well meaning”. As Paine understood in the Rights of Man, ‘…a casual discontinuance of the practice of despotism, is not a discontinuance of its principles; the former depends on the virtue of the individual who is immediate possession of the power; the latter, on the virtue and fortitude of the nation.’ (5) Prince Charles conveniently imagines himself to be the “steward” of “natural capital”. He has an urgent “duty” in his mind to use his monarchical authority to sustain not only Britain, but the entire planet, in some undefined “natural balance and harmony”. This is his eco-myth, and no matter how benign, how little he uses his power, along with the military command that entails, he cannot be tolerated by a self-interested people.

    We are weak if we allow his eco-mysticism to go unchecked, and to reinvigorate the monarchy in Britain. Those promoting Charles as the spokesman for “natural capitalism” are worse than weak.

    Charles talks of not taking too much “income” from the Earth, which makes him sound modest in his monarchy. He does not seem like a feudal monarch. Yet Paine could see through this in 1792:

    ‘As time obliterated the history of their beginning, their successors assumed new appearances, to cut off the entail of their disgrace, but the principles and objects remained the same. What at first was plunder, assumed the softer name of revenue; the power originally usurped they affected to inherit.’ (6)

    The Windsors have been adept at assuming new appearances since the Second World War. Where his grandmother walked through Blitzed streets, and his mother managed to appear “ordinary”, the now 60 year old Charles makes an effort to appear “green”. He is an environmentalist promoting the stasis of sustainability, and the political deception works to the point where in drawing his revenue from “natural capital” he seems to be doing not only the British people but the whole of humanity a favour. ‘If we fail the Earth, we fail humanity,’ he says. (7)

    Even if he lived as a monarch as poorly as the majority of the world does, he would still be a focus for every anti-democratic interest in twenty-first century capitalism. Of course, even before he inherits the British throne from his aging mother, he does not live poorly.

    With a Parliament of worse than weak representatives checked by a house of new gentry and old aristocrats, all in deference to a feudal monarchy in charge of an interventionist military, Britain is a mostly low paid industrial democracy of debt-laden professional and amateur residential property speculators using a planning system that makes a political and economic nonsense of freehold land ownership. We must find a way to break free of this social containment, (8) focused in Britain on the impending coronation of a “green” king.

    ‘Hereditary succession is a burlesque upon monarchy. It puts it in the most ridiculous light, by presenting it as an office which any child or idiot may fill. It requires some talents to be a common mechanic; but, to be a king, requires only the animal figure of man – a sort of breathing automation. This sort of superstition may last a few years more, but it cannot long resist the awakened reason and interest of man.’ (9)

    In the second part of Rights of Man, Paine was over-optimistic. He thought that kings would make themselves sufficiently ridiculous. While Charles is worthy of ridicule on many occasions, he still commands loyalty from “greens”, even when they are embarrassed by his fantasy of the Earth as “Gaia”, as a conscious entity.

    It is not enough to point out his self-deceptive eco-hypocrisy, or its popularity. The pervasive idea that capitalism is in any way “natural” must be broken. That requires the promotion of industrial production based on an appreciation of the social division of labour. It is necessary to see that in moaning about the effect of “mechanisation” on the environment, for which the contemporary capitalist will even accept moral and legal responsibility, they will abandon industry and make a virtue out of a life of laborious effort, sustained as a “duty”.

    In 2009, 200 years after Thomas Paine died, ‘…environmentalism is the ideology of capitalism in retreat from production.’ (10) That is what we understand at audacity. What people lack is social control of the vast industrial surplus that is produced by all of us. At present the aggregated value of our social production is taken as privately owned capital, partially taxed and redistributed through government, while mystified and made acceptable by the likes of the Prince of Wales as “natural capital”.

    Charles says:

    ‘It seems to me a self-evident truth that we cannot have any form of capitalism without capital. But we must remember that the ultimate source of all economic capital is Nature’s capital.’ (4)

    Wrong. Nature just exists. Only human labour turns nature into product, using machines to enable less labour to produce more. Capitalism has succeeded so far in developing industry so that sufficient surplus is produced beyond the needs of subsistence. That has allowed employers to live off their employees. Paine did not understand the parasitical relationship of the employer on employees. The workforce is paid less than the value it produces. However Paine could see institutionalised fraud that we tend to ignore:

    ‘Monarchy would not have continued so many ages in the world, had it not been for the abuses it protects. It is the master-fraud, which shelters all others. By admitting a participation of the spoil, it makes itself friends.’ (11)

    Democratic society depends on raising the productivity of labour. He may fool himself, and some of his fellow “greens”, but we must not let Charles fool us. He and his backward, stasis-loving supporters must be denied the appearance of being “natural” leaders, as they attempt to promote an anti-machine age of capitalist “sustainable development”:

    ‘Our current model of progress was not designed, of course, to create all this destruction. It made good sense to the politicians and economists who set it in train because the whole point was to improve the well-being of as many people as possible. However, given the overwhelming evidence from so many quarters, we have to ask ourselves if it any longer makes sense – or whether it is actually fit for purpose under the circumstances in which we now find ourselves?’ (4)

    What “model of progress” and what “destruction” is he talking about? In his pre-recorded Richard Dimbleby Lecture, broadcast on BBC One on 8 July 2009, Charles insisted that Facing The Future meant a new system that is more ‘…balanced and integrated with nature’s complexity.’ (7)

    This is complete nonsense, but popular “sustainababble”. The majority needs complete control of industrial advance. That requires a plan to rescue society from “greens”. Prince Charles knows much “…depends on how you define both ‘growth’ and ‘prosperity’.” (4) Much certainly depends on whether most people accept his redefinitions, anticipating his imagined “catastrophe”, or whether we are no longer willing to be subject to his retreat from industrial production. We don’t need to accept his prediction for 2017. We need not be his duped “commoners”.

    “As to the word ‘Commons,’ applied as it is in England, it is a term of degradation and reproach, and ought to be abolished. It is a term unknown in free countries.” (12)

    There is much to abolish in Britain, fraudulent monarchy included, and much to build with “republican materials” in pursuit of democracy.

    Ian Abley, Project Manager for audacity, an experienced site Architect, and a Research Engineer at the Centre for Innovative and Collaborative Engineering, Loughborough University. He is co-author of Why is construction so backward? (2004) and co-editor of Manmade Modular Megastructures. (2006) He is planning 250 new British towns.

    References:

    1. Thomas Paine, Common Sense: Addressed to the Inhabitants of America, 14 February 1776, Philadelphia, reprinted in Mark Philp, editor, Thomas Paine: Rights of Man, Common Sense, and Other Political Writings, Oxford, Oxford University Press, 1998, p 8

    2. Ibid, p 9

    3. ‘Prince Charles: ‘We have less than 100 months to stop climate change disaster” ‘, 8 March 2009, posted on www.dailymail.co.uk

    4. Prince Charles, ‘Facing the Future’, The Richard Dimbleby Lecture as delivered by HRH The Prince of Wales, St James’s Palace State Apartments, London, 8 July 2009. For transcript see here as directed on the Press Release, ‘Richard Dimbleby Lecture 2009: The Prince of Wales’, 9 July 2009, BBC, posted on www.bbc.co.uk

    5. Thomas Paine, Rights of Man: Being an Answer to Mr Burke’s Attack on the French Revolution, to George Washington, President of the United States of America, 1791, reprinted in Mark Philp, editor, Thomas Paine: Rights of Man, Common Sense, and Other Political Writings, Oxford, Oxford University Press, 1998, p 98

    6. Thomas Paine, Rights of Man: Part the Second, Combining Principle and Practice, 9 February 1792, London, reprinted in Mark Philp, editor, Thomas Paine: Rights of Man, Common Sense, and Other Political Writings, Oxford, Oxford University Press, 1998, p 221

    7. ‘Prince fears Earth “catastrophe” ‘, 8 July 2009, posted on http://news.bbc.co.uk

    8. Ian Abley, We are witnessing a British built “housing crisis” that Government is powerless to resolve, 23 July 2008, posted on this website here

    9. Ibid, p 226

    10. James Heartfield, Green Capitalism – Manufacturing scarcity in an age of abundance, www.heartfield.org, 2008, p 91, with details of how to buy posted here

    11. Ibid, p 257

    12. Ibid, p 351

  • Enviro-wimps: L.A.’s Big Green Groups Get Comfy, Leaving the Street Fighting to the Little Guys

    So far, 2009 has not been a banner year for greens in Los Angeles. As the area’s mainstream enviros buddy up with self-described green politicians and deep-pocketed land speculators and unions who have seemingly joined the “sustainability” cause, an odd thing is happening: Environmentalists are turning into servants for more powerful, politically-connected masters.

    On March 3, voters shot down Measure B, a controversial solar energy initiative pushed by Mayor Antonio Villaraigosa and endorsed heartily by many prominent environmentalists. The stunning defeat in this liberal city came after critics accused the mayor and his friends of secret deals that rushed the measure onto the ballot as a favor to a city union whose workers be guaranteed almost all of the resulting solar jobs.

    Then, on April 29, U.S. District Judge Christina Snyder placed a temporary injunction on part of the “clean trucks” program at the Port of Los Angeles, whose air pollution is so foul that the EPA warns its emissions cause cancer in suburbs like Cerritos, miles upwind of the port. Judge Snyder rejected efforts by Villaraigosa and the Teamsters to force port truckers to give up their independence and work for companies – spun as a green rule, but ridiculed as a move to pressure the truckers to become Teamsters.

    Today, labor unions, big businesses, and politicians are embracing a green economy to solve their own political and financial woes. And the green agenda – repairing a damaged planet and protecting the local environment in which we live – is at risk of ending up an after-thought.

    “I don’t think the traditional environmental organizations are up to speed,” says Miguel Luna of Urban Semillas, a grassroots environmental group. Alberto B. Mendoza, president of the Coalition for Clean Air, concurs: “If we don’t become more modern in our approach, we’ll become obsolete.”

    In Los Angeles, developers now market, or “green wash,” big new buildings as “sustainable” – meaning healthy for the planet over the long term. The city of Los Angeles requires large buildings to follow “LEED” rules – low flush toilets, on-site renewable energy and the like. But do these projects cause more congested streets filled with idling cars, for example, than the energy they claim to save? In truth, nobody knows. “If you have a project that would normally be four stories high and now it has 20 stories,” says Hollywood activist Bob Blue, there’s a “net increase in power, water, sewer, traffic, pollution – and impact.”

    Yet among many greens, LEED is a closed debate – and represents a profound shift. In the 1990s, greens like Marcia Hanscom, Rex Frankel, Bruce Robertson, Cathy Knight, Sabrina Venskus, and Patricia McPherson took on Los Angeles City Hall, preventing it from wiping out the Ballona Wetlands to erect a vast housing development, Playa Vista. Those greens publicly trounced the pols and their speculator friends over absurd “sustainability” claims — including an effort to count the grassy median strips as “open space.”

    Nowadays, though, Los Angeles enviros are sliding toward the argument that big development is good for the air, land and water – and small bits of green are enough. Environmentalists rarely engage in the city’s intense development hearings. “Maybe one time an environmentalist showed up,” Blue says, “but it was on the behalf of the developer.”

    Within the green movement, Andy Lipkis, the founder of Tree People, and Mark Gold, executive director of Heal the Bay, have reputations as heavyweights with access to Villaraigosa and other politicians. Neither of them, though, wants to jump into rough-and-tumble politics. Lipkis, a likeable and dedicated activist, proudly says he is politically “naive.” Gold, a smart and equally dedicated environmentalist, says he is not “even a little” worried that politicians, labor unions or speculators are hijacking the greens’ issues.

    But today, developers regularly peddle their proposed apartments near L.A. freeways as “sustainable” – claiming they bring workers closer to jobs. The developments are backed by Villaraigosa and the L.A. City Council – to the horror of health experts. Researchers now know, for certain, that children living in these projects are burdened with often lifelong lung disease. “They are putting individuals at risk,” says USC professor Jim Gauderman, whose 2007 study confirmed it.

    Heavily focused on lowering emissions region-wide to fight global warming, greens now praise freeway-adjacent housing projects, utterly forgetting about the young humans involved. Incredibly, city Planning Commissioner Michael Woo, a Villaraigosa-appointee, hasn’t heard a word of opposition from them. Two years after USC’s study, he says, “I’m not sure there’s a political will to stop housing projects at these locations.”

    Grassroots activist Marcia Hanscom, who has never gotten anything by staying quiet, worked for years with other environmentalists to save the Ballona Wetlands. In 2003, that relentless effort paid off – the state bought more than 600 acres to protect and restore. But now, she says, the environmental movement in L.A. has lost its way. It’s time to talk openly about a “mid-course correction.”

    L.A. politicians “sometimes call me as if I’m one of their staff members,” she notes, “and I’m supposed to do what they say. They have their roles mixed up. I’m here to advocate for the environment, not to advocate for them.”

    Pro-green politicians control the office of mayor, almost every Los Angeles City Council seat, every Los Angeles Unified School Board seat, and, for years, have controlled the legislature. Yet the greens seem oddly incapable of asserting power. Mark Gold of Heal the Bay, for example, went out of his way to endorse solar power Measure B, even though Villaraigosa clearly dissed him by dreaming it up utterly without Gold’s input. What L.A. union boss would stand for that?

    Stefanie Taylor, interim managing director interim of the Green L.A. Coalition, a group of over 100 organizations, says, “We have to make sure we’re at the table when these decisions are made about the new green economy.” But right now, says enviro-lobbyist John White, environmentalists are “more like the menu.”

    The stark difference between the daily work of Hanscom, the grassroots environmentalist, and Jonathan Parfrey, the political insider and mainstream environmentalist, is instructive. When the Weekly talked with Hanscom, she was in the middle of an almost surreal battle to keep glaring, Vegas-style digital billboards, made up of 480,000 piercingly bright LED light bulbs, from being allowed adjacent to the blue herons and wildflowers of the Ballona Wetlands.

    Says Hanscom, “The city has the Ballona Wetlands as a part of a billboard ‘sign district?’ It’s outrageous! I even had [developer] lobbyists and lawyers ask me what they were thinking.”

    As Hanscom aimed her firepower at City Hall, environmentalist Parfrey, one of Antonio Villaraigosa’s newest political appointees, was getting ready to visit a Department of Water and Power wind farm way out of town, with the idea of creating “educational tours” for environmentalists. Nothing wrong with that, but it sounded like a public relations campaign for the big utility.

    It’s hard to escape the fact that Los Angeles power brokers regard the environmental movement not as a passionate force they can tap to improve the quality of life and to clean the air, water, and open spaces, but, increasingly, as just another jobs program. And some of the greenest greens have begun to wonder if their own leaders are taking part in the movement’s demise.

    Patrick Range McDonald is a staff writer at L.A. Weekly, and this piece appears in full at www.laweekly.com. Contact Patrick Range McDonald at pmcdonald@laweekly.com.

  • Why Rapid Transit Needs To Get Personal

    Innovation in urban transportation is the only long-term correction for expensive environmental losses and energy waste. Why, then, isn’t there a US plan for more vigorous exploration and demonstration of new systems using advanced technologies, particularly automation? Where is the Personal Rapid Transit — PRT — in US transportation policy?

    PRT utilizes automated, energy efficient, very lightweight four seat vehicles that operate on narrow, electrified, dedicated guideways. PRT vehicles reduce pollution and conserve land use. The system preserves the benefits that have made automobiles our current dominant transportation mode: personal, on-demand, fast travel directly to arbitrary destinations. For non-drivers, it’s a form of public transportation that upgrades travel to the personal level now available with the automobile. It allows travelers to avoid the slow, stop and go, repetitive service schedule which has prevented meaningful acceptance of conventional mass transit in all but a few very dense cities.

    PRT works like this: At an off line station, a rider goes to a waiting group of personal cars, inserts a card, punches in a destination and joins the main line for the automatically controlled trip directly to his or her destination.

    By direct use of electric energy to power very efficient drive motors, the limitations and inconvenience of batteries are primarily avoided. In some cases, when complete area coverage for the guideway net is not completed, dual mode cars with minimum battery use can deliver the “last mile” to destinations. Of course, current programs for significant automobile improvement should continue until PRT operations are ready to supplant them.

    There is a safety bonus, since these very light weight, energy efficient cars are segregated from the mixed flow of heavy cars and trucks.

    The simpler, lighter PRT vehicles would use significantly less energy than hybrids or battery powered cars. PRT offers the most potential for deep cuts in greenhouse gases in a few decades, without restricting the mobility necessary for regional productivity.

    Community-useful PRT coverage is not possible “overnight”. But PRT and other emerging technologies can stimulate whole new job producing industries while reducing dependence on both fossil fuels and conventional autos for personal transportation.

    Billions are being spent on mass transit installations that few travelers want. Meanwhile, urban congestion increases. Urban “streamlined” mass transit is seldom faster than 100-year-old trolleys. No really new concepts have appeared, since government has not prioritized new systems. Instead, it supports minor changes in existing models. Look at the military’s successful history of taking advantage of risky new technologies. Imagine if it overlooked a comparable potential; it’s equally difficult to fathom telecommunications companies still offering “Ma Bell” style dial phones.

    There is some limited evidence that the concept and hardware are being adopted. Heathrow airport near London is about to open on-demand personal ground travel between parking and terminals. Masdar is a United Arab Emirates new city which will replace automobiles with PRT. In the US, completely automatic on-demand travel on a small, funds-limited basis has been operating successfully at the University of West Virginia for thirty years.

    Some investigators hope that private funding — perhaps an office park, or a campus — can give PRT its initial boost. Maybe a city would be willing to start such a system in a congested area.. Certainly, the automobile revolution started in piecemeal ways. The commitments that are needed today are larger, however. Today’s climate of regulation and progressive income tax discourage risk capital at the needed levels.

    There are signs that the Federal government realizes that transportation policy has lost direction. A recent National Transportation Policy Project report proposes performance-based investment decisions for economic productivity. Compared to other vital infrastructure and private enterprise accomplishments, truly new concepts in transportation have been missing for many decades. With an opportunity to stimulate the economy, and create new job producing industries of global significance, hopefully this new form of vital personal transportation can be the win-win basis for national economic health and efficient urban transportation.

    For more on PRT vehicles, see the Liberator Car by MonoMobile or the British/Swedish/Korean Vectusport-Vectur Transport.

    Walter Brewer is a retired Vice President of a concepts and management center supporting military missile and space programs.

  • Telecommuting And The Broadband Superhighway

    The internet has become part of our nation’s mass transit system: It is a vehicle many people can use, all at once, to get to work, medical appointments, schools, libraries and elsewhere.

    Telecommuting is one means of travel the country can no longer afford to sideline. The nation’s next transportation funding legislation must promote the telecommuting option…aggressively.

    The current funding legislation, called SAFETEA-LU, is set to expire on September 30. On June 24, a House subcommittee approved a discussion draft of the new funding bill: the Surface Transportation Authorization Act of 2009. U.S. Representatives James L. Oberstar (D-MN) and John L. Mica (R-FL), Chair and Ranking Member, respectively, of the Transportation Committee are now sparring with the Obama Administration about just when Congress should focus on reauthorizing SAFETEA-LU; the lawmakers say now; the Administration says 18 months from now. Regardless of the timetable adopted, the measure the House and Senate ultimately pass must maximize the powerful benefits of internet-based travel.

    Whereas the infrastructure for cars, buses and trains consists of roads and rails, the infrastructure required for telecommuting is broadband. Fortunately for the framers of the new transportation package, the stimulus legislation already provides significant funding – over $7 billion – to expand access to broadband. The transportation legislation should provide more. It should also expressly encourage the use of that broadband to telecommute.

    Some Congressional leaders have called on their colleagues to recognize telecommuting as a full-fledged transportation mode. On May 14th, twelve members of the House wrote to both the House Transportation Committee and the House Committee on Energy and Commerce, requesting that they consider including some pro-commuter reforms as they design the nation’s new transportation and energy laws. Among their requests were initiatives to incentivize telecommuting.

    One strategy these lawmakers proposed for encouraging telework was to condition federal grants to states and localities for transportation infrastructure on their creation of bold incentives for telework. Why impose this condition? Telework limits the wear and tear on new roads and rails, as well as the demand for further construction. Thus, it protects the federal investment in such infrastructure and mitigates future costs.

    There is precedent for insisting that the recipients of federal funding for infrastructure focus on telework’s potential to reduce the need for that infrastructure. Federal law provides that executive agencies, when deciding whether to acquire buildings or other space for employee use, must consider whether needs can be met using alternative workplace arrangements such as telecommuting. Requiring state and local governments that seek federal aid for new roads to include telecommuting in their transportation plans would demonstrate the same kind of fiscal responsibility.

    Other lawmakers have introduced legislation specifically linking broadband and more conventional kinds of transportation infrastructure. Representative Anna G. Eshoo, a Democrat from California, together with Democratic Representatives Henry A. Waxman from California, Rick Boucher from Virginia and Edward J. Markey from Massachusetts, has sponsored the Broadband Conduit Deployment Act, a bill that would require new federal highway projects to include broadband conduits. Democratic Senators Amy Klobuchar from Minnesota, Blanche L. Lincoln from Arkansas and Mark R. Warner from Virginia have introduced companion legislation in the Senate.

    The proposal set forth in the two bills makes economic sense. It would be an unconscionable waste of taxpayer dollars to dig up roadways, expand and repave them and then dig them up again to lay the broadband pipes the stimulus bill made possible. If the pipes are installed while the roadways are under construction, they will be available when broadband providers are ready to get communities online.

    If passed, the Broadband Conduit Deployment Act would only strengthen the case that funding for infrastructure projects should be conditioned on state and local government efforts to facilitate telework. If, as they finance highway projects, American taxpayers also fund broadband, they should not then have to struggle to telecommute. They should be able to help contain transportation costs and, at the same time, easily make the greatest possible use of the broadband access they financed.

    What kind of steps to promote telework should states and localities be required to take if they want to qualify for federal transportation funding?

    Congress should insist that they provide telework tax incentives for both employees and employers; eliminate tax, zoning and other laws that are hostile to telework; and offer both public and private sector employers technical help in developing and implementing robust telework programs. The government grantees should be required to create such programs for their own employees. They should also be required to designate certain high traffic and high pollution days as telework days — days when employees are specifically urged to take the web to work — and to conduct public awareness campaigns about the benefits of telework.

    These benefits go beyond transportation infrastructure savings, emissions reductions, and congestion management. Telework can help businesses and government agencies reduce real estate, energy and other overhead costs and use the savings to avoid job cuts or to hire new staff. It can increase employers’ productivity by 20% or more, and enable them to sustain operations if an emergency, such as the recent swine flu outbreak, compels significant absenteeism.

    Telework enables Americans who cannot find work in their own communities – and cannot sell their homes – to look for more distant positions. It can help those still employed to lower their commuting costs and juggle competing work and family obligations. It can help older Americans who cannot afford to retire to continue working even when they no longer have the stamina for daily commuting. And it can help disabled Americans with limited mobility join or re-enter the workforce.

    When Congress finalizes its new transportation policy, it must exploit the tremendous mileage it can get from encouraging web-based travel. Conditioning funding to state and local governments on investment by those governments in pro-telework measures – and offering meaningful federal funding to promote telecommuting – is a dual strategy that would yield a greener and leaner transportation system.

    In the process, this strategy would advance crucial energy, economic, quality of life and contingency planning goals. A clear emphasis on the need for telework in the new transportation bill is essential to help the nation get to where it needs to go.

    Nicole Belson Goluboff is a lawyer in New York who writes extensively on the legal consequences of telework. She is the author of The Law of Telecommuting (ALI-ABA 2001 with 2004 Supplement), Telecommuting for Lawyers (ABA 1998) and numerous articles on telework. She is also an Advisory Board member of the Telework Coalition.

  • Who Killed California’s Economy?

    Right now California’s economy is moribund, and the prospects for a quick turnaround are not good. Unable to pay its bills, the state is issuing IOUs; its once strong credit rating has collapsed. The state that once boasted the seventh-largest gross domestic product in the world is looking less like a celebrated global innovator and more like a fiscal basket case along the lines of Argentina or Latvia.

    It took some amazing incompetence to toss this best-endowed of places down into the dustbin of history. Yet conventional wisdom views the crisis largely as a legacy of Proposition 13, which in effect capped only taxes.

    This lets too many malefactors off the hook. I covered the Proposition 13 campaign for the Washington Post and examined its aftermath up close. It passed because California was running huge surpluses at the time, even as soaring property taxes were driving people from their homes.

    Admittedly it was a crude instrument, but by limiting those property taxes Proposition 13 managed to save people’s houses. To the surprise of many prognosticators, the state government did not go out of business. It has continued to expand faster than either its income or population. Between 2003 and 2007, spending grew 31%, compared with a 5% population increase. Today the overall tax burden as percent of state income, according to the Tax Foundation, has risen to the sixth-highest in the nation.

    The media and political pundits refuse to see this gap between the state’s budget and its ability to pay as an essential issue. It is. (This is not to say structural reform is not needed. I would support, for example, reforming some of the unintended ill-effects of Proposition 13 that weakened local government and left control of the budget to Sacramento.)

    But the fundamental problem remains. California’s economy–once wondrously diverse with aerospace, high-tech, agriculture and international trade–has run aground. Burdened by taxes and ever-growing regulation, the state is routinely rated by executives as having among the worst business climates in the nation. No surprise, then, that California’s jobs engine has sputtered, and it may be heading toward 15% unemployment.

    So if we are to assign blame, let’s not start with the poor, old anti-tax activist Howard Jarvis (who helped pass Proposition 13 and passed away over 20 years ago), but with the bigger culprits behind California’s fall. Here are five contenders:

    1. Arnold Schwarzenegger

    The Terminator came to power with the support of much of the middle class and business community. But since taking office, he’s resembled not the single-minded character for which he’s famous but rather someone with multiple personalities.

    First, he played the governator, a tough guy ready to blow up the dysfunctional structure of government. He picked a street fight against all the powerful liberal interest groups. But the meathead lacked his hero Ronald Reagan’s communication skills and political focus. Defeated in a series of initiative battles, he was left bleeding the streets by those who he had once labeled “girlie men.”

    Next Arnold quickly discovered his feminine side, becoming a kinder, ultra-green terminator. He waxed poetic about California’s special mission as the earth’s guardian. While the housing bubble was filling the state coffers, he believed the delusions of his chief financial adviser, San Francisco investment banker David Crane, that California represented “ground zero for creative destruction.”

    Yet over the past few years there’s been more destruction than creation. Employment in high-tech fields has stagnated (See related story, “Best Cities For Technology Jobs“) while there have been huge setbacks in the construction, manufacturing, warehousing and agricultural sectors.

    Driven away by strict regulations, businesses take their jobs outside California even in relatively good times. Indeed, according to a recent Milken Institute report, between 2000 and 2007 California lost nearly 400,000 manufacturing jobs. All that time, industrial employment was growing in major competitive rivals like Texas and Arizona.

    With the state reeling, Arnold has decided, once again, to try out a new part. Now he’s posturing as the strong man who stands up to dominant liberal interests. But few on the left, few on the right or few in the middle take him seriously anymore. He may still earn acclaim from Manhattan media offices or Barack Obama’s EPA, but in his home state he looks more an over-sized lame duck, quacking meaninglessly for the cameras.

    2. The Public Sector

    Who needs an economy when you have fat pensions and almost unlimited political power? That’s the mentality of California’s 356,000 workers and their unions, who make up the best-organized, best-funded and most powerful interest group in the state.

    State government continued to expand in size even when anyone with a room-temperature IQ knew California was headed for a massive financial meltdown. Scattered layoffs and the short-term salary givebacks now being considered won’t cure the core problem: an overgenerous retirement system. The unfunded liabilities for these employees’ generous pensions are now estimated at over $200 billion.

    The people who preside over these pensions represent the apex of this labor aristocracy. This year two of the biggest public pension funds, CalPERS and CalSTERS, handed out six-figure bonuses to its top executives even though they had lost workers billions of dollars.

    Almost no one dares suggest trimming the pension funds, particularly Democrats who are often pawns of the public unions. Some reforms on the table, like gutting the two-thirds majority required to pass the budget, would effectively hand these unions keys to the treasury.

    3. The Environment

    Obama holds up California’s environmental policy as a model for the nation. May God protect the rest of the country. California’s environmental activists once did an enviable job protecting our coasts and mountains, expanding public lands and working to improve water and air resources. But now, like sailors who have taken possession of a distillery, they have gotten drunk on power and now rampage through every part of the economy.

    In California today, everyone who makes a buck in the private sector–from developers and manufacturers to energy producers and farmers–cringes in fear of draconian regulations in the name of protecting the environment. The activists don’t much care, since they get their money from trust-funders and their nonprofits. The losers are California’s middle and working classes, the people who drive trucks, who work in factories and warehouses or who have white-collar jobs tied to these industries.

    Historically, many of these environmentally unfriendly jobs have been sources of upward mobility for Latino immigrants. Latinos also make up the vast majority of workers in the rich Central Valley. Large swaths of this area are being de-developed back to desert–due less to a mild drought than to regulations designed to save obscure fish species in the state’s delta. Over 450,000 acres have already been allowed to go fallow. Nearly 30,000 agriculture jobs–held mostly by Latinos–were lost in the month of May alone. Unemployment, which is at a 17% rate across the Valley, reaches upward of 40% in some towns such as Mendota.

    4. The Business Community

    This insanity has been enabled by a lack of strong opposition to it. One potential source–California’s business leadership–has become progressively more feeble over the past generation. Some members of the business elite, like those who work in Hollywood and Silicon Valley, tend to be too self-referential and complacent to care about the bigger issues. Others have either given up or are afraid to oppose the dominant forces of the environmental activists and the public sector.

    Theoretically, according to business consultant Larry Kosmont, business should be able to make a strong case, particularly with the growing Latino caucus in the legislature. “You have all these job losses in Latino districts represented by Latino legislators who don’t realize what they are doing to their own people,” he says. “They have forgotten there’s an economy to think about.”

    But so far California’s business executives have failed to adopt a strategy to make this case to the public. Nor can they count on the largely clueless Republicans for support, since GOP members are often too narrowly identified as anti-tax and anti-immigration zealots to make much of a case with the mainstream voter. “The business community is so afraid they are keeping their heads down,” observes Ross DeVol, director of regional economics at the Milken Institute. “I feel they if they keep this up much longer, they won’t have heads.”

    5. Californians

    At some point Californians–the ones paying the bills and getting little in return–need to rouse themselves. The problem could be demographic. Over the past few years much of our middle class has fled the state, including a growing number to “dust bowl” states like Oklahoma, Texas and Arkansas from which so many Californians trace their roots.

    The last hope lies with those of us still enamored with California. We have allowed ourselves to be ruled by a motley alliance of self-righteous zealots, fools and cowards; now we must do something. Some think the solution is reining in citizens’ power by using the jury pool to staff a state convention, as proposed by the Bay Area Council, or finding ways to undermine the initiative system, which would remove critical checks on legislative power.

    We should, however, be very cautious about handing more power to the state’s leaders. With our acquiescence, they have led this most blessed state toward utter ruin. Structural reforms alone, however necessary, won’t turn around the economy’s fundamental problems and help California reclaim its role as a productive driver of the American dream.

    This article originally appeared at Forbes.

    Joel Kotkin is executive editor of NewGeography.com and is a presidential fellow in urban futures at Chapman University. He is author of The City: A Global History. His next book, The Next Hundred Million: America in 2050, will be published by Penguin early next year.

  • Death of the Suburbs: Part Nauseum

    For decades, those who know best have been chronicling the death of the suburbs. In every new announcement of demographic data, they find evidence that people are “moving back” to the core cities, even though they never moved away. The coverage of the latest Bureau of the Census city population estimates set a new standard. “Cities Grow at Suburb’s Expense During Recession” was the headline in The Wall Street Journal. The New York Daily News headlined “Census Shows Cities are Growing More Quickly than Suburbs.”

    Robert E. Lang, co-director of Washington’s Metropolitan Institute at Virginia Tech noted that inner suburbs that have developed transit systems grew more last year and that others will begin to grow faster in the future. Lang specifically cites the Washington, DC suburbs of Alexandria and Arlington. William Frey of the Brookings Institution told Time magazine that the cities are “a lot better” able to withstand the “ups and downs” in the economy.

    This is something for which no evidence was reported, but it was the “inside-the-beltway” (Washington) spin that Time and other media have been eager to adopt. Even the latest government numbers still showed the suburbs with a growth rate more than 20 percent above that of the core cities.

    Premature Death Syndrome?

    Despite the spin, an analysis of the 51 metropolitan areas with more than 1,000,000 population indicates that the nation’s suburbs are in no danger of being displaced as growth leaders by the central city. To start with, suburbs represent nearly 75 percent of the nation’s major metropolitan population. Further, the overwhelming evidence is that people continue to move out of the core cities in far larger numbers than they are moving in (net domestic migration).

    In 2008, the core cities accounted for 23 percent of growth in the largest metropolitan areas. This is up from the decade annual average of 16 percent (Note 1). But this improvement is not the result of more people moving to the core cities but a huge decline in domestic migration, which has driven suburban growth for decades. Thus, the story in the latest census estimates is not that the cities are growing faster. It is rather that people are generally staying put amidst the steepest economic decline since the Great Depression. Stunted hopes, not a sudden enthusiasm for urban living, have driven the relative change.

    Table 1
    Metropolitan Area, Suburban and Core City Population: 2000-2008
    Metropolitan Areas Over 1,000,000
      Metropolitan Area Suburbs Core City
    Metropolitan Area 2000 2008 Change 2000 2008 Change 2000 2008 Change Share of Growth
    Atlanta       4,282       5,376       1,094       3,861       4,838          977          421          538          117 11%
    Austin       1,266       1,653          387          602          895          293          664          758            94 24%
    Baltimore       2,557       2,667          110       1,909       2,030          122          649          637          (12) -11%
    Birmingham       1,053       1,118            64          811          889            77          242          229          (13) -21%
    Boston       4,402       4,523          121       3,813       3,914          101          589          609            20 16%
    Buffalo       1,169       1,124          (45)          877          853          (24)          292          271          (21)
    Charlotte       1,340       1,702          362          770       1,014          244          570          687          117 32%
    Chicago       9,118       9,570          452       6,222       6,717          494       2,896       2,853          (43) -9%
    Cincinnati       2,015       2,155          141       1,683       1,822          138          331          333              2 1%
    Cleveland       2,148       2,088          (60)       1,671       1,655          (17)          477          434          (43)
    Columbus       1,620       1,773          154          904       1,018          114          716          755            39 26%
    Dallas-Fort Worth       5,196       6,300       1,104       4,006       5,020       1,014       1,190       1,280            89 8%
    Denver       2,194       2,507          313       1,638       1,908          270          556          599            43 14%
    Detroit       4,458       4,425          (32)       3,512       3,513              1          945          912          (33)
    Hartford       1,151       1,191            40       1,027       1,066            40          124          124            (0) 0%
    Houston       4,740       5,728          989       2,761       3,486          725       1,978       2,242          264 27%
    Indianapolis       1,531       1,715          184          749          917          168          782          798            16 9%
    Jacksonville       1,126       1,313          187          390          505          116          737          808            71 38%
    Kansas City       1,843       2,002          159       1,442       1,563          122          401          439            38 24%
    Las Vegas       1,393       1,866          473          909       1,307          399          484          558            74 16%
    Los Angeles     12,401     12,873          472       8,697       9,039          342       3,704       3,834          130 28%
    Louisville       1,165       1,245            80          613          687            74          552          557              6 7%
    Memphis       1,208       1,224            16          518          554            36          690          670          (20) -130%
    Miami       5,027       5,415          388       4,663       5,002          338          363          413            50 13%
    Milwaukee       1,502       1,549            47          905          945            40          597          604              8 16%
    Minneapolis-St. Paul       2,982       3,230          248       2,599       2,847          248          383          383              0 0%
    Nashville       1,318       1,551          233          772          954          183          546          596            51 22%
    New Orleans       1,316       1,134        (182)          832          822          (10)          484          312        (172)
    New York     18,353     19,007          653     10,338     10,643          305       8,016       8,364          348 53%
    Oklahoma City       1,098       1,206          108          590          654            64          508          552            44 41%
    Orlando       1,657       2,055          398       1,464       1,824          360          193          231            37 9%
    Philadelphia       5,693       5,838          146       4,179       4,391          212       1,514       1,447          (66) -46%
    Phoenix       3,279       4,282       1,003       1,952       2,714          762       1,326       1,568          242 24%
    Pittsburgh       2,429       2,351          (78)       2,095       2,041          (54)          334          310          (24)
    Portland       1,936       2,207          271       1,406       1,650          244          530          558            28 10%
    Providence       1,587       1,597            10       1,413       1,425            12          174          172            (2) -23%
    Raleigh          804       1,089          284          514          696          182          290          393          102 36%
    Richmond       1,100       1,226          126          902       1,024          121          198          202              4 3%
    Rochester       1,042       1,034            (8)          822          827              5          219          207          (13)
    Riverside-San Bernardino       3,278       4,116          838       3,020       3,821          800          258          295            38 4%
    Sacramento       1,809       2,110          301       1,399       1,646          247          409          464            55 18%
    St. Louis       2,724       2,841          116       2,378       2,486          109          347          354              7 6%
    Salt Lake City          973       1,116          143          791          934          143          182          182            (0) 0%
    San Antonio       1,719       2,031          312          555          680          125       1,164       1,351          187 60%
    San Diego       2,825       3,001          176       1,597       1,722          124       1,228       1,279            51 29%
    San Francisco       4,137       4,275          137       3,360       3,466          106          778          809            31 23%
    San Jose       1,740       1,819            79          841          871            29          899          948            50 63%
    Seattle       3,052       3,345          292       2,489       2,746          258          564          599            35 12%
    Tampa-St. Petersburg       2,404       2,734          329       2,100       2,393          293          304          341            37 11%
    Tucson          849       1,012          163          359          470          111          489          542            52 32%
    Virginia Beach       1,580       1,658            78       1,346       1,424            78          234          234            (0) 0%
    Washington       4,821       5,358          537       4,249       4,766          517          572          592            20 4%
    Total   152,409   166,323     13,914   109,318   121,097     11,778     43,090     45,226       2,136 15%
    Population in 000s                    
    City share column blank where both metropolitan area & city lost population          
    Metropolitan areas are named after their largest city or cities. The first city listed is the core city, except in Virginia Beach where the core city is Norfolk.
    Italization indicates that core city was largely built out in 1960 and has annexed little or no territory.
    Calculated from US Bureau of the Census data for county based metropolitan areas  

    On close examination, the recent better relative performance of the cities stemmed from three factors, none of which involved people moving to them from the suburbs or anywhere else in the nation.

    (1) Decline in Domestic Migration

    Suburban growth has declined because the economic downturn has reduced the number of residents moving from one part of the country to another (domestic migrants). In 2008, net domestic migration fell to 30 percent below the decade average. The suburbs and exurbs were the largest gainers from domestic migration in past and have thus declined the most. This is not surprising, given the fact that a major part of subprime mortgage crisis that precipitated the Panic of 2008 (or the Great Recession) was the granting of mortgages to under-qualified households who stretched their financial resources to move to places where housing was the least expensive. Many of these households defaulted on their mortgages, were forced out of their houses and moved away.

    Nonetheless, as a new Bureau of the Census report indicated, in each of 12 large metropolitan areas analyzed the percentage growth in the exurbs was greater than in the core city. So even in the worst of times, the basic claim by the “inside-the-beltway” analysts and the media were totally off-base.

    The slowdown in net domestic migration also has pushed up city population growth. Fewer people moved away from the core cities than in the past. This, however, is different from people moving into the cities from the suburbs.

    It seems likely that stronger domestic migration gains will be restored to the suburbs when the economy improves. In the meantime, the growth rates of both the core cities and the suburbs have converged toward the natural rate of growth (births minus deaths).

    (2) Net International Migration

    County level data indicates that net international migration was only 9 percent below the decade average in 2008. The core cities have routinely attracted more international migrants than the suburbs. This, combined with a decline in domestic migration among metropolitan areas with more than 1,000,000 population helped to improve the growth rate of the core counties relative to the suburbs.

    (3) Not Adding Up: City Estimates

    Putting it frankly, the births minus deaths, plus domestic migration and international migration fall far short of the increases being reported in the core cities. This can be shown by examining the only core cities for which full “component of population change” data is available (natural increase, net domestic migration and net international migration). The Bureau of the Census does not release component data at any level of government below counties or their equivalents. In five cases, cities are fully consolidated with counties.

    The consolidated city-counties are New York (an amalgamation of five counties, or boroughs), Philadelphia, San Francisco, Baltimore and Washington (DC). Some places referred to as consolidated city-county governments are not genuine amalgamations, because some separate cities remain, such as in Miami, Jacksonville, Louisville and Indianapolis. An examination of the components of population in the five genuinely consolidated city-county jurisdictions reveals huge unallocated discrepancies (the Bureau of the Census term is “residuals”).

    Combining the births, deaths, net domestic migration and net international migration all of the five cities produces a population loss. The difference is the unallocated residual, which is huge in four of the five city-counties and a number of others and is small in most places that are not core cities.

    This unexplained “residual” is largely the result of the Bureau of the Census population “challenge” program. Four of the five consolidated cities have mounted successful challenges to their estimates and have thus added significantly to their populations. In San Francisco and Washington, the challenges added more population than the 2000-2007 gain (2008 challenges are yet to be filed). In New York, the challenges amounted to 80 percent of the 2000-2007 growth (Table 2).

    Table 2
    Unallocated Residuals & Estimates Challenges : 2000-2007
    Fully Consolidated City-County Jurisdictions
      Change in Population: 2000-2007 Unallocated Residual: 2000-2007 Successful Census Challenges: 2000-2007
    With Successful Challenges      
    Baltmore               (8,400)            34,700                 56,400
    New York            294,500          325,000               236,100
    San Francisco              21,700            37,400                 34,200
    Washington              16,100            19,900                 31,500
    Subtotal            323,900          417,000               358,200
    No Successful Challenges      
    Philadelphia             (65,200)             (6,800) 0
    Unallocated Residual: Population Change not accounted for in births, deaths, international migration or domestic migration
    Calculated from US Bureau of the Census data.  

    This is just the beginning of the story. More than one-half of the core city growth in the decade has been attributable to similar challenges. In contrast, only three percent of suburban population growth has been attributable to challenges. It does seem curious that the Bureau of the Census that has produced such erroneous estimates in places like New York (230,000), Atlanta’s Fulton County (110,000) and St. Louis (40,000), missed not a soul Los Angeles, Chicago, Cleveland, Phoenix and a host of other core cities and thousands of counties. The next census (2010) may be a good gauge of the challenge program’s accuracy, although it is not beyond imagining that anti-suburban elements may seek to politicize the results.

    Inner Suburbs

    Further, the theory of inner suburban growth is left wanting, even in the Washington area. Despite their transit improvements, between 2000 and 2008, Arlington and Alexandria lost 45,000 domestic migrants, both losing in every year except 2008 (in both cases, additions due to challenges were greater than the 2000-2007 population increase). Washington’s other inner suburbs, Fairfax County, Montgomery County and Prince Georges County are served by the same transit system (largely paid for by the taxpayers around the country), yet between them have lost another 240,000 domestic migrants between 2000 and 2008. On the other hand, the second ring suburbs have gained 112,000 migrants and the exurbs have gained 104,000 (See Figure). During the last year, the inner suburbs grew at approximately one-third the rate of the outer suburbs. And despite the subprime induced distress in the exurbs, the inner suburbs could achieve no better a rate. Analysts may trade anecdotes at coffee houses about people moving to the city or the inner suburbs from the exurbs or beyond. However, the Bureau of the Census data is clear. For every anecdote that that moves in, more than one moves out.

    The Numbers Tell it All

    When the 2008 county and metropolitan area population estimates were published a few months ago, we showed that the central counties (Note 2) continue to lose residents at a rapid rate. Among the metropolitan areas with more than 1,000,000 population, central counties lost 4.6 million domestic migrants, while suburban counties gained 2.0 million domestic migrants between 2000 and 2008. Over the past year, the core counties lost a net 314,000 domestic migrants while the suburbs gained 197,000 (Table 3).

    Table 3
    Domestic Migration: Core and Suburban Counties: 2000-2008
    Metropolitan Areas over 1,000,000 Population
      Latest Year: 2007-2008 Decade: 2000-2008
    Metropolitan Area Suburban Core Total Suburban Core Total
    Atlanta          32,925          10,126          43,051        395,836          (1,749)        394,087
    Austin          24,216          10,825          35,041        156,890          41,142        198,032
    Baltimore          (6,000)          (6,352)        (12,352)          32,952        (67,923)        (34,971)
    Birmingham            5,658          (2,356)            3,302          48,700        (25,755)          22,945
    Boston          (2,889)          (5,372)          (8,261)      (154,086)        (99,006)      (253,092)
    Buffalo             (358)          (4,127)          (4,485)          (5,933)        (48,232)        (54,165)
    Charlotte          21,327          13,060          34,387        125,223          93,513        218,736
    Chicago               921        (43,031)        (42,110)        160,765      (667,507)      (506,742)
    Cincinnati            3,803          (7,372)          (3,569)          65,905        (85,538)        (19,633)
    Cleveland               861        (15,757)        (14,896)          14,726      (141,445)      (126,719)
    Columbus            3,325             (826)            2,499          64,211        (40,624)          23,587
    Dallas-Fort Worth          62,022        (18,847)          43,175        514,011      (254,016)        259,995
    Denver          13,940            3,932          17,872          86,262        (50,881)          35,381
    Detroit        (17,020)        (45,140)        (62,160)        (53,478)      (273,695)      (327,173)
    Hartford               379          (4,065)          (3,686)          10,789        (21,639)        (10,850)
    Houston          38,559          (1,835)          36,724        279,389        (89,222)        190,167
    Indianapolis          11,747          (5,040)            6,707        113,378        (51,262)          62,116
    Jacksonville            8,723          (3,955)            4,768        101,954          20,185        122,139
    Kansas City            4,908          (3,495)            1,413          57,007        (34,481)          22,526
    Las Vegas (*)
    Los Angeles        (12,033)      (103,004)      (115,037)      (232,281)   (1,006,985)   (1,239,266)
    Louisville            4,281               818            5,099          38,420          (9,798)          28,622
    Memphis            5,986        (10,533)          (4,547)          49,979        (52,412)          (2,433)
    Miami        (18,598)        (28,399)        (46,997)          31,551      (252,098)      (220,547)
    Milwaukee               939          (7,382)          (6,443)          13,987        (86,392)        (72,405)
    Minneapolis-St. Paul            1,179          (4,619)          (3,440)          61,162        (86,920)        (25,758)
    Nashville          17,172             (547)          16,625        128,921        (19,094)        109,827
    New Orleans          (2,520)          22,856          20,336        (72,561)      (233,021)      (305,582)
    New York        (68,081)        (76,018)      (144,099)      (672,435)   (1,118,025)   (1,790,460)
    Oklahoma City            5,707             (226)            5,481          42,399        (10,302)          32,097
    Orlando          10,495          (7,342)            3,153        174,428          55,611        230,039
    Philadelphia          (9,639)        (12,209)        (21,848)          36,553      (144,849)      (108,296)
    Phoenix          22,614          28,463          51,077        117,550        411,697        529,247
    Pittsburgh            1,169          (3,601)          (2,432)            5,221        (60,564)        (55,343)
    Portland          10,641            7,355          17,996        106,163          (4,247)        101,916
    Providence          (3,983)          (6,643)        (10,626)        (13,399)        (34,136)        (47,535)
    Raleigh            6,030          23,238          29,268          35,263        132,769        168,032
    Richmond            5,625               937            6,562          76,608          (4,095)          72,513
    Riverside-San Bernardino (*)
    Rochester             (425)          (3,325)          (3,750)          (7,121)        (36,181)        (43,302)
    Sacramento            8,255          (3,731)            4,524          97,304          34,798        132,102
    St. Louis               561          (6,253)          (5,692)          17,988        (57,090)        (39,102)
    Salt Lake City            1,407          (1,164)               243          10,191        (41,646)        (31,455)
    San Antonio          10,850          11,941          22,791          69,824          84,409        154,233
    San Diego (*)
    San Francisco            4,092            1,414            5,506      (269,093)        (80,543)      (349,636)
    San Jose             (528)          (2,097)          (2,625)          (6,119)      (221,378)      (227,497)
    Seattle            7,894            3,975          11,869          61,244        (38,132)          23,112
    Tampa-St. Petersburg            8,610          (2,100)            6,510        169,346          91,106        260,452
    Tucson (*)
    Virginia Beach        (11,093)          (4,430)        (15,523)            7,486        (15,941)          (8,455)
    Washington        (16,637)          (1,622)        (18,259)        (77,894)        (43,457)      (121,351)
    Total        197,017      (313,875)      (116,858)     2,015,186   (4,645,051)   (2,629,865)
    * Indicates no suburban county(ies)
    Calculated from US Bureau of the Census data for county based metropolitan areas

    There is a simple test that the reporters and the analysts can apply. When the cores experience net domestic migration gains and the suburbs experience net domestic migration losses, only then can it be claimed that people are moving to the cores are gaining at the expense of the suburbs. The reality is that between 2000 and 2008, there was not a single instance out of the 51 metropolitan areas with more than 1,000,000 population where there was suburban net out-migration and core county net in-migration. There was one case in 2008, but it was an anomaly. The suburbs of New Orleans lost a modest number of domestic migrants, while the city gained strongly. This occurred because people moved back to the city in large numbers, after more than half left due to Hurricane Katrina.

    Spin can change perceptions, but not reality. People are not moving from the suburbs to the core cities. The reverse continues to be true, even in the worst of times.


    Note 1: Excludes New Orleans due to significant population variations from Hurricane Katrina.

    Note 2: Counties are the smallest jurisdiction for which the Bureau of the Census publishes migration data.

    Reference: Demographia 2000-2008 Metropolitan Area Population & Migration: http://www.demographia.com/db-metmic2004.pdf

    Wendell Cox is a Visiting Professor, Conservatoire National des Arts et Metiers, Paris. He was born in Los Angeles and was appointed to three terms on the Los Angeles County Transportation Commission by Mayor Tom Bradley. He is the author of “War on the Dream: How Anti-Sprawl Policy Threatens the Quality of Life.

  • Unemployment Rising in Washington, DC

    In the past month, Washington D.C. has experienced both an increase in number of jobs as well as an increase in unemployment, according to the Washington Post.

    The city’s unemployment rate rose from 9.9 in April to 10.7 percent in May – far surpassing the national average of 9.4 percent – despite gaining about 1,400 jobs primarily with the federal government.

    The District is often considered to be immune to such job market fluctuations because of steady government employment. But as Alice Rivlin, senior fellow at the Brookings Institution, points out, “[D.C.] has plenty of jobs, mostly high-skill jobs that require education beyond high school.”

    The high-paid, higher-skill jobs created within the government are often times given to those not living in the city – Virginia’s unemployment rate: 7.1 percent, Maryland’s: 7.2 percent.

    Job loss has also disproportionately affected the city’s African American population. The predominately white and affluent Ward 3 had an unemployment rate of 2.5 percent in April, far better than the largely poor and black Ward 8, where the rate was 23.3 percent.