Blog

  • Project Development: Regulation and Roulette

    The site plan logically should be the key to approval of a development project. Yet in reality, the plan is secondary to the presentation. My conclusions are based upon experience with well over a thousand developments over four decades, most in the mainland USA. And what I’ve observed is that the best site plan is only as good as the presentation that will convince the council or planning commission to vote “Yes” on it. No “yes” vote, no deal, no development.

    Each presenter deals with the dog-and-pony show in his own way. There’s an endless variety of styles (or lack of styles). All of these public meetings have one thing in common: The neighbors (if there are any) will be there to oppose the new development.

    Not Too Long Ago…
    In the old days there were three factions: The developer presenting the plan, the neighbors opposing the plan, and the council listening to both sides. If the development was high profile, someone from the local press might also show up. The planning commission and council are fully aware that all plans will be met with neighborhood opposition, and they will have to listen to lengthy complaints along the route to approving (possibly) the plan.

    In the past, the citizens sitting on these boards would most likely dismiss Elwood and Betsy Smith’s complaint about how a development in their back yard would invade their privacy, and would vote in favor of the new master planned community instead.

    How It’s Different Today
    Today there is often an additional audience. Televised meetings provide an entire region of neighbors. The on-screen council listens to the neighbor’s objections, no matter how absurd they may be, then answers directly to the camera, showing the general community watching at home that they really care about every citizen’s opinion. The council member must never appear too much in favor of the developer, as that could be misconstrued as not caring about the citizens he or she represents. A televised Council member hears the Smith’s complaint with a very concerned on-camera look, explains how maybe we have too many new homes in this town, and proceeds to tell viewers that the developer might want to consider a buffer and a drop in density. Concerns have changed from developing economically sensible neighborhoods to “please elect me Mayor when I’m on the ballot”.

    Planning Outside The USA
    Our first large site plan done outside the States was in Freeport, Bahamas. In 2000, when we were first contacted to design Heritage Village, we asked about doing presentations to the city council and planning commission to help move the approval process along. We were told that the development company and the regulating entity were the same, and if they liked the plan it would be built! That is exactly what had happened.

    Our next attempt outside the USA was not so easy. In Mexico City when we asked to sit down with government officials to change policy to create better neighborhoods, the developer said… No. At the time, we did not understand why it was so critical that we were not to suggest changes.

    We Discover A Superior Foreign System
    We wrongly assumed that all planning outside the USA could have similar problems, with restrictions that were absurdly prohibitive for designing great neighborhoods. It was only when we worked in Bogota, Columbia last year that we had the opportunity to work within a system that may not be so backwards after all. Our request to meet with the authorities to show them new ways to design neighborhoods was met, as it had been in Mexico City, with an absolute… No.

    We then asked for an opportunity to present the plan, and were told that was not necessary. Being that it was Columbia you can imagine our first thoughts. Cartels? Maybe corruption? The reality was much simpler. Since our plans met the minimums (they actually exceeded them), they were automatically considered approved. Imagine that – no neighbors to complain! If everything conforms, it should be approved … right? Just plain common sense.

    Zoning-Compliant Projects Should Be Exempt From Public Meetings
    When you think about it, why wouldn’t this work in the USA? if the development plan being submitted meets or exceeds the zoning and the subdivision regulation minimums, why does it need to go through any public approvals at all? The American developer often faces months or years of delays, enormous interest payments, and tens or perhaps hundreds of thousands of dollars spent on consultants and legal help to re-create plans that conform. Those massive sums could go towards making better neighborhoods, better architecture, better landscaping, less environmental impacts, and more affordable housing.

    We’d Still Need Public Meetings
    The public would still have plenty of input on regulation and zoning exemptions, where public citizen input is valuable. If a developer is proposing something that goes below minimums or does not conform to zoning regulations, then it is reasonable to go through the more time consuming process that we currently have. This brings up the question of how the developer would introduce something different to the written law. This could be a problem under typical PUD (Planned Unit Development) regulations, which typically allow blanket changes to the minimums when alternative designs are not covered by typical zoning.

    This PUD Pandora’s box, once opened, can have devastating results if the regulators and the neighbors both agree that the plan is simply not good enough. The developer thinks the plan is just dandy as is, but in reality most PUD proposals are simply too vague to be functional. A battle of wills that can last years often ensues.
    In the end , these expensive delays increase lot costs, and the home buyer ultimately pays. If a special ordinance such as PUD, Cluster Conservation, or Coving was specifically spelled out in a rewards-based — instead of a minimums-based — system, developers could get benefits for great plans complete with open space and connectivity, typically density and setback relaxations.

    While writing Prefurbia, we began to ask ourselves, how did we take something so simple and let it get so out of control? The third world countries are progressive enough to actually allow developers who comply with the rules to quickly build their neighborhood. Maybe they are not so far behind us after all.

    Perhaps our regulations and planning approach is intended to keep the system “busy” with billable hours. Imagine if we could get a conforming plan stamped, and the next day construction could begin. How many billable hours would be eliminated, how much construction cost and land holding interest saved? That would be very hard to calculate, but it’s likely significant.

    “It is difficult to get a man to understand something when his salary depends upon his not understanding it…” Al Gore, An Inconvenient Truth

    The inconvenient truth won’t win us many friends in the consulting industry whose incomes depend upon generating billing time in meetings. But can we afford to continue down the path we are presently on? We need to take a hard look at the regulations. Are they written solely to provide the highest living standards? Or do they generate the highest billable hours for the consultants who propose them?

    Rick Harrison is President of Rick Harrison Site Design Studio and author of Prefurbia: Reinventing The Suburbs From Disdainable To Sustainable. His websites are rhsdplanning and prefurbia.com.

  • The Changing Landscape of America: The Fate of Detroit

    INTRODUCTION

    During the first ten days of October 2008, the Dow Jones dropped 2399.47 points, losing 22.11% of its value and trillions of investor equity. The Federal Government pushed a $700 billion bail-out through Congress to rescue the beleaguered financial institutions. The collapse of the financial system in the fall of 2008 was likened to an earthquake. In reality, what happened was more like a shift of tectonic plates.

    In 1912 a German scientist, Alfred Wegener, proposed that the continents were once joined together as one giant land mass called Pangea.

    About 200 million years ago the continents began to drift apart as the globe separated into eight distinct tectonic plates. History will record that the financial tectonic plates of our world began to drift apart in the fall of 2008. They have not stopped moving and the outcome of where they will end up remains uncertain.

    PART ONE – THE AUTOMOBILE INDUSTRY

    Edsel, Packer, Studebaker, Hudson, Nash, AMC – the demise of these brands may have seemed tragic at the time, but were actually a sign of industrial health. In contrast, for the last fifty years the American automobile industry has been static. Despite the proliferation of Japanese, Korean and German imports, General Motors, Ford and Chrysler managed to hold on to a majority of the domestic market, with a dizzying stable of makes and models that grew to near 17 million new car sales in 2007. That epoch is now over. The tectonic plates have shifted under the automotive business and a year from now, the industry will bear little resemblance to the static structure of the last fifty years.

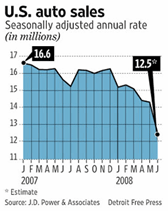
    Fifty years ago General Motors owned more than 50% of the American market and automobile jobs made up one seventh of the US workforce. It was said that when GM sneezed the US economy caught a cold. GM shares now sell for less than a cup of coffee at Starbucks. Now GM is about to enter bankruptcy.

    The brands are dissolving, Oldsmobile was the first casualty. Pontiac and Hummer have been discontinued. When they reorganize, eleven hundred dealers will be terminated. General Motors will close all its plants for three months this summer. Many will never reopen. The New GM, to be known as Government Motors, will be owned by the UAW (20%) and the Federal Government (70%). Twenty billion of tax-payer loans will be converted to ownership to make the UAW pensions liquid. The debt holders will see their senior $27 billion investment converted into just 10% of stock. The shareholders will be wiped out.

    The New GM will become the platform for small fuel efficient cars, hybrids, electric vehicles and experimental technologies mandated by an ever demanding government. Its shareholders vanquished, The New GM will bear no resemblance to the car company that we have known for the last 50 years. Can the Chevy Volt rescue GM? The answer is no.

    GM will continue to shrink as their SAAB and Saturn franchises are sold off to the Chinese. China’s automobile sales are up 10% this year versus declines of 23% in the US and 15% in Europe. Chinese automobile manufacturers are grabbing market share, 30% this year versus 26% in 2008, while their competitors are distracted. Chinese companies unknown to Americans like Geely Motors, Chery Automobiles or BYD Co. will buy SAAB or Saturn for their dealer network. Warren Buffett invested $230 million into BYD, a firm that has been manufacturing cars for just six years. They already provide batteries to Ford and GM and soon will be building the world’s least expensive mass produced hybrid and electric vehicles. Geely plans to triple its domestic sales to 700,000 by 2015 and Chery plans to introduce 36 new models over the next two years.

    Chrysler is in far worse shape and will likely never recover. The Federal Government already forced it into bankruptcy. Seven hundred and eighty nine dealers have been told that their franchises are terminated. Its shotgun marriage to Fiat will look more like a surgical amputation of unnecessary body parts than a marriage. If Fiat remains in the game, they will do so for the Jeep brand and a portion of the dealer network. Like Oldsmobile and Pontiac, Plymouth and Dodge brands are doomed as well as most of the Chrysler line. No one will mourn the demise of the Crossfire, Pacifica, Sebring, or the PT Cruiser. Fiat should keep the new Chrysler 300, a beautiful design that deserves to be built. Chrysler has not produced many stars in the last few decades. The trail blazing design of the 300 brought the full size sedan back from the dead.

    Chrysler will jettison the weakest of its dealers in bankruptcy. Fiat will retain the big dealers in the network. They will bring the stunning and iconic Fiat 500 to America, a fuel efficient small car that will enjoy the same success as Volkswagen’s retro Beetle. Fiat will also use the dealer network to bring the Alfa-Romeo back to America. The Fiat-Jeep-Alfa dealer of the future will bear no resemblance to the staid Chrysler-Dodge-Plymouth dealer of today.

    The surprising winner among the American troika of manufacturers is the Ford Motor Company. Ford and Lincoln will survive because they took no government bail-out money. Mercury may not survive but Ford and Lincoln should make it through the transition. The new Ford-Lincoln will be the refuge for auto enthusiasts who want attractive fast and powerful cars. Ford will become the Apple of the auto business, doing its own thing and flaunting political correctness and conventional wisdom. Ford’s namesake CEO has been an environmentalist for many years so Ford was well into fuel economy and hybrids before the tectonic plates began to move last fall. At just $5.00 per share, Ford is a tantalizing buy for the long term.

    One can no longer call Mercedes, BMW, Toyota and Honda imports as many of their cars are made entirely in the U.S. The Japanese system is different than the American counterpart although we are drifting toward their model. The Japanese government plays a heavy hand in their industry, subsidizing the encroachment into new markets until the brands have stabilized market share. But they are not immune. Toyota lost $7.7 billion in the last quarter – even more than GM.

    True imports like Volkswagen will weather the storm because they were well positioned with small fuel efficient cars long before the tectonic plates began to shift. VW is making a huge bet that oil will top $100/barrel again soon and their fuel efficient and clean diesels will be accepted by American drivers.

    The biggest winner is obviously the UAW and their pensions which have been bailed out with tax payer money by an administration beholden to its labor supporters. Who will be the biggest loser? Clearly, it will be America’s small towns. Our small towns will lose their local dealer and their choice in automobiles. They will be forced to buy the brand that remains in town or drive scores of miles to the next closest dealer for service. Most small town auto dealers were also the most generous members of the community. Charitable giving and support will wither as will local sales tax revenues when the big ticket automobile sales tax revenues disappear. Ironically, as the plates continue to shift, America’s small towns could be decimated by the changes in the automobile industry as they were one hundred years ago when the automobile shifted millions from rural communities to the cities.

    A year from now the landscape of America will be forever changed but the plates will continue to shift. Five years from now, will American ingenuity bring about a renaissance of the American automobile industry? Or, will what is left of this industry be gobbled up by the Chinese and the Korean manufacturers as the Japanese did in the 70s and 80s? The key issue may be what role the government will play. Will Americans buy cars designed by government bureaucrats and built by the unions that own the factories? Will an administration devoted to “coercing” Americans out of their cars be able to simultaneously save the auto industry?

    ***********************************

    This is the first in a series on the Changing Landscape of America. Future articles will discuss real estate, politics, healthcare and other aspects of our economy and our society. Robert J. Cristiano PhD is a successful real estate developer and the Real Estate Professional in Residence at Chapman University in Orange, CA.

  • Portland: A Model for National Policy?

    United States Secretary of Transportation Ray LaHood and Washington Post columnist George Will have been locked in debate over transit. Will called LaHood the “Secretary of Behavior Modification” for his policies intended to reduce car use, citing Portland’s strong transit and land use planning measures as a model for the nation. In turn, the Secretary defended the policies in a National Press Club speech and “upped the ante” by suggesting the policies are “a way to coerce people out of their cars.”

    These are just the latest in a series of media accounts about Portland, usually claiming success for its policies that have favored transit over highway projects as well as its “progressive” land use policies. Portland has also become the poster child for those who advocate planning restrictions and subsidies favoring higher density development in parts of the urban core.

    Indeed if Secretary LaHood has his way, Portland could become The Model for federal transportation policy. So perhaps it is appropriate to review what it has accomplished.

    Portland’s Mediocre Results

    Portland’s record of transit emphasis began more than 30 years ago, when the area “traded in” federal money that was available to build an east side freeway to build its first light rail line. The east side light rail opened in 1986. Since that time, Portland has significantly increased its transit service, especially opening three more light rail lines (West Side, North Side and Airport) as well as a downtown “streetcar.”

    Portland’s Static Transit Market Share: With these new lines and expanded service, Portland has experienced a substantial increase in transit ridership. Passenger miles have increased more than 130 percent since 1985, the last year before the first light rail line was opened. This is an impressive figure.

    However, over the same period, automobile use increased just as impressively. In 1985, approximately 2.1 percent of motorized travel in the Portland urban area was on transit and it remained 2.1 percent in 2007, the latest year for which data is available.

    Portland’s Declining Transit Work Trip Market Share: One of transit’s two most important contributions to a community is providing an alternative to the automobile for the work trip (the other important contribution is mobility for low income citizens). Work trip rider attraction is important because much of this travel is during peak periods, when roadways are operating at or above full capacity. In 1980, the last year for which data is available before the first light rail line opened, United States Bureau of the Census data indicates that transit’s work trip market share was 9.5 percent in the Portland area counties of Clackamas, Multnomah and Washington covered by Portland’s strong land use policies. Yet despite this, and the transit improvements, the work trip market share has not grown. By 1990, transit’s market share had dropped a third, to 6.3 percent. It rose to 7.6 percent in 2000 and by 2007 had fallen back to 6.8, despite opening two new light rail lines since 2000 (Figure 1). Remarkably, transit’s 2007 work market share was 28 percent behind its 1980 share and had fallen 10 percent since 2000.

    Figure 1:

    Yes, Portland did increase its transit use, but failed to increase the share of travel on transit and the proportion of people riding transit to work declined.

    Driving the Portland Evangelism: GHG Emissions

    Secretary LaHood’s affection for Portland appears to principally be that its policies can materially assist in the objective of reducing greenhouse gas (GHG) emissions. The data is available to test that claim.

    We examined GHG emissions per capita by transit in Portland and the urban personal vehicle fleet, including cars and personal trucks (principally sport utility vehicles). Overall, including upstream emissions (such as refining and power production), transit in Portland is about 50 percent more GHG friendly per passenger mile than the 2007 vehicle fleet. If all of the increase in transit passenger miles from 1985 to 2007 replaced automobile passenger miles, then reduction of approximately 50,000 GHG tons can be said to have occurred as a result in 2007 (though as is indicated below, things are not that simple).

    That sounds like a large number, until you consider that Portland traffic produces more than 8,000,000 GHG tons per year. Transit’s expansion has reduced GHG emissions by approximately 0.6 percent annually over 22 years. This pales in comparison to the 83 percent national reduction over a 45 year period that would be required by the Waxman-Markey bill being considered by Congress.

    The Cost of GHG Emission Reduction

    Moreover, GHG emission reduction requires a context. Not all GHG emission reduction strategies make sense. Given the widely held principle that GHG emission removal must not hobble the economy, it is crucial that costs (per ton of GHG removed) be a principal criteria. If excessively costly strategies are employed, the result will be wasted financial resources, which will translate into diminished economic growth and higher levels of poverty. According to the United Nations Intergovernmental Panel on Climate Change (IPCC), between $20 and $50 per ton is the maximum amount necessary to accomplish deep reversal of CO2 concentrations between 2030 and 2050. It is fair to characterize any amount above $50 per ton as wasteful and likely to impose unnecessary economic disruption.

    Even that cost may be high. The current “market rate” is about $14 per ton, which appears to approximate the amount that figures such as former vice-president Al Gore, Speaker of the House Nancy Pelosi and California Governor Arnold Schwarzenegger pay to offset their GHG emissions from flying.

    Portland Costs of GHG Emission Reduction

    This $14 to $50 range provides the context for comparing the cost of GHG emission reduction through transit expansion in Portland. Annual transit costs in Portland more than tripled from 1985 to 2007 (including inflation adjusted operating costs and the annual capital costs of the light rail lines), an annual increase of more than $325 million. This figure is reduced to capture the consumer cost savings from reduced automobile gasoline and maintenance costs. The final result is a cost of approximately $5,500 per ton of GHG removed.

    This is 110 times the IPCC $50 maximum and nearly 400 times the Gore-Pelosi-Schwarzenegger standard. If the United States were to spend as much to remove each ton of the likely 83 percent national reduction target, the cost would be $30 trillion annually, more than double the gross domestic product. To call the Portland GHG cost reduction figure extravagant would be an understatement.

    Traffic Congestion Increases GHG Emissions

    There is not a one-to-one relationship between reduced driving levels and reduced GHG emissions. As traffic congestion increases, urban travel speeds decline and “stop-and-start” traffic increases, fuel consumption is reduced (miles per gallon declines). Some or even all of the supposed gain from reduced driving can be negated by the higher GHGs from traveling in greater traffic congestion.

    Portland’s traffic congestion has increased substantially since before light rail. Further, by 2007 Portland’s traffic congestion had become worse than average for a middle-sized urban area and worse than in much larger Dallas-Fort Worth, Atlanta, Philadelphia and Phoenix.

    Further, according to information in the Texas Transportation Institute’s Annual Mobility Report, the amount of gasoline wasted due to peak period traffic congestion in Portland rose 18,000,000 gallons from 1985 to 2005 (latest data available, adjusted for the population increase), simply due to greater traffic congestion. The increase in GHG emissions from this excess fuel consumption is estimated to be approximately 200,000 tons annually. This is four times the estimated reduction in GHG emissions that was assumed to have occurred from the increase in transit ridership.

    The bottom line: The Portland model inherently produces more congestion and increases GHG emissions. Failure to expand roadways to meet demand and forced densification increase traffic congestion.

    Better Models

    The ineffectiveness of Portland’s model strategies in GHG emission is in contrast to other strategies. Between 2000 and 2007, the share of people working at home in Portland rose more than one quarter. If transit and working at home should continue their 2000s rates, transit’s work trip share will be less than that of working at home by 2015. Working at home eliminates the work trip, resulting in substantial GHG emission reductions and does it at a cost of $0.00 per ton.

    Another approach is the Obama Administration’s automobile fuel efficiency strategy. About the same time as the LaHood-Will debate was heating up, the President announced that automobile manufacturers would be required to increase their corporate average fuel efficiency for cars and light trucks to 35.5 miles per gallon by 2016, a 75 percent performance improvement from that of the present fleet. If this fuel efficiency could be achieved in Portland today, the reduction in GHG emissions would be more than 40 percent. This new policy would eventually close 90 percent of the gap between personal vehicles and transit in Portland.

    President Obama indicated that this strategy is costless. The higher costs that consumers will pay for cars will be more than made up by the fuel cost savings. Thus, according to the President, this policy costs $0.00 per ton of GHG emissions removed, less than the IPCC’s $50 and less than Portland’s $5,500. Of course, it is not possible to achieve 35.5 miles per gallon now, but it will be (Figure 2).

    Figure 2:

    The best hybrid cars now achieve 50 miles per gallon, which makes them less GHG intensive than transit in Portland. President Obama has gone further, indicating the potential for developing 150 mile per gallon cars. The curtain could be rising on a future of cars that emit less GHG emissions per passenger mile than transit. People and officials genuinely concerned about GHG emissions should applaud these advances. On the other hand, people and officials who value coercive behavior modification more than GHG emission reduction are likely to resist.

    The Consequences of Coercing People Out of Cars

    Moreover, Portland policies ignore a crucial factor: how automobiles facilitate economic growth and employment. Generally, the research indicates that the economic performance of metropolitan areas is enhanced by greater mobility. Moreover, no transit system provides the extensive mobility made possible by the automobile, not in America and not even in Europe. Coercing people out of cars coerces some out of employment and into poverty.

    Even where transit service is available, it generally takes longer than traveling by car. In 2007, travel to work by transit took 3:50 (three hours and 50 minutes) per week longer than driving in the nation’s largest metropolitan areas. With all of Portland’s transit improvements, it still takes approximately 3:15 longer per week to commute by transit than by driving. It appears that Secretary LaHood would add more than three hours (time many don’t have) to our work trip each week.

    The Land Use Cost

    The second plank of The Model is strong land use regulation (smart growth), which economic research shows to materially increase house costs, which would lead to a lower standard of living.

    Time to Turn Off the Ideological Autopilot

    The policies of The Model Portland have no serious potential for reducing GHG emissions and could even make it worse. On the other hand, the rapidly developing advances possible from improved vehicle technology, something the Administration espouses, show great promise. Behavior modification a la The Model turns out not only to be undesirable, but also unnecessary.

    Wendell Cox is a Visiting Professor, Conservatoire National des Arts et Metiers, Paris. He was born in Los Angeles and was appointed to three terms on the Los Angeles County Transportation Commission by Mayor Tom Bradley. He is the author of “War on the Dream: How Anti-Sprawl Policy Threatens the Quality of Life.

  • Frontrunning and Finance: Left Foot Forward

    This month, the Obama administration moved to regulate the so-called ‘invisible’ financial instruments that have come to rule the world of finance. Variations of the ‘shadow’ banking system — or, in the preferred language of financiers, market ‘risk management tools’ — have increasingly taken the spotlight during the current crises.

    Jim Cramer, on one of those CNBC webcasts which he must have thought would never be seen by anyone who counts, appeared to admit in December to something illegal when he said, “A lot of times when I was short (stocks) at my hedge fund, I would create a level of activity beforehand that would drive the futures.”

    Might he have been referring to self-frontrunning, an egregious flim-flam that takes place on two separate exchanges almost simultaneously so that one regulatory eye can’t see what the other one sees? On one exchange, the hedge fund manager sells the index future, and on another, he executes a series of short sales in the stocks of which the index is composed. The net effect is to drive the future down to profitable levels. Or, in the case of Mr. Cramer, who goosed the futures after having shorted the stocks, to draw investors in to an arbitrage that he himself created.

    It is strange and striking that a practice responsible for the lion’s share of the trading profits of the nation’s hedge funds and investment banks should remain a secret… even an open secret. But every morning on CNBC’s Squawk Box, commentators comfortably predict that the market will open up or down based on the movement of the futures. And nine times out of ten they are right.

    This type of thing can go on ad infinitum: after having closed out the short position, one might readily go long the index future and likewise the composite stocks and make money on the upside as well. While not foolproof – a critical mass of fools could upend such plans in a jittery trading environment – one can achieve a comfortable margin of safety by working with other hedge funds to go long or short the identical stocks and futures in concert. The effect is momentum investing in the truest sense of the term. And lofty expectations are sure to be met because the law of one price will force the futures in line with the cash every time. Add computers and a little leverage, and your hedge fund will not only spectacularly outperform the market averages, but take on far less risk in the bargain.

    Of course, Wall Street firms which execute trades for hedge funds often have an advantage over the funds because they have inside knowledge of the trading plans. And they can and often do trade in advance of these moves to the detriment of the hedge fund customers. Recently, a jury convicted three former stockbrokers at Bank of America, Merrill Lynch and Smith Barney for placing open telephone lines next to the internal speaker systems to eavesdrop on block orders by hedge funds and other institutional clients.

    The hedge funds are run by bright people. They caught onto this scam quickly. And rather than miss out, they joined forces with the Wall Street firms themselves to combine their financial power in concerted transactions, which makes the markets even more volatile. Mighty orchestrations of computer-driven buy and sell orders then exploit the minute-to-minute differentials of the stocks and their derivatives. Those differentials add up to trillions of dollars.

    Such bold moves trigger wild price swings and send skittish investors to the exits. But the solipsistic trading strategy is so wonderfully profitable to the insiders that any thought of calming the waters prompts snickers. Regulators don’t seem to care; they think these moves improve efficiency, seemingly without realizing that the traders create the conditions under which index arbitrage makes sense.

    A variant of this practice played a major role in sinking the banks during the credit crisis that began last year. Hedge funds began by shorting the banks, and then forced them into the toilet by shorting the same mortgage pools that banks carried on their balance sheets.
    Mark-to-market accounting created the impression that the banks were insolvent. This not only ensured that the short positions were profitable, but forced the Financial Accounting Standards Board to rush rule changes.

    Years ago, when commodity firms first adopted it, marking to the market seemed like a good idea, as investors need to know not only the cost basis of an asset, but also what it would fetch in the marketplace. Today it’s clear that the market transactions may have less to do with an asset’s actual valuation in a normal trading environment than with its desired valuation in a manipulated one.

    Having ruined the banks, these same swindlers turned on the insurance companies whose short interest skyrocketed in tandem with the crashing of their shares because their annuity products were backed by the same triple-A rated mortgage bonds that reposed on the banks’ balance sheets. Ironically, some firms, such as Lincoln National, ended up buying banks to qualify for bailout money so that they could continue in business.

    The stakes to the economy may seem smaller when insurers — as opposed to banks — appear insolvent, but many alarmed customers were quick to move their business elsewhere at merely the whiff of insolvency. The consequences to both industries were such that for the first time in 16 years the finance and insurance sectors of the economy actually shrank by 16 percent. They now have to raise more equity just to keep their customers.

    The transactions at the source of these woes were the result of what one financial writer termed “regulatory somnambulism,” in that it allowed for the elimination of the up-tick rule — which stipulated that short sales be entered at a price that is higher than the price of the previous trade — and of naked short selling, which can sink a flagship faster than a broadside beneath the water line.

    Naked short selling is a vicious twist on the usual. Normal short selling occurs when investors borrow shares and sell them, hoping the stock will fall and they can buy back the shares at a lower price. Naked short selling artificially increases the supply of a security as one can sell them without first borrowing them and thereby might technically sell more shares than actually exist. This utterly speculative practice has no bearing on the efficiency of the markets, contrary to what its practitioners claim. Its only purpose is to flood the market with sell orders and drive down share prices.

    In doing so, it contributes to an inaccurate picture of financial stringency that plays a major role in the price and allocation of credit and capital, which is central to the proper running of the world economy. It’s a true tail wagging the dog phenomenon that enriches well-placed gamblers at the expense of everyone else.

    Tim Koranda is a former stockbroker who now works as a professional speechwriter. He can be reached at koranda@alum.mit.edu.

  • Can California Make A Comeback?

    These are times that thrill some easterners’ souls. However bad things might be on Wall Street or Beacon Hill, there’s nothing more pleasing to Atlantic America than the whiff of devastation on the other coast.

    And to be sure, you can make a strong case that the California dream is all but dead. The state is effectively bankrupt, its political leadership discredited and the economy, with some exceptions, doing considerably worse than most anyplace outside Michigan. By next year, suggests forecaster Bill Watkins, unemployment could nudge up towards an almost Depression-like 15%.

    Despite all this, I am not ready to write off the Golden State. For one thing, I’ve seen this movie before. The first time was in the mid 1970s. The end of the Vietnam War devastated the state’s then powerful defense industry, leaving large swaths of unemployment and generating the first talk about the state’s long-term decline.

    An even scarier remake came out in the 1990s. Everything was going wrong, from the collapse of the Soviet Union and the unexpected deflating of Japan to a nearly Pharaonic set of plagues, ranging from earthquakes and fires to the awful Los Angeles riots of 1992.

    Yet each time California came roaring back, having reformed itself and discovered new ways to create wealth. In the wake of the early ’70s decline came the first full flowering of Silicon Valley as well as other tech regions, from the west San Fernando Valley to Orange and San Diego counties. Much of the spark for this explosion of growth came from those formerly employed in the defense and space sectors.

    The ’90s recovery was even more remarkable. Amazingly, the politicians actually were part of the solution. Aware the state’s economy was crashing, the state’s top pols–Assembly Speaker Willie Brown, Sen. John Vasconcellos, Gov. Pete Wilson–made a concerted effort to reform the state’s regulatory regime and otherwise welcomed businesses.

    The private sector responded. High-tech, Hollywood, international trade, fashion, agriculture and a growing immigrant entrepreneurial culture all generated jobs and restored the state’s faded luster.

    These sectors still exist and still excel even under difficult conditions. The problem this time is that the political class seems clueless how to meet the challenge.

    Politics have not always been a curse to California. In the 1950s and 1960s, the Golden State’s growth stemmed in large part from what historian Kevin Starr describes as “a sense of mission” on the part of leaders in both parties. Starr chronicles this period in his forthcoming book, Golden Dreams: California in an Age of Abundance, 1950-1963.

    Under figures like Earl Warren, Goodwin Knight and Pat Brown, Starr notes, California “assembled the infrastructure for a great commonwealth.” Their legacy–the great University system, the California Water Project, the freeways and state park system–still undergirds what’s left of the state economy.

    Perhaps the best thing about these investments was that they helped the middle class. Sure, nasty growers, missile makers and rapacious developers all made out like bandits–which is why many of them also backed Pat Brown. But the ’50s and ’60s also ushered in a remarkable period of widespread prosperity.

    Millions of working- and middle-class people gained good-paying jobs, and could send their children to what was widely seen as the world’s best public university system. People who grew up in New York tenements or dusty Midwest farm towns now could enjoy a suburban lifestyle complete with single-family homes, cars, swimming pools and drive-through hamburger stands.

    “This was an epic success story for the middle class,” historian Starr notes. It’s one reason why, when people ask me about my politics, I proudly identify myself as a Pat Brown Democrat.

    That’s why California’s current decline is so bothersome. A state that once was home to a huge aspirational middle class has become increasingly bifurcated between a sizable overclass, clustered largely near the coast, and a growing poverty population.

    Over the past 40 years California’s official poverty rate grew from 9% to nearly 13% in 2007, before the recession. Three of its counties–Monterey, San Francisco and Los Angeles–boast large populations of the über rich but, adjusted for cost of living, also suffer some of the highest percentages of impoverished households in the nation.

    Most worrisome has been the decline of the middle–the increasingly diverse ranks of homeowners, small business people and professionals. The middle has been heading out of state for much of the past decade. Politically, they have proven no match for the power of the wealthy trustfunders of the left, the powerful public employee union as well as a small, but determined right wing.

    The good news is that the middle class shows signs of stirring. The nearly two-to-one rejection of the governor’s budget compromise reflected a groundswell of anger toward both the Terminator and his allies in the legislature.

    Simply put, California voters sense we need something more than an artful quick fix built to please the various Sacramento interest groups. Required now is a more sweeping revolutionary change that takes power away from the state’s most powerful lobby, the public employees, whose one desired reform would be ending the two-thirds rule for approval of new taxes and budgets.

    Middle-class Californians are asking, with justification, why we should be increasing taxes–we’re ranked sixth-highest in the nationto pay for gold-plated state employee pensions as well as an ever-expanding social welfare program. Although state spending has grown at an adjusted 26% per capita over the past 10 years, it is hard to discern any improvement in roads, schools or much of anything else.

    As an opening gambit, the right’s solution–strict limits on state spending–makes perfect sense. However, long-lasting reform needs to be about more than preserving property and low taxes. To appeal to the state’s increasingly minority population, as well as the younger generation, a reform movement also has to be about economic growth and jobs.

    Not surprisingly, local leaders of the “tea party” movement gained some profile from last week’s vote. Yet the right, which has exhibited strong nativist tendencies, is not likely to win over an increasingly diverse state.

    In my mind, California’s revival depends on three key things. First, the lobbyist-dominated Sacramento cabal needs to be shattered, perhaps turning the legislature into a part-time body, as proposed by one group. Perhaps the cleverest plan has come from Robert Hertzberg, a former Speaker of the Assembly who heads up the reformist California Forward group.

    Hertzberg proposes a radical decentralization of power to the state’s various regions, as well as cities and even boroughs in urban areas like Los Angeles. This would break the power of the Sacramento system by devolving tax and spending authority to local governments.

    Secondly, California needs to develop a long-term economic growth strategy. Over the past decade, California’s growth has become ever more bubblicious, dependent first on the dot-com bubble and then one in housing. The basic economy–manufacturing, business services, agriculture, energy–has been either ignored or overly regulated. Not surprisingly, we could see 20% unemployment, or worse, in places like Salinas and Fresno by next year.

    Third, both political reform and an economic strategy aimed at restoring upward mobility depends on a revival of middle-class politics in this state. It would include building an alliance between the more reasoned tea partiers and saner elements of the progressive community.

    The new alliance would not be red or blue, liberal or conservative, but would represent what historian Starr calls “the party of California.” At last there could be a political home for Californians who are angry as hell but still not yet ready to give up on the most intriguing, attractive and potentially productive of all the states.

    This article originally appeared at Forbes.

    Joel Kotkin is executive editor of NewGeography.com and is a presidential fellow in urban futures at Chapman University. He is author of The City: A Global History and is finishing a book on the American future.

  • Sweden’s Taxes – The Hidden Costs of The Welfare State

    By Nima Sanandaji and Robert Gidehag

    Sweden is a nation with extraordinary high tax rates. The average worker not only pays 30 percent of her or his income in visible taxes, but, additionally, close to 30 percent in hidden taxes. The defenders of the punishing tax burden argue that it is needed to maintain Sweden’s generous welfare system. While this claim may seem reasonable on its surface, a deeper look suggests that it is based on flawed analysis.

    Some level of taxation is, of course, required to fund the public sector. At the same time, a high level of taxation does not necessarily translate into an equally high level of welfare:

    Taxes discourage work and encourage tax avoidance. There is strong evidence that Sweden’s highest rate of individual and capital taxation actually reduces public revenue. For this reason, some taxes, such as the wealth tax, have recently been reduced. The result is estimated to be a net increase in tax revenues.

    When Swedish municipalities receive increased funding from the state, the money is used to expand the local bureaucracy, a government survey has shown, instead of going to educators and health care workers.

    Municipalities provide much of the welfare in Sweden. The Swedish Association of Local Authorities and Regions have shown in a study that funding for Swedish municipalities grew dramatically between 1980 and 2005. Despite this, the general public consensus is that the quality of welfare has declined during the same period.

    Welfare provisions don’t necessarily correspond with taxation levels. A 2005 research paper examines the efficiency of the public sector in 23 industrialized countries. The researchers found that Sweden only reaches a mediocre 12th place when it comes to how much the public sector provides in terms of welfare services. When the level of welfare is related to the level of taxation, Sweden falls to the last position in the index.

    There is a high variation in how effectively public money is spent within Sweden. The Swedish Taxpayers Association has, in a number of surveys, shown that identical welfare services such as care of the elderly, can vary in cost quite dramatically across Sweden.

    There are two important reasons why the average Swedish worker pays a large portion of her or his income in taxes, without necessarily receiving an equally high level of welfare.

    First, much of the money is spent on administrative costs at various levels of government. Although a small nation, Sweden has over a hundred public authorities. Vast sums are spent on political projects which fall outside the frames of general welfare. It is, for instance, not unusual for Swedish municipalities to fund bowling alleys, swimming pools, or camping places.

    Second, a large fraction of the population is living on benefits rather than working, due to the combination of high taxes, a rigid labour market and generous welfare benefits. Even before the economic crisis hit, for example, almost one out of five children in Sweden’s third largest city, Malmö, were living in a family supported by social security. Sweden has 105 local districts where the majority of the population lives off of various public benefits, and does not work. This unintended consequence of the welfare state has taken a heavy toll on public services, since an increasing share of tax revenue must be diverted to fund welfare payments, rather than social services.

    Many are immigrant dense neighborhoods; others are situated in the northern part of Sweden, where many cities with stagnating economies have suddenly experienced a boom in the fraction of the population who cannot work due to disability.

    The famous Swedish welfare state is to a large degree a notion of the past. Many feel that its glory days occurred during the late 1950s and early 1960s, when Sweden successfully combined welfare policies with an expanding economy. At that time, however, Swedish taxes were 27 percent of the GDP, compared to 47 percent today. The golden days of Swedish welfare did not coincide with the high tax regime we know today.

    How could Sweden fund a prospering welfare system with relatively low taxes in the past? As the researcher Erik Moberg documents in a book for the Ratio Institute, public money was spent much differently back then. The share of public revenues spent on health care and education at the end of the 1950s was greater than it is today.

    And, compared to the 1950s, close to three times as much of public revenues are now spent on public bureaucracy. Four times as much is spent on welfare payments and social insurance. As the level of taxation has increased, so has the share of taxes going to public bureaucracy and various government handouts.

    The historical comparison with the 1950s and 1960s is worth thinking about. It shows that a high quality of welfare can be achieved with a much lower tax level than we have today. If politicians slim down public bureaucracy and cut wasteful spending, resources can be opened up for increasing welfare and reducing taxes at the same time. If the system rewards work to a greater degree than it does living off the state, fewer will be dependent on the public for their daily living, again opening up tax revenues for better use.

    Sweden has long been a small homogeneous country with a high degree of economic equality. Strong norms related to work and responsibility made it possible to enact an effective welfare system early on. With time, however, welfare dependence has reduced the very norms that formed the foundation of Swedish welfare, and wasteful spending has increased.

    Many important social outcomes that the welfare state aims to address, and that Sweden is famous for, such as a low crime rate, have increased in recent decades, concurrent with the expansion of the welfare state. Even income inequality has increased in Sweden compared to, for example, the 1980s, despite similar or higher public expenditure.

    Swedish decision makers are doing their best to reduce public spending and lower taxes. The reforms have been highly successful so far. As taxes have decreased from 57 percent of GDP in 1989 to 47 percent of GDP in 2009, the incentives to work have improved, with Swedish growth rates benefiting. The convergence of lower taxes and lower public spending is likely to continue. After all, experience has made it quite apparent for many Swedes that extraordinary high taxes are not the key to qualitative welfare services and a well functioning society.

    Nima Sanandaji is president of think tank Captus and a fellow at the Swedish Taxpayers Association. Robert Gidehag is president of the Swedish Taxpayers Association.

  • City & Suburban Trends: Sometimes it Helps to Look at the Data

    Jonathan Weber writes that “Most demographic and market indicators suggest that growth and development across the country are moving away from the suburban and exurban fringe and toward center-cities and close-in suburbs,” in an article for MSNBC entitled Demographic trends now favor downtown: Growth across the country moves away from suburban and exurban fringe.

    One might wonder what country Weber is writing about. In the United States, growth and development continues to be concentrated in suburban and exurban areas. Moreover, strong domestic migration continues away from the center cities and close-in suburbs, as evidenced by the fact that between 2000 and 2008, 4.6 million domestic migrants left the core counties of the metropolitan areas over 1,000,000 population, while 2.0 million moved into the suburban counties.

    The case is apparently furthered by the obligatory reference and photograph of The Model, Portland, Oregon. However, even in Portland, the suburbs are doing far better than the core. Since 2000, the suburbs have gained 106,000 domestic migrants, while the core county (Multnomah) has lost 4,000 domestic migrants. The IRS micro-data further indicates that the core continues to lose net domestic migration to the suburban counties.

    It appears that the only trend indicating that the suburbs are losing out to central cities is the exponential increase in articles blindly parroting “death of the suburbs” dogma.

  • Betting against the USA — told ya’ so!

    More than once in this space, I’ve said that derivative financial products set up a perverse incentive where investors have more to gain from the failure of companies and homeowners than their success. If you haven’t seen it yet, take a look at the longer version of my description of the causes and consequences of the current crisis to understand how failed financial innovations, like credit default swaps, contributed to the meltdown of 2008. I wrote that article back in November.

    Once again, only Bloomberg.com is out front on this story. More hedge funds are catching onto the casino-like qualities of betting against America’s economic success. Reporters Salas, Harrington and Paulden could have quoted my NewGeography writings directly: “companies [have] more credit-default swaps outstanding than the bonds the contracts protected…” and, referring to Clear Channel Communications, “some of its creditors stand to profit from its failure.”

    Told ya’ so!

  • Life After Sunrail

    With their tails between their legs, Central Florida’s leaders returned from Tallahassee in early May without funding from the Florida Senate for Sunrail, the region’s proposed commuter rail system. This failure to convince the state Senate to fund Sunrail is a major political defeat for the 1.8 million people who were said to be served by this train. This failure now gives Central Florida a chance to recreate its growth scenario from scratch, without relying on commuter rail to cure the region’s ills.

    Blame bad timing: In a low-tax state with a down economy, asking for that kind of money takes nerve. “The loss of Sunrail may…have implications for efforts to reconstruct Interstate 4,” stated Harold Barley, Executive Director of Metroplan Orlando, a publicly funded organization that studies and advocates transportation projects in the region. Barley’s understatement is almost droll, for the defeat signals a significant political loss, years of wasted effort, and a rejection (for the second time) of massive federal startup money. In short, the calculus of Central Florida’s growth must start again almost from zero.

    The leaders now will lick their wounds, but is it really time to ask “what comes next?” Many of the arguments in favor of Sunrail echo the arguments that Wendell Cox devastated earlier in The New Geography. After their first defeat in 1999, the leaders of the region spent ten years convincing themselves of the merits of commuter rail, but without selling the same goods to others in the state of Florida. This region’s population now waits, while the leaders decide whether to sink ten more years into trains, or abandon this dream and begin writing a new story for Orlando.

    It is time to find a growth vision that is viable, and can be implemented within the power of the region’s leadership. Commuter rail’s biggest claim was to take one lane off the region’s only north-south highway (Interstate 4), replacing this lane with trains on an existing track. The track runs like a twisty, bent stick right up through the center of the region, and the track’s original usage as a freight system has been largely passed by the region’s growth. Sunrail’s other claims included significant travel time savings, encouragement of transit-oriented development, and retainage of 20 percent of the region’s federal gas taxes (why aren’t we getting this money now?). These claims will never be tested against reality; meanwhile, many of the smaller towns served by the system are likely expressing quiet relief that commuter rail’s financial burden will not be turned over to them in 2017.

    No doubt, this loss is disappointing to those who envision Washington DC, Atlanta, New York, Boston, or other entrained cities as a model. Yet it constitutes a perfect signal to create a unique vision for Orlando. Unlike the regions mentioned above, Orlando’s economy is shockingly monocultural, devoted mostly to tourism and supporting industries. The most significant way Central Florida can better its future is to attract and retain other forms of employment, rather than build another rigid transportation spine of questionable sustainability.

    Of course, transportation choices can help, but the question of rail seems academic at this point. Diversification of transportation away from a single imagined commuter rail means, for one thing, that the regional bus system should become more effective than it currently is. Lynx currently operates one bus type (huge), and this “one size fits all” solution misses opportunities and makes for slow rides with multiple transfers. Lynx is referenced in commuter rail’s promotional literature, which vaguely promised “enhanced bus service” to feed commuter rail stops. If Lynx was indeed poised to enhance bus service, then that act is more important now than ever. What are we waiting for?

    Instead of a rigid stick up the center of a dispersed, multipolar city, the new wave of commuter transportation might look more like an octopus, which has no backbone and multiple wiggly arms. No backbone means the system may resemble a network, rather than a trunk with branches. Wiggly might mean that smaller vehicles service localized neighborhood routes, and it also might mean that the routes could change depending on development and growth patterns. If either of these sounds questionable from a cost point of view, weigh them against the cost of commuter rail and they will look like amazing bargains. Whether a bureaucratic government agency like Lynx can handle this assignment may also be questionable. Perhaps the solution could involve private services, much like the commuter systems that were born in earlier times – the streetcars in San Francisco, for example – which operated for profit.

    Some will argue that trains are sexy compared to buses, but it is time to look at what really is sexy: having a real choice to commute while saving money. The form of this new transportation system may be electric jitneys, rubber-tired trolleys, or lake-hopping hovercraft; what is more important than form is their functional qualities. The transportation planners, from the federal level down to the local level, need to truly understand the needs of people and respond to them in a more fine-grained way. Diversification may mean trying different ideas until one is found that works.

    Diversification could also mean less transportation. If the goal of a commuter rail system was to take cars off the interstate, then perhaps the leadership could meet this goal by promoting employment-based growth, rather than growth for its own sake. Neighborhoods that support an employment center are what built the region – think Lake Eola around downtown, or Winter Park around Rollins College. Getting back to that will allow density clusters that have sustainable value, rather than be form-based simulacra of antique small towns.

    Density clusters can be positive parts of a city, where residential and employment bases are intertwined, and need not drive affordability up out of reach. Orlando, as an aspirational city, is currently more affordable than most, and the multiple-center model of Orlando never seemed to quite fit the single-spine commuter rail model. Cluster spacing allows for lower-density infill regions which can appeal to both middle class and affluent families. True commuter rail serviced the late 19th century single-center city quite well, but it would be hard to effectively service the late 20th century multiple-center, edge-city conditions of Orlando. With no natural boundaries, the region will continue to grow in all directions, and continue to regenerate itself within the urban centers that collapse and renew themselves through generations.

    Losing a battle could mean winning a war. The Orlando region has for too long been thought of as an ephemeral city composed of theme parks. Losing its commuter rail system will reinforce this perception, but it can also shock the region’s leadership into more profound thinking and action. By taking advantage of this loss, and shaking off the distraction of trains, the region can truly concentrate on diversification of its population and creating a flexible, cost-sustainable, multi-centered transportation system that could ably serve Central Florida’s needs for the future.

    Richard Reep is an Architect and artist living in Winter Park, Florida. His practice has centered around hospitality-driven mixed use, and has contributed in various capacities to urban mixed-use projects, both nationally and internationally, for the last 25 years.

  • The Successful, the Stable, and the Struggling Midwest Cities

    The Midwest has a deserved reputation as a place that has largely failed to adapt to the globalized world. For example, no Midwestern city would qualify as a boomtown but still there remain a diversity of outcomes in how the region’s cities have dealt with their shared heritage and challenges. Some places are faring surprisingly well, outpacing even the national average in many measures, while others bring up the bottom of the league tables in multiple civics measures.

    Let us examine the health of various cities, using population growth as a heuristic proxy for overall civic health. Looking at population change from 2000 to 2008, we will classify a city as “successful” if its metro area population growth exceeded the national average growth rate of 8% during that period, as “stable” if it had a population growth rate between 3% and 8%, and as “struggling” if its growth was less than 3%. Let us also put Chicago into its own category of “global city”. It is simply one of a kind in the Midwest, a colossus of nearly 10 million people, and not easily measured against the other cities. Indeed, it is really three cities in one, a prosperous urban core, an archipelago of successful upscale suburbs and edge based growth to the west and north, with a sea of deteriorating city neighborhoods and stagnant to declining suburbs surrounding them. On our scale, Chicago would be “stable” – its inner core has grown but the city overall has lost population, while the outer ring has grown strongly. As a region, it has grown somewhat below the national average.

    Here are the results of our tiering, including all cities in the Midwest* with metro areas exceeding 500,000 in population:

    Global City
    Chicago (5.2%)

    Successful Cities
    Des Moines (15.6%)
    Indianapolis (12.5%)
    Madison (11.9%)
    Columbus (9.9%)
    Kansas City (9.0%)
    Minneapolis-St. Paul (8.8%)

    Stable Cities
    Cincinnati (7.2%)
    Grand Rapids (4.9%)
    St. Louis (4.4%)
    Milwaukee (3.2%)

    Struggling Cities
    Akron (0.5%)
    Detroit (-0.6%)
    Dayton (-1.4%)
    Toledo (-1.5%)
    Cleveland (-2.8%)
    Youngstown (-6.1%)

    These tiers, based only on a single criterion and arbitrary boundaries, nevertheless basically conform to how these cities are performing both economically and in terms of perceptions.

    A few interesting things emerge:

    1. There are a surprisingly large number of Midwestern cities that are growing faster than the US average population. This indicates pockets of strength, in its larger metros at least, seldom associated with the Midwest.
    2. The clear dominance of the successful list by state capitals. This is so pronounced that I have put forth what I call the “Urbanophile Conjecture”, which is that if you want to be a successful Midwestern city, it helps to be a state capital with a metro area population of over 500,000. The only successful city on the list that is not a state capital is Kansas City.
    3. The 500,000 barrier seems to be important as well. The state capitals below that threshold – Lansing, Springfield, and Jefferson City – would not qualify as successful on this list. Note too that the presence or absence of the major state university does not appear to be a decisive factor. Des Moines and Indianapolis are not home to their states’ flagship universities. The home of the academic powerhouse that is the University of Michigan is the Ann Arbor metro area, which was not included in this list because its population is only about 350,000. Notwithstanding, its growth rate would have put it into the stable category.
    4. In a region in which there is such divergence between the performance of cities, a diversity of city specific policies are required. There is no one size fits all for the Midwest. There may indeed be a base of pan-Midwest policies worth pursuing – improvements in education, attractiveness to migrants, better conditions for innovative entrepreneurship, etc – but successful approaches will be those most tailored to uniquely local conditions. For example, a state capital or University town may have different needs than a place that has neither.

    Some suggested areas to investigate by city tier are:

    • Chicago. How can it ease the gap between the thriving global city of Chicago – largely located around the Loop as well as the northern and western suburbs – and the parts of the region that are falling behind, largely the western city neighborhoods and southern edge of metropolis? How do you do this without sacrificing its overall competitiveness? Can the policies appropriate to each be reconciled?
    • Successful Cities. Their policy focus should be on maintaining favorable demographic and economic conditions, and dealing with decaying areas of their urban cores and the potential for decay in some inner ring suburbs. Should the civic aspiration be desirous of it, tuning the engine to attempt to shift the growth rate into high gear to target a profile closer to the Sunbelt boomtowns would be a further focus area. Each city would need to examine which specific policy levers it could pull to attempt to do this. Clearly modernizing and expanding infrastructure to keep up with growth in these places and maintain their high quality of life is a clear imperative.
    • Stable Cities. Their challenge is to bring growth rates up to average or above average levels. It would be worthwhile for them to study the successful areas, and ask what policies and approaches might be adopted. Kansas City offers the best encouragement here. It has managed to maintain a strong growth rate despite not being a state capital and being part of a bi-state metro region. Kansas City features lows costs, high quality of life, a relatively stable housing marketing, and a pro-business culture. It is clearly a standout and worthy of further study for that reason. It may hold the key for moving the stable cities up into the successful tier. Geographically, it is notable that Kansas City is a border state on the far edge of the Midwest, and could arguably be called a Great Plains city. Is that a factor? Some type of peer city comparison with the successful cities, and especially Kansas City, might be warranted here.
    • Struggling Cities. Unfortunately, there isn’t a magic bullet to solve the long festering problems in these places. All of them were heavily industrialized and have borne the brunt of globalization, particularly in manufacturing. This is especially the case in cities linked to the domestic automobile industry, which is clearly in a state of crisis. Until the automobile industry completes its restructuring, and out migration right sizes some of these areas, there does not seem to be a clear path to restart growth. Youngstown, which brings up the bottom of our league table, perhaps offers the best road forward. It is trying to right-size itself to a permanently smaller, but more sustainable, future population based on an aggressive controlled shrinkage plan that has received extensive national notice. This type of plan is likely something all of these cities need to be actively considering as the large fixed costs support a population base that no longer exists will become increasingly unaffordable as the population further shrinks. These cities likely also will need special state and federal help to back this shrinkage plan.

    * The Midwest is defined as Illinois, Indiana, Iowa, Michigan, Minnesota, Missouri, Ohio, and Wisconsin.

    Aaron M. Renn is an independent writer on urban affairs based in the Midwest. His writings appear at The Urbanophile.