Blog

  • Housing Downturn Update: We May Have Reached Bottom, But Not Everywhere

    It is well known that the largest percentage losses in house prices occurred early in the housing bubble in inland California, Sacramento and Riverside-San Bernardino, Las Vegas and Phoenix. These were the very southwestern areas that housing refugees fled to in search of less unaffordable housing in California’s coastal metropolitan areas (Los Angeles, San Francisco, San Diego and San Jose).

    Yet now the prices in these hyper-expensive markets are beginning to fall. Once considered widely immune from the severe housing slump, the San Francisco area now has muscled its way into the list of biggest losers. The newly published first quarter 2009 house price data from the National Association of Realtors indicates that prices are down 52.5 percent from the peak. Only Riverside-San Bernardino and Sacramento have experienced greater losses out of the 49 metropolitan areas with a population of more than 1,000,000 for which there is data (see table below). Other metropolitan areas that have seen prices drop more than 50 percent include Phoenix, Las Vegas and, for very different reasons, that rustbelt sad sack, Cleveland.

    Table 1
    Median House Price Loss: Metropolitan Areas Over 1,000,000 Population
    Rank Metropolitan Area
    Median House Price % Loss from 2000-2008 Peak
    Median House Price Loss from 2000-2008 Peak
          1 Riverside-San Bernardino, CA -57.7% $235,600
          2 Sacramento, CA -56.5% $219,600
          3 San Francisco, CA -52.5% $444,800
          4 Phoenix, AZ -51.9% $139,200
          5 Cleveland, OH -51.5% $74,300
          6 Las Vegas, NV -51.3% $163,800
          7 Los Angeles, CA -48.8% $289,400
          8 San Jose, CA -48.0% $415,000
          9 San Diego, CA -47.5% $291,900
        10 Miami-West Palm Beach, FL -47.3% $185,200
        11 Orlando, FL -43.1% $117,200
        12 Tampa-St. Petersburg, FL -42.2% $98,800
        13 Washington, DC-VA-MD-WV -37.3% $165,900
        14 St. Louis, MO-IL -35.8% $56,300
        15 Chicago, IL -35.2% $100,900
        16 Atlanta, GA -34.4% $60,600
        17 Memphis, TN-MS-AR -34.0% $49,400
        18 Providence, RI-MA -33.6% $102,600
        19 Boston, MA-NH -32.5% $140,200
        20 Cincinnati, OH-KY-IN -28.6% $42,600
        21 Richmond, VA -27.9% $66,800
        22 Indianapolis, IN -26.6% $34,300
        23 Minneapolis-St. Paul, MN-WI -25.9% $60,800
        24 Columbus, OH -24.5% $38,400
        25 Denver, CO -24.1% $61,200
        26 Birmingham, AL -23.2% $39,300
        27 Jacksonville, FL -22.4% $44,600
        28 Charlotte, NC-SC -22.1% $48,700
        29 New York, NY-NJ-PA -21.9% $104,700
        30 Virginia Beach-Norfolk, VA -21.2% $54,000
        31 Kansas City, MO-KS -20.4% $32,400
        32 Seattle, WA -20.1% $79,500
        33 Pittsburgh, PA -19.0% $24,300
        34 Hartford, CT -17.7% $47,800
        35 Portland, OR-WA -17.0% $51,100
        36 Baltimore, MD -16.3% $47,900
        37 New Orleans, LA -15.6% $27,800
        38 Philadelphia, PA-NJ-DE-MD -15.2% $37,000
        39 Louisville, KY-IN -15.1% $21,500
        40 Rochester, NY -14.5% $18,000
        41 Houston, TX -13.6% $21,800
        42 Dallas-Fort Worth, TX -13.5% $21,100
        43 Buffalo, NY -13.1% $15,000
        44 Milwaukee, WI -12.1% $27,800
        45 Salt Lake City, UT -6.7% $16,500
        46 San Antonio, TX -6.2% $9,800
        47 Austin, TX -6.1% $11,900
        48 Raleigh, NC -5.3% $12,600
        49 Oklahoma City, OK -3.3% $4,500

    Cleveland, the newest entrant to the “over 50” club, fell largely because of the collapse of its industrial economy. It remains the only one of the thirteen mega-losers without prescriptive land use policies (sometimes called “smart growth”), which raise house prices by rationing land for development and imposing more stringent regulatory requirements. Cleveland illustrates a point made in a previous commentary: that the huge house price losses in the housing downturn have spread broadly from the original metropolitan areas that precipitated Meltdown Monday, the Lehman Brothers bankruptcy on September 15, and the Panic of 2008.

    During Phase I of the housing downturn (through September 2008), the largest losses were concentrated in the “Ground Zero” markets of California, Florida, Las Vegas, Phoenix and Washington, DC. In each of these 11 markets, median house prices dropped at least 25 percent, with per house over $100,000 except in Tampa-St. Petersburg during Phase I. These markets, all with more prescriptive planning, accounted for nearly 75 percent of the gross house value loss in the nation, with other more prescriptive markets accounting for another 20 percent. The more responsive markets, where land use regulation follows more traditional market-driven lines, accounted for slightly more than 5 percent of the loss.

    The Chart below and Table 1 in The Housing Downturn in the United States: 2009 First Quarter Update financial collapse, however, now has spread the losses much more generally. In Phase II, the Ground Zero markets represented 44 percent of the loss, the other more prescriptive markets 38 percent and the more responsive markets 18 percent.

    As of the first quarter of 2009, prices had dropped in all major metropolitan areas. The average per house loss in the Ground Zero markets was still the highest, at 48 percent, though the overall all loss had increased to 34 percent.

    There are indications that the housing downturn may be slowing. The latest data indicates that the median house price increased in March, though not enough to forestall a loss in the first quarter. Another indicator is the fact that the Median Multiple (median house price divided by median household income) has fallen to a national level of 3.1, which is slightly more than the 2.9 historic rate and well below the 4.6 peak.

    The best news of all is that the Median Multiple has dropped to 3.8 in the Ground Zero markets, which is equal to the historic level and well below the peak of 7.3. In the other more prescriptive markets, the Median Multiple is at 3.5, above the 2.9 historic average but well below the peak of 4.8. In the more responsive markets, the Median Multiple has dropped to 2.6, just above the historic average of 2.5 and below the peak figure of 3.2.


    Prices have fallen so much that they now stand at historic 1980 to 2000 Median Multiple levels in 18 of the 49 metropolitan areas. Critically, this includes the Ground Zero markets of Riverside-San Bernardino, Sacramento, Phoenix and Las Vegas.

    Other Ground Zero markets have seen much of their price inflation whittled away, but still have a way to go. Prices need to decline $33,500 to reach the historic Median Multiple level in Los Angeles, $32,300 in Miami, $31,200 in Washington, $18,500 in San Francisco, $11,100 in San Diego and only $1,700 in Tampa-St. Petersburg.

    In other markets, however, prices still have some distance to go before the historic Median Multiple is reached. The largest decrease would have to occur in New York, at $122,000, followed by Portland ($95,000), Seattle ($94,000), Baltimore ($75,000) and Salt Lake City ($74,000). Other markets, including Philadelphia, Virginia Beach, Milwaukee and Ground Zero San Jose would need to have price declines of more than $50,000 to restore their historic Median Multiples. See Table 2.

    Table 2
    Median House Price Reduction Required to Reach Historic Price/Income Ratio (Median Multiple)
    Median House Price Reduction Required to Reach 1980-2000 Median Multiple
    Median Multiple
    Rank Metropolitan Area
    1980-2000 Average
    2000-2008 Peak
    Current (2009: 1st Quarter)
          1 New York, NY-NJ-PA $122,200             3.9            7.7           5.8
          2 Portland, OR-WA $94,700             2.7            5.4           4.4
          3 Seattle, WA $94,400             3.3            6.2           4.7
          4 Baltimore, MD $74,700             2.6            4.6           3.7
          5 Salt Lake City, UT $73,800             2.6            4.3           3.8
          6 Philadelphia, PA-NJ-DE-MD $61,500             2.4            4.2           3.4
          7 San Jose, CA $55,400             4.5          10.2           5.1
          8 Virginia Beach-Norfolk, VA $53,600             2.6            4.7           3.5
          9 Milwaukee, WI $51,400             2.8            4.4           3.8
        10 Boston, MA-NH $41,900             3.5            6.1           4.1
        11 Los Angeles, CA $33,500             4.5          10.1           5.1
        12 Miami-West Palm Beach, FL $32,300             3.4            7.0           4.0
        13 Jacksonville, FL $32,000             2.3            3.6           2.9
        14 Washington, DC-VA-MD-WV $31,200             2.9            5.3           3.3
        15 Providence, RI-MA $29,400             3.1            5.4           3.6
        16 Raleigh, NC $26,700             3.3            3.9           3.7
        17 Austin, TX $20,500             2.8            3.3           3.2
        18 San Francisco, CA $18,500             5.0          11.2           5.2
        19 Denver, CO $18,000             2.9            4.3           3.2
        20 Minneapolis-St. Paul, MN-WI $15,700             2.4            3.6           2.6
        21 Hartford, CT $14,300             3.1            4.2           3.3
        22 San Diego, CA $11,100             4.9            9.5           5.1
        23 Buffalo, NY $10,900             1.9            2.5           2.1
        24 Charlotte, NC-SC $10,100             3.0            4.1           3.2
        25 Richmond, VA $9,500             2.8            4.1           3.0
        26 Louisville, KY-IN $8,100             2.4            3.1           2.6
        27 Chicago, IL $7,800             2.9            4.8           3.0
        28 San Antonio, TX $5,200             3.0            3.3           3.1
        29 Orlando, FL $4,000             2.9            5.2           3.0
        30 Pittsburgh, PA $3,400             2.1            2.8           2.2
        31 Tampa-St. Petersburg, FL $1,700             2.8            4.7           2.8
    Las Vegas, NV  At or Below              3.4            5.3           2.7
    Riverside-San Bernardino, CA  At or Below              3.7            6.6           3.0
    Sacramento, CA  At or Below              3.6            5.6           2.8
    Memphis, TN-MS-AR  At or Below              3.0            3.1           2.0
    New Orleans, LA  At or Below              3.1            3.3           2.8
    Phoenix, AZ  At or Below              2.8            4.7           2.4
    Atlanta, GA  At or Below              2.4            3.1           2.0
    Birmingham, AL  At or Below              3.0            3.5           2.7
    Cincinnati, OH-KY-IN  At or Below              2.3            2.8           2.0
    Cleveland, OH  At or Below              2.2            2.8           1.4
    Columbus, OH  At or Below              2.4            2.9           2.2
    Dallas-Fort Worth, TX  At or Below              2.7            2.7           2.4
    Houston, TX  At or Below              2.5            2.9           2.5
    Indianapolis, IN  At or Below              2.1            2.3           1.7
    Kansas City, MO-KS  At or Below              2.5            2.9           2.3
    Oklahoma City, OK  At or Below              2.8            2.9           2.8
    Rochester, NY  At or Below              2.2            2.4           2.0
    St. Louis, MO-IL  At or Below              2.2            2.9           1.9
    Median Multiple: Median house price divided by median household income.

    These price reductions may or may not occur in over-valued metropolitan areas like New York, Portland and Seattle, all of which are also experiencing serious increases in unemployment. However, given the pervasive evidence that the market is returning to the vicinity of historic price ratios, it would not be surprising if significant price reductions happen in these metropolitan areas, which were previously seen and saw themselves as immune to the fallout that hit the less well-regarded ground zero markets.

    Additional information is available in:
    The Housing Downturn in the United States: 2009 First Quarter Update

    Wendell Cox is a Visiting Professor, Conservatoire National des Arts et Metiers, Paris. He was born in Los Angeles and was appointed to three terms on the Los Angeles County Transportation Commission by Mayor Tom Bradley. He is the author of “War on the Dream: How Anti-Sprawl Policy Threatens the Quality of Life.

  • California Meltdown: When in doubt, Blame the Voters!

    By rejecting the complex Sacramento budget settlement, Californians have brought about an earthquake of national significance as has not been seen since the passage of Proposition 13 over thirty years ago. Once again, California voters handed politicians something they fear more than anything else, constraints on the ability to raise taxes and raid revenues for their pet interests.

    Some, like long time Los Angeles Times statehouse reporter George Skelton thinks it’s the voters’ fault, as he suggested in his recent op-ed. The problem, we are told, lies with voters. The state’s massive fiscal crisis, which I and others warned was coming, was apparently unforecastable to California politicians and their enablers, like Skelton.

    Blame the voters will become a large part of the national and local media spin. It is not the first time. Consider Proposition 13. The problems that led up to Prop 13 were years in the making, and they were well understood. Inflation and rising home prices were increasing taxes beyond what citizens were prepared to pay. Sacramento tried several times to address the problem, but then as now, politicians couldn’t make hard decisions. The entrenched interests, notably the public employee unions, would not hear of anything that might shrink state revenues.

    Contrary to some versions of history, Proposition 13 was not backed by oil companies, land developers and other business interests. In fact, most opposed it.

    Proposition 13 backers were outmanned, outspent and certainly without much media support. The measure was passed because after years of incompetence in Sacramento, California voters, like Medieval peasants, grabbed their pitchforks and torches and stormed the castle. They passed Prop 13.

    Some interpret this story as showing voter ignorance and fickleness. I interpret it as showing that California voters are patient, but only to a point. Once they have reached a certain point, California voters take matters into their own hands. The results are invariably far more onerous for the state than if the political class had effectively faced the issue. Part of the reason for this is because the voters have fewer tools available to them. Legislatures and governors may have scalpels, voters have only axes.

    Gray Davis was the victim of a similar uprising. He took the fall for a government that had failed. Arnold was going to be different. He would be the Governator. He won election promising mortal combat with special interests. In 2005, he tried to change things but was outmaneuvered by his union-backed opponents. After losing round one, he became Gray Davis but without his predecessor’s grasp of the essentials of government. As the Sacramento Bee’s Dan Walters has pointed out, hubris and ignorance make a deadly combination.

    Now, we have a budget crisis, and California voters are unwilling to give Sacramento a pass. Why?

    Maybe they don’t think they are getting value for their increased investment in government. California spent about $2,173 per resident (2000 dollars) in the 1997-1988 budget. The 2007-2008 budget spends about $2,738 (2000 dollars) per resident. That represents a 26 percent increase in real (inflation adjusted) per-capita spending in ten years.

    What have California voters purchased with their 26 percent increase in government spending? Are the roads 26 percent better? Are schools 26 percent better? What is 26 percent better?

    That is Sacramento’s problem. It is very hard to identify what good that this increase in spending has purchased. If it has been a good investment, why haven’t California’s leaders convinced the voters?

    Maybe you can make a case that we are 26 percent better off; maybe not. I don’t know, but then I haven’t seen a strong effort to make the case. Instead, we get predictions of doom. We’ll cut back on teachers. We’ll let prisoners out of jail. Skelton says “And, oh yes, the elderly poor, blind and disabled – welfare moms and children’s healthcare? They’ll take the biggest hits, as usual.”

    The problem with predictions of doom is that they don’t ring true, or they sound as if the political leaders will punish voters for forcing the leaders to face a budget constraint. Voters can remember 1997-1998. California had teachers. Prisoners were in jail. Healthcare was provided for those with the least resources. If California had these essential services then, and the State is spending 26 percent more now, why cut those essential services now?

    That is the question the California’s leaders have to answer soon. Today Sacramento faces a crisis. The governor and the legislature will have to deal with a real binding budget constraint, and how they choose to deal with that constraint will make a huge difference. They could show leadership. They could make difficult choices. They could stand up to the special interests that will spare no effort to punish them.

    They may not. They may try to punish voters by cutting essential services. They may try even more Enron-style accounting tricks. They may sell assets or use federal money to push the problem to future legislators and governors. They may make poor choices. They may avoid cutting entitlements and public employee pensions, the real source of the state’s fiscal distress.

    We are heading towards a convulsion, not only here in California but in a host of high-tax, high-regulation states now controlled by their own employees. This includes New York, Illinois, and New Jersey for starters. In the age of Obama, with its celebration of bigger government, this suggests perhaps a whiff of a counter-revolution.

    Bill Watkins, Ph.D. is the Executive Director of the Economic Forecast Project at the University of California, Santa Barbara. He is also a former economist at the Board of Governors of the Federal Reserve System in Washington D.C. in the Monetary Affairs Division.

  • Let’s Snooker The TARP Babies

    Snook, Texas, a town of less than 600 souls, is best known for being the home of Sodalak’s Country Inn, the originator of country fried bacon. It may seem an odd place to launch a return to financial health, but that’s exactly what Dean Bass has in mind.

    Bass, a veteran banking entrepreneur from Houston, in November bought the tiny First Bank of Snook as part of his plan to build a new financial powerhouse amid the worst economic downturn in a generation. The old bank, which also had a branch 15 miles away in College Station, home to Texas A&M, provided Bass with his charter, as well as access to a strong market on the far periphery of his home town.

    Since buying into Snook’s bank, now renamed the Spirit of Texas Bank, Bass opened a new branch in the Woodlands, northwest of Houston. Over the past six months, the new bank’s assets have doubled to over $70 million, and by the end of the year he expects to break $100 million. Longer-term plans include expanding as well into Austin, Fort Worth and other major Texas markets.

    Bass’ basic strategy: Take advantage of the stumbling TARP-funded banking giants and steal what he calls their “disenfranchised customers.” This approach has implications well beyond the Lone Star State. Like other successful community bankers across the country, Bass believes that the mega-banks have been hopelessly tarred by TARP taxpayer funds. They have been revealed to be, if too big to fail, also too incompetent and poorly run to trust.

    “This is one of the worst banking markets I have ever seen–but the best for people like me,” said Bass, who sold his last venture, Houston-based Royal Oaks Bank, for $38.6 million in 2007. “When else would you see A+ customers fleeing places like Bank of America, Chase and Citi? People can’t even understand their balance sheets and stress tests. Their customers are ready to move on.”

    Over the next few years, the emergence of banks like Spirit of Texas could prove the silver lining in the largely bungled Bush-Obama bail out of the big financial companies. Ironically, the attempt to shore up the mega-dinosaurs has revealed these mega-banks to be creatures of little brain and even less principle. They now seem more akin, as economist Simon Johnson has pointed out, to Third World crony capitalists than paragons of free enterprise.

    In comparison, independent, non-TARP banks like the Spirit of Texas appear like paragons of traditional capitalist virtue and homespun values. For the time being, their rise will be most notable in “the zone of sanity,” the vast range of territory between south Texas to the Great Plains, which largely resisted the housing and stock asset bubbles of the past decade.

    In this region, most homes are well above water and many businesses–in everything from agriculture and energy to manufacturing and high-end business services–remain on solid footing. Of course, notes Randy Newman, president and CEO of Grand Forks, N.D.-based Alerus Financial, many local companies have been slowed by the recession. However, for the most part, places like the Dakotas and Texas enjoy relatively low unemployment and foreclosure rates, making them relatively good places for cultivating new customers.

    Politics and a sense of propriety also may play a role for resurging community banks. In places like the Great Plains, people prefer old-fashioned shots of banking fundamentals to the exotic financial cocktails concocted by the “genius” financiers on the coast. Politicization of banking is even less popular than elsewhere.

    “For the government to come out and stimulate the economy seems OK, but you think, jeepers, this TARP business makes little sense,” says Newman, whose bank enjoys assets of roughly $750 million. “TARP,” he adds, “is simply prolonging or delaying what has to happen. The walking dead will have to die sometime.”

    Uncertainty about the big banks, Newman believes, is leading customers, particularly smaller firms, to rediscover the merits of old-fashioned relationship banking. At banks like his, each loan is scrutinized not only by formula but also by things such as character, markets and a firm’s record of accomplishment.

    “The big banks will tweak their standards system-wide. There are no individuals in their book,” says Newman.” The big banks are geared to mass markets and big customers. But if you are looking at the $1 to $5 million loan a small business wants, the big bank does not look at you as an individual.”

    This up close and personal approach may seem laughably archaic to the once-celebrated “genius” quant jocks and bonus baby M.B.A.s on Wall Street–and perhaps also the brainy financial types running the Obama economic team. Yet if a sustainable private sector economic recovery is to take hold, the key may well lie with smaller bankers who can help small firms survive the recession

    Of course, the administration’s favoritism of the big boys also creates some real problems to community banks. Some fear the mega-banks will use TARP funds to acquire better-run, local institutions. Newman calls this prospect a “travesty.” Given their awful real balance sheets, Newman believes, banks like Citicorp and Bank of America “really shouldn’t be in a position to grow, much less expand.”

    So here’s a better course. Let these giants shrink or even fail. Let their insured depositors seek out new banking relations; with the stronger, well-run community banks. It’s widely believed that some 500 to 1,000 smaller banks may fail in the next year or so, so why not some big boys, too?

    Many economists, both right and left, including Nobel Prize winner Joseph Stiglitz, have urged this course. It would pave the way for well-run banks to expand at the expense of the incompetent and venal. Competition, after all, is supposed to be the basis of capitalism.

    Right now, the zone of sanity probably offers the best chance for this capitalist revolution. However, the shift to smaller banks may prove even more important in reviving the epicenters of lunacy, such as my adopted home state of California. Here, little banks like the privately held Montecito Bank and Trust are quietly expanding as customers leave the TARP babies for an institution a little more personal and grounded in sound banking principles. “Better boring than broke,” jokes Janet Garufis, Montecito’s president and CEO.

    It also helps to be local, she notes, even in a mega-state like California. Much of the damage to the TARP banks came when they bought into sliced and diced mortgages in locations they didn’t know. It turns out that local knowledge counts–not only in real estate, but in deciding about the right business to back.

    “The differences between a big-box bank and community are the difference of night and day,” suggests Garufis, who spent 35 years with Security Pacific, a onetime L.A. area powerhouse. “People like to see the whites of the eyes of the people they are doing business with. We know the community. We are part of it, and we understand what is going on here.”

    Of course, being local, smart and disciplined may not be enough for all these upstart banks. The failures of the mega-banks have increased the costs of things like FDIC insurance for even well-run institutions–in Montecito’s case, from $400,000 to $1.2 million over the past year. Equally challenging, TARP funds are helping the big boys offer slightly higher rates for mass-market products like CDs.

    Rather than focus on saving their Wall Street friends, the administration needs to allow an upsurge in smarter, smaller and better-run banks. Let us give these grassroots capitalists a chance and see what they can do.

    The road to a financial and economic recovery does not run through Wall Street and K Street, which, after all, are the primary originators of our distress. It lies in places that look more like Snook–even if country fried bacon is not to your taste.

    This article originally appeared at Forbes.

    Joel Kotkin is executive editor of NewGeography.com and is a presidential fellow in urban futures at Chapman University. He is author of The City: A Global History and is finishing a book on the American future.

  • Moving Away from the City: The Reality Missed by the Fairfax County Survey

    Political “spin” descended to a new low today with the publication of survey results purporting to suggest that suburban residents and workers are pining for city life. The Washington Business Journal dutifully reported that Today’s suburban workers and residents miss the amenities of cities. The survey sponsor, the Fairfax County (Virginia) Economic Development Authority noted that “almost half of workers who work in the suburbs, say they want more public transportation, more housing options, greater access to useable green space or a better variety of job opportunities – typical features of cities.”

    All of this may sound impressive until you realize that no one urban “amenity” was mentioned by more than 25 percent of respondents. That means, for example, that 77 percent of responding suburban residents did not consider “access to convenient public transportation” important enough to mention, while 23 percent did.

    According to the Economic Development Authority, the survey indicates that 52 percent of residents “say they would move to a community that offered more of these” urban amenities.

    The survey got the moving part right, but missed by a mile on where they are moving. From 2000 to 2008, more than 100,000 domestic migrants left Fairfax County, 11 percent of its 2000 population. But they didn’t move to the city (Washington) or to more urban Alexandria or Arlington, because all of these lost domestic migrants as well. Indeed, the only counties in the Washington, DC area that gained domestic migrants are further from the city than Fairfax County.

  • The Luxury City vs. the Middle Class

    The sustainable city of the future will rest on the revival of traditional institutions that have faded in many of today’s cities.

    Ellen Moncure and Joe Wong first met in school and then fell in love while living in the same dorm at the College of William and Mary. After graduation, they got married and, in 1999, moved to Washington, D.C., where they worked amid a large community of single and childless people.

    Like many in their late 20s, the couple began to seek something other than exciting careers and late-night outings with friends. “D.C. was terrific,” Moncure recalled over lunch near her office in lower Manhattan. “It was an extension of college. But after a while, you want to get to a different ‘place.’”

    The “place” Ellen and Joe looked for was not just a physical location but something less tangible: a sense of community and a neighborhood to raise their hoped-for children. Although they considered suburban locations, as most families do, ultimately they chose the Ditmas Park neighborhood of Brooklyn, where Joe had grown up.

    At first, this seemed a risky choice. While Joe was growing up in the 1980s, the neighborhood — a mixture of Victorian homes and modest apartments — had become crime-infested. The old families were moving out, and newer ones were not replacing them. Yet Joe’s Mom still lived there, and they liked the idea of having grandma around for their planned-for family.

    In a city that has been losing middle-class families for generations, the resurgence of places like Ditmas Park represents a welcome change. In recent years, child-friendly restaurants and shops have started up along once-decayed Cortelyou Road. More important, some local elementary schools have shown marked improvement, with an increase in parental involvement and new facilities.

    Even in hard economic times, the area has become a beacon to New York families, as well as singles seeking a community where they will put down long-term roots. “There’s an attempt in this neighborhood to break down the city feel and to see this more as a kind of a small town,” notes Ellen. “It may be in the city, but it’s a community unto itself, a place where you can stay and raise your children.”

    The Decline of the Urban Middle Class

    The rise of neighborhoods like Ditmas Park suggests that cities can still nurture and accommodate a middle class. Yet sadly this trend continues to fight an uphill battle against a host of forces from high taxes and regulation to poor schools, highly bifurcated labor markets, and the scourge of crime.

    These problems can be seen in the migration numbers. A demographic analysis conducted by my colleagues at the Praxis Strategy Group over the past decade found that New York and other top cities — including Chicago, Los Angeles, San Francisco, and Boston — have been suffering the largest net out-migration of residents of virtually all places in the country, albeit the pattern has slowed with the recession.

    It’s astonishing that, even with the many improvements over the past decade in New York, for example, more residents left its five boroughs for other locales in 2006 than in 1993, when the city was in demonstrably far worse shape. In 2006, the city had a net loss of 153,828 residents through domestic out-migration, compared to a decline of 141,047 in 1993, with every borough except Brooklyn experiencing a higher number of out-migrants in 2006.

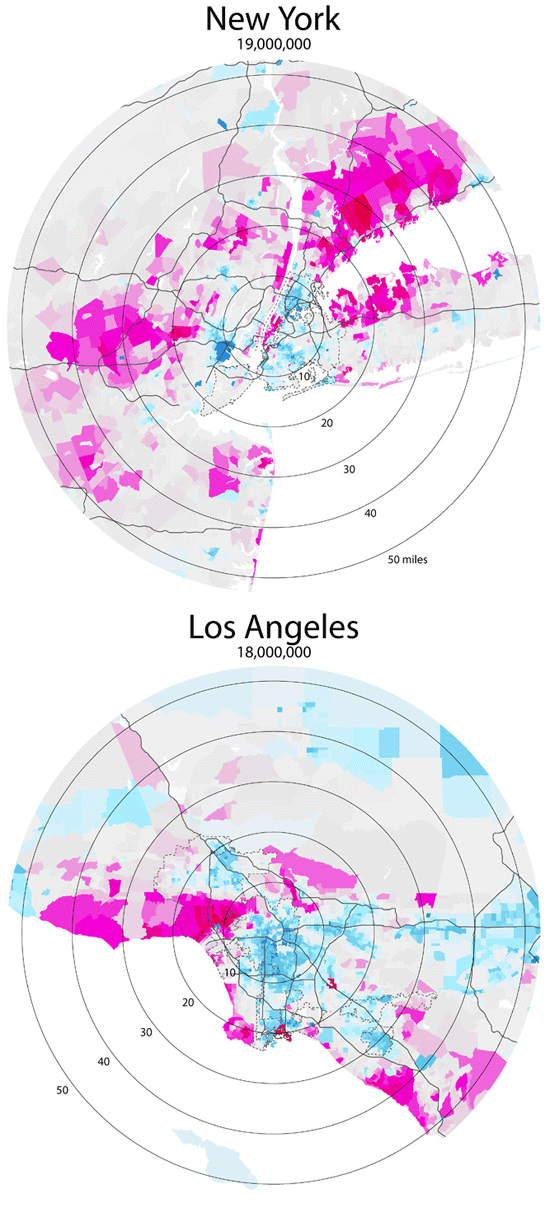
    Since the 1990s virtually all the gains made in the New York economy have accrued to the highest income earners. Overall, New York has the smallest share of middle-income families in the nation, according to a recent Brookings Institution study; its proportion of middle-income neighborhoods was smaller than any metropolitan area, except for Los Angeles.

    Much the same pattern can be seen in what has become widely touted as America’s “model city,” President Obama’s adopted hometown of Chicago. The city has also experienced a rapid loss of its largely white middle class at a rate roughly 40 percent faster than the rest of the country.

    Although there has been a considerable gentrification in some pockets around Lake Michigan, Chicago remains America’s most segregated big city. In contrast to the president’s well-integrated cadre of upper-class African Americans, Chicago’s black population remains among the poorest, and most isolated, of any ethnic population in America.

    And like other American cities, Chicago now has a growing glut of “luxury” condos, a pattern that became evident as early as 2006 and has now, as Chicago magazine put it, “stalled” as a result of a “perfect storm” of toughened mortgage standards, overbuilding, job losses, and rising crime.

    Yet there could be some good from the current crisis. Considerable drops in urban rents and residential housing prices should ease the burdens on those who struggle with extremely high prices and taxes. Younger people, including families, may now be able to consider whether a home in Brooklyn, Chicago’s Wicker Park, or Los Angeles’ Studio City might now be affordable and desirable enough to eschew the move to the suburbs.

    The Cost of Being Urban

    In doing scores of interviews recently for a report on New York’s middle class, my coauthor Jonathan Bowles of the Center for an Urban Future and I ran into many people who were considering moving out of the city or had friends who had recently left. This seems particularly true in the remaining middle-class enclaves in the outer boroughs.

    “Almost all the friends I grew up with have moved to Mahopac or Yorktown [in the Hudson Valley],” says Jimmy Vacca, a member of the City Council who represents communities in the Northeast Bronx such as Throgs Neck and Pelham Parkway. “There’s a flight out by many middle-class people because of the schools. A couple gets married and by the time their children gets to age five, they move.”

    Costs, particularly relating to child-raising, are killing the urban middle class. Urban residents generally pay higher taxes and more for utilities, insurance, trash, and sewer than those living elsewhere. Manhattan is by far the most expensive urban area in the United States, with an average cost of living that is more than twice as much as the national average; San Francisco, another city that has seen large-scale middle-class flight, ranks second. The Washington, D.C. area, Los Angeles, and Boston also suffer extremely high living costs.

    These costs are most onerous on the middle class, particularly those with children. This can be seen in the rapidly declining numbers of students in most urban school districts, including such hyped success stories as Chicago, Seattle, Portland, Washington, and San Francisco. Over the past seven years, for example, Chicago’s school system, which was run by new Education Secretary Arne Duncan, has declined by 41,000 students.

    America’s core cities — including the borough of Manhattan in New York — boast among the lowest percentage of children under 17 in the nation. Although Manhattan had a much discussed “baby boomlet” (the borough’s number of toddlers under the age of 4 grew 26 percent between 2000 and 2004), once children over 5 are taken into account, Manhattan’s under-age population is well under the national average. This indicates there may be a process of exhaustion — both mental and financial — as the costs of raising children drain family resources.

    The real issue for the urban middle class is not having babies but being able to sustain their families as the children age and as families expand. One reason: many middle class urbanites spend tens of thousands of dollars a year in additional expenses that those in other cities as well as surrounding suburbs often avoid. For instance, since most middle-class families in big cities today need to have two working parents just to get by, child care becomes a necessity for those without grandparents or other relatives to look after young children. In places like Chicago, Washington, Boston, San Francisco, New York, or Los Angeles these costs typically run from $13,000 to $25,000 per child annually.

    Later many of these same families, if they choose to stay, must then contemplate shelling out considerable sums to send their children to private schools, particularly after the elementary level. This can add from a few thousand dollars to $30,000 a year to their annual costs — and with no tax benefit.

    Do Cities Need a Middle Class?

    Ultimately, in good times or bad, cities have to want a middle class to have one. And politicians, if asked, will genuflect to the idea of maintaining a middle class, yet their actions — on taxes, regulations, schools, development — suggest otherwise.

    Indeed, in reality most urban areas have focused on creating what New York Mayor Michael Bloomberg famously dubbed the “luxury city.” To pay for often inflated public employee costs, the luxury city can only survive off the wealthy and on other groups — empty nesters, singles and students — who demand relatively little in the way of basic services like schools and public health facilities.

    City planners and urban developers favor the unattached: the “young and restless,” the “creative class,” and the so-called “yuspie” — the young urban single professional. Champions of the unattached suggest that companies and cities should capture this segment, described by one as “the dream demographic,” if they wish to inhabit the top tiers of the economic food chain.

    Another key group coveted by cities are the legions of baby boomers who have already raised children. No longer cohabiting with offspring, they are expected to give up their dull family existence and rediscover the allure of a fast-paced, defiantly “youthful” lifestyle. The new retirees, suggests luxury homebuilder Robert Toll, “are more hip-hop and happening than our parents.” They are more interested in indulging “the sophistication and joy and music that comes with city dwelling, and doesn’t come with sitting in the ’burbs watching the day go by.”

    A Demographic Dead End?

    This whole approach has severe limitations. Despite an enormous amount of publicity about empty nesters moving back to the city, surveys conducted by the housing industry find that most aging boomers — upwards of 70 percent — are aging in place, mostly in the suburbs. The numbers moving back into the urban core remain negligible, except in the pages of urban booster publications like The New York Times.

    The young singles provide a more promising demographic for cities. But even here time may be running out. This will be even more evident between 2010 and 2020, when the millennial generation hits their 30s and early 40s and enter the prime years for family formation. Surveys of the cutting edge of this group — the other large age cohort in the population — show that most prefer a single-family home and, like their parents, seem most likely to head to the suburbs.

    But perhaps most troubling of all is what this means in terms of the historic role of cities as incubators of upward mobility. Back in the 1960s, Jane Jacobs could still predict that Latino immigrants to New York, mainly from Puerto Rico, would inevitably make “a fine middle class.” Yet four decades later in the Bronx, the city’s most heavily Latino county, roughly one in three households lives in poverty, the highest rate of any urban county in the nation.

    On the other extreme, in Manhattan, where the rich are concentrated, the disparities between the classes have been rising steadily. In 1980 it ranked 17th among the nation’s counties for social inequality; today it ranks first, with the top fifth of wage earners earning 52 times that of the lowest fifth, a disparity roughly comparable to that of Namibia.

    The University of Chicago’s Terry Nichols Clark, one of the most articulate advocates for this new urban pattern, says cities should focus on acting not so much as vehicles for class mobility, but as “entertainment machines” for the privileged. For these elite residents, the lures are not economic opportunity, but rather “bicycle paths, beaches and softball fields,” and “up-to-the-date consumption opportunities in the hip restaurants, bars, shops, and boutiques abundant in restructured urban neighborhoods.”

    In this formulation cities become the domicile primarily of the young, the rich (and their servants), as well as those members of the underclass who persist in hanging around. What emerges, in the end, is a city largely without children, particularly of school-age, and with a diminishing middle class. Ironically, these are places that, despite celebrating diversity, actually could end up as hip, dense versions of the most constipated suburb imaginable.

    This shift will also limit the economic functions of certain elite cities. Cost pressures, for example, have already helped Houston to replace New York and Los Angeles as the nation’s energy capital; in the future, although now humbled by the collapse of Wachovia, more middle class-oriented Charlotte, as well as other cities, could continue to gain jobs in the post-bust financial sector. Charlotte real estate developer John Harris suggests the city can compete against an expensive metropolitan region not only at the top levels of management but across the board. “It’s hard to be a mass employer in San Francisco,” he notes.

    Joe Gyourko, a real estate professor at the Wharton School, suggests this elite model of urbanism will spread to other favored places such as Portland, Seattle, and possibly Austin. In all these places, we may be seeing the emergence of a European-style pattern of elite urbanism in the core, with a growing concentration of low-wage workers in the least favored parts of the urban periphery.

    The City of Aspiration

    Even if such a model proves sustainable, it certainly means a major change for American urbanism. Unlike most urban cultures, that of the United States has been dominated not by the dictates of princes or priests, but by the efforts of ambitious entrepreneurs and migrants.

    American cities have been driven by a protean, ever-shifting commercial and middle-class culture, willing to break the bonds of tradition. As the great sociologist E. Digby Baltzell noted, the population in New York and other American cities has been “heterogeneous from top to bottom.” Social mobility, Baltzell said, constituted the fundamental reality of American urbanism.

    In this country, cities emerged as the principal North American bastion for those who sought to improve their lives. As historians Charles and Mary Beard noted, “All save the most wretched had aspirations.”

    Such cities often were not inherently pleasant or culturally edifying. Although its wealth would propel it to one day become the world’s cultural capital, visitors from more genteel Philadelphia and Boston often regarded 19th-century New Yorkers as crass and money-oriented.

    The new cities on the opportunity frontier — Chicago, Cleveland, Cincinnati — were, if anything, even more egalitarian. After two years in Cincinnati, British writer Frances Trollope deplored how “every bee in the hive is actively employed in the search for honey…neither art, science, learning, nor pleasure can seduce them from their pursuit.” Chicago, a Swedish visitor commented in 1850, was “one of the most miserable and ugly cities” of America.

    Yet these places were ideal for taking advantage of new technologies from mass manufacturing to trains and the telegraph. They created dynamic societies that provided huge opportunities for vast waves of immigrants, who by 1890 accounted for as much as half of the nation’s urban dwellers.

    The newcomers were joined by others from rural America, including, by the early 20th century, many African Americans. The “Great Migration” of African Americans from the rural south, noted Gunnar Myrdal in 1944, created “a fundamental redefinition of the Negro’s status in America.” Urban life had its horrors, but in the cities it became increasingly difficult to restrict a person into “tight caste boundaries.” African-American migrants from the South may have been different in many ways from newcomers from Italy, Ireland, or Russia, but their fundamental aspirations were often very much the same.

    The Key to a Middle-Class Comeback: The Power of Plain Vanilla

    Compared to the dismal decline in the 1970s and early 1980s, urban prospects have improved, particularly in primary urban areas such as Chicago, New York, and San Francisco. Yet, if these and other cities are to sustain their momentum, they need to look beyond “the luxury city” to the potential of less glamorous neighborhoods that can attract the middle class and people with families.

    These “plain vanilla” neighborhoods include many places that managed to resist the urban decay of the 1970s and in many cases have begun to enjoy a steady resurgence. These include, for example, large swaths of Brooklyn and Queens, as well as the lovely, park-blessed sections of south and west St. Louis, or scattered Los Angeles neighborhoods in places like the San Fernando Valley.

    But these communities can only grow if cities focus on those things critical to the middle class such as maintaining relatively low density work areas and shopping streets, new schools, and parks.

    This would require a massive shift in urban priorities away from the current course of subsidizing developers for luxury mega-developments, new museums, or performing arts centers. To maintain and nurture a middle class, cities need to look at the essentials that have made great cities in the past and could once again do so in the future.

    The New Urban Middle Class

    Perhaps the other key question is what constitutes the economic base for the people who might settle and remain in cities. It’s clear that many traditional industries — heavy manufacturing, warehousing — as well as middle-management white collar jobs will diminish in the future. But it is possible to imagine the rise of a new kind of urban economy built around people working in small firms, or independently in growing fields such as information, education, healthcare, and culture, or as specialists in a wide array of business services.

    These are professions that continued to grow in many older cities, even as other fields declined. In San Francisco, for example, by 2006 there were an estimated 70,000 home-based businesses and a thriving culture of self-employed “Bedouins” working in post-industrial professions. These self-employed people, noted one study, were critical to helping the city withstand the ill effects of the post-2000 dotcom collapse.

    Similarly, the close-in communities of the San Fernando Valley of Los Angeles are home to large contingents of entertainment industry workers, many of them self-employed. According to studies by California State University’s Dan Blake, up to 60 percent of all L.A.-area workers in this highly dispersed industry reside somewhere in this sprawling urban region made up largely of post–World War II single-family houses. Workers in media, graphic arts, and other specialized services have also been among the few groups of middle and upper-middle income earners to see rapid growth in New York’s outer boroughs.

    These post–industrial age artisans — along with more traditional parts of the middle class such as civil servants, teachers, nurses, and other service workers — could provide the critical residential base for the plain vanilla urban neighborhoods’ work. Neither rich nor poor, these artisans could use the new telecommunications net to access clients who may exist in the sprawling suburban rings, throughout the United States, or overseas.

    Cities of the Future

    You can see this emerging reality in places like Ditmas Park, Brooklyn. Nelson Ryland, a film editor with two children who works part-time at his sprawling turn-of-the-century Flatbush house, suggests that the key to an urban revival lies not in the spectacular but in the mundane. “It’s easy to name the things that attracted us — the neighbors, the moderate density,” he says over coffee in a house close to that occupied by Ellen and Joe. “More than anything it’s the sense of community. That’s the great thing that keeps people like us here.”

    This “sense of community” will become the key currency of sustaining urban communities. Such middle-class sensibilities get short shrift by urban scholars such as Richard Florida, who argue that in the so-called “creative age” places of residence should be “leased” like cars. In his mind, single-family homes, the ideal of homeownership, should be replaced “by a new kind of housing” that embraces higher forms of density without long-term commitment to a particular residence or location.

    In fact, the sustainable city of the future will depend precisely on commitment and long-term residents. It also will rest on the revival of traditional institutions that have faded in many of today’s cities. Churches — albeit often in reinvented form — help maintain and nurture such communities. Similarly, extended family networks will be critical to future successful urban areas. As Queens resident and real estate agent Judy Markowitz puts it, “In Manhattan people with kids have nannies. In Queens, we have grandparents.”

    The modest and mundane ties between people that exist in such places represent the key to reviving America’s urban regions in the coming generation. It is in our urban neighborhoods — not in the glamour zones and high-end downtowns — that our country’s cities can find a new life and purpose in the 21st century.

    This article originally appeared at American.com.

    Joel Kotkin is executive editor of NewGeography.com and is a presidential fellow in urban futures at Chapman University. He is author of The City: A Global History and is finishing a book on the American future.

  • Suburbs and Cities: The Unexpected Truth

    Much has been written about how suburbs have taken people away from the city and that now suburbanites need to return back to where they came. But in reality most suburbs of large cities have grown not from the migration of local city-dwellers but from migration from small towns and the countryside.

    It is true that suburban areas have been growing strongly, while core cities have tended to grow much more slowly or even to decline. The predominance of suburban growth is not just an American phenomenon, but is fairly universal in the high income world).

    This is true in both auto-oriented and transit oriented environments. Suburbs have accounted for more than 90 percent of growth in Japan’s metropolitan areas with more than 1,000,000 residents, both those with high transit market shares and those with high auto market shares, The same is true in Canada, Australia and New Zealand.

    In Western Europe, where vaunted transit systems carry a far smaller share of travel than cars, all growth and then some has been in the suburbs, as overall core city populations have declined. Indeed, the same trend is well underway in middle and lower income world urban areas. In such places as Mexico City, Sao Paulo, Buenos Aires, Manila, Shanghai, Kolkata, and Jakarta, nearly all population growth has occurred in the suburbs, rather than the core cities.

    As the world faces a more expensive energy future and as efforts are intensified to reduce greenhouse gas (GHG) emissions, it is sometimes suggested that people need to “move back” to the cities. This is a dubious and needless strategy, which reveals a fundamental misunderstanding of the dynamics of metropolitan growth.

    Most suburban growth is not the result of declining core city populations, but is rather a consequence of people moving from rural areas and small towns to the major metropolitan areas. It is the appeal of large metropolitan places that drives suburban growth.

    Larger metropolitan areas have more lucrative employment opportunities and generally have higher incomes than smaller metropolitan areas. This is particularly the case in developing countries. As a result, the big urban areas attract people seeking to escape what are often the stagnant or even declining economies in smaller areas.

    There are, of course, significant individual exceptions. Virtually all of the first world core cities that have achieved a population of more than 400,000 – if they have not expanded their boundaries and did not have substantial empty land for development – experienced losses to 2000. Yet even in most of these cases, the majority of suburban growth was from outside the metropolitan areas, rather than from the core cities. For example:

    • St. Louis is a champion among the ranks of population losers, having lost the greatest percentage of its population of any large municipality in the world, (dropping from nearly 860,000 in 1950 to 350,000 in 2000). Indeed, it may be fair to say that St. Louis has lost more of its population than any city since the Romans sacked Carthage. Yet, even in St. Louis, 60 percent of suburban growth was from outside the metropolitan area, rather than from the city.
    • Few core cities have lost the nearly 1,000,000 residents that have fled Detroit since 1950. Yet, even in Detroit, 65 percent of suburban growth was from outside the metropolitan area, rather than from the city.
    • The city of Chicago lost 725,000 residents between 1950 and 2000, yet 82 percent of the suburban growth was from outside the metropolitan area.
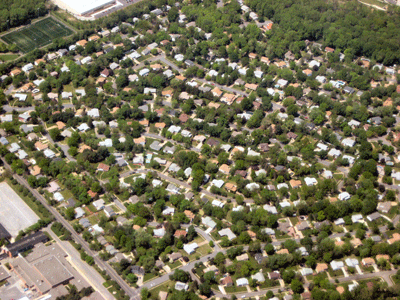
    • The city of Philadelphia lost 550,000 residents between 1950 and 2000, yet 76 percent of the suburban growth was from outside the metropolitan area (See lead picture of Philadelpia downtown).
    • The central city of Paris lost approximately one-quarter of its population from 1965 to 2000 (675,000), while the suburbs gained nearly 3,850,000 residents. More than 80 percent of suburban Paris growth came from outside the region.
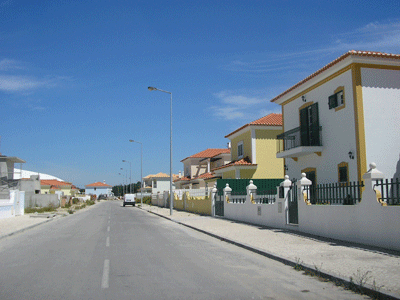
    • The central city of Lisbon experienced a 30 percent population decline from 1965 to 2000. Yet suburban Lisbon’s growth was 80 percent from outside.
    • Stockholm was another losing core city, yet more than 90 percent of the suburban growth came from smaller towns and cities.
    • Despite Zurich’s nearly one-quarter population loss 83 percent of the suburban gains derived from outside the region.
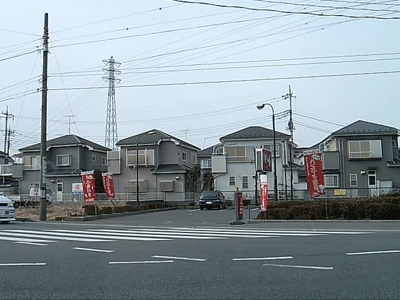
    • The core city of Tokyo (which really doesn’t exist except as 23 separate subdivisions or kus of a city abolished during World War II) lost more than 700,000 residents from 1965 to 2000. Tokyo’s suburbs, however, attracted more than 90 percent of their growth from region.

    In some metropolitan areas, smaller towns and rural areas contributed less to suburban growth. In Amsterdam, 50 percent of the suburban growth was from outside the metropolitan area. In Copenhagen, the number was 40 percent of the suburban growth while in Birmingham (UK) only 30 percent of the suburban gain was from outside.

    In a few cases, both the core city losses were greater than the suburban gains, such as in Pittsburgh, Liverpool and Manchester. In these cases, it is fair to attribute all of the suburban gains to core city losses.

    Unlike the cases above, however, most core cities gained population. This includes all in Canada, Australia and New Zealand and many in the United States. As a result, none of the suburban growth in the corresponding metropolitan areas can be attributed to an exodus from the city, because there, on balance, was no exodus.

    Suburbanization is often characterized as reducing densities, but in fact it has done just the opposite. Most suburbanites come from smaller places; they may prefer suburbs because they are less dense, safer, or simply more manageable than the core cities. But they are also, almost invariably, more dense than where they lived before. Suburbanization is thus a densifying dynamic, albeit one that is less dramatic than preferred by many planners and architects.

    In this sense, suburbs have to be seen not as the enemies of the city, as just a modern expression of urbanization. They are neither the enemies of the city, nor are their residents likely to move “back” there. You cannot move back to someplace you did not come from.

    Wendell Cox is a Visiting Professor, Conservatoire National des Arts et Metiers, Paris. He was born in Los Angeles and was appointed to three terms on the Los Angeles County Transportation Commission by Mayor Tom Bradley. He is the author of “War on the Dream: How Anti-Sprawl Policy Threatens the Quality of Life.

  • Falling Off Bicycles in Portland

    It has become customary for the fawning print media to lazily repeat whatever information is provided them by the urbanist lobby. The result is all manner of puff pieces that report as reality what is nothing more than hopes, or even delusions.

    The latest puff piece is about Portland and is in today’s Wall Street Journal. The article indicates that 8 percent of Portlanders commute to work by bicycle, based upon data from a bicycle advocacy group. That number is more than five times the figure reported by the United States Bureau of the Census, (which is not a bicycle advocacy group). In 2007 (latest data available), 1.5 percent of Portland metropolitan area workers commuted by bicycle according to the Bureau of the Census.

    It is, of course, possible that there is confusion about the definition of Portland. Domestic migration is the principal subject and it is clear from the data cited that the article is citing metropolitan area data, rather than municipal (city of Portland) data.

    However, even if we allow that the editors might have erroneously substituted municipal for metropolitan data and that the advocacy group bicycle market share of 8 percent applies to the city of Portland; it would still be off by at least 100 percent. The Bureau of the Census data indicates that 3.9 of workers rode bicycles to work in 2007 in the city of Portland.

    Of course, it is always possible that three quarters of metropolitan Portland’s bicycle commuters have fallen off their bikes or that, if the editors were confused as to the difference between metropolitan and municipal, that half have fallen off.

  • The Twilight of Special Interest Politics

    Special interest groups are the scourge of the common interest, are they not? The Founding Fathers, in The Federalist Papers, recognized the danger posed by “factions,” but assumed that competing groups would keep the balance. They could not have foreseen our current Special Interest State, wherein tens of thousands of special interest groups exert such profound influence on politics, policies and life in the United States.

    Nowhere is this more evident than in California, my adopted home state. In California, as in much of the country, government is forever and hopelessly trapped in interest group politics and therefore, forever large and growing. Interest groups are intractable, in this view, because they are always able to devote more resources to their specific causes and concerns than are any conceivable guardians of the common interest.

    California’s predicament is a perfect illustration of public choice theory, which shows that government will always act in its own interest, interest group politics seem to be the logical and inevitable end-point of democracy. Multiply this process by the tens of thousands of special interests that lobby, petition and influence politicians and the public sector and it becomes clear why government will tend only to grow, never to shrink, crowding out the private sector. Over the decades the number of special interests has expanded exponentially, whether Democrats or Republicans control Sacramento or Washington.

    But eventually this system must overwhelm carrying capacity. Maybe in California we are approaching that limit even faster than the rest of the country.

    Debts, deficits, waste, inefficiency and voter/taxpayer fatigue must at some point render the special interest state untenable. Readers of this web site are familiar with the dire situation in California: a budget deficit of gargantuan proportions, driven by increases in public sector spending that have outpaced population growth plus inflation, now combined with a drastic drop in state revenues. Attempting to deal with the situation, the Governor and legislators have placed six measures on the May 19th special statewide election ballot. Proponents claim the measures will stabilize the budget process, save billions, modernize the lottery, preserve needed services, and cap elected officials’ salaries. Opponents claim the measures will raise taxes, not put a meaningful cap on spending, and not solve the state’s basic problems.

    A new poll by the Public Policy Institute of California asks voters, “Would you say the state government is pretty much run by a few big interests looking out for themselves, or is it run for the benefit of all the people?” Among likely voters, 76% say special interests dominate the state government which, only a few decades ago, was once touted as having one of the best, most forward-thinking governments on the planet!

    According to Shane Goldmacher, writing in the Sacramento Bee, they’re right. The six ballot propositions, agreed upon in February’s budget deal between Governor Schwarzenegger and the Legislature, are designed to please or neutralize the state’s most powerful political players: labor unions, public service workers, the teachers union, casino-operating Indian tribes, the liquor, beer and wine industry, and the oil industry, to name a few.

    Some of these very interest groups protected in the budget deal are bankrolling the campaign to ratify it. But, writes Goldmacher, the influence of such groups is, more often than not, simply unspoken.

    According to Jerry Roberts and Phil Trounstine (www.calbuzz.com) voters hate the propositions for the following reasons:

    • They were carefully crafted to avoid causing any pain or requiring any sacrifice by Sacramento’s heavyweight special interests.
    • They were written with stultifying complexity, the better to sell them to voters with simple-minded sound bites.
    • Their political perspective has far more to do with inside-Sacramento tactics and strategy than with the real lives of real people.

    The Third American Republic
    Clearly, in California and on the federal level, the special interest state is untenable in the long run, and what cannot continue will stop. How and when it will stop, and what will replace it, is the subject of an essay in The American by James DeLong, “The Coming of the Fourth American Republic.”

    The special interest state is the third iteration of American politics and policy, in DeLong’s analysis. The first was the Civil War and its aftermath, which established that sovereignty belongs to the nation first and the states second. The second great institutional upheaval was the New Deal, which radically revised the role of government to include responsibility for the functioning of the economy.

    As governmental power expanded, it needed to delegate management and implementation of tasks to those with administrative abilities or specific expertise. This stimulated the rise of agencies, legislative committees and subcommittees, and yes, interest groups. Eventually, perhaps inevitably, power came to rest with those with the greatest interest or the most money at stake. Thus was the Special Interest State created, with various interest groups seizing control over particular power centers of government and using them for their own ends.

    This Special Interest State must expand, explains DeLong: the larger and more complex the government becomes, the higher the costs of monitoring it. No one without a strong interest in a particular area can be expected to possess the time and energy to keep track. As a result policy turf is left to the beneficiaries of government action.

    Special interests wield their power through laws, regulations and the tax code. Voters may object, and politicians may pronounce and promise, but nothing ever gets done to diminish special interest power. In fact, special interests have become their own special interest: the millions of lobbyists, governmental officials and compliance officers that make a living from the system and resist all reform.

    But the special interest Third American Republic, writes DeLong, is falling of its own weight. American progress cannot proceed without reforming it.

    The End of the Third Republic
    This Third Republic has had a good run, and could continue, writes the author, but it is more likely that the Special Interest State has reached a limit. This may seem a dubious statement, at a time when the ideology of total government is at an acme, but DeLong offers a catalogue of the current regime’s insoluble problems:

    Sheer size. Government in the US consumes about 36% of GNP (federal and state combined). This does not reflect the impact of tax provisions, regulations, or laws, however, so an accurate estimate of how much of the national economy is actually disposed of by the government is impossible. Whatever it is, it is growing apace, and the current administration is determined to increase it considerably.
    Responsibility. As the government has grown in size and reach, it has justified its claims to power by accepting ever more responsibility for the economy and society. Failure will result in rapid loss of legitimacy and great anger.
    Lack of any limiting principles. There is no limit on the areas in which special interests will now press for action, nothing that is regarded as beyond the scope of governmental responsibility and power. Furthermore, special interests try to convert themselves into moral entitlements to convince others to agree to their claims. Compromise is regarded as immoral.
    Conflicts. The combination of moral entitlement, multiplication of claimants, and lack of limits on each and every claim throws them into conflict, and rendering unsustainable the ethic of the logrolling alliances that control it.
    U.S. politicians do not grasp the situation. None of the leaders of any branch are demonstrating an appreciation of the problems and limits of the Special Interest State.
    Past Governors and Presidents have understood the importance of keeping special interests at some distance. They may have given up the agencies, but most ensured at some level, the executive, at very least, acted in the overall public interest. This is no longer the case.

    Over the past few years, political winners have become increasingly aggressive. Losers have become increasingly restive, ready to attack the legitimacy of the winners’ victory. This was true for George Bush and now Barack Obama. Politics has become more like a contest between equally fierce warring gangs than a civilized contest for ideas. Each party is regarded by the other as a principle-free alliance of special interests, eager to loot the government.

    What Comes Next?
    Given these trajectories and the lack of any mechanisms for altering them, writes the author, it is hard to see how the polity of the Third Republic can continue. Nor is there any easy self-correcting mechanisms in the Special Interest State. Quite the reverse; the incentives all seem to be pushing the accelerator rather than the brake.

    Thus the need for a new break: what DeLong calls the Fourth American Republic.

    What will this look like, and how will it come about? Two possibilities for change seem most promising, he believes. The first is a third political party that explicitly repudiates the present course and requires that its members reject the legitimacy of the Special Interest State. This would require a certain almost religious fervor, but the great tides of history and politics are always religious in nature, so that is no bar. In California at least this comes up often in meetings between interested, but frustrated, citizens.

    This second would be more bottom-up. In California, there is a growing movement to change the Constitution. This could also occur on the national level as well. There could also be a groundswell to force responsible change within the current constitutional framework.

    This may seem a bit pie in the sky but, as the California crisis worsens, that of the country may not be far behind. Something, quite clearly, needs to change.

    Dr. Roger Selbert is a trend analyst, researcher, writer and speaker. Growth Strategies is his newsletter on economic, social and demographic trends; IntegratedRetailing.com is his web site on retail trends. Roger is US economic analyst for the Institute for Business Cycle Analysis in Copenhagen, and North American agent for its US Consumer Demand Index, a monthly survey of American households’ buying intentions.

  • Who’s Watching AIG?

    The House Committee on Oversight and Government Reform held a hearing Wednesday – “AIG: Where is the Taxpayer Money Going?” Questions are being raised about whether the bailout better serves the interests of AIG’s customers and trading partners or the interests of U.S. taxpayers.

    The highlight of the Committee’s questioning of Chairman and CEO Edward Liddy came when Chairman Town (D-NY) asked the blunt question: “Why would you give retention bonuses to AIG employees who failed? Plus, the economy is so messed up, where would they go?” On the minds of many committee members were the facts that AIG got $70 billion in TARP money, $50 billion through the Federal Reserve Bank of New York’s Maiden Lane LLC and another $60 billion directly from the Federal Reserve Bank of New York (the FRB-NY’s AIG Credit Facility). When compared to the fact that AIG is currently worth just $5 billion, the repeated question became: “How will taxpayers be repaid?” Mr. Liddy pointed to the value of some subsidiaries and other assets that can be sold off, but he had to admit that the timing and possibility of AIG repaying taxpayers really “depends on the economy and the capital markets.”

    The Trustees of the AIG Credit Facility Trust testified in the second panel. The Trustees were named by the Federal Reserve Bank of New York, under then-President Timothy Geithner, in September 2008. The panel included one non-Trustee – Professor J.W. Verret of George Mason University School of Law. Professor Verret expressed concern over the form of the AIG trust agreement: “I am concerned by the AIG trust because of the precedent it sets. Secretary Geithner has announced his intention to create another trust to manage the Treasury’s investment in Citigroup as well as other TARP participants. If the AIG trust, crafted during the Secretary’s tenure as President of the New York Fed, is used as a model for these new entities, the risk to taxpayers will be multiplied many times over. “ Professor Verret raised three specific problems with the agreement: 1) the agreement specifically expects the Trustees to act in the best interest of the U.S. Treasury, not the U.S. taxpayers; 2) the Trustees cannot be held liable for their actions; and 3) the Trustees can invest on information they gain in the course of their duties.

    At the end of the hearing, the final question went to Representative Norton (D-D.C.). Too many of the AIG Trustees also serve or have served as directors and officers to other TARP recipients. Ms. Norton noted that all of the witnesses are connected to Wall Street and all know each other. Evidently, one of the Trustees, Jill Considine, is involved with a Bermuda company that provides services to hedge funds. Ms. Considine was uncomfortable naming the hedge funds that benefit from her advice because the Bermuda company is private – it is also foreign. Considine took Norton aside when hearing ended, engaging her in an animated conversation – off the record, of course.

    It seems evident that some of the Trustees didn’t recognize the risks AIG was taking when they were in a position to have close contact with not only AIG but their counterparties – those final recipients of the bailout money. If the Trustees missed the AIG risk then, when they were regulators in the self-regulatory industry and serving on Boards at the Federal Reserve Banks, then what can we expect from them now?

  • Mapping Urban Income Dispersion

    Here’s some cool maps from radicalcartography.net looking at income dispersion in the country’s 25 largest metropolitan areas by population. From the page:

    These maps show the distribution of income (per capita) around the 25 largest metropolitan areas in the US (all those with population greater than 2,000,000). The goal was to test the “donut” hypothesis — the idea that a city will create concentric rings of wealth and poverty, with the rich both in the suburbs and in the “revitalized” downtown, and the poor stuck in between.

    This does seem to have some validity in older cities like Boston, New York, Philadelphia, or Chicago, but in newer cities it is not the case. Instead of donuts, one finds “wedges” of wealth occupying a continuous pie-slice from the center to the periphery.

    Just from visual inspection, it also seems that poverty donuts all tend to have about a five-mile radius, regardless of the size of the city. Perhaps this is the practical limit for commuting without a car?

    All maps are at the same scale, and all use the same color values for income.