Blog

  • Solving the Economic Crisis: Fix the Banks

    Economic forecasts today reflect a remarkable variation. Some economists are predicting a rapid increase in economic activity within just a few months. Some are forecasting an economic decline that persists for years.

    At the root of the debate lies the question: where is the heart of darkness? Primarily, forecasters are focusing on the impact of the fiscal stimulus and the efficacy of monetary policy. Yet they have been less forthcoming to center on the real problem, which is fixing the banks.

    Government spending as economic stimulus is typically rejected by economists based on either a crowding-out or a Ricardian Equivalence theorem. The crowding out theory says that government spending can replace, or “crowd out”, more productive private investments. The perverse result is that the economy may slow down even more.

    The Ricardian Equivalence theory holds that future taxpayers, recognizing their increased tax obligations, simply increase savings by an offsetting amount. The result is no change in economic activity. Though I’ve simplified the respective cases, crowding-out and Ricardian Equivalence arguments are persuasive for most states of the world. So, for the moment, let’s reject fiscal stimulus as a way out of recession.

    What about monetary policy? One of Ben Bernanke’s contributions to monetary policy has been the notion that the central bank still has policy tools even when interest rates fall to zero. The FED can still purchase all sorts of assets. Those purchases increase the monetary base and directly impact targeted non-liquid markets. Continued action after interest rates reach zero addresses one criticism of Japan’s response to the 1990s in which their central bank essentially did nothing once interest rates reached zero.

    First we need to consider how monetary policy affects economic activity. We teach students that monetary policy works through a money multiplier. The money multiplier is based on lending by a fractional reserve banking system. The money goes to the banks, and the banks lend it out. The reserves are provided by FED purchases of financial assets.

    Of course the multiplier depends on the bank’s lending. What happens when banks don’t choose to lend? Scott Sumner, an economist at Bentley University, has pointed out that this is exactly the situation we have right now. The FED has been increasing reserves, but the banks are not lending. Since October, bank reserves and vault cash has grown to over a trillion dollars but lending has declined. Sumner recommends a penalty on excess reserves, but more is needed to restore bank lending.

    I see three significant issues that are driving the banks’ apparent reluctance to lend. First, banks appear to expect deflation. Fear of deflation is not unfounded. Prices are falling in many markets, impacting bank behaviors.

    I keep hearing that “Cash is king.” This is exactly what one would expect in a deflationary environment, and there is no obvious way to deal with it. You can tax excess reserves and vault cash. You can tax bank deposits. You cannot tax money that is under the mattress, and money under the mattress is profitable in a deflationary world.

    This is what some call Keynes’ famous liquidity trap. Technically, a liquidity trap is when zero interest rates make monetary policy ineffective. As Scott Sumner and others point out, the described situation is really an expectations trap. The problem isn’t zero interest rates, the problem is deflationary expectations.

    But if the “trap” makes monetary policy ineffective the arguments against fiscal stimulus are much weaker. This is where Paul Krugman says we are today, and it changes everything. We need to go back to fiscal policy to find hope for effective policy.

    If we are in a trap, it bolsters Krugman’s criticism that the existing stimulus is too little. To be effective, the stimulus would need to be very large, perhaps 40 to 50 percent of gross product. This would imply a stimulus package in the range of 6 to 8 Trillion dollars!

    But even if we were to follow this notion, I would argue that the composition of the stimulus would have to change. To be effective, government spending would have to create assets that significantly increase the productivity of private assets. We have examples from history. The Tennessee Valley Authority in the Southeast and Hoover Dam in the West cut private industry’s production costs by providing abundant and cheap energy. California’s water system, with its dams and canals, expanded agriculture’s productivity and range.

    Sadly, in spite of its size, the current stimulus plan has nothing that will significantly enhance private-sector productivity. And even any attempt to boost productivity investments is likely to run into roadblocks from the very powerful, well-connected green lobby which enjoys a far more favorable press than does business.

    Are we doomed then to deflation and slow growth? I don’t think so. The federal deficit, monetary policy, the impending Social Security and Medicare crisis, and baby-boom demographics imply eventual inflation.

    The real problem is with the banks. Banks can fail because of a lack of liquidity or a lack of equity. Last fall banks faced a liquidity crisis. There was a run on the entire financial sector. Today banks are probably facing an equity crisis, and the Treasury’s Toxic Asset Plan is exhibit one.

    The Treasury’s Plan does not make sense as presented. The plan is to leverage private sector resources, expertise and cash, with government funds to purchase underpriced toxic assets. This would supposedly reveal a true price for toxic assets. However, Gary Becker and Jeffrey Sachs have convincingly shown that the plan provides strong incentives to dramatically overprice the assets at the taxpayers’ expense. What if those toxic assets are already correctly priced?

    The Treasury’s Toxic Asset Plan does make sense if the banks are insolvent, and policy makers are unwilling or unable to more directly and transparently tackle the problem. To me, the Toxic Asset Plan looks a lot like a backdoor way to recapitalize the banks. If so, we have a problem. Insolvent banks must deleverage as rapidly as possible. That is, they must reduce assets, and a bank that is reducing assets in not a bank in the lending business.

    Here our problem is a variation of the problem faced by the Japanese in the 1990s. Their economic malaise continued for a decade in large part because they would not or could not clean up their banks. We and the rest of the World told Japan, time and again, that there was a toxic asset problem at their banks. Informed observers, inside Japan and out, knew that the core problem was bad bank assets.

    Today, the United States is probably in the same position. Our banks and other financial institutions are in trouble. They are sitting on a bunch of bad assets. If the banks recognize their bad assets, their equity is inadequate. The banks’ unpopularity prevents a bailout or a restructuring, but policy makers are afraid to let them fail. The other solution would be the Swedish solution, but policy makers don’t want to be accused of nationalizing the banks. Right now even President Obama lacks the political capital to address the problem. So, we get the convoluted Treasury Plan.

    What we need is political courage. We need to clean up the banks, and it doesn’t much matter how. We could crank up the bankruptcy courts, or we could implement the Swedish plan. Inaction will only prolong the economic pain. Backdoor plans from an unpopular Secretary of the Treasury aren’t going to get the job done. The sooner we clean up the banks, the sooner they will return to the business of lending, and the sooner we will have a recovery.

    Bill Watkins, Ph.D. is the Executive Director of the Economic Forecast Project at the University of California, Santa Barbara. He is also a former economist at the Board of Governors of the Federal Reserve System in Washington D.C. in the Monetary Affairs Division.

  • Entrepreneurs Overlooked in Recovery Plans

    As most recently spelled out in The Economist , one of America’s most potent advantages – even in the current economic crisis – lies in its entrepreneurialism. America’s entrepreneurs are the proverbial wellspring of innovation and creators of most of the country’s new economic opportunities. Entrepreneurs, or global heroes as The Economist calls them, are not only important here in this country but are the best hope for creating the innovations that will get sufficient traction to resuscitate the world economy.

    Year in and year out Small Business Administration data confirm that small businesses drive employment. Firms with fewer than 500 employees account for most, if not all, net new jobs while large firms with 500 or more employees exhibit a net loss of jobs. About 99 percent of all businesses are small businesses.

    In that case one would expect that government would be doing more to encourage individuals to start businesses and create jobs, which is ultimately the long-term solution for the country’s economic woes. Not so says a recent study by the Kauffman FoundationEntrepreneurship and Economic Recovery: America’s views on the best ways to stimulate growth.

    The key findings of the report include the following:

    • By a margin of three to one (63 percent to 22 percent) Americans favor business creation policies as opposed to government creating new public and private sector jobs. In fact, 79 percent of respondents say entrepreneurs are critically important to job creation, ranking higher than big business, scientists, and government.
    • Only 21 percent of all survey respondents say that the stimulus package supports entrepreneurial activity and 33 percent believe it will retard entrepreneurship.
    • While 78 percent of survey respondents say innovation is important to the health of our economy, only 3 percent say they believe the stimulus package will encourage innovation.
    • Americans think the government does little to encourage entrepreneurship, despite its importance; 72 percent of respondents say the government should do more to encourage individuals to start businesses. Almost half of respondents think the laws in America make it more difficult to start a business.

    So even now, entrepreneurship is widely recognized as more important than the stimulus package in creating long-term economic stability. Yet, Americans doubt that the stimulus package will spur the entrepreneurship that they hold as so important.

    Americans Want Small Business Innovation
    If entrepreneurship and innovation are the keys to revitalizing our economy, how can the federal government spur this on without the delay involved in creating a new bureaucracy? Is there a proven mechanism in place for evaluating, vetting and administering research funds that can be used to address some of our nation’s most pressing challenges related to the environment, a dwindling industrial base, our defense capability, or the health of our nation?

    Of course there is, and it is somehow – amazingly – overlooked. It’s called the Small Business Innovation Research (SBIR) Program, an existing highly competitive program that funds the most promising scientific and engineering ideas from the nation’s small, high-tech, innovative businesses. It’s so competitive that some, if not most, agencies only fund 1 out of 9 Phase 1 proposals.

    Eleven federal departments now participate in the SBIR program; five departments participate in the companion Small Business Technology Transfer (STTR) program, which requires partnerships with universities to harness the intellectual capital of our universities and the market capabilities of small business. Altogether the SBIR/STTR programs award a little over $2 billion each year to small high-tech businesses.

    Since its inception in the late 70s and early 80s the program has awarded $26 billion to over 80,000 Phase 1 projects and about 31,000 Phase 2 projects, resulting in small businesses filing 67,600 patents and attracting over $41 billion in venture capital. Over 650 SBIR companies have gone public. Increasingly, large firms and mid-sized firms have entered into various forms of collaborative relationships with SBIR awardees to commercialize their technologies.

    Despite having a rigorous independent scientific and commercialization review process in place, and despite its record of success, the program now languishes with little support in either Congress or the White House.

    Now let me admit that I’ve been actively involved in the SBIR program since 1992 – now having served as an eight-time principal investigator for Phase 1 and Phase 2 projects. Our company’s innovations are in community-based solutions for technology-based economic development, related to capital investment, trade and technology linkages and infrastructure investment. Our company is a 1997 recipient of the Tibbetts Award, named after the National Science Foundation’s Roland Tibbetts, awarded for success in the program and for the pursuit of science-based solutions to our nations challenges and opportunities.

    I’ve also been an advocate for sustaining and building the program along with numerous colleagues in other small technology businesses and representatives of government from the technology-based economic development community. I’ve made this personal commitment because the program makes a significant difference in the opportunities that are available to small business and because the program works in creating new economic opportunities based on science, engineering and technology.

    Instead of watching the SBIR program evaporate we should be doubling if not tripling our investment. At a minimum a $5 billion SBIR program should be put in place. It will get us much more in growth than the Treasury bailouts of the banks, or General Motors. It represents both what America wants – Small Business Innovation – and needs in these times of economic stress.

    Delore Zimmerman is president and CEO of Praxis Strategy Group and publisher of Newgeography.com

  • We Must Remember Manufacturing

    General Motors‘ reorganization and contemplated bankruptcy represents one possible – and dismal – future trajectory for American manufacturing.

    Unlike highly favored Wall Street, which now employs fancy financial footwork to report a return to profitability, the nation’s industrial core is increasingly marginalized by an administration that appears anxious to embrace a decidedly post-industrial future.

    Indeed, a recent survey of manufacturers found that most see the stimulus as only “slightly effective” for them. This is no surprise, since the lion’s share of the $800 billion is going to bolster the banks, with scraps spread out to green projects, health care and education.

    The administration’s priorities reflect a new political consciousness that, if not openly anti-industrial, seems to minimize manufacturing’s role in the nation’s long-term future.

    Just examine the demands placed upon General Motors and Chrysler. Their workers are being asked to make huge sacrifices – 1,600 new layoffs announced just this weekwhile their executives are largely shunned and demeaned compared with the generally more gentle treatment Wall Street malefactors get.

    This disparity reflects the close ties between Treasury Secretary Timothy Geithner, chief economic adviser Larry Summers and other top administration officials with the increasingly Democratic financial elite.

    Perhaps most revealing has been the somewhat bizarre choice to make mega-contributor and investment banker Steve Rattner as the “car czar” overlooking Detroit’s fate. Rattner, after all, has limited experience with the auto industry. (His expertise is largely in media.) “About all he knows about cars,” joked one person who has worked with him, “is that his chauffeur drives one.”

    Rattner may yet lose his post because of his involvement in New York’s latest pension fund scandal – but his appointment speaks volumes about the disdain with which the administration views the industrial economy.

    It also reflects an attitude – common among the academics, financiers and high-tech executives closest to the administration – that “smart” people can solve any problem better than someone with more hands-on experience but perhaps a less lofty IQ or a less tony advanced degree.

    To be sure, we should be wary of an approach like the Bush administration’s well-demonstrated embrace of mediocrity. But it is also dangerous to embrace a mindset that disdains all practical skill and areas of business not dominated by the cognitive elite.

    These days this mentality appears alongside an overall contempt for the tangible economy. Very few Obama appointees have ties to the country’s core productive sectors: manufacturing, agriculture, energy. Veterans of investment banking, academia or the public sector, they seem to see the economy more in terms of making media, images and trades – as opposed to actually making things.

    Such an approach also reinforces the administration’s surprising radicalism on the environmental front. Most industrial firms understand that precipitous moves to limit greenhouse gases and decimate domestic fossil fuels threaten America’s international competitiveness. Apparently, patience with and sympathetic understanding for Wall Street’s foibles is one thing; figuring out sustainable economic and energy policies that are friendly to industry is another.

    Unless something is done soon, the Obama policy could end up eroding more than just the nation’s industrial base. The president’s much-ballyhooed expansion of “green jobs” to make up for massive manufacturing layoffs worked well on the stump – but in reality it’s largely a fantasy.

    Certainly windmills and solar panels won’t rescue many of the communities at the bottom of our recent list of best cities for job growth. Industrial towns like Lansing and Flint, Mich., as well as Janesville, Wisc. may only see more devastation.

    Since 2007, these areas have lost somewhere between 15% and 25% of their industrial jobs. In Flint, nearly half have disappeared since 2003. These are the places where the American dream is dying most rapidly; Big Three bastions Michigan and Ohio have seen the quickest declines in per-capita incomes for most of this decade.

    The situation may be getting worse. Industrial decline could even be spreading to areas – like Houston, Texas, Fargo, N.D., Tulsa, Okla., or Anchorage, Alaska – that have actually been gaining industrial jobs. One culprit here may prove to be the administration’s anti-fossil fuels agenda, which could undermine even healthy firms and healthy regions. Even if Congress refuses to approve draconian rules for cap and trade or new taxes on greenhouse gas emissions, the “green” agenda could be imposed by the federal apparat anyway, through bureaucratic fiat. One harbinger could be the EPA’s recent actions to regulate carbon dioxide as a pollutant.

    All this doesn’t bode well for the country’s prosperity and for the prospects of millions of Americans. As demographer Richard Morrill has pointed out, traditionally, regions with industrial economies have been more egalitarian than the finance-driven areas. If this anti-manufacturing trend continues, more of America will resemble New York, Los Angeles or Chicago, places sharply divided between a growing class of low-wage workers and a relative few hegemons in finance, academia and media.

    Perhaps even worse, by stimulating everything but industry, the administration risks accelerating the very imbalance between production and consumption that is one key reason for the nation’s economic woes. Padding incomes by handing out money without increasing production may indeed prove a great way to stimulate economies – that is, those of industrial exporters like Germany, Japan and, most critically, China.

    Over time, Republicans may try to make these points. But economic conservatives have tended, if anything, to be at least equally clueless about the importance of industry. As far back as 1984 – the peak of the Reagan era – the New York Stock Exchange issued a report stating that “a strong manufacturing economy is not a requisite for a prosperous economy.”

    Disdain for industry has since grown as industrial employment has ebbed and the finance, service and media industries – and other non-tangible fields – have gained workers. Yet few understand how a swelling manufacturing trade deficit, which has grown ten-fold since 1984 to over $800 billion in 2007, has undermined the nation’s financial position. It has shifted so much wealth to countries focused on productive industry and energy.

    In the long run, too, it’s not just forlorn factory towns that get hurt. A strong manufacturing sector also boosts science and technology; the industrial workforce is increasingly dominated by engineers and highly trained technicians, many of whom are in increasingly short supply. Marketers, media firms, advertising agencies and software companies all benefit when industry expands.

    Fortunately, the situation isn’t hopeless. Despite commonly held assumptions, American can still compete industrially – and could do even better with the right investments in both human and physical infrastructure. In fact, despite unfavorable trade policies and growing regulatory burdens, American factories have remained among the most productive in the world; output has doubled over the past 25 years, and productivity has grown at a rate twice that of the rest of the economy.

    Clearly, not all American factories are run by the kind of boobs who governed General Motors and other failed enterprises. A 2008 McKinsey study noted American factories actually were, on average, considered the best-managed in the world – ahead, albeit slightly, of competitors based in advanced nations like Germany, Sweden and Japan, and considerably better than their counterparts in key emerging competitors China and India.

    To take advantage of these assets, American industry needs government to recognize their importance. We need incentives for improved productivity and investment, including ones for those companies employing “green” technologies. Another step would be to include accurate “carbon accounting” of goods produced elsewhere – particularly in places like China, whose production tends to generate more pollutants than those in more regulated countries like the U.S. Greening may be good, but it should not become another excuse for American de-industrialization.

    Finally, President Obama should recognize that expanding industry presents some of our best chances for future growth. Once the world recovers from the current financial crisis, there will be another surge in demand, particularly from developing countries, for the basic products that the U.S. can produce at prodigious levels, such as foodstuffs and airplanes, as well as farm, energy and construction equipment. The strategic opening for American firms may indeed be greater than any other time since the years after World War II.

    “We’re in the midst of 2 to 4 billion people around the world rising out of abject poverty and demanding a better living standard,” notes Daniel R. DiMicco, head of Nucor, the nation’s largest steelmaker. “That means we have a 20- to 30-year bull market in basic stuff.”

    Hopefully the Obama administration will overcome its preoccupation with post-industrial and green industries and allow American firms and workers to take advantage of this historic opportunity. If they fail to do so, the Great Lakes, Appalachia, parts of the Southeast and other regions can expect ever more economic devastation. Rather than delivering much-anticipated “hope” to the most beleaguered parts of the country, the administration could instead leave a legacy of wasted potential and economic misery that will haunt communities, and the entire country, for generations.

    This article originally appeared at Forbes.

    Joel Kotkin is executive editor of NewGeography.com and is a presidential fellow in urban futures at Chapman University. He is author of The City: A Global History and is finishing a book on the American future.

  • HOPE for Only One Homeowner with a $300 billion Price Tag

    The Housing & Economic Recovery Act of 2008 was passed last August. It created the HOPE for Homeowners Program, which the Congressional Budget Office estimated would help 400,000 homeowners to refinance their loans and stay in their homes. Here’s a stunning revelation: According to the Federal Housing Authority (FHA), in the first six months since the law was passed, exactly one (1) homeowner refinanced under the program!

    You can listen to the story on NPR, “Investors Support Overhauling Homeowner Program“. One such investor, PIMCO, supports programs that would reduce the principal balance on mortgages by a small amount in order to keep the cash flow coming from mortgage payments. Given what we know about investment strategies to push companies into bankruptcy in order to benefit from credit default swap payouts, I was initially leery of such statements coming from bond investors. Then I remembered the problem with the paperwork on the mortgages – if bondholders can’t prove ownership of the lien the homeowner keeps the house with no further payments. That’s when it started to make sense.

    Of course, if they can get the homeowners to come in for a re-fi they can correct the paperwork mistakes. It could be worth it to investors without default protection to accept principal reductions – if the homeowner goes into bankruptcy they may not be able to prove they own the mortgage without the new paperwork. With the re-fi, they get all new documentation.

    These programs were designed for homeowners who are current on their mortgage payments but whose homes are “underwater”, that is, the principal balance on the mortgage is more than the market value of the house. Some can keep up their payments with the hope that the market price of the home adjusts in the distant future; others might benefit by the modest reductions in principal favored by some bond investors. But in a situation described by a Stockton (CA) homeowner the principal reduction is unlikely to be enough – the home is worth $220,000 and the mortgage balance is $420,000. These homeowners’ best financial strategy is to take the hit to their credit report and default on the mortgage. Investors like PIMCO might, if their paperwork is good, get half their investment back by taking possession of the property; they’ll get it all back if they bought the credit default swap; and they get nothing if the paperwork is screwed up.

    How many mortgages are underwater? Bank of America’s annual report says that 23 percent of their residential mortgage portfolio has current loan-to-market value ratios greater than 90 percent. When they include home equity loans in the calculation, totaling lending on a residential property, the share with less than 10 percent equity rises to 37 percent. At the end of 2008, Bank of America held $248 billion in residential mortgages and $152 billion in home equity loans, after taking write-offs of about $4.4 billion last year. On the other hand, Wells Fargo did not specifically report the share of their portfolio with loan-to-market value ratios greater than 90 percent. It’s hard to tell just how many mortgages are how far underwater at an aggregate level. I would imagine that these numbers are being checked in the Treasury’s stress testing of individual banks.

    In any event, Congress is not giving up (although we almost wish they would before this gets any worse). The House Committee on Financial Services combined with the House Judiciary Committee has introduced a new bill to improve the old bill’s version of Hope for Homeowners. Trying to take it a step further, the House Financial Services Committee is holding hearings on a Mortgage Reform Bill next week. The plan is to set lending standards for all mortgage originators. Chairman Barney Frank (D-MA) is of the view that the “great economic hole” we are in was started by“ policymakers’ distrust of regulation in general, their enduring belief that markets and financial institutions could effectively police themselves.”

    With this we do agree: self-regulation in financial services is a root cause of our current economic disaster. Until it is completely removed – not just from mortgage lending but from all financial products and services – nothing Congress does will prevent another crisis.

  • Local and State Tax Burden Maps

    The Tax Foundation calculates the taxes paid per capita, including what is spent by people on average in neighboring states, including state and local fees. The two maps show, first, the tax burden, taxes paid as a percent of income, the second, the difference in the ranks of states in tax burden and in income.

    The map for tax burden is colorful, so one might suppose there is a big difference in the local and state burden. There is variation, but the amazing story is how small the differences really are. The variation is from a maximum of 11.8 percent in New Jersey (note that Taxachusetts is in the middle of the pack) to a low of 6.4 percent in Alaska. But most states, 38, are in between 8.6 and 10.2 percent.

    The lowest tax burdens are not surprising – Alaska (6.4) and Nevada (6.6), but the next lowest, Wyoming (7) and Florida (7.4), may be a surprise. The highest tax burdens, as may be expected, are megalapolitan New Jersey, New York (11.7), Connecticut (11.1) and Maryland (10.8), but Hawaii (10.6) in this group may be a surprise. The states in the middle, besides Massachusetts, include a contiguous set centered in Chicago – Illinois, Indiana, Iowa, Michigan, Kentucky and West Virginia (all 9.3 to 9.5).

    The modest range of burdens implies that generally richer states have higher tax burdens and poorer states have lower burdens, but the second map shows that there are many exceptions. Richer states with higher tax burdens include (a small difference in tax and income ranks) District of Columbia, New Jersey, Connecticut, New York and Maryland, and poorer states with a moderately low tax burden are few – Alabama, New Mexico and Montana. Poorer states but with a high tax burden are Arkansas, Kentucky, Utah and Idaho, but this finding perhaps tells us the statistical problem or risk in using per capita rather than per household measures. Strongly Mormon Utah and Idaho, indeed all four states have high average household size, so are not as disadvantaged as the data suggest. For a similar reason, Florida may not be as good as it looks, since it has a quite low average household size.

    Most interesting may be the richer states with lower ranking tax burdens, notably Wyoming, New Hampshire, Washington and Nevada. Other states with a relatively low burden (lower tax rank than income rank) include Alaska, Colorado, Florida, Massachusetts, and Texas and other states with a relatively high burden (much higher tax rank than income rank) include Georgia, Kentucky, Ohio and West Virginia.

    Finally states with close to the same rank in income and tax burden include a set of contiguous Midwestern states, Iowa, Minnesota, Missouri, and Kansas, then Michigan, Oregon and California.

    But in sum, choosing a state based on its local and state tax burden could be worth the effort, but the effects by themselves could be more limited than commonly supposed.

  • Mapping Farmers Markets

    New Geography contributor Richard Reep has written lately on the increasing activity of farmer’s markets and how the financial crisis may boost local markets.

    Here’s a great interactive map at FortiusOne GeoCommons of a USDA database of national farmers markets.

  • Big Movers – Up and Down the 2009 Best Cities Rankings

    In a year when modest – if not negligible – growth could nudge a city toward the top of the Best Cities for Jobs rankings you would suspect there to be little opportunity for big leaps up the scale. On the other hand, one could easily expect that there would be some places whose economic fortunes would resemble a vertigo-inducing fall.

    A look at the 2009 rankings confirms that there are many cities whose job-creating engines have sputtered.

    Among 336 cities in the rankings 46 cities fell more than 100 places compared to their position in 2008. Below are seven places that took the biggest fall and plummeted more than 200 places compared to 2008.

    Seven Falling Stars: Ranking Fell More than 200 Places 2008-2009
    City 2008 2009 Rank Change
    Port St. Lucie, FL 88 290 -202
    Pensacola-Ferry Pass-Brent, FL 98 302 -204
    Reno-Sparks, NV 104 314 -210
    Myrtle Beach-North Myrtle Beach-Conway, SC 10 230 -220
    Prescott, AZ 26 252 -226
    Winchester, VA-WV 73 299 -226
    Yuma, AZ 33 266 -233


    The Big Downstroke
    Yuma, Arizona’s precipitous decline of 233 places is partly the result of its once envious position among the top ten percent of cities in 2008. It appears they came late to the economic wake that hit some towns with the collapse of the housing bubble in Arizona, Florida and Nevada as early as 2007 . In many communities in these states 2008 reflected things getting worse as commercial and industrial construction activity also dropped off.

    The good news for Yuma, according to Paul Shedal of Yumastats.com is that the “biggest economic pillars,” agriculture and government, have remained relatively unscathed by the recession providing a fallback point that other markets don’t have. This means that our worst case scenario for recession “harm” would be returning to our pre-boom level of economic sustainability rather than some depression abyss.”

    Another falling star, Winchester, Virginia, fell 226 places in the rankings, experiencing what some in northern Virginia have described as a dramatic turnaround. Manufacturing in this part of the Northern Shenandoah Valley is linked to housing and vehicles, two industries hard hit lately. American Woodmark, the third-largest kitchen and cabinetmaker in the U.S. scaled back production as sales to homebuilders continue to fall. The services sector, once a bright spot for the region, has been shedding jobs in the midst of the recession. And major retailers like Linens N’ Things and Circuit City recently closed.

    One bright spot in the Winchester area’s economy is the increase of jobs in the federal government sector, an advantage of its 75 mile proximity to the nation’s capitol. In 2008, the federal government added 400 jobs to the local economy at the Federal Emergency Management Agency offices in Stephenson and the FBI training and recruitment center in Winchester.

    Rising Stars
    Even in a troubled economy one expects that some places will thrive simply through determination and bold leadership moves, the foresight to have done the right things, or the luck of the draw. Everyone shares a hopeful optimism that a meteoric rise can offer a glimpse of things to come and perhaps offer a roadmap to a more prosperous future.

    Rising Stars: Top Five Rankings Climbers 2008-2009
    City 2008 2009 Rank Change
    Lafayette, IN 287 85 202
    Champaign-Urbana, IL 267 83 184
    Sioux City, IA-NE.-SD 253 80 173
    Lubbock, TX 242 74 168
    Wheeling, WV-OH 305 138 167


    This year’s rising star is without doubt Lafayette, Indiana with an astounding – and surprising given its Midwestern location – 202-place charge up the rankings from 2008. Like three of the other top five rising stars Lafayette came from a slightly above average position in 2008 to a respectable position in the top 100. These are by no means this year’s best places but their economies are defying the pervasive decline in the national economy.

    A visit to the Lafayette Commerce website succinctly tells the tale. “Greater Lafayette wrapped up 2008 with a strong showing.” For Lafayette 2008 was a good year with new capital investments of $600 million, new employment in life sciences industries associated with the Purdue Research Park, and a second new hospital on the way as Greater Lafayette expands its regional healthcare base.

    Equally important, Lafayette, like many university and college towns, benefits from the stabilizing presence of Purdue University, the area’s largest employer, which also serves as a force creating new economic opportunities through research, development and access to an educated workforce.

    The annual report from Lafayette Commerce concludes by focusing on two key elements of their success. “In Greater Lafayette, we’re choosing not to participate in the national recession by using this opportunity for workforce development and innovation. That’s not to say we have been immune to the troubles of the national economy, but on the whole our community is growing, it’s thriving and improving every day.”

    The Impending Future of Boom and Gloom

    Science fiction author William Gibson’s famous quip that “the future is already here – it’s just not equally distributed” could have some credence in this year’s rankings –both up and down the scale.

    The fastest rising cities boast stable employers in government and universities. They are leveraging this edge to create new opportunities in manufacturing, production agriculture and advanced producer services serving diverse sectors. Growth in health care services to the mixture, until recently one of the few remaining generators of new jobs, has also played a role.

    Rising stars like Lafayette have made significant investments in infrastructure and advanced infrasystems, enabling them to create jobs in higher-value, innovation-generating economic activities.

    This year’s cities that fell the furthest portend a return to pre-bubble growth patterns. As in the case of Yuma many places will refocus back on their historically strong core industries, like agriculture, and the economic activities that made them viable centers in the first place.

    For all cities the ability to innovate locally and take advantage of demonstrated areas of competence represent two key ingredients of success – for building on existing momentum or hitting the reset button for a more prosperous future.

    Delore Zimmerman is president and CEO of Praxis Strategy Group and publisher of Newgeography.com

  • Why Today’s Green Era May Fail

    Much of the debate about ways to create a landscape of green homes today has focused on the new tax credits for residential energy efficient windows, solar panels and geothermal options. Passive solar and other design methods which make more sense have yet to qualify for tax credits. If history is any guide, this is an error that may take us down the wrong path.

    Yesterday And Today

    To best understand the direction of today’s green movement, let’s remember the first green era, when the Carter Administration offered a 50% tax credit to solve our energy consumption and pollution problems. The most prolific of the tax financed energy saving devices were unsightly rooftop solar water heaters that marred the suburban landscape. Those solar units cost $5,000 or more installed (1983 dollars). So you, the tax payer, financed $2,500 per home. Unfortunately the heaters had a short life span. Over a decade most wore out and disappeared. The good news was the developed landscape looked better without those things … the bad news was the tax payers likely paid billions for systems that quickly failed.

    Back then, I too was a participant in this green era. I built a 1980’s state-of-the-art home: Passive solar, earth bermed, with a 10kW Bergey Wind Generator, of which the tax payers reimbursed me $13,000.

    With “passive” solar, the sun heats up a dark brick floor in the home, which in turn heats the home on a sunny winter day. In the picture here, you can see the south-facing windows, which allow the sun through to heat the dark tile floors. The bricks were built upon a thick concrete base which stored heat over-night; this is known as the “battery”. No complex systems are needed as the home itself is the collector. It proved to work well.

    The City of Maple Grove, Minnesota, where the home was located, had passed a Wind Generator Ordinance allowing a 100 foot tall wind system to be built on a small city lot with just a permit. Perhaps it was the first city in the country with such a ruling.

    So we constructed a 100’ tall tower with a 10kW Bergey Wind System with its 23 foot diameter blades. A quarter century before today’s Green movement, we had a “Net-Zero” home (it produced more energy than it used).

    The neighbors however, were not enthused, and waged a war against the city, resulting in Maple Grove being the nations first city to repeal a Wind Generator ordinance. Years after the construction, the City made a large offer and bought the generator from me. There was no recovery from the tax laws, so I got to keep the $13,000 credit.

    In 1983 this home cost about $121,000. Twelve years later it was appraised at $186,000. It’s architectural oddity severely limited it’s resale potential. In those years of good home appreciation, had it been a conventionally built, the nearly 4,000 sq.ft. lake front home should have been worth a minimum of $350,000. I had lost nearly $200,000 by going green. In fairness the loss was due to the underground construction and lack of curb appeal, and had nothing to do with its passive solar design, which is why we used passive solar again on our new home.

    Late in 2008, I found myself building Green again, this time as a requirement of a land purchase I made from the City of St. Louis Park, Minnesota. I had to agree to build to MNGreenStar certification, a derivative of LEED modified for severe cold climates.

    This time, in a similar situation to the ‘80s, the housing market downturn coincides with an increase in energy awareness and we have a government controlled by the Democratic Party. We have not found any new Green solutions that simultaneously reduce both initial housing costs and energy consumption. It seems that higher an EnergyStar rating on an item, the more expensive it becomes. The option today still remains to pay more now, for the promise of reduced costs later.

    With most Green ratings there is a list of requirements (with MNGreenstar the “list” is 36 pages long in tiny sized fonts) the builder must contend with to earn “points”. MNGreenstar is modeled after LEED which also contains many “social engineering” requirements.

    I also had my builder, Creek Hill Custom Homes, apply for National Association of Home Builders “Green” certification. My Certification comes with a HERS Rating of 59. I have no idea what that means but I’m told it’s pretty good. It’s on an EnergyStar sticker for the entire house.

    Why Passive Solar instead of Geothermal?

    Since Passive Solar is a very low cost design method and our home has a large unobstructed southern exposure, it simply made sense. This first winter the passive solar was inoperable because we discovered Anderson delivered the wrong glass, reflecting the suns energy out, not letting it in. Regardless, our first gas bill for the January 2009 winter (most days the high was below zero) heating period bill was only $200 at a nice and toasty 72 degrees . We used a conventional 95% Bryant HVAC system with a 3 phase air exchanger, plus a separate gas heater for the garage, a 14,000 BTU Fireplace, and three separate gas cooktops – and 3,600 sq.ft. to heat.

    Considering that the average home sells every 6 years, a home buyer is not likely to recover the initial investment on a $20,000 to $60,000 geothermal system, leaving the cost benefit a future home buyer. There is likely to be a significant long term mortgage on the home, so the interest on a $40,000 geothermal system might eventually add up to over $100,000.

    According to a December 2008 study and report by Oak Ridge Laboratory for the US Energy Department, Geothermal Systems should reduce energy consumption 30% to 35% compared to typical conventional systems (not specifying what “typical” means). On our home savings in January, the coldest month in a decade, would have been only $66. At best we would save $500 annually with Geothermal. If we spent an extra $40,000 for geothermal payback ( even after factoring in the new 30% tax credit) it would take almost half a century ( without factoring interest). I’d be 108 years old by then.

    Had Anderson delivered the correct glass, our heating bill would have been much less than an active complex system (geothermal); there are no moving parts to passive solar.

    Sustainable Green

    We need efficient housing for the mass market home buyer at attainable pricing to make the largest difference. We desperately need many more newer and better technologies and methods than we have today. This will take the same type of research and development effort that the automotive industry maintains to be competitive. Twenty five years ago our government spent enormous amounts of tax payer dollars on grants for programs that no longer exist. We are entering a new era where government will likely make huge funds available for energy related technologies.

    How did the housing industry respond when consumers stopped buying? Why didn’t builders respond by going back to the drawing board to develop innovative and efficient affordable home construction? Where has that good old American innovation gone? We need real solutions that work this time around and we need them to be at prices the average home buyer can afford.

    Those applying for grants should show proof of concept of ideas in working prototypes before any money is released to reimburse their efforts. Even then, green still won’t take off unless this next problem is solved.

    Appraising the Situation… Or Not.

    This may come as a shock, but the home appraisal business does not factor in green at all. Not even those items that actually can clearly demonstrate a quick payback. Certainly a soy derived counter top (with questionable service life) won’t win over the bank, but there are sustainable green solutions. So, what good does winning Silver, Gold or Platinum Green Certification mean if the home is not worth a cent more for financing? To the average consumer what’s most important is valuation for financing. Because the appraisals give no extra value for highly energy efficient homes, lenders see no advantage to green certification. Fix the appraisal and mortgage side of green and there is hope.

    Are we Headed In The Wrong Direction?

    In some ways these difficult to comply with “go for the Gold” certification programs create roadblocks to success by adding unnecessary complexity and costs. The new tax credits for energy efficient windows, solar panels, geothermal, and wind energy ignore passive solar and other design methods which make more sense, yet earn no tax credits. New home construction is much easier than retrofitting an old home to be efficient, yet there are few tax benefits if building new. The middle class is unlikely to finance home improvements even with a 30% tax credit. Most likely only the wealthy can access funds to retrofit a home today, and take advantage of the tax credits. If we continue on the current path, this green era will fail, and in another quarter century the next generation will try again.

    Rick Harrison is President of Rick Harrison Site Design Studio and Author of Prefurbia: Reinventing The Suburbs From Disdainable To Sustainable. His websites are rhsdplanning.com and April 19, 2009

  • Sydney: From World City to “Sick Man” of Australia

    Americans have their “American Dream” of home ownership. Australians go one step further. They have a “Great Australian Dream” of home ownership. This was all part of a culture that celebrated its egalitarian ethos. Yet, to an even greater degree than in the United States, the “Dream” is in the process of being extinguished. It all started and is the worst in Sydney.

    Sydney is Australia’s largest urban area, having passed Melbourne in the last half of the 19th century. With an urban area population of approximately 3.6 million, Sydney leads Melbourne by nearly 300,000.

    The “Great Australian Dream” in Sydney: Sydney incubated and perfected the Great Australian Dream. New housing was built in all directions from the central business district. The most expensive was built to the east and north, while the least expensive – the bungalows and other modest detached houses – rose principally to the west and the south. Western Sydney is the culmination of the Great Australian Dream for perhaps more middle and lower middle income households than any other place in the nation.

    Of course, Western Sydney was not planned in the radical sense of the word currently used by contemporary urbanists. In fact, most have little more regard for Western Sydney than for the shantytowns of Jakarta or Manila. Yet, the people of Western Sydney, like the people of countless modest suburban areas around the world, are proud of their communities and of their homes.

    Rationing Land, Blowing Out Land Prices: About three decades ago, Sydney embarked upon what was to become one of the world’s strongest “smart growth” programs (called “urban consolidation” in Australia). Aimed at concentrating population closer to the core, urban consolidation sought to restrict and even prohibit new housing on the urban fringe. Sydney developed its own equivalent of the famous Portland urban growth boundary. The result is that every land owner knows whether or not their property can be developed, and the favored understandably take advantage by charging whatever price the highly constrained market will bear.

    Reserve Bank of Australia research indicates that the price of raw land – Sydney urban fringe land for building a house that has not yet been fitted with infrastructure (sewers, water, streets, etc.) has now risen to a price of about $190,000 for a one-eighth acre lot. In the days before smart growth, the land would cost about $1,000. Needless to say, adding an unnecessary nearly $190,000 plus margins to the price of a house makes housing less affordable.

    But even where development is nominally allowed, government restrictions make building almost impossible. For years the state government has promised to “release” land for new housing on the western fringe. Yet despite announcement and re-announcement, there have been interminable delays.

    Destroying Housing Affordability: As a result, Sydney is now the second most expensive major housing market in the six nations in our Demographia International Housing Affordability Survey, trailing only Vancouver. Sydney’s Median Multiple (the median house price divided by the median household income) is now 8.3. It should be close to the historic norm of 3.0 or less. Indeed, if land prices had risen with inflation from before urban consolidation, Sydney’s Median Multiple would be less than 3.0. As a result, households entering the housing market can expect to pay nearly three times as much for their houses than was the case before. This will lead to an inevitably lower standard of living compared to what would have otherwise been.

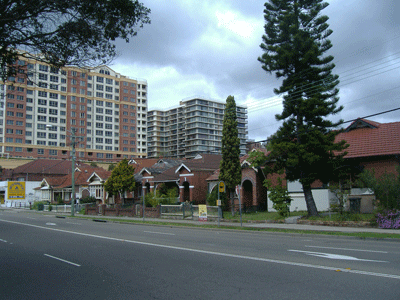
    Forcing Density: Urban consolidation is destroying not only housing affordability, but also the character of Sydney itself. Sydney is an urban area of low density suburbs. It is also an urban area of high rise living. These two housing forms have combined with one of the world’s most attractive geographical settings to create an attractive and livable urban area.

    The planners, empowered by the state of New South Wales government, are changing all of that. From the suburbs of Western Sydney to the attractive and more affluent North Shore suburbs, high-rise residential buildings are being thrust upon detached housing neighborhoods. One of Sydney’s great strengths is that the urban area has many local government areas (municipalities), empowering local democracy. These local governments have done their best to resist the state government densification mandates, in response to opposition from their citizens.

    Raw Exercise of Power: One of Sydney’s greatest weaknesses is that the state government exercises undue control over the municipalities and is using its power to “shoe-horn” high density into places where it makes no sense. High density is fine in the Toney Eastern suburbs, but has no place where detached housing is the rule. Unfortunately, the planners seem to presume communities with detached housing have no character worth salvaging.

    Urban Consolidation: Infrastructure Costs: Further, there is an inherent assumption that densification has no costs. The planners routinely exaggerate the cost of providing infrastructure on the urban fringes (failing, for example, to understand that much infrastructure is included in the price of the house, without government involvement). However, the infrastructure built for lower density detached housing is not sufficient for higher densities. As a result, there have been sewer overflows in densifying areas. Huge expenditures have been made for sewer upgrades. Tony Recsei, president of Save Our Suburbs, a community organization seeking to limit inappropriate densification, blamed recent power failures on an electricity infrastructure that was not built for high density in an April 7 Daily Telegraph letter, noting that “Cram in more people and overloading must result. That should not be too hard for people to understand.”

    Greater Traffic Congestion: And, of course, insufficient road expansion has been undertaken to accommodate the inevitable intensification of traffic congestion. The planners like to say that higher densities mean less traffic. In fact virtually all of the evidence, throughout the first world, indicates that more intense traffic congestion is associated with higher densities.

    Sydney is no exception. The average one-way work trip now takes 34 minutes, which equals that of America’s largest urban area, New York, which has more than five times the population and the land area as well as the longest travel time of any major urban area in the nation. Sydney’s planners delight in comparisons with Los Angeles, frequently suggesting that their regulations are necessary to ensure that Sydney does not “sprawl” as much as Los Angeles. Actually Sydney sprawls considerably more in relation to its population. The Los Angeles urban area is a full one-third more dense than the Sydney urban area. And despite the fact that nearly half of the planned Los Angeles freeway system was not built, Angelinos spend one hour less each week getting to work each than Sydneysiders. Even in Atlanta, with a pathetic freeway system little better than Sydney’s and one-third Sydney’s density, people spend an hour less commuting to and from work every two weeks and spend less total time traveling than in Sydney.

    The Economic Cost: There may also be an economic cost. Bernard Salt – perhaps Australia’s leading demographer – has predicted that Melbourne will overtake Sydney in population by 2028. Moreover, there has been substantial domestic migration from New South Wales to Queensland. At current growth rates this could lead the Brisbane-Gold Coast region being larger than Sydney by mid-century. Salt blames Sydney’s declining fortunes on its overly expensive housing.

    Sydney: World-Class City Status Threatened? Research in the United States has associated restrictive land use regulation with lower levels of employment growth in US metropolitan areas. In a more colorful finding, Australia’s Access Economics characterized the economy of New South as “so sick that it is at risk of adoption by Angelina Jolie.” A few decades ago, the English economy was referred to as the “sick man of Europe.” Sydney may well be on its way to becoming the “sick man of Australia.”

    Wendell Cox is a Visiting Professor, Conservatoire National des Arts et Metiers, Paris. He was born in Los Angeles and was appointed to three terms on the Los Angeles County Transportation Commission by Mayor Tom Bradley. He is the author of “War on the Dream: How Anti-Sprawl Policy Threatens the Quality of Life.

  • Planning: A Shout-Out For Local Players

    More than a century ago, Rudyard Kipling, in his American Notes, shared his views on the character of the US. Along with remarks about the American penchant for tobacco spitting, Kipling recounted the near heroic ability of Americans to govern themselves, especially in small cities and towns. Traveling through the town he called “Musquash” (a pseudonym for Beaver, Pennsylvania) in 1889, Kipling described “good citizens” who participated in “settling its own road-making, local cesses [taxes], town-lot arbitrations, and internal government.”

    Today, the pressures from state and federal governments on local planning have increased geometrically. But across America we are seeing a growing trend toward greater civic participation in land use decisions, as local residents seek to define their communities as unique.

    No longer a Deweyan dream, there are several practical reasons why city governments from Starksboro, Vermont to Hercules, California are involving their residents in important land use/planning decisions. Most important is the challenge presented to local governments by the internet, which provides elements that seriously confront even the most legitimate authority: information, and a place to gather. From city and developer websites to Google searches, research into upcoming housing projects or parks is only a few keystrokes away. At the same time, the web’s social networks offer easy and cheap places for residents to communicate with others (usually like-minded) both inside and outside the local community.

    As a result of single-issue local blogs, Facebook networks, and email campaigns, municipalities have had to become proactive in approaching their residents, including them in processes previously limited to a small group of “stakeholders.” Last year, a mid-sized city in the San Francisco Bay Area was considering the residential development of a significant land parcel, which was once commercial property. Not feeling involved in the early stages of the planning process, a localized environmental group used the internet to build a movement within the city, while it also connected with regional and national environmental organizations to find funding in support of an anti-development ballot proposition. After hundreds of thousands of dollars were spent, this “zoning by ballot” measure was defeated in November.

    A second factor that highlights the importance of intentionally involving citizens is the often-enormous financial cost of these projects for small to mid-sized cities. From land to EIRs, the costs of almost any project – especially those with a public purpose, where taxpayer dollars are on the line – have never been greater. Failing to include residents in these processes, while faster and less expensive in the initial stages, can easily end up costing more and adding months, if not years, to a timeline. In 2007, a Los Angeles-area school district had paid almost $5 million in site planning and architectural costs for a middle school building project. Upon learning that the development would demolish a local supermarket, area residents who had not been involved up to that point organized, and elected a representative to the school board on the promise that he would “stop the school.” He won, and he did, turning the multi-million dollar planning element into a sunk cost.

    This pragmatic reasoning behind civic engagement was recently supported in a 2008 study by the National Research Council. On the subject of government agencies that deal with environmental and planning issues, it concluded, “When done well, public participation improves the quality and legitimacy of a decision and builds the capacity of all involved to engage in the policy process. It can lead to better results in terms of environmental quality and other social objectives.”

    Finally, the pressures placed upon communities to grow, while at the same time control growth, have reached crisis levels in many cities. Here in California, even with the recent economic downturn, the state population is forecast to almost double from its current 34 million people by mid-century. Meanwhile, state-mandated land use legislation, like the recently passed SB 375, constricts the space available for residential development by attempting to control growth to major transportation corridors. Even before this bill passed, the battle here between open space advocates, developers and cities has made “putting a shovel in the ground” an excruciating experience. In San Mateo County (just south of San Francisco), less than 20% of the land mass is available for housing; twice that amount is designated for open space. A group of concerned citizens, including business owners, environmentalists and housing advocates, formed “Threshold 2008” to explore options for residential development. Creating a multi-stage process that has involved over 1,000 San Mateans in various online and face-to-face deliberations, leaders from the group are now working with city planners around the county to find solutions to shortages in affordable housing.

    State-level organizations like the one I work with here in the Golden State, Common Sense California, are supporting cities and towns as they try to involve their publics in these local decisions. We have found that the best engagement efforts invite the most diverse and representative group of residents possible, give them information from a variety of perspectives, and facilitate discussions in such a way that forces participants to wrestle with the issues in the same way planners, city managers, and city councils must.

    At their worst, such “participatory planning” campaigns are pre-ordained and, therefore, manipulative. Organizers can hold this control whether they’re inside government, or, like environmental groups and developers, outside of it. Explicit stakeholders, from developers to environmentalists to city officials, are most effectively engaged in the early stages, serving as an “advisory group”, helping to formulate the information packets and option sets that will be presented to the general public. Practitioners like the Orton Family Foundation and Viewpoint Learning are working with cities that are facing tough land use decisions. A growing number of planning and architectural firms are offering these services, but can be predisposed to certain planning outcomes depending on who hires them.

    Restrictions on local planning decisions made at the state level (and, someday, the Federal level?), combined with the homogenizing influences of web-based organizing supported by national organizations, have created a climate in which the challenges to cities seeking their own unique “personalities” have never been greater. Many cities and towns throughout America are discovering that the most creative solutions can be found by legitimately informing and involving local residents in these decisions.

    In this way, may there be more Musquashes.

    Pete Peterson is Executive Director of Common Sense California, a multi-partisan non-profit that consults on and supports civic engagement efforts throughout California. He also lectures on civic engagement at Pepperdine’s School of Public Policy. He can be reached at p.peterson@commonsenseca.org.