Blog

  • What Happens When There’s Nobody Left to Move to the City?

    Following up on the Pew study that found many states will face declining work age populations in the future, I want to highlight a recent Atlantic article called “The Graying of Rural America.” It’s a profile of the small Oregon town of Fossil, which is slowly dying as the young people leave and a rump population of older people – median age 56 – begin to pass on.

    Like the Pew study, this one has implications that weren’t fully traced out.

    There’s a lot of urban triumphalism these days, as cities crow about Millennials wanting to live downtown and such.

    But the dirty little secret is that a lot of these places have been growing their youth populations by hoovering up the children of their hinterlands. To the extent that urban population growth is dependent on intrastate migration in these states with declining working age populations, at some point there are just plain going to be a lot fewer youngster to move to the big city. That will start to crimp urban population dynamics.

    Indianapolis is a poster-child for this.  About 95% of the metro area’s net migration has come from elsewhere in the state of Indiana since 2000, according to IRS tax return data.

    Looking at the future, about half of the states counties (49 out of 92) are projected to actually lose population by 2050. Here’s the map from the Indiana Business Research Center.


    Projected population change in Indiana counties, 2010-2050. Source: Indiana Business Research Center

    The entire state is only projected to add 100,000 15-44 year olds by 2050. Even if 100% of them, or even more than 100% of them, are in Indianapolis, this still implies a fairly modest growth rate.

    Given the projected demographics of its migration shed, we should expect Indianapolis to start seeing a falloff in migration. In fact, we are already seeing it. Indy was previously the Midwest champ in net domestic in-migration, but recent Census Bureau estimates show a fall-off.

    Here’s what the IRS migration data says about net migration into Indy metro from the rest of the state.

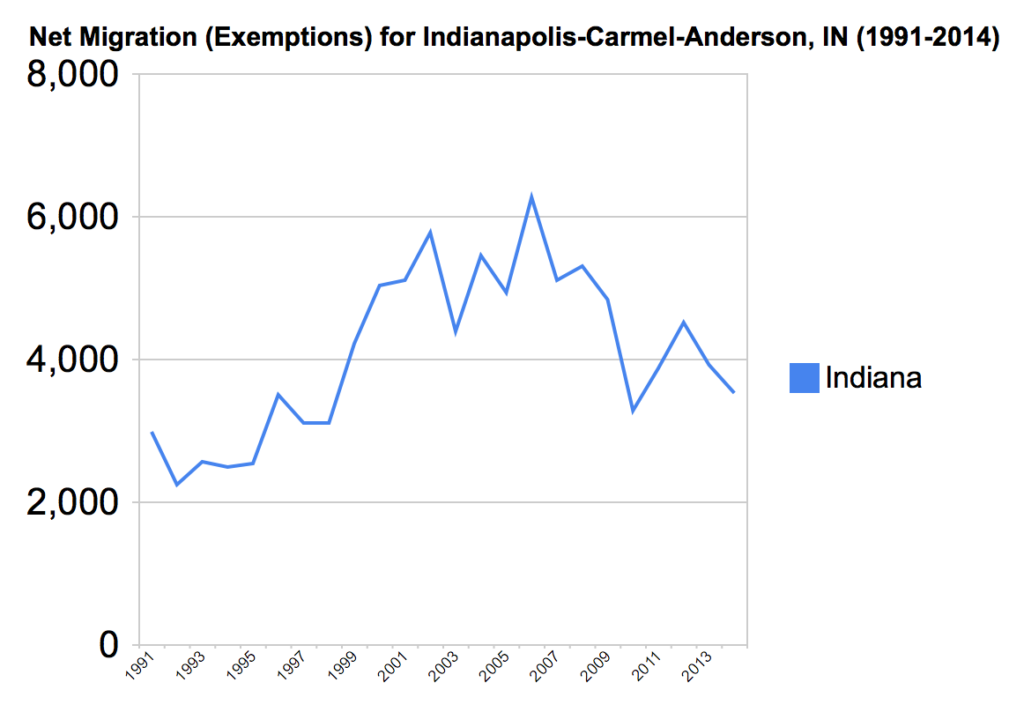
    Net migration into metro Indianapolis from the rest of the state, 1991-2014. Source: Aaron Renn analysis of IRS county to county migration data

    There was a spike up starting around 1997, the dawn of the dotcom era. This more or less corresponded with the rise of the city talk. (Richard Florida’s Rise of the Creative Class came out in 2002).

    During the 2000s, Indianapolis was the Midwest growth champ, and killed it on net domestic migration. This graph helps explain why.

    But starting around 2010, inbound migration from the rest of the state has fallen off. I don’t want to claim this is entirely demographic related. Migration declined nationally during the Great Recession. And there were some methodology tweaks in this data during that time. But we can see already in the numbers what happens to metro growth if migration from the rest of the state slows down.

    At some point, the decline of rural and small manufacturing counties is going to have to show up in the migration numbers to cities like Indy. Other cities that draw primarily from a national base – like Nashville or Dallas – will be less affected.

    But cities that are dependent on a regional migration shed need to start doing the math on how the decline of their hinterlands will affect them.

    The collapse of rural and small manufacturing economies may have been good for cities in the short term, but those cities might discover down the road that they ended up eating their seed corn.

    Aaron M. Renn is a senior fellow at the Manhattan Institute, a contributing editor of City Journal, and an economic development columnist for Governing magazine. He focuses on ways to help America’s cities thrive in an ever more complex, competitive, globalized, and diverse twenty-first century. During Renn’s 15-year career in management and technology consulting, he was a partner at Accenture and held several technology strategy roles and directed multimillion-dollar global technology implementations. He has contributed to The Guardian, Forbes.com, and numerous other publications. Renn holds a B.S. from Indiana University, where he coauthored an early social-networking platform in 1991.

  • It Could Have Been Huge

    With Bernie Sanders now dispatched by Hillary Clinton and the Democratic Party machine, Donald Trump has emerged as the unlikely populist standard-bearer. Not since the patrician Julius Caesar rallied the Roman plebeians, or the aristocratic Franklin Roosevelt spoke for the “forgotten man,” has someone so detached from everyday struggles won over such a large part of the working and middle classes.

    Crass, superficial and materialistic to a fault, Trump, sadly, shares little of the virtues of either Caesar or Roosevelt, more resembling another creepy billionaire, the former Italian prime minister Silvio Berlusconi. Yet, like his wealthy political counterparts, Trump has crafted a message, however crude, that has demolished the Republican corporate establishment and turned conservative intellectuals into virtual irrelevancies.

    The great tragedy for Trump is that the basis for a grass-roots-led Republican victory lay within his grasp. He could have been, like Ronald Reagan in 1980, the instrument of populist revolt had he shown the same wit, self-control and positive eloquence. Instead, his crudity, his barely disguised racial stereotyping and his obsession with himself has taken from the GOP, at least for this election cycle, the possibility of reaping an enormous windfall from the widespread alienation of the populace from the political and economic ruling class.

    Race and Immigration

    Racially tinged issues, notably immigration, propelled Trump’s rise. This reflects the sad reality that race relations in this country have been headed in the wrong direction the past several years. His opposition to illegal immigration – including his absurd, shock-jock-style advocacy of a southern border wall – resonates with a large part of the Anglo population, some African Americans and even some Latinos, a group whose mass desertion from the party may now seal its demise.

    If negotiated with grace and some sensitivity, illegal immigration could have proven a winning issue this fall, as it was in the spring. The killing of Kate Steinle in San Francisco by an illegal immigrant felon, who was protected by that city’s “sanctuary” status, followed by terrorist massacres in Paris and San Bernardino, all played into this theme. Recent revelations about higher-than-reported criminal recidivism among undocumented felons aid the Trump cause.

    Read the entire piece at The Orange County Register.

    Joel Kotkin is executive editor of NewGeography.com. He is the Roger Hobbs Distinguished Fellow in Urban Studies at Chapman University and executive director of the Houston-based Center for Opportunity Urbanism. His newest book, The Human City: Urbanism for the rest of us, will be published in April by Agate. He is also author of The New Class ConflictThe City: A Global History, and The Next Hundred Million: America in 2050. He lives in Orange County, CA.

    Photo by Gage Skidmore [CC BY-SA 3.0], via Wikimedia Commons

  • The End of Job Growth

    Pew Charitable Trusts recently posted an analysis of population projections that show several states with stagnant to declining workforces.

    This means that for nearly 20 states, it’s basically impossible to add jobs in the future. How can you add more jobs with fewer workers?

    That doesn’t mean there won’t be cyclical ups or downs or that some slack in the system might be taken up with some growth, but overall, stagnation to decline in jobs is going to follow.

    Pew’s article mentions states fighting to retain a high skill labor force, but this doesn’t seem very likely. Most of these places are in the north and northeast and have been stagnant for a long time.

    What’s going to change the migration of population to the South and West? While change is always possible, it’s not obvious what might cause it.

    Cities and states need to think hard about what this means for them. It seems to me is that one effect will be to fuel intrastate divergence, as success pools into islands in an era of overall shrinkage. You can argue we’re already seeing this.

    For most localities who aren’t among the favored winners, the reality is that they need to do what I advocated for Buffalo, and find a new psychology of civic improvement that isn’t rooted in growth – in population, jobs, or building stock. (I should add, Buffalo is in a far better position than most and could enjoy a relatively bright future – but it probably won’t be a big growth story)

    This won’t be easy.

    One of the great assumptions of the American worldview is the equating growth with success in our communities. Communities that are adding people, adding jobs, building new things, etc. are seen to be succeeding, whereas shrinking or stagnant ones must be failing.

    Everybody believes this. Even those who talk about “growth without growth” or tout increasing per capita income as the real measure of economic development invariably tout growth if there’s a figure that shows it.

    Lots of urbanists like to pooh-pooh Texas growth, but when 60,000 people move into downtown Chicago, or transit ridership soars in New York, or tech jobs explode in the Bay Area, they immediately tout and trumpet those figures as signs of success.

    And good for them. The point is that we all view growth as the measure of success.

    What would a new psychology look like?

    One example would be the boutique model. Rather than trying to be bigger, you become more exclusive. This isn’t a model that’s applicable to these stagnant places however.

    More realistically, these places need to focus on healing from or managing their problems (including managing decline in some places like rural communities).  Some areas of focus:

    • Pension and debt issues
    • Environmental remediation
    • Segregation
    • Raising educational attainment (to high school at least), even if that means the people subsequently leave
    • Infrastructure
    • Restructuring core services to be sustainable

    Not easy, and realistically requiring outside financial and technical assistance.

    What’s more, this is a to do list, not a psychology of success. How can one begin to articulate a positive, affirmational view of a place’s future that captures some program like this?

    Perhaps there are other ways to think about this too. Please share thoughts in the comments if you have them.

    The key is that with a shrinking working age population, there’s little prospect of job growth. So any governor in one of these places who has that as a long term economic objective is bound to be frustrated. This is a reality that will have to be faced.

    Aaron M. Renn is a senior fellow at the Manhattan Institute, a contributing editor of City Journal, and an economic development columnist for Governing magazine. He focuses on ways to help America’s cities thrive in an ever more complex, competitive, globalized, and diverse twenty-first century. During Renn’s 15-year career in management and technology consulting, he was a partner at Accenture and held several technology strategy roles and directed multimillion-dollar global technology implementations. He has contributed to The Guardian, Forbes.com, and numerous other publications. Renn holds a B.S. from Indiana University, where he coauthored an early social-networking platform in 1991.

    Top map image via Pew Stateline

  • The Evolving Urban Form: Detroit

    Probably no city in the high income world evokes impressions of urban decline more than Detroit — and for good reason. The core city of Detroit has lost more of its population than any developed world city of more than 500,000 since 1950. The city’s population peaked at 1,850,000 residents in 1950 and at its decline rate since 2010 could drop below 650,000 residents by 2020 census.

    It was not always this way. During the first half of the 20th century Detroit was one of the fastest-growing core cities in the United States. Among the 20 largest core cities in 1950, only Los Angeles grew faster, percentage wise, than Detroit. The city of Los Angeles grew from 102,000 in 1900 to 1,970,000 in 1950. The city of Detroit almost matched that, growing from 286,000 to 1,850,000.

    The city’s nearly 1.6 million population increase exceeded that of all other US municipalities except Los Angeles, Chicago and New York, which grew at an unprecedented pace over the period, adding more than 4.5 million residents.

    The current defined area of the Detroit metropolitan area grew by 1950 to nearly 6 times its 1900 population, to 3,170,000 from 530,000. The growth of the metropolitan area from 1900 to 1940 closely tracked that of the fast growing Los Angeles metropolitan area, which widened its lead substantially through the end of the century (Figure 1). The Los Angeles area, which was only slightly larger than the Detroit area in 1940 reached a population of more than three times that of Detroit by 2010

    The city of Detroit began to lose population after 1950. It lost 180,000 people between 1950 and 1960 and   approximately 155,000 between 1960 and 1970. The 1970s were a particularly bad time for the many large core cities, and Detroit lost more than 300,000 people, or 20% of its population by 1980. But if Detroit was exceptional, it was not alone; virtually all large US core cities that did not annex territory between 1950 and 1980 lost population.

    In fact, Detroit’s loss was not even the worst. During the 1970s, the city of St. Louis lost 27% of its population, dropping to little more than half its 1950 size, from 857,000 to 452,000. At this point and through 2010, St. Louis had the less than enviable record of the largest population loss for a major high income world municipality. As of 2010, the city of St. Louis had lost 62.8% of its population, more than the city of Detroit’s 61.6% (Figure 2).

    But things were about to change. Between 2010 and 2015 the decline rate in both cities was moderated. But city of Detroit’s loss was large enough to wrest away the title for the largest decline from the city of St. Louis. According to the US Census Bureau’s 2015 estimates, Detroit has lost 63.3% of its population since 1950 while St. Louis lost somewhat less, at 63.1%.

    Having spent considerable time in both cities, however, one does not get the same sense of urban devastation in St. Louis as in Detroit. The urban decline of city of St. Louis has been far more graceful than the city of Detroit. A long-time Detroit and St. Louis resident and commentator writing in the St. Louis Beaconcalled the differences “quite striking,” noting that Detroit’s devastation was far wider spread and that neighborhoods continue to thrive in large parts of the city of St. Louis.

    Obviously, Detroit has faced huge challenges and probably greater challenges than St. Louis or the Rust Belt cities of Pittsburgh, Cleveland and Buffalo. Indeed, one of Pittsburgh’s strengths is its strong civic community downtown, with its large banks, its still strong neighborhoods and striking physical location. One of Detroit’s banks moved its headquarters to Dallas.

    Figure 3 graphically illustrates the population trends in the Detroit metropolitan area since 1950. The city of Detroit’s massive loss is indicated by the first bar for each year. But despite the city’s losses between 1950 and 1970, totaling more than 340,000 residents, the balance of Wayne county (of which Detroit is the county seat) nearly doubled in population, from 585,000 to 1,150,000. However, since that time, suburban Wayne County (outside the city of Detroit) has stagnated downward to 1,088,000 residents (Figure 3).

    The other suburban counties have done far better. The largest of these are Oakland County to the northwest of the city and Macomb County, which is straight north from downtown. Since 1950, Oakland County has grown from 400,000 residents to nearly 1.25 million in 2015. Macomb County, famous for the “Reagan Democrat” blue-collar worker vote, grew from 190,000 in 1950 to 860,000 in 2015. The smaller counties of Lapeer, Livingston and St. Clair also expanded strongly. Overall, the suburbs outside Wayne County grew by 240%, from 735,000 in 1950 to more than 2.5 million in 2015.

    Early on, the metropolitan area continued to add people strongly. Between 1950 and 1970, the metropolitan population rose by 40%, to more than 4.3 million. The population dropped in both the 1980 and 1990 censuses. But in 2000, a new peak of 4.45 million was reached. The metropolitan area losses resumed with lower figures indicated for the 2010 census and in the 2015 estimates (4.275 million). The "ups and downs" of the metropolitan population are illustrated in Figure 4.

    Given my own experience, the decline of Detroit is particularly surprising. As a consultant to Oakland County Executive Daniel T. Murphy between 1985 and 1990, I had the pleasure of witnessing firsthand cooperative efforts between the suburban leadership and the city of Detroit (under then Mayor Coleman Young) on transportation issues. Murphy and Young had established a regional cooperative process referred to as the "Big Four" along with Wayne County Executive Bill Lucas and then Wayne County Executive Edward H McNamara (and current Detroit mayor Mike Duggan, who was Deputy County Executive), along with the leadership of the Macomb County Commission. It was clear to me that there was a very real commitment on the part of all four to deal with the pressing problems of the area.

    The good news is that there are signs of a turnaround in Detroit. I doubt we will ever see Detroit return to a its peak population of 1.85 million or even 1 million. Even the lower figure would require a reversal unprecedented in developed world urban history, made far more unlikely by the slow population growth of the Upper Midwest and laggard fertility rates nationally. (Note). But, for the first time in decades, there are signs of hope out of the city and its leadership. Good luck, city of Detroit and Mayor Duggan.

    Note: See Wendell Cox, “International Shrinking Cities, Analysis, Classification and Prospects,” in Harry W. Richardson and Chang Woon Nam, Shrinking Cities: A Global PerspectiveRoutledge, 2014.

    Wendell Cox is principal of Demographia, an international pubilc policy and demographics firm. He is a Senior Fellow of the Center for Opportunity Urbanism (US), Senior Fellow for Housing Affordability and Municipal Policy for the Frontier Centre for Public Policy (Canada), and a member of the Board of Advisors of the Center for Demographics and Policy at Chapman University (California). He is co-author of the “Demographia International Housing Affordability Survey” and author of “Demographia World Urban Areas” and “War on the Dream: How Anti-Sprawl Policy Threatens the Quality of Life.” He was appointed to three terms on the Los Angeles County Transportation Commission, where he served with the leading city and county leadership as the only non-elected member. He served as a visiting professor at the Conservatoire National des Arts et Metiers, a national university in Paris.

    Photo: downtown Detroit

  • The Cruel Information Economy: The U.S. Cities Winning In This Critical Sector

    Arguably the most critical industry in the new economy, information is also often the cruelest. It is the ultimate disruptor of jobs and growth, blessing some regional economies but leaving most in the dust. Overall, the sector accounts for almost 3 million jobs, but it has only added a paltry net 70,000 jobs over the last five years. The overall numbers mask a loss of about 200,000 jobs in newspapers, book publishing, broadcasting and telecommunications, while employment in software publishing, data processing and other tech-driven information jobs has expanded by a modest 240,000 jobs (manufacturing, by comparison, has produced three times that amount in the same period).

    Our rankings for the best cities for information jobs are perhaps the most skewed of any occupational category. With more traditional industries like business services, hospitality and construction, employment tends to rise across all the country’s metropolitan areas, if not at the same pace everywhere. In the case of the information sector, the vast majority of the metropolitan statistical areas for which we have data have lost information jobs since 2010 (204 out of 336 MSAs).

    Yet there are clear winners in the information sweepstakes, with a handful of metro areas that have seized the initiative in the field and run with it.

    Information, particularly its media segment, has shown a strong proclivity to concentrate in a handful of places. Whether it’s a matter of where venture funds are concentrated, or that cross-fertilization and creative flair are driving this, it’s hard to say. But in the emerging digital economy, notes a recent Neiman study, clusters industries in the places where creators of content live. For the most part, as of yet, blue collar metro areas need not apply.

    Info-Age Winners

    Our rankings are based on employment growth in the sector over the short-, medium- and long-term, going back to 2005, and factor in momentum — whether growth is slowing or accelerating. (For a detailed description of our methodology, click here.)

    At the top of our list of the largest metropolitan statistical areas, not surprisingly, is San Francisco-Redwood City-South San Francisco. Since 2010, led by the growth of such companies as TwitterFacebook and Salesforce.com, the metro area’s information employment has expanded 62% to 61,000 jobs. The pace of growth is slowing, to 6.85% last year, but still very healthy.

    Right behind San Francisco is the larger information-based economy of its neighbor Silicon Valley. The San Jose metro area, home to such information economy titans as Google and Netflix, has 76,000 information jobs, up a none-too-shabby 57.4% since 2010; last year its 9.3% job growth rate outstripped even San Francisco. Together these two areas have emerged as the superstars of the information age, and no other large metro is really close in terms of growth.

    Yet the information boom has other epicenters that have emerged over the past decade. Among the large metro areas, Seattle-Bellevue-Everett ranks seventh on our list. It boasts 98,000 information jobs, third most in the country behind much larger New York and Los Angeles. Since 2010 the Puget Sound powerhouse, home to Microsoft, Amazon and a host of start-ups, has seen its information employment expand a healthy 15.3%.

    Seattle’s little brother, Portland-Vancouver-Hillsboro, Ore., ranks eighth. Since 2010 Portland’s information employment has grown over 12% to 25,500 workers.

    Among the very largest of our metro areas, New York has managed fairly impressive growth in its media-dominated information sector, with employment expanding 12.1% since 2010 to 191,000 workers, second in total numbers, and with no sign of growth flagging.

    It’s doing much better than the Big Apple’s two traditional rivals, Chicago and Los Angeles. The Windy City and its environs have expanded information employment by 5% since 2010 to with 73,100 jobs, placing it 19th. Los Angeles follows in 20th place. L.A. is home to the largest information sector in the U.S., with 203,800 workers, but despite its well-established base, much of it in entertainment, it has managed only 3.5% growth since 2010.

    Will Information Jobs Head To The Sun Belt?

    The growth of information employment in large, dense and expensive urban areas, notably New York and San Francisco, has been widely celebrated by advocates of traditional cities. Yet this same pattern also developed in the last tech bubble in the late 1990s, and then reversed as companies collapsed, and many of the survivors moved operations to less expensive regions.

    Could we see a repeat now? High housing costs are putting homeownership out of reach even for fairly affluent families in San Francisco and New York. Already some tech workers are relocating to lower-cost areas. Many more may do so in the future, suggests a recent Beacon Economics study, or resign themselves to being permanent renters.

    This year’s list may show some of the places both tech and information jobs may be headed in the next few years. The clear rising star is Phoenix, which ranks third. The desert city’s information workforce has expanded by 39.29% since 2010, the third highest increase of any metropolitan area, just behind the Bay Area twins. In recent years a growing list of Bay Area firms have expanded into the Valley of the Sun, including DoubleDutch, Gainsight, Uber, Prosper Marketplace, Yelp, Weebly, BoomTown and Shutterfly. Silicon Valley Bank set up shop there five years ago as well.

    Other lower-cost locales are also doing well on our big metro list, including No. 4 Raleigh, N.C., No. 5 Austin-Round Rock, Texas,  and No. 10 Ft. Lauderdale, Fla. All have enjoyed double-digit information job growth since 2010.

    Although information jobs tend to concentrate in bigger metros, there are several smaller metro areas that appear to be on the cusp of becoming key hubs for the industry. The fastest growth over the past five years has been in Provo-Orem, Utah, where information employment has expanded 43.8% to 11,400 jobs. Other fast-rising smaller stars include Flagstaff, Ariz.,  Durham-Chapel Hill, N.C.,  Madison, Wisc., Bend-Redmond, Ore., and Portsmouth, N.H. All these metro areas have enjoyed information job growth of 20% or more since 2010, albeit off small bases.

    The Likely Future of Information Growth

    Clearly information jobs cluster, although they do so in varied kinds of environments. To be sure, the biggest players likely will continue to be in the largest cities, notably in the Bay Area, New York, Seattle and, as long as Hollywood stays strong, Southern California as well. But the high prices in these areas seem to be leading to growth in a host of second-tier cities spread from Florida to Arizona, where tech workers can enjoy a combination of lower home costs and at least some urban amenities.

    Similarly, while most smaller cities may never become information hubs, some clearly will. For the most part these will be either university towns such as Chapel Hill (home to the University of North Carolina), Provo-Orem (Brigham Young) and Madison (University of Wisconsin). Other will be located in amenity-rich, scenic areas like Flagstaff and Bend, Ore., where outdoor-oriented tech workers may find a way to work remotely from the big city hubs.

    But under any foreseeable future, it’s unlikely that information job growth will be strong enough to help in a measurable way the fortunes of most communities. Traditional advantages in terms of taxes, location on rivers or the ocean, or access to cheap energy is simply not enough to lure these jobs to a wide array of locales. Information may be a stellar force in some areas, but it has very picky tastes that preclude it from being as transformative in job creation as it is in our daily lives.

    This piece first appeared at Forbes.

    Joel Kotkin is executive editor of NewGeography.com. He is the Roger Hobbs Distinguished Fellow in Urban Studies at Chapman University and executive director of the Houston-based Center for Opportunity Urbanism. His newest book, The Human City: Urbanism for the rest of us, will be published in April by Agate. He is also author of The New Class ConflictThe City: A Global History, and The Next Hundred Million: America in 2050. He lives in Orange County, CA.

    Michael Shires, Ph.D. is a professor at Pepperdine University School of Public Policy.

  • All Cities Information Jobs – 2016 Best Cities Rankings

    Read about how we selected the 2016 Best Cities for Job Growth

    2016 MSA Info Ranking – Overall  Area 2016 Weighted INDEX 2015 Info Emplymt Total Info Emplymt Growth Rate 2014-2015 2015 MSA Info Ranking – Overall  2016  Change from 2015 –
    All MSAs
    1 Provo-Orem, UT 97.8    11.4 8.25% 8 7
    2 San Francisco-Redwood City-South San Francisco, CA Metro Div 97.5    60.9 6.85% 3 1
    3 San Jose-Sunnyvale-Santa Clara, CA 96.5    76.8 9.30% 2 (1)
    4 Flagstaff, AZ 96.5      0.5 25.00% 82 78
    5 Durham-Chapel Hill, NC 94.8      4.5 7.09% 10 5
    6 Madison, WI 94.1    16.5 8.10% 11 5
    7 Bend-Redmond, OR 92.7      1.8 12.77% 32 25
    8 Phoenix-Mesa-Scottsdale, AZ 90.6    38.2 7.51% 22 14
    9 Raleigh, NC 90.3    20.0 4.34% 15 6
    10 Portsmouth, NH-ME NECTA 90.2      2.6 8.33% 30 20
    11 Austin-Round Rock, TX 89.5    27.3 3.41% 9 (2)
    12 Charlotte-Concord-Gastonia, NC-SC 87.9    26.5 4.19% 17 5
    13 Seattle-Bellevue-Everett, WA Metro Div 86.5    98.0 6.44% 29 16
    14 Portland-Vancouver-Hillsboro, OR-WA 86.5    25.5 7.15% 47 33
    15 Bakersfield, CA 85.6      3.0 23.61% 230 215
    16 Wilmington, NC 84.6      3.0 4.60% 21 5
    17 Ann Arbor, MI 84.6      5.2 2.65% 12 (5)
    18 Akron, OH 82.8      4.4 8.20% 124 106
    19 Lawrence-Methuen Town-Salem, MA-NH NECTA Division 82.6      1.7 2.00% 45 26
    20 Bridgeport-Stamford-Norwalk, CT NECTA 82.5    12.2 1.66% 48 28
    21 Spokane-Spokane Valley, WA 82.5      3.3 12.36% 80 59
    22 Fort Collins, CO 82.2      2.8 3.70% 70 48
    23 Racine, WI 81.8      0.5 15.38% 196 173
    24 McAllen-Edinburg-Mission, TX 81.7      2.4 2.90% 37 13
    25 Savannah, GA 81.6      1.9 -4.92% 4 (21)
    26 Rochester, MN 81.0      2.0 0.00% 5 (21)
    27 New York City, NY 80.1  191.1 1.63% 25 (2)
    28 Delaware County, PA 78.9      2.9 6.17% 197 169
    29 Jackson, MS 78.9      5.5 -4.62% 18 (11)
    30 Trenton, NJ 78.8      5.6 17.36% 243 213
    31 Haverhill-Newburyport-Amesbury Town, MA-NH NECTA Division 78.7      0.4 0.00% 46 15
    32 Clarksville, TN-KY 78.0      1.2 6.06% 49 17
    33 Cheyenne, WY 77.7      1.2 0.00% 19 (14)
    34 Lowell-Billerica-Chelmsford, MA-NH NECTA Division 77.5      7.0 1.94% 125 91
    35 San Luis Obispo-Paso Robles-Arroyo Grande, CA 77.0      1.5 0.00% 51 16
    36 Flint, MI 76.9      4.1 0.81% 33 (3)
    37 St. George, UT 76.7      0.8 4.55% 135 98
    38 Punta Gorda, FL 76.6      0.5 7.69% 227 189
    39 Baton Rouge, LA 76.4      6.2 -7.96% 7 (32)
    40 Myrtle Beach-Conway-North Myrtle Beach, SC-NC 76.2      2.5 2.78% 97 57
    41 Fort Lauderdale-Pompano Beach-Deerfield Beach, FL Metro Div 76.1    19.4 2.47% 53 12
    42 Atlanta-Sandy Springs-Roswell, GA 75.9    87.3 -0.68% 41 (1)
    43 Tuscaloosa, AL 75.6      0.9 8.00% 214 171
    44 Fond du Lac, WI 75.6      1.0 0.00% 20 (24)
    45 Janesville-Beloit, WI 75.5      1.6 -7.69% 1 (44)
    46 Manchester, NH NECTA 75.5      3.3 10.00% 212 166
    47 Las Vegas-Henderson-Paradise, NV 74.9    10.6 -0.31% 38 (9)
    48 Victoria, TX 74.6      0.5 25.00% 26 (22)
    49 Lansing-East Lansing, MI 74.3      3.0 1.12% 136 87
    50 Boston-Cambridge-Newton, MA NECTA Division 74.2    56.8 1.43% 52 2
    51 Greenville-Anderson-Mauldin, SC 74.1      7.4 1.36% 105 54
    52 Nashville-Davidson–Murfreesboro–Franklin, TN 73.9    21.2 3.41% 71 19
    53 Bay City, MI 73.8      0.5 0.00% 57 4
    54 Charleston-North Charleston, SC 72.9      5.3 -0.62% 44 (10)
    55 Lincoln, NE 72.5      2.6 1.30% 35 (20)
    56 Denver-Aurora-Lakewood, CO 72.4    46.2 2.59% 115 59
    57 Charlottesville, VA 72.4      2.2 6.35% 150 93
    58 Hartford-West Hartford-East Hartford, CT NECTA 72.3    11.9 2.59% 90 32
    59 North Port-Sarasota-Bradenton, FL 71.7      3.6 4.85% 101 42
    60 Fayetteville-Springdale-Rogers, AR-MO 71.6      2.0 5.17% 173 113
    61 College Station-Bryan, TX 71.4      1.3 0.00% 14 (47)
    62 Abilene, TX 71.1      1.2 0.00% 42 (20)
    63 Tyler, TX 70.5      2.3 0.00% 54 (9)
    64 El Paso, TX 70.4      5.9 -1.12% 39 (25)
    65 San Antonio-New Braunfels, TX 70.2    21.3 -0.62% 27 (38)
    66 West Palm Beach-Boca Raton-Delray Beach, FL Metro Div 70.2    10.5 0.32% 58 (8)
    67 Chicago-Naperville-Arlington Heights, IL Metro Div 70.0    73.1 2.67% 108 41
    68 Albuquerque, NM 70.0      8.4 5.91% 226 158
    69 Los Angeles-Long Beach-Glendale, CA Metro Div 68.9  203.8 2.79% 102 33
    70 Tacoma-Lakewood, WA Metro Div 68.2      3.0 7.14% 75 5
    71 Baltimore City, MD 67.9      4.5 5.51% 283 212
    72 Salt Lake City, UT 67.3    18.1 1.31% 63 (9)
    73 Chattanooga, TN-GA 67.2      3.1 5.68% 143 70
    74 Pueblo, CO 67.1      0.7 10.53% 153 79
    75 Omaha-Council Bluffs, NE-IA 67.0    11.6 2.06% 133 58
    76 Warren-Troy-Farmington Hills, MI Metro Div 66.8    20.1 -2.11% 36 (40)
    77 Santa Maria-Santa Barbara, CA 66.7      4.3 -3.73% 23 (54)
    78 Logan, UT-ID 66.6      0.8 0.00% 13 (65)
    79 Peabody-Salem-Beverly, MA NECTA Division 66.6      1.3 0.00% 67 (12)
    80 Philadelphia City, PA 66.3    11.9 2.29% 148 68
    81 Fresno, CA 65.8      3.9 -1.69% 89 8
    82 Auburn-Opelika, AL 65.7      0.5 0.00% 81 (1)
    83 Anaheim-Santa Ana-Irvine, CA Metro Div 65.4    25.7 3.62% 228 145
    84 Dallas-Plano-Irving, TX Metro Div 64.8    68.8 0.88% 76 (8)
    85 Burlington, NC 64.7      0.5 0.00% 78 (7)
    86 Cleveland, TN 64.5      0.3 0.00% 77 (9)
    87 Prescott, AZ 64.4      0.6 0.00% 109 22
    88 Dutchess County-Putnam County, NY Metro Div 63.9      2.0 7.02% 232 144
    89 Visalia-Porterville, CA 63.8      1.0 0.00% 169 80
    90 Springfield, MO 63.8      4.2 -4.55% 24 (66)
    91 Allentown-Bethlehem-Easton, PA-NJ 63.7      6.1 1.10% 106 15
    92 Watertown-Fort Drum, NY 63.2      0.7 0.00% 107 15
    93 San Rafael, CA Metro Div 62.8      2.6 2.63% 144 51
    94 Bergen-Hudson-Passaic, NJ 62.7    19.6 1.55% 73 (21)
    95 Santa Rosa, CA 62.4      2.7 0.00% 116 21
    96 Hagerstown-Martinsburg, MD-WV 62.4      2.4 1.41% 199 103
    97 Cincinnati, OH-KY-IN 62.2    13.8 1.72% 155 58
    98 Lewiston, ID-WA 62.2      0.4 0.00% 88 (10)
    99 Cape Coral-Fort Myers, FL 62.0      3.2 1.06% 130 31
    100 Boise City, ID 61.9      4.5 -3.57% 99 (1)
    101 Morristown, TN 61.6      0.4 33.33% 336 235
    102 Worcester, MA-CT NECTA 60.8      3.5 0.95% 179 77
    103 Nashua, NH-MA NECTA Division 60.7      1.9 0.00% 189 86
    104 Oakland-Hayward-Berkeley, CA Metro Div 60.6    22.8 4.92% 237 133
    105 Orlando-Kissimmee-Sanford, FL 60.3    23.7 -2.06% 56 (49)
    106 Huntsville, AL 59.4      2.6 -3.70% 40 (66)
    107 Ithaca, NY 59.4      0.5 0.00% 297 190
    108 Redding, CA 59.4      0.7 0.00% 91 (17)
    109 Sioux Falls, SD 59.1      2.7 2.53% 120 11
    110 Pocatello, ID 59.1      0.4 0.00% 65 (45)
    111 Grants Pass, OR 59.1      0.3 0.00% 100 (11)
    112 Indianapolis-Carmel-Anderson, IN 58.9    16.0 -3.42% 60 (52)
    113 Knoxville, TN 58.7      5.7 -1.16% 86 (27)
    114 Framingham, MA NECTA Division 58.6      5.4 3.18% 181 67
    115 Bloomington, IL 58.3      0.8 9.09% 323 208
    116 Bangor, ME NECTA 58.0      1.1 3.23% 123 7
    117 Tucson, AZ 57.8      4.7 4.48% 267 150
    118 Naples-Immokalee-Marco Island, FL 57.6      1.5 0.00% 156 38
    119 Hanford-Corcoran, CA 57.3      0.2 0.00% 127 8
    120 Miami-Miami Beach-Kendall, FL Metro Div 57.3    18.5 -1.59% 69 (51)
    121 Minneapolis-St. Paul-Bloomington, MN-WI 56.8    39.1 -0.34% 128 7
    122 Fairbanks, AK 56.6      0.5 0.00% 129 7
    123 Louisville/Jefferson County, KY-IN 56.5      9.1 -1.45% 84 (39)
    124 Gainesville, FL 56.4      1.5 2.27% 87 (37)
    125 Tampa-St. Petersburg-Clearwater, FL 56.0    25.8 0.78% 146 21
    126 Decatur, AL 55.8      0.3 0.00% 118 (8)
    127 Owensboro, KY 55.8      0.5 0.00% 300 173
    128 Tallahassee, FL 55.7      3.4 -9.01% 6 (122)
    129 Lancaster, PA 55.6      3.1 1.09% 215 86
    130 Beaumont-Port Arthur, TX 55.6      1.5 7.14% 180 50
    131 Greenville, NC 55.6      0.9 0.00% 164 33
    132 Lake Havasu City-Kingman, AZ 55.6      0.7 16.67% 327 195
    133 Columbia, SC 55.5      5.5 -1.20% 122 (11)
    134 Laredo, TX 55.2      0.6 0.00% 16 (118)
    135 Muncie, IN 55.0      0.3 0.00% 239 104
    136 Lawton, OK 55.0      0.5 0.00% 151 15
    137 Grand Forks, ND-MN 54.6      0.6 0.00% 170 33
    138 Montgomery, AL 54.4      2.2 0.00% 154 16
    139 Muskegon, MI 54.1      0.8 0.00% 92 (47)
    140 Burlington-South Burlington, VT NECTA 54.0      2.3 4.55% 161 21
    141 Brownsville-Harlingen, TX 54.0      1.2 0.00% 112 (29)
    142 Charleston, WV 53.8      1.8 0.00% 176 34
    143 Rapid City, SD 53.4      0.9 0.00% 43 (100)
    144 Gary, IN Metro Div 53.3      2.0 0.00% 167 23
    145 Kingsport-Bristol-Bristol, TN-VA 53.2      2.0 1.69% 194 49
    146 Taunton-Middleborough-Norton, MA NECTA Division 53.2      1.2 -5.13% 83 (63)
    147 Santa Fe, NM 52.9      0.9 8.33% 104 (43)
    148 Detroit-Dearborn-Livonia, MI Metro Div 52.5      7.5 2.75% 266 118
    149 Columbus, OH 52.1    16.8 -0.40% 158 9
    150 Reno, NV 51.6      2.0 3.39% 221 71
    151 Pittsburgh, PA 51.6    18.1 0.37% 182 31
    152 Middlesex-Monmouth-Ocean, NJ 51.5    17.2 -1.72% 139 (13)
    153 Rochester, NY 51.4      9.0 -1.82% 190 37
    154 Canton-Massillon, OH 51.4      1.7 0.00% 172 18
    155 Champaign-Urbana, IL 51.4      2.5 -8.54% 59 (96)
    156 St. Louis, MO-IL 51.3    27.9 -2.56% 94 (62)
    157 Reading, PA 51.2      1.3 5.56% 225 68
    158 Anchorage, AK 51.1      4.4 -1.48% 111 (47)
    159 Houston-The Woodlands-Sugar Land, TX 51.1    31.5 -1.66% 132 (27)
    160 Duluth, MN-WI 50.9      1.5 7.14% 273 113
    161 Northern Virginia, VA 50.8    40.8 -0.65% 160 (1)
    162 Olympia-Tumwater, WA 50.8      0.9 0.00% 187 25
    163 Madera, CA 50.8      0.4 0.00% 149 (14)
    164 Jacksonville, FL 50.7      9.2 0.36% 205 41
    165 Fargo, ND-MN 50.4      3.1 -1.06% 79 (86)
    166 Jackson, TN 50.3      0.6 0.00% 162 (4)
    167 Amarillo, TX 50.2      1.4 2.44% 213 46
    168 Ogden-Clearfield, UT 50.2      2.1 -1.56% 207 39
    169 Kankakee, IL 50.0      0.4 -7.14% 178 9
    170 Oshkosh-Neenah, WI 49.8      1.5 -4.26% 28 (142)
    171 Spartanburg, SC 49.7      1.0 -3.12% 74 (97)
    172 Youngstown-Warren-Boardman, OH-PA 49.7      2.0 5.26% 269 97
    173 Augusta-Richmond County, GA-SC 49.5      3.0 -6.32% 61 (112)
    174 Fort Smith, AR-OK 49.4      1.2 0.00% 245 71
    175 Bloomington, IN 49.4      1.2 -2.78% 31 (144)
    176 Texarkana, TX-AR 49.2      0.5 0.00% 145 (31)
    177 Saginaw, MI 48.9      1.3 -2.50% 175 (2)
    178 La Crosse-Onalaska, WI-MN 48.8      1.1 0.00% 166 (12)
    179 Kingston, NY 48.5      0.9 0.00% 285 106
    180 Providence-Warwick, RI-MA NECTA 48.1    10.0 1.01% 191 11
    181 Topeka, KS 48.1      1.5 2.27% 233 52
    182 Eau Claire, WI 48.0      0.9 0.00% 210 28
    183 Stockton-Lodi, CA 47.8      2.0 -1.61% 174 (9)
    184 Buffalo-Cheektowaga-Niagara Falls, NY 47.5      7.4 -1.78% 141 (43)
    185 Grand Rapids-Wyoming, MI 47.3      5.1 -3.75% 98 (87)
    186 Albany-Schenectady-Troy, NY 47.1      8.3 -0.40% 222 36
    187 Lakeland-Winter Haven, FL 46.5      1.6 2.13% 184 (3)
    188 Montgomery County-Bucks County-Chester County, PA Metro Div 46.5    20.9 1.13% 247 59
    189 St. Cloud, MN 46.4      1.6 -3.92% 256 67
    190 Corpus Christi, TX 46.3      2.0 1.69% 163 (27)
    191 Asheville, NC 46.3      1.8 -3.57% 96 (95)
    192 Sebastian-Vero Beach, FL 46.1      0.6 0.00% 152 (40)
    193 Altoona, PA 46.1      0.8 -7.41% 159 (34)
    194 Port St. Lucie, FL 45.9      1.3 0.00% 68 (126)
    195 San Diego-Carlsbad, CA 45.3    23.7 -1.39% 147 (48)
    196 Fayetteville, NC 45.3      1.4 0.00% 255 59
    197 Chico, CA 45.2      1.0 -9.09% 113 (84)
    198 Elmira, NY 44.8      0.4 0.00% 223 25
    199 Gulfport-Biloxi-Pascagoula, MS 44.7      1.6 0.00% 253 54
    200 Green Bay, WI 44.7      1.9 -5.00% 66 (134)
    201 Greensboro-High Point, NC 44.6      5.0 -2.61% 204 3
    202 Huntington-Ashland, WV-KY-OH 44.5      1.3 0.00% 218 16
    203 Boulder, CO 44.4      7.8 -2.89% 157 (46)
    204 Yuma, AZ 44.1      0.5 0.00% 229 25
    205 Bismarck, ND 44.1      0.9 0.00% 103 (102)
    206 Colorado Springs, CO 44.1      6.6 -1.98% 201 (5)
    207 Oxnard-Thousand Oaks-Ventura, CA 43.8      4.9 -5.13% 62 (145)
    208 Atlantic City-Hammonton, NJ 43.8      0.8 0.00% 328 120
    209 Casper, WY 43.6      0.4 0.00% 272 63
    210 Washington-Arlington-Alexandria, DC-VA-MD-WV Metro Div 43.4    61.6 -2.07% 171 (39)
    211 Kahului-Wailuku-Lahaina, HI 43.4      0.6 0.00% 265 54
    212 Kalamazoo-Portage, MI 42.9      1.0 7.14% 317 105
    213 Silver Spring-Frederick-Rockville, MD Metro Div 42.8    14.0 -3.88% 186 (27)
    214 Lake County-Kenosha County, IL-WI Metro Div 42.2      3.7 1.85% 295 81
    215 Glens Falls, NY 42.2      0.9 0.00% 257 42
    216 Urban Honolulu, HI 42.1      7.2 -0.46% 193 (23)
    217 Camden, NJ Metro Div 42.0      7.0 -3.23% 185 (32)
    218 Memphis, TN-MS-AR 41.9      5.8 -2.81% 168 (50)
    219 Niles-Benton Harbor, MI 41.8      0.5 0.00% 234 15
    220 Fort Wayne, IN 41.5      2.9 0.00% 238 18
    221 Syracuse, NY 41.4      4.4 0.76% 260 39
    222 Kennewick-Richland, WA 41.1      0.8 -4.00% 200 (22)
    223 Las Cruces, NM 41.1      0.9 -3.70% 117 (106)
    224 Dothan, AL 40.8      0.7 -4.76% 177 (47)
    225 Decatur, IL 40.3      0.6 0.00% 280 55
    226 Riverside-San Bernardino-Ontario, CA 40.1    11.3 0.00% 278 52
    227 Cleveland-Elyria, OH 39.8    14.2 -1.62% 231 4
    228 Greeley, CO 39.7      0.7 5.00% 319 91
    229 Utica-Rome, NY 39.6      1.7 -1.96% 188 (41)
    230 Johnstown, PA 39.4      0.7 0.00% 271 41
    231 Springfield, IL 39.2      1.7 -1.92% 264 33
    232 Milwaukee-Waukesha-West Allis, WI 39.1    14.0 -3.67% 220 (12)
    233 Sacramento–Roseville–Arden-Arcade, CA 39.0    14.0 -0.71% 315 82
    234 Salem, OR 38.8      1.0 0.00% 291 57
    235 Lafayette, LA 38.8      2.7 1.23% 219 (16)
    236 Toledo, OH 38.7      3.0 0.00% 216 (20)
    237 Coeur d’Alene, ID 38.1      0.6 0.00% 318 81
    238 Dayton, OH 38.0      8.4 -0.79% 279 41
    239 Oklahoma City, OK 38.0      8.1 -0.41% 258 19
    240 Longview, TX 37.5      1.3 0.00% 211 (29)
    241 Virginia Beach-Norfolk-Newport News, VA-NC 37.4    10.7 -1.23% 259 18
    242 El Centro, CA 37.4      0.3 0.00% 294 52
    243 Johnson City, TN 37.3      1.5 -4.26% 202 (41)
    244 Mobile, AL 37.2      1.9 -5.00% 131 (113)
    245 Leominster-Gardner, MA NECTA 37.1      0.4 0.00% 235 (10)
    246 Davenport-Moline-Rock Island, IA-IL 37.1      2.3 -1.45% 246 0
    247 Peoria, IL 37.0      2.2 -1.49% 262 15
    248 Winston-Salem, NC 36.5      2.0 -6.25% 64 (184)
    249 New Orleans-Metairie, LA 36.4      6.4 -24.02% 121 (128)
    250 York-Hanover, PA 36.1      1.7 -1.96% 274 24
    251 Appleton, WI 36.0      1.5 0.00% 304 53
    252 Pensacola-Ferry Pass-Brent, FL 35.7      2.3 1.47% 313 61
    253 Harrisburg-Carlisle, PA 35.7      4.4 -0.75% 275 22
    254 Wichita, KS 35.5      4.4 -1.50% 209 (45)
    255 Sierra Vista-Douglas, AZ 34.4      0.4 -25.00% 309 54
    256 Danville, IL 34.3      0.2 0.00% 287 31
    257 Orange-Rockland-Westchester, NY 34.2    13.2 -1.00% 296 39
    258 Elgin, IL Metro Div 33.7      3.4 -5.50% 142 (116)
    259 Wausau, WI 33.4      0.4 0.00% 290 31
    260 Columbus, GA-AL 33.3      1.4 0.00% 203 (57)
    261 Portland-South Portland, ME NECTA 33.2      3.0 -1.11% 242 (19)
    262 Ocala, FL 33.2      0.8 0.00% 293 31
    263 Cedar Rapids, IA 33.1      4.3 -7.19% 195 (68)
    264 Santa Cruz-Watsonville, CA 33.1      0.8 -7.69% 249 (15)
    265 South Bend-Mishawaka, IN-MI 32.9      1.6 -5.88% 140 (125)
    266 Midland, TX 32.7      0.9 0.00% 314 48
    267 Modesto, CA 32.7      0.9 0.00% 270 3
    268 Dover-Durham, NH-ME NECTA 32.5      1.0 -6.45% 110 (158)
    269 Newark, NJ-PA Metro Div 32.4    23.0 -2.27% 263 (6)
    270 Hickory-Lenoir-Morganton, NC 32.3      0.8 -7.69% 198 (72)
    271 Des Moines-West Des Moines, IA 31.7      6.5 -3.45% 312 41
    272 Springfield, MA-CT NECTA 31.4      3.4 -5.56% 206 (66)
    273 Lexington-Fayette, KY 31.2      5.2 -7.10% 114 (159)
    274 Birmingham-Hoover, AL 31.0      8.2 -2.39% 298 24
    275 Rockford, IL 30.5      1.4 -6.67% 302 27
    276 Corvallis, OR 30.4      0.6 0.00% 165 (111)
    277 Jackson, MI 30.2      0.3 -25.00% 72 (205)
    278 Crestview-Fort Walton Beach-Destin, FL 30.0      1.0 7.41% 334 56
    279 Lubbock, TX 29.9      3.7 -0.88% 292 13
    280 Tulsa, OK 29.9      7.0 -1.41% 251 (29)
    281 Idaho Falls, ID 29.5      0.9 -3.57% 282 1
    282 Terre Haute, IN 29.4      0.6 -5.26% 134 (148)
    283 Little Rock-North Little Rock-Conway, AR 29.4      6.4 0.00% 286 3
    284 Richmond, VA 29.3      7.5 -1.32% 240 (44)
    285 Shreveport-Bossier City, LA 29.2      2.1 -10.00% 322 37
    286 Medford, OR 29.1      1.3 0.00% 320 34
    287 Sheboygan, WI 28.6      0.2 -25.00% 34 (253)
    288 Palm Bay-Melbourne-Titusville, FL 28.3      2.0 -16.67% 192 (96)
    289 Eugene, OR 28.2      2.8 -15.84% 95 (194)
    290 Lafayette-West Lafayette, IN 28.1      0.8 0.00% 248 (42)
    291 Vallejo-Fairfield, CA 27.9      1.0 -6.06% 254 (37)
    292 Lynn-Saugus-Marblehead, MA NECTA Division 27.8      0.9 -10.34% 236 (56)
    293 Waterbury, CT NECTA 27.8      0.6 0.00% 217 (76)
    294 Sherman-Denison, TX 27.5      0.4 0.00% 301 7
    295 Dover, DE 26.7      0.4 0.00% 331 36
    296 Scranton–Wilkes-Barre–Hazleton, PA 26.3      3.6 -3.60% 306 10
    297 Gadsden, AL 25.8      0.3 0.00% 277 (20)
    298 Elkhart-Goshen, IN 25.6      0.5 0.00% 324 26
    299 Columbus, IN 24.9      0.4 -14.29% 50 (249)
    300 Napa, CA 24.7      0.5 -6.67% 55 (245)
    301 Barnstable Town, MA NECTA 24.1      1.4 -8.89% 241 (60)
    302 Panama City, FL 24.0      1.0 0.00% 316 14
    303 Wichita Falls, TX 23.8      0.7 0.00% 138 (165)
    304 Binghamton, NY 23.0      1.6 -15.79% 119 (185)
    305 Florence-Muscle Shoals, AL 22.9      0.4 0.00% 311 6
    306 Waco, TX 22.2      1.1 -2.94% 299 (7)
    307 Nassau County-Suffolk County, NY Metro Div 22.1    20.1 -4.89% 303 (4)
    308 Deltona-Daytona Beach-Ormond Beach, FL 21.8      2.5 -3.85% 288 (20)
    309 Fort Worth-Arlington, TX Metro Div 21.3    11.6 -3.88% 281 (28)
    310 Pittsfield, MA NECTA 20.0      0.5 -16.67% 224 (86)
    311 Yuba City, CA 19.8      0.3 -18.18% 137 (174)
    312 Wilmington, DE-MD-NJ Metro Div 19.5      3.9 -4.88% 321 9
    313 Salisbury, MD-DE 19.0      1.1 -5.56% 276 (37)
    314 Calvert-Charles-Prince George’s, MD 18.2      4.4 -7.64% 268 (46)
    315 Lewiston-Auburn, ME NECTA 18.1      0.5 0.00% 333 18
    316 Walla Walla, WA 17.2      0.3 -25.00% 85 (231)
    317 Albany, OR 16.6      0.3 -25.00% 126 (191)
    318 Salinas, CA 16.4      1.3 -7.32% 305 (13)
    319 Odessa, TX 16.3      0.4 0.00% 208 (111)
    320 Roanoke, VA 16.3      1.5 -8.16% 284 (36)
    321 Lynchburg, VA 16.0      0.8 -11.11% 250 (71)
    322 Norwich-New London-Westerly, CT-RI NECTA 15.2      1.1 -5.71% 332 10
    323 Erie, PA 15.1      1.1 -8.11% 329 6
    324 Killeen-Temple, TX 14.8      1.6 0.00% 307 (17)
    325 Evansville, IN-KY 14.6      1.6 -5.88% 310 (15)
    326 New Haven, CT NECTA 14.6      3.5 -4.55% 325 (1)
    327 Vineland-Bridgeton, NJ 14.5      0.5 -6.67% 326 (1)
    328 Kansas City, KS 14.5      8.1 -7.60% 183 (145)
    329 Grand Junction, CO 14.3      0.7 -9.09% 308 (21)
    330 Brockton-Bridgewater-Easton, MA NECTA Division 12.7      0.5 -11.76% 261 (69)
    331 Kansas City, MO 11.9    11.4 -8.56% 244 (87)
    332 Kokomo, IN 10.4      0.2 -25.00% 93 (239)
    333 Anniston-Oxford-Jacksonville, AL 5.6      0.5 -16.67% 252 (81)
    334 San Angelo, TX 5.6      0.7 -16.00% 330 (4)
    335 Merced, CA 5.0      0.3 -18.18% 289 (46)
    336 New Bedford, MA NECTA 3.6      0.3 -25.00% 335 (1)
  • Large Cities Information Jobs – 2016 Best Cities Rankings

    Read about how we selected the 2016 Best Cities for Job Growth

    2016 MSA Info Ranking – Large MSAs Area 2016 Weighted INDEX 2015 Info Emplymt Total Info Emplymt Growth Rate 2014-2015 2015 MSA Info Ranking – Large MSAs 2016  Change from 2015 –
    Large MSAs
    1 San Francisco-Redwood City-South San Francisco, CA Metro Div 97.5      60.9 6.85% 2 1
    2 San Jose-Sunnyvale-Santa Clara, CA 96.5      76.8 9.30% 1 (1)
    3 Phoenix-Mesa-Scottsdale, AZ 90.6      38.2 7.51% 6 3
    4 Raleigh, NC 90.3      20.0 4.34% 4 0
    5 Austin-Round Rock, TX 89.5      27.3 3.41% 3 (2)
    6 Charlotte-Concord-Gastonia, NC-SC 87.9      26.5 4.19% 5 (1)
    7 Seattle-Bellevue-Everett, WA Metro Div 86.5      98.0 6.44% 9 2
    8 Portland-Vancouver-Hillsboro, OR-WA 86.5      25.5 7.15% 13 5
    9 New York City, NY 80.1    191.1 1.63% 7 (2)
    10 Fort Lauderdale-Pompano Beach-Deerfield Beach, FL Metro Div 76.1      19.4 2.47% 15 5
    11 Atlanta-Sandy Springs-Roswell, GA 75.9      87.3 -0.68% 12 1
    12 Las Vegas-Henderson-Paradise, NV 74.9      10.6 -0.31% 11 (1)
    13 Boston-Cambridge-Newton, MA NECTA Division 74.2      56.8 1.43% 14 1
    14 Nashville-Davidson–Murfreesboro–Franklin, TN 73.9      21.2 3.41% 21 7
    15 Denver-Aurora-Lakewood, CO 72.4      46.2 2.59% 30 15
    16 Hartford-West Hartford-East Hartford, CT NECTA 72.3      11.9 2.59% 25 9
    17 San Antonio-New Braunfels, TX 70.2      21.3 -0.62% 8 (9)
    18 West Palm Beach-Boca Raton-Delray Beach, FL Metro Div 70.2      10.5 0.32% 17 (1)
    19 Chicago-Naperville-Arlington Heights, IL Metro Div 70.0      73.1 2.67% 29 10
    20 Los Angeles-Long Beach-Glendale, CA Metro Div 68.9    203.8 2.79% 28 8
    21 Salt Lake City, UT 67.3      18.1 1.31% 19 (2)
    22 Omaha-Council Bluffs, NE-IA 67.0      11.6 2.06% 34 12
    23 Warren-Troy-Farmington Hills, MI Metro Div 66.8      20.1 -2.11% 10 (13)
    24 Philadelphia City, PA 66.3      11.9 2.29% 38 14
    25 Anaheim-Santa Ana-Irvine, CA Metro Div 65.4      25.7 3.62% 51 26
    26 Dallas-Plano-Irving, TX Metro Div 64.8      68.8 0.88% 23 (3)
    27 Bergen-Hudson-Passaic, NJ 62.7      19.6 1.55% 22 (5)
    28 Cincinnati, OH-KY-IN 62.2      13.8 1.72% 39 11
    29 Oakland-Hayward-Berkeley, CA Metro Div 60.6      22.8 4.92% 53 24
    30 Orlando-Kissimmee-Sanford, FL 60.3      23.7 -2.06% 16 (14)
    31 Indianapolis-Carmel-Anderson, IN 58.9      16.0 -3.42% 18 (13)
    32 Miami-Miami Beach-Kendall, FL Metro Div 57.3      18.5 -1.59% 20 (12)
    33 Minneapolis-St. Paul-Bloomington, MN-WI 56.8      39.1 -0.34% 32 (1)
    34 Louisville/Jefferson County, KY-IN 56.5        9.1 -1.45% 24 (10)
    35 Tampa-St. Petersburg-Clearwater, FL 56.0      25.8 0.78% 36 1
    36 Detroit-Dearborn-Livonia, MI Metro Div 52.5        7.5 2.75% 60 24
    37 Columbus, OH 52.1      16.8 -0.40% 40 3
    38 Pittsburgh, PA 51.6      18.1 0.37% 44 6
    39 Middlesex-Monmouth-Ocean, NJ 51.5      17.2 -1.72% 34 (5)
    40 Rochester, NY 51.4        9.0 -1.82% 47 7
    41 St. Louis, MO-IL 51.3      27.9 -2.56% 26 (15)
    42 Houston-The Woodlands-Sugar Land, TX 51.1      31.5 -1.66% 33 (9)
    43 Northern Virginia, VA 50.8      40.8 -0.65% 41 (2)
    44 Jacksonville, FL 50.7        9.2 0.36% 49 5
    45 Providence-Warwick, RI-MA NECTA 48.1      10.0 1.01% 48 3
    46 Buffalo-Cheektowaga-Niagara Falls, NY 47.5        7.4 -1.78% 35 (11)
    47 Grand Rapids-Wyoming, MI 47.3        5.1 -3.75% 27 (20)
    48 Albany-Schenectady-Troy, NY 47.1        8.3 -0.40% 51 3
    49 Montgomery County-Bucks County-Chester County, PA Metro Div 46.5      20.9 1.13% 56 7
    50 San Diego-Carlsbad, CA 45.3      23.7 -1.39% 37 (13)
    51 Washington-Arlington-Alexandria, DC-VA-MD-WV Metro Div 43.4      61.6 -2.07% 43 (8)
    52 Silver Spring-Frederick-Rockville, MD Metro Div 42.8      14.0 -3.88% 46 (6)
    53 Urban Honolulu, HI 42.1        7.2 -0.46% 49 (4)
    54 Camden, NJ Metro Div 42.0        7.0 -3.23% 45 (9)
    55 Memphis, TN-MS-AR 41.9        5.8 -2.81% 42 (13)
    56 Riverside-San Bernardino-Ontario, CA 40.1      11.3 0.00% 61 5
    57 Cleveland-Elyria, OH 39.8      14.2 -1.62% 52 (5)
    58 Milwaukee-Waukesha-West Allis, WI 39.1      14.0 -3.67% 50 (8)
    59 Sacramento–Roseville–Arden-Arcade, CA 39.0      14.0 -0.71% 66 7
    60 Oklahoma City, OK 38.0        8.1 -0.41% 57 (3)
    61 Virginia Beach-Norfolk-Newport News, VA-NC 37.4      10.7 -1.23% 58 (3)
    62 New Orleans-Metairie, LA 36.4        6.4 -24.02% 31 (31)
    63 Orange-Rockland-Westchester, NY 34.2      13.2 -1.00% 63 0
    64 Newark, NJ-PA Metro Div 32.4      23.0 -2.27% 59 (5)
    65 Birmingham-Hoover, AL 31.0        8.2 -2.39% 64 (1)
    66 Richmond, VA 29.3        7.5 -1.32% 54 (12)
    67 Nassau County-Suffolk County, NY Metro Div 22.1      20.1 -4.89% 65 (2)
    68 Fort Worth-Arlington, TX Metro Div 21.3      11.6 -3.88% 62 (6)
    69 Kansas City, KS 14.5        8.1 -7.60% 45 (24)
    70 Kansas City, MO 11.9      11.4 -8.56% 55 (15)
  • Mid-Sized Cities Information Jobs – 2016 Best Cities Rankings

    Read about how we selected the 2016 Best Cities for Job Growth

    2016 MSA Info Ranking – Midsized MSAs  Area 2016 Weighted INDEX 2015 Info Emplymt Total Info Emplymt Growth Rate 2014-2015 2015 MSA Info Ranking – Midsized MSAs  2016  Change from 2015 –
    Midsized MSAs
    1 Provo-Orem, UT 97.8    11.4 8.3% 4 3
    2 Durham-Chapel Hill, NC 94.8      4.5 7.1% 5 3
    3 Madison, WI 94.1    16.5 8.1% 6 3
    4 Bakersfield, CA 85.6      3.0 23.6% 68 64
    5 Ann Arbor, MI 84.6      5.2 2.6% 7 2
    6 Akron, OH 82.8      4.4 8.2% 34 28
    7 Bridgeport-Stamford-Norwalk, CT NECTA 82.5    12.2 1.7% 16 9
    8 Spokane-Spokane Valley, WA 82.5      3.3 12.4% 22 14
    9 Fort Collins, CO 82.2      2.8 3.7% 21 12
    10 McAllen-Edinburg-Mission, TX 81.7      2.4 2.9% 12 2
    11 Savannah, GA 81.6      1.9 -4.9% 1 (10)
    12 Delaware County, PA 78.9      2.9 6.2% 55 43
    13 Jackson, MS 78.9      5.5 -4.6% 8 (5)
    14 Trenton, NJ 78.8      5.6 17.4% 71 57
    15 Baton Rouge, LA 76.4      6.2 -8.0% 3 (12)
    16 Myrtle Beach-Conway-North Myrtle Beach, SC-NC 76.2      2.5 2.8% 26 10
    17 Lansing-East Lansing, MI 74.3      3.0 1.1% 38 21
    18 Greenville-Anderson-Mauldin, SC 74.1      7.4 1.4% 28 10
    19 Charleston-North Charleston, SC 72.9      5.3 -0.6% 15 (4)
    20 Lincoln, NE 72.5      2.6 1.3% 11 (9)
    21 North Port-Sarasota-Bradenton, FL 71.7      3.6 4.9% 27 6
    22 Fayetteville-Springdale-Rogers, AR-MO 71.6      2.0 5.2% 46 24
    23 El Paso, TX 70.4      5.9 -1.1% 13 (10)
    24 Albuquerque, NM 70.0      8.4 5.9% 67 43
    25 Tacoma-Lakewood, WA Metropolitan Division 68.2      3.0 7.1% 21 (4)
    26 Baltimore City, MD 67.9      4.5 5.5% 84 58
    27 Chattanooga, TN-GA 67.2      3.1 5.7% 40 13
    28 Santa Maria-Santa Barbara, CA 66.7      4.3 -3.7% 9 (19)
    29 Fresno, CA 65.8      3.9 -1.7% 24 (5)
    30 Springfield, MO 63.8      4.2 -4.5% 10 (20)
    31 Allentown-Bethlehem-Easton, PA-NJ 63.7      6.1 1.1% 29 (2)
    32 Santa Rosa, CA 62.4      2.7 0.0% 32 0
    33 Cape Coral-Fort Myers, FL 62.0      3.2 1.1% 35 2
    34 Boise City, ID 61.9      4.5 -3.6% 26 (8)
    35 Worcester, MA-CT NECTA 60.8      3.5 1.0% 48 13
    36 Huntsville, AL 59.4      2.6 -3.7% 14 (22)
    37 Sioux Falls, SD 59.1      2.7 2.5% 33 (4)
    38 Knoxville, TN 58.7      5.7 -1.2% 23 (15)
    39 Framingham, MA NECTA Division 58.6      5.4 3.2% 50 11
    40 Tucson, AZ 57.8      4.7 4.5% 77 37
    41 Tallahassee, FL 55.7      3.4 -9.0% 2 (39)
    42 Lancaster, PA 55.6      3.1 1.1% 61 19
    43 Beaumont-Port Arthur, TX 55.6      1.5 7.1% 49 6
    44 Columbia, SC 55.5      5.5 -1.2% 33 (11)
    45 Montgomery, AL 54.4      2.2 0.0% 41 (4)
    46 Gary, IN Metropolitan Division 53.3      2.0 0.0% 44 (2)
    47 Reno, NV 51.6      2.0 3.4% 64 17
    48 Canton-Massillon, OH 51.4      1.7 0.0% 45 (3)
    49 Reading, PA 51.2      1.3 5.6% 66 17
    50 Anchorage, AK 51.1      4.4 -1.5% 30 (20)
    51 Ogden-Clearfield, UT 50.2      2.1 -1.6% 59 8
    52 Youngstown-Warren-Boardman, OH-PA 49.7      2.0 5.3% 79 27
    53 Augusta-Richmond County, GA-SC 49.5      3.0 -6.3% 17 (36)
    54 Stockton-Lodi, CA 47.8      2.0 -1.6% 47 (7)
    55 Lakeland-Winter Haven, FL 46.5      1.6 2.1% 52 (3)
    56 Corpus Christi, TX 46.3      2.0 1.7% 43 (13)
    57 Asheville, NC 46.3      1.8 -3.6% 25 (32)
    58 Gulfport-Biloxi-Pascagoula, MS 44.7      1.6 0.0% 74 16
    59 Green Bay, WI 44.7      1.9 -5.0% 20 (39)
    60 Greensboro-High Point, NC 44.6      5.0 -2.6% 57 (3)
    61 Boulder, CO 44.4      7.8 -2.9% 42 (19)
    62 Colorado Springs, CO 44.1      6.6 -2.0% 56 (6)
    63 Oxnard-Thousand Oaks-Ventura, CA 43.8      4.9 -5.1% 18 (45)
    64 Lake County-Kenosha County, IL-WI Metropolitan Division 42.2      3.7 1.9% 89 25
    65 Fort Wayne, IN 41.5      2.9 0.0% 69 4
    66 Syracuse, NY 41.4      4.4 0.8% 75 9
    67 Salem, OR 38.8      1.0 0.0% 88 21
    68 Lafayette, LA 38.8      2.7 1.2% 63 (5)
    69 Toledo, OH 38.7      3.0 0.0% 62 (7)
    70 Dayton, OH 38.0      8.4 -0.8% 83 13
    71 Mobile, AL 37.2      1.9 -5.0% 36 (35)
    72 Davenport-Moline-Rock Island, IA-IL 37.1      2.3 -1.4% 72 0
    73 Peoria, IL 37.0      2.2 -1.5% 76 3
    74 Winston-Salem, NC 36.5      2.0 -6.3% 19 (55)
    75 York-Hanover, PA 36.1      1.7 -2.0% 81 6
    76 Pensacola-Ferry Pass-Brent, FL 35.7      2.3 1.5% 94 18
    77 Harrisburg-Carlisle, PA 35.7      4.4 -0.8% 82 5
    78 Wichita, KS 35.5      4.4 -1.5% 60 (18)
    79 Elgin, IL Metropolitan Division 33.7      3.4 -5.5% 39 (40)
    80 Portland-South Portland, ME NECTA 33.2      3.0 -1.1% 70 (10)
    81 Modesto, CA 32.7      0.9 0.0% 80 (1)
    82 Des Moines-West Des Moines, IA 31.7      6.5 -3.4% 93 11
    83 Springfield, MA-CT NECTA 31.4      3.4 -5.6% 58 (25)
    84 Lexington-Fayette, KY 31.2      5.2 -7.1% 31 (53)
    85 Rockford, IL 30.5      1.4 -6.7% 90 5
    86 Tulsa, OK 29.9      7.0 -1.4% 73 (13)
    87 Little Rock-North Little Rock-Conway, AR 29.4      6.4 0.0% 86 (1)
    88 Shreveport-Bossier City, LA 29.2      2.1 -10.0% 96 8
    89 Palm Bay-Melbourne-Titusville, FL 28.3      2.0 -16.7% 53 (36)
    90 Eugene, OR 28.2      2.8 -15.8% 25 (65)
    91 Scranton–Wilkes-Barre–Hazleton, PA 26.3      3.6 -3.6% 91 0
    92 Deltona-Daytona Beach-Ormond Beach, FL 21.8      2.5 -3.8% 87 (5)
    93 Wilmington, DE-MD-NJ Metropolitan Division 19.5      3.9 -4.9% 95 2
    94 Salisbury, MD-DE 19.0      1.1 -5.6% 83 (11)
    95 Calvert-Charles-Prince George’s, MD 18.2      4.4 -7.6% 78 (17)
    96 Roanoke, VA 16.3      1.5 -8.2% 85 (11)
    97 Evansville, IN-KY 14.6      1.6 -5.9% 92 (5)
    98 New Haven, CT NECTA 14.6      3.5 -4.5% 97 (1)
  • Small Cities Information Jobs – 2016 Best Cities Rankings

    Read about how we selected the 2016 Best Cities for Job Growth

    2016 MSA Info Ranking – Small MSAs  Area 2016 Weighted INDEX 2015 Info Emplymt Total Info Emplymt Growth Rate 2014-2015 2015 MSA Info Ranking – Small MSAs 2016  Change from 2015 –
    Small MSAs
    1 Flagstaff, AZ 96.5          0.5 25% 37 36
    2 Bend-Redmond, OR 92.7          1.8 13% 13 11
    3 Portsmouth, NH-ME NECTA 90.2          2.6 8% 11 8
    4 Wilmington, NC 84.6          3.0 5% 8 4
    5 Lawrence-Methuen Town-Salem, MA-NH NECTA Division 82.6          1.7 2% 18 13
    6 Racine, WI 81.8          0.5 15% 94 88
    7 Rochester, MN 81.0          2.0 0% 2 (5)
    8 Haverhill-Newburyport-Amesbury Town, MA-NH NECTA Division 78.7          0.4 0% 19 11
    9 Clarksville, TN-KY 78.0          1.2 6% 20 11
    10 Cheyenne, WY 77.7          1.2 0% 6 (4)
    11 Lowell-Billerica-Chelmsford, MA-NH NECTA Division 77.5          7.0 2% 60 49
    12 San Luis Obispo-Paso Robles-Arroyo Grande, CA 77.0          1.5 0% 22 10
    13 Flint, MI 76.9          4.1 1% 14 1
    14 St. George, UT 76.7          0.8 5% 65 51
    15 Punta Gorda, FL 76.6          0.5 8% 110 95
    16 Tuscaloosa, AL 75.6          0.9 8% 105 89
    17 Fond du Lac, WI 75.6          1.0 0% 7 (10)
    18 Janesville-Beloit, WI 75.5          1.6 -8% 1 (17)
    19 Manchester, NH NECTA 75.5          3.3 10% 103 84
    20 Victoria, TX 74.6          0.5 25% 9 (11)
    21 Bay City, MI 73.8          0.5 0% 25 4
    22 Charlottesville, VA 72.4          2.2 6% 72 50
    23 College Station-Bryan, TX 71.4          1.3 0% 4 (19)
    24 Abilene, TX 71.1          1.2 0% 16 (8)
    25 Tyler, TX 70.5          2.3 0% 23 (2)
    26 Pueblo, CO 67.1          0.7 11% 75 49
    27 Logan, UT-ID 66.6          0.8 0% 3 (24)
    28 Peabody-Salem-Beverly, MA NECTA Division 66.6          1.3 0% 28 0
    29 Auburn-Opelika, AL 65.7          0.5 0% 36 7
    30 Burlington, NC 64.7          0.5 0% 34 4
    31 Cleveland, TN 64.5          0.3 0% 33 2
    32 Prescott, AZ 64.4          0.6 0% 51 19
    33 Dutchess County-Putnam County, NY Metropolitan Division 63.9          2.0 7% 112 79
    34 Visalia-Porterville, CA 63.8          1.0 0% 83 49
    35 Watertown-Fort Drum, NY 63.2          0.7 0% 50 15
    36 San Rafael, CA Metropolitan Division 62.8          2.6 3% 69 33
    37 Hagerstown-Martinsburg, MD-WV 62.4          2.4 1% 96 59
    38 Lewiston, ID-WA 62.2          0.4 0% 41 3
    39 Morristown, TN 61.6          0.4 33% 173 134
    40 Nashua, NH-MA NECTA Division 60.7          1.9 0% 91 51
    41 Ithaca, NY 59.4          0.5 0% 145 104
    42 Redding, CA 59.4          0.7 0% 42 0
    43 Pocatello, ID 59.1          0.4 0% 27 (16)
    44 Grants Pass, OR 59.1          0.3 0% 47 3
    45 Bloomington, IL 58.3          0.8 9% 161 116
    46 Bangor, ME NECTA 58.0          1.1 3% 59 13
    47 Naples-Immokalee-Marco Island, FL 57.6          1.5 0% 76 29
    48 Hanford-Corcoran, CA 57.3          0.2 0% 62 14
    49 Fairbanks, AK 56.6          0.5 0% 63 14
    50 Gainesville, FL 56.4          1.5 2% 40 (10)
    51 Decatur, AL 55.8          0.3 0% 56 5
    52 Owensboro, KY 55.8          0.5 0% 147 95
    53 Greenville, NC 55.6          0.9 0% 80 27
    54 Lake Havasu City-Kingman, AZ 55.6          0.7 17% 164 110
    55 Laredo, TX 55.2          0.6 0% 5 (50)
    56 Muncie, IN 55.0          0.3 0% 117 61
    57 Lawton, OK 55.0          0.5 0% 73 16
    58 Grand Forks, ND-MN 54.6          0.6 0% 84 26
    59 Muskegon, MI 54.1          0.8 0% 43 (16)
    60 Burlington-South Burlington, VT NECTA 54.0          2.3 5% 78 18
    61 Brownsville-Harlingen, TX 54.0          1.2 0% 53 (8)
    62 Charleston, WV 53.8          1.8 0% 86 24
    63 Rapid City, SD 53.4          0.9 0% 17 (46)
    64 Kingsport-Bristol-Bristol, TN-VA 53.2          2.0 2% 92 28
    65 Taunton-Middleborough-Norton, MA NECTA Division 53.2          1.2 -5% 38 (27)
    66 Santa Fe, NM 52.9          0.9 8% 49 (17)
    67 Champaign-Urbana, IL 51.4          2.5 -9% 26 (41)
    68 Duluth, MN-WI 50.9          1.5 7% 133 65
    69 Olympia-Tumwater, WA 50.8          0.9 0% 89 20
    70 Madera, CA 50.8          0.4 0% 71 1
    71 Fargo, ND-MN 50.4          3.1 -1% 35 (36)
    72 Jackson, TN 50.3          0.6 0% 79 7
    73 Amarillo, TX 50.2          1.4 2% 104 31
    74 Kankakee, IL 50.0          0.4 -7% 88 14
    75 Oshkosh-Neenah, WI 49.8          1.5 -4% 10 (65)
    76 Spartanburg, SC 49.7          1.0 -3% 32 (44)
    77 Fort Smith, AR-OK 49.4          1.2 0% 119 42
    78 Bloomington, IN 49.4          1.2 -3% 12 (66)
    79 Texarkana, TX-AR 49.2          0.5 0% 70 (9)
    80 Saginaw, MI 48.9          1.3 -2% 85 5
    81 La Crosse-Onalaska, WI-MN 48.8          1.1 0% 82 1
    82 Kingston, NY 48.5          0.9 0% 138 56
    83 Topeka, KS 48.1          1.5 2% 113 30
    84 Eau Claire, WI 48.0          0.9 0% 101 17
    85 St. Cloud, MN 46.4          1.6 -4% 126 41
    86 Sebastian-Vero Beach, FL 46.1          0.6 0% 74 (12)
    87 Altoona, PA 46.1          0.8 -7% 77 (10)
    88 Port St. Lucie, FL 45.9          1.3 0% 29 (59)
    89 Fayetteville, NC 45.3          1.4 0% 125 36
    90 Chico, CA 45.2          1.0 -9% 54 (36)
    91 Elmira, NY 44.8          0.4 0% 108 17
    92 Huntington-Ashland, WV-KY-OH 44.5          1.3 0% 107 15
    93 Yuma, AZ 44.1          0.5 0% 111 18
    94 Bismarck, ND 44.1          0.9 0% 48 (46)
    95 Atlantic City-Hammonton, NJ 43.8          0.8 0% 165 70
    96 Casper, WY 43.6          0.4 0% 132 36
    97 Kahului-Wailuku-Lahaina, HI 43.4          0.6 0% 130 33
    98 Kalamazoo-Portage, MI 42.9          1.0 7% 157 59
    99 Glens Falls, NY 42.2          0.9 0% 127 28
    100 Niles-Benton Harbor, MI 41.8          0.5 0% 114 14
    101 Kennewick-Richland, WA 41.1          0.8 -4% 97 (4)
    102 Las Cruces, NM 41.1          0.9 -4% 55 (47)
    103 Dothan, AL 40.8          0.7 -5% 87 (16)
    104 Decatur, IL 40.3          0.6 0% 136 32
    105 Greeley, CO 39.7          0.7 5% 159 54
    106 Utica-Rome, NY 39.6          1.7 -2% 90 (16)
    107 Johnstown, PA 39.4          0.7 0% 131 24
    108 Springfield, IL 39.2          1.7 -2% 129 21
    109 Coeur d’Alene, ID 38.1          0.6 0% 158 49
    110 Longview, TX 37.5          1.3 0% 102 (8)
    111 El Centro, CA 37.4          0.3 0% 144 33
    112 Johnson City, TN 37.3          1.5 -4% 98 (14)
    113 Leominster-Gardner, MA NECTA 37.1          0.4 0% 115 2
    114 Appleton, WI 36.0          1.5 0% 149 35
    115 Sierra Vista-Douglas, AZ 34.4          0.4 -25% 153 38
    116 Danville, IL 34.3          0.2 0% 139 23
    117 Wausau, WI 33.4          0.4 0% 141 24
    118 Columbus, GA-AL 33.3          1.4 0% 99 (19)
    119 Ocala, FL 33.2          0.8 0% 143 24
    120 Cedar Rapids, IA 33.1          4.3 -7% 93 (27)
    121 Santa Cruz-Watsonville, CA 33.1          0.8 -8% 121 0
    122 South Bend-Mishawaka, IN-MI 32.9          1.6 -6% 68 (54)
    123 Midland, TX 32.7          0.9 0% 155 32
    124 Dover-Durham, NH-ME NECTA 32.5          1.0 -6% 52 (72)
    125 Hickory-Lenoir-Morganton, NC 32.3          0.8 -8% 95 (30)
    126 Corvallis, OR 30.4          0.6 0% 81 (45)
    127 Jackson, MI 30.2          0.3 -25% 31 (96)
    128 Crestview-Fort Walton Beach-Destin, FL 30.0          1.0 7% 171 43
    129 Lubbock, TX 29.9          3.7 -1% 142 13
    130 Idaho Falls, ID 29.5          0.9 -4% 137 7
    131 Terre Haute, IN 29.4          0.6 -5% 64 (67)
    132 Medford, OR 29.1          1.3 0% 160 28
    133 Sheboygan, WI 28.6          0.2 -25% 15 (118)
    134 Lafayette-West Lafayette, IN 28.1          0.8 0% 120 (14)
    135 Vallejo-Fairfield, CA 27.9          1.0 -6% 124 (11)
    136 Lynn-Saugus-Marblehead, MA NECTA Division 27.8          0.9 -10% 116 (20)
    137 Waterbury, CT NECTA 27.8          0.6 0% 106 (31)
    138 Sherman-Denison, TX 27.5          0.4 0% 148 10
    139 Dover, DE 26.7          0.4 0% 168 29
    140 Gadsden, AL 25.8          0.3 0% 135 (5)
    141 Elkhart-Goshen, IN 25.6          0.5 0% 162 21
    142 Columbus, IN 24.9          0.4 -14% 21 (121)
    143 Napa, CA 24.7          0.5 -7% 24 (119)
    144 Barnstable Town, MA NECTA 24.1          1.4 -9% 118 (26)
    145 Panama City, FL 24.0          1.0 0% 156 11
    146 Wichita Falls, TX 23.8          0.7 0% 67 (79)
    147 Binghamton, NY 23.0          1.6 -16% 57 (90)
    148 Florence-Muscle Shoals, AL 22.9          0.4 0% 154 6
    149 Waco, TX 22.2          1.1 -3% 146 (3)
    150 Pittsfield, MA NECTA 20.0          0.5 -17% 109 (41)
    151 Yuba City, CA 19.8          0.3 -18% 66 (85)
    152 Lewiston-Auburn, ME NECTA 18.1          0.5 0% 170 18
    153 Walla Walla, WA 17.2          0.3 -25% 39 (114)
    154 Albany, OR 16.6          0.3 -25% 61 (93)
    155 Salinas, CA 16.4          1.3 -7% 150 (5)
    156 Odessa, TX 16.3          0.4 0% 100 (56)
    157 Lynchburg, VA 16.0          0.8 -11% 122 (35)
    158 Norwich-New London-Westerly, CT-RI NECTA 15.2          1.1 -6% 169 11
    159 Erie, PA 15.1          1.1 -8% 166 7
    160 Killeen-Temple, TX 14.8          1.6 0% 151 (9)
    161 Vineland-Bridgeton, NJ 14.5          0.5 -7% 163 2
    162 Grand Junction, CO 14.3          0.7 -9% 152 (10)
    163 Brockton-Bridgewater-Easton, MA NECTA Division 12.7          0.5 -12% 128 (35)
    164 Kokomo, IN 10.4          0.2 -25% 44 (120)
    165 Anniston-Oxford-Jacksonville, AL 5.6          0.5 -17% 123 (42)
    166 San Angelo, TX 5.6          0.7 -16% 167 1
    167 Merced, CA 5.0          0.3 -18% 140 (27)
    168 New Bedford, MA NECTA 3.6          0.3 -25% 172 4
  • Cars or Trains: Which Will Win the Commuting Future?

    Infrastructure investment is a hot topic and the focus of that discussion tends to lean towards transport infrastructure over other categories (like energy or water for example). When it comes to transport, trains seem to feature prominently on the wish lists of big investment or ‘nation building’ projects. But how far could billions of dollars in new rail infrastructure actually go in improving congestion across our cities?  Will cars inevitably win? If so, why?

    ‘We need more public transport’ is the silver bullet catch cry often heard in conjunction with debates about congestion in major cities. It has become so common that its validity is rarely tested. Even large scale commuter rail projects like Brisbane’s proposed $5billion (or $8billion – what a few billion amongst friends?) cross river rail can still maintain preferred project status – despite no business case after several years of discussion and now being in the hands of the project’s third state government.

    As technology reshapes the nature of work – and with it where we work – and as Australia faces cities policy with renewed national interest – led primarily by our Prime Minister – it is timely to ask how infrastructure priorities might be shaped by evolving metropolitan form and the fast changing habits of urban inhabitants. Will old ways serve new days? Do we need more passenger rail, or will cars find a new purpose in decongesting our cities and serving a new economic model?

    Some recent figures through Macroplan serve to highlight the role played by rail in urban life. In 2013–14, there were 178.5 billion passenger kilometres travelled on capital city roads in Australia and 12.6 billion passenger kilometres travelled on urban rail networks. I’ve written before that this share is unlikely to change for the simple fact that only around 10% of metropolitan wide jobs are based in central business districts of our major cities. Agreed, it’s an important 10% for public transport because PT best serves a highly centralized workforce as you find in CBDs. Commuter rail in particular relies on a ‘hub and spoke’ model, mainly designed to ferry people from into and out of CBDs.

    For people who work in CBDs, a high proportion will use public transport – rail included. But that’s a high proportion of the 10% minority of people in a metro wide area. Even if every single person who worked in a CBD caught PT, the mode share can never rise very high because around 90% of the workforce work in suburban areas, for which rail is not well suited. There has been a lot of talk about Transit Oriented Development (TODs) particularly around suburban rail nodes but despite decades of discussion, we are yet to see many (any?) genuine examples.

    And the reality is that the economy is fast suburbanizing. New employment engines in sectors like personal services or health and caring are not beneficiaries of industry proximity. Being close to others in the same industry might have been good for finance, property and business service industries in traditional CBDs but the fastest growing sector of our economy at present is health care related, where being close to the people being served is important. This is not the CBD. There is even evidence that technology startups in the US have tended to prefer suburban or high street locations, offering high amenity, ample low cost or free parking, and cheap (or free) premises. Steve Jobs and Steve Wozniak of Apple fame started in a suburban garage after all. And Mark Zuckerberg got started at a desk in his college dorm.

    As this shift of the economy moves from centralized to increasingly decentralized models – aided by new and fast evolving digital technology which makes connectivity over larger geographic areas so much easier – do the foundations of commuter rail feasibility begin to crumble?

    This graph, which shows the dramatic long term decline of the CBD as the dominant employer region in Sydney, could apply equally to other capitals:

    Source: The Polycentric Metropolis – Sydney’s Centres Policy in 2051, Bob Meyer, Director of Planning, COX Richardson Architects and Planners

    This shift is directly related to how public transport versus private has fared over a similar long term scale, as evidenced by this chart:


    Source: Mode share of motorised travel (passenger kms) 1945-2014 for five largest Australian cities, public transport vs private transport (source data: BITRE), taken from Alan Davies writing in Crikey.

    Adding to this shift has been the enabling factor of falling car prices. According to COMMSEC, in 1976 the cost of a new Holden sedan (back then it was Holden or Ford and that was about it) was $4,336 and the average male full time wage was $182 a week – meaning it took 24 weeks income to pay for a new car. Today, the average full time weekly wage is around $1,440 and there are plenty of good quality brand new sedans you can buy for $19,000 on road. In just over three months, you can own one. New cars are fuel efficient, emissions efficient, reliable, technologically enabled and comfortable.

    Rubbing salt into the commuter rail wound is that travel by car – even across larger distances – tends to be quicker than rail. Here’s the picture in Melbourne:


    Source: Average journey to work trip duration by mode and ring, Melbourne (source data: VISTA 2012-13). Taken from Alan Davies in Crikey.

    In Sydney, according to their Household Travel Survey 2013-14, only 13% of car drivers took longer than 45 minutes to get to work, while 79% of train passengers took more than 45 minutes. 

    So, given that commuter rail is best designed to serve an increasing minority of the workforce with jobs in traditional CBDs, how will spending extra billions on commuter rail infrastructure expansion solve congestion? How will it translate into more rail passengers, given the way the economy is changing?

    Is there an alternative?

    For me it’s actually not a case of one or the other. Sensible investment in commuter rail, given the existing investment in rail networks, makes sense provided there’s a valid business case and the alternative options for that investment have been measured.

    It also strikes me that we may have a forgotten the massive sunken investment in metropolitan road networks which do most of the transport work in our cities. Some (not all) of these roads are congested for maybe 4 to 6 hours out of every 24. Our cars which move us around our cities spend maybe only 3 or 4 hours a day going anywhere. For more than 20 out of 24 hours, they are parked.

    Talk about driverless cars is not just about a fictional scene from ‘Total Recall’ – it’s also about computer aided traffic management on a city wide scale. Squeezing more efficiency from the road network and from motor vehicles seems to make a lot of sense. Ride sharing apps like Uber provide an early insight into how disruptive technologies can impact on traditional, cumbersome and market protected transport thinking. There are also car sharing Apps like Goget and more are on their way. Technology is changing the way we do everything, from entertainment to where we work and how we get around. Would it not make sense for cities to be exploring how this wide scale urban economic shift can best served, rather than stubbornly sticking to mantras about public transport systems designed for traditional urban employment models?

    And what about buses? Their great virtue is that they can use the metrowide road networks. It is easy to change a bus route to adapt to demand. You can’t do that with rail. Think how technology might soon morph public transport buses and private transport cars into a hybrid of some sort? Driverless buses are not new. Perth is already about to trial them. This is just a baby step. Think about where this could lead.

    There’s no such thing, in my view, as a bad infrastructure investment. But there’s only so much money to go around. The decisions on infrastructure investment, when it comes to issues like urban economic productivity and reducing congestion, should focus on how to get the best bang for the buck. That can mean thinking more about the future and how patterns of work will shape what we need from transit systems, and working back from that to identify the best solutions.

    Ross Elliott has more than 20 years experience in property and public policy. His past roles have included stints in urban economics, national and state roles with the Property Council, and in destination marketing. He has written extensively on a range of public policy issues centering around urban issues, and continues to maintain his recreational interest in public policy through ongoing contributions such as this or via his monthly blog The Pulse.

    Flickr photo by Curtis Perry: Another perfect day for highway drivers in LA.