Blog

  • Millennial Home Ownership: Disappointment Ahead in Some Places?

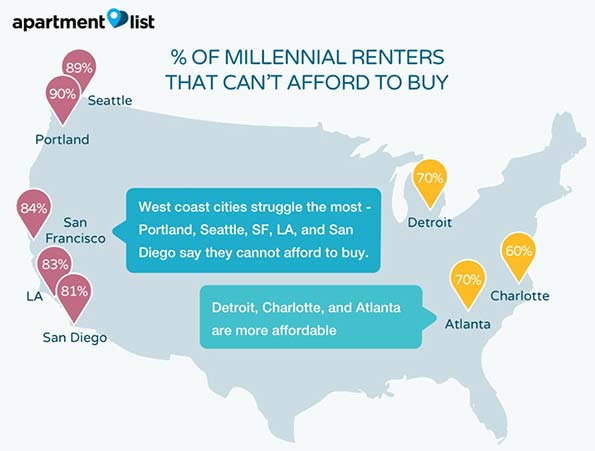
    Millennial renters overwhelmingly plan on buying their own homes, though affording them could be far more challenging than they think. This is an important conclusion from a renters’ survey by apartmentlist.com, an apartment search website (See: The Affordability Crisis: Are Millennials Destined to be Renters?). Apartmentlist.com matched results from its own survey of prospective renters that visit its site with housing market data from more than 90 metropolitan areas around the country, The most revealing finding:  Millennials intend to purchase their own homes, but that housing affordability is the greatest barrier. According to apartmentlist.com, the problem is the greatest on the West Coast, New York and Miami (See Figure “% of Millennial Renters that Can’t Afford to Buy”, from apartmentlist.com):

    In nearly all the metros we looked at, affordability was the #1 reason for delaying homeownership, but millennials on the west coast struggled the most: Portland, San Diego, Seattle, Los Angeles, and San Francisco all had more than 80% of renters listing affordability as a concern. Miami and New York, expensive metros with many cost-burdened renters, were #6 and #7 on the list.

    Perhaps surprisingly, two metropolitan areas that have been among the greatest beneficiaries of the housing affordability driven net domestic migration from coastal California, Portland and Seattle, scored the worst on affordability as a barrier to purchasing homes (90 percent and 89 percent respectively). These areas were once much less expensive in the past, but are rapidly catching up with California in terms of unaffordability.

    The Preference for Home Ownership

    The apartmentlist.com survey found that 79 percent of Millennials eventually plan to become home or apartment owners, while only six percent expect to rent for their whole lives. The balance (15 percent) are not sure. This 79 percent preference for home ownership is well above the current homeownership rate of approximately 64 percent.

    The preference for home ownership was pervasive in the apartmentlist.com data. Among the 50 metropolitan areas with more than 1,000,000 population, none scored below two thirds (67 percent) in Millennial home ownership preference. This is, again, above the national home ownership rate. The lowest home ownership preference among these was in Las Vegas. The highest preference for home ownership was in Rochester, at 94 percent. Charlotte and Salt Lake City also scored a 90 percent home ownership preference.

    Millennials indicated a strong preference for home ownership even in metropolitan areas that have depressed home ownership rates. In 2015, Los Angeles had the lowest home ownership rate of any major metropolitan area, at 49 percent, yet 76 percent of the area’s Millennials intend to own their own homes. In New York, with only a 50 percent homeownership rate, 74 percent of Millennials plan on buying their own homes. In San Jose, with only a 51 percent home ownership rate, 74 percent of Millennials aspire to buy their own homes. In San Diego, the home ownership rate was 52 percent, yet the interest in home ownership was half-again higher (78 percent). In San Francisco, where the home ownership rate is 56 percent, 76 percent expressed an interest in owning their own homes (home ownership rates calculated from Census Bureau quarterly data from 2015).

    The story is the same in the metropolitan areas often characterized as magnets for Millennial migration. In Portland and Denver, 81 percent of Millennials anticipate owning their own homes. Boston (78 percent), Seattle (77 percent) and Minneapolis-St. Paul (77 percent) are not far behind.

    Saving for Decades

    This data suggests that many Millennials could need to relocate to afford their own homes. The really innovative contribution of the apartmentlist.com research is as estimate of how long it will take the average Millennial to save enough money for a down payment on a starter home, which according to Trulia, is generally defined as the lower third of the market.

    Apartmentlist.com develops an estimate for each metropolitan area, using monthly savings rates, existing savings and the potential for financial assistance (for example from relatives) in obtaining enough for the down payment. In the most costly market, San Francisco, the average Millennial will need more than 28 years to build up enough funding for a down payment in San Francisco. This means that older Millennials would be old enough (62) to qualify for early retirement benefits from Social Security by the time they have enough to pay the down payment on a starter home. Sacramento is nearly as challenging, where it would take another 27 years to accumulate a down payment. Things are not that much better in Los Angeles (20 years), San Diego (19 years) and Denver (18 years).

    Optimistic Expectations and Disappointment

    But the most important bottom line conclusion of the research is what apartmentlist.com calls the “affordability gap.” This is the difference between the actual time required to accumulate a down payment and the time expected by survey respondents. The biggest affordability gap is in San Francisco, where respondents expected down payment requirements that would take only 11 years more to save. The reality, according to the study, is 28 years, more than 2.5 times that figure. In Sacramento, respondents expected that it would take 16 years, still far short of the more realistic 27 years. In Los Angeles, San Diego and Denver, it is likely to take from eight to ten years more to save enough for a down payment than survey respondents estimate.

    Setting up for More Domestic Migration

    In contrast, in a number of other metropolitan areas, such as Houston, Dallas-Fort Worth, Atlanta, Philadelphia and Kansas City, Millennials have over-estimated the size of down payments necessary to enter the housing market.

    For some time, domestic migration trends in the United States has been principally about moving from more expensive metropolitan areas to less expensive metropolitan areas. The apartmentlist.com data suggests that this trend could continue. To achieve their dreams of home ownership and to avoid a life of renting, many Millennials may move to places where housing is priced more for livability.

    Wendell Cox is principal of Demographia, an international pubilc policy and demographics firm. He is a Senior Fellow of the Center for Opportunity Urbanism (US), Senior Fellow for Housing Affordability and Municipal Policy for the Frontier Centre for Public Policy (Canada), and a member of the Board of Advisors of the Center for Demographics and Policy at Chapman University (California). He is co-author of the “Demographia International Housing Affordability Survey” and author of “Demographia World Urban Areas” and “War on the Dream: How Anti-Sprawl Policy Threatens the Quality of Life.” He was appointed to three terms on the Los Angeles County Transportation Commission, where he served with the leading city and county leadership as the only non-elected member. He served as a visiting professor at the Conservatoire National des Arts et Metiers, a national university in Paris.

    Photo by Bigstockphoto.com.

  • Class and the EU referendum

    On June 23rd, voters in the UK get a say on whether to remain in the European Union (EU). The UK first joined what was then called the European Economic Community (EEC) back in 1973, and in a 1975 vote, 67% voted to stay in the EEC. The issue was fairly settled until Conservative Prime Minister David Cameron, under pressure from the right wing of his party and anti EU sentiment, promised an in/out referendum in the Party’s manifesto for last year’s General election. The stakes here are high, and no one really knows what the result of a ‘Brexit’ (a neologism for British Exit) would be.

    In recent polls, opinion seems fairly evenly divided, with roughly 40% each for staying and going.  While a crucial 20% remain undecided, momentum seems to be with the ‘out’ side. Sentiment towards the EU cuts across party lines in the UK. Broadly speaking, the political establishment want to remain, though significant numbers of supporters, especially in the Tory Party, wish to go.  While initially hostile to the EEC, many on the left and in the trade union movement have come to embrace Europe because of its promotion of progressive labour law and working conditions directives, even though the UK has opted out of many of these.

    But what about the question of class in all of this? In many ways, class is a central factor, though it is rarely mentioned in debate or in the mainstream media. The UK Independence Party (UKIP), which has been a threat to both Conservative and Labour parties, has made immigration central to its campaigns. UKIP draws much of its support from the working-class, especially those who feel marginalised by the political mainstream, and one of the biggest reasons for this is immigration. According to a recent survey, 55% of voters see immigration as the most important issue in the upcoming referendum.  Of course, the issue is being mixed up with the ongoing refugee crisis and the desire of many non-EU economic migrants to come to Britain. This is a difficult and touchy subject for all political parties and for understandable reasons. But immigration was an issue even before refugees began streaming in from the Middle East, because one of the main planks of the EU is the free movement of goods and labour. Any citizen of the EU can choose to live and work in any other member state, and millions of people have chosen to do just that. Migration within the EU, which was seriously underestimated by the previous Labour government, has had very different outcomes in different labour markets. Many eastern and southern Europeans have been attracted to Britain by the promise of relatively high wages, job vacancies, and the fact that English is widely spoken across the continent.

    The biggest losers in this migration process have been the indigenous UK working class, who now have to compete with millions of semi-skilled and unskilled workers from across the EU. While there is plenty of anecdotal evidence that UK workers are being discriminated against by recruitment agencies, the best evidence of this practice comes from a high profile case in the English midlands where local people have been effectively excluded from the 3,000 jobs created at a distribution warehouse owned by sports clothing retailing firm Sports Direct.  The company apparently preferred to recruit directly from Poland. For working-class voters, the EU’s free market in labour appears to be more about big corporate profits than worker mobility.

    Immigration has an impact beyond access to employment. It also affects housing, schooling, and a host of other public services. All of these factors raise questions about the long term stability and sustainability of working-class communities. In many areas in the UK, from big cities to smaller towns, working-class people bear the brunt of all of these issues, and this has turned many towards UKIP and away from Labour as their natural home. Brexit begins to look attractive for those most marginalised by the effects of the free market, who also benefit least from the more positive aspects of EU membership. This situation has been confounded for many by the ways in which, after the recession of 2007/8, the EU has liberalised its markets and toned down its hitherto strong commitment to social legislation. Most notably, this has seen the EU in secret negotiations with the US over The Transatlantic Trade and Investment Partnership or TTIP.

    Nothing about the EU referendum is clear or straightforward. Whatever the result of the ballot, the motivations of voters in terms of class may not be clear. The EU had and still has the potential to improve the lives of millions of working-class citizens across Europe, but too often the interests of big business and social elites trump those of ordinary people.

    This piece first appeared in Working-Class Perspectives.

    Tim Strangleman, University of Kent

    Photo by Xavier Häpehttp://www.flickr.com/photos/vier/192493917/, CC BY 2.0

  • Empire State Building Toward Wins for Trump, Hillary

    New Yorkers like to think of themselves as ahead of the curve but, this year, they seem to be embracing the most regressive politics. The overwhelming favorite in Tuesday’s primary among Republican candidates – with more than 50 percent support, according to RealClearPolitics – is Donald Trump, the brash New Yorker whose campaign vows to “make America great again.” On the Democratic side, New Yorkers appear to prefer Hillary Clinton, their former U.S. senator and quintessential avatar of the gentry liberals, rather than feeling “the Bern.”

    Some of this stems from political causes – for example, Clinton’s close ties with progressives around Mayor Bill De Blasio – or the fact that the New York primary electorate is 30 percent nonwhite compared with 17 percent in Wisconsin. For Republicans, the overall weakness of the state party, a paucity of evangelicals and Ted Cruz’s poorly chosen attack on “New York values” all favor Trump.

    But the real driver of Trump’s success lies in the changing social, economic and demographic forces reshaping the Empire State. The city has enjoyed a considerable surge in employment, much of it – roughly one-third – in low-wage jobs. But the real “losers,” to use one of Trump’s favorite terms, has been the middle class, which is disappearing even faster in New York than in the rest of the country.

    This distress can be seen in migration numbers. While states like Texas and Florida are gaining hundreds of thousands of new residents, the New York metropolitan area has lost 701,000 net domestic migrants the past five years, after losing more than 1.9 million in the first decade of the new millennium. Greater New York loses net migrants to virtually every big U.S. urban region, even Los Angeles, Philadelphia, Washington, D.C., and Boston, as well as to Atlanta, Dallas-Fort Worth and Houston.

    Read the entire piece at The Orange County Register.

    Joel Kotkin is executive editor of NewGeography.com. He is the Roger Hobbs Distinguished Fellow in Urban Studies at Chapman University and executive director of the Houston-based Center for Opportunity Urbanism. His newest book, The Human City: Urbanism for the rest of us, will be published in April by Agate. He is also author of The New Class ConflictThe City: A Global History, and The Next Hundred Million: America in 2050. He lives in Orange County, CA.

    Photo by Gage Skidmore [CC BY-SA 3.0], via Wikimedia Commons

  • Largest Cities in the World: 2016

    Tokyo-Yokohama continues to be the largest city in the world, with nearly 38 million residents, according to the just released Demographia World Urban Areas (12th Annual Edition). Demographia World Urban Areas (Built-Up Urban Areas or Urban Agglomerations) provides annual estimates of the population, urban land area and urban population density of all identified built-up urban areas in the world. This year’s edition includes 1,022 large urban areas (with 500,000 or more residents), with a total population of 2.12 billion, representing 53 percent of the world urban population.

    Demographia World Urban Areas uses base population figures, derived from official census and estimates data, to develop basic year population estimates within the confines of built-up urban areas. These figures are then adjusted to account for population change forecasts, principally from the United Nations or national statistics bureaus for a 2016 estimate.

    Built-up urban areas are continuously built-up development that excludes rural lands. Built-Up urban areas are the city in its physical form, as opposed to metropolitan areas, which are the city in its economic or functional form. Metropolitan areas include rural areas and secondary built-up urban areas that are outside the primary built-up urban area. These concepts are illustrated in Figure 1, which uses the Paris built-up urban area (unité urbaine) and metropolitan area ("aire urbaine") as an example.

    The Largest Cities

    The world’s eight largest cities are located in Asia. Tokyo-Yokohama became the largest urban area, according to the United Nations, in 1955, more than 60 years ago. However, Japan’s capital may not old onto the top position for long. With Japan now losing population, it seems likely that Tokyo-Yokohama — which has been about the only place in Japan gaining population — will begin shrinking in the next decade, while facing a strong challenge from Jakarta.

    Jakarta has closed the gap to about 6.4 million. This may seem like a lot, but this is the closest a number two urban area has been since 1965, when New York trailed Tokyo-Yokohama by 5.1 million. The gap between number one and number two New York amounted to 16.5 million in 1995.

    Jakarta has grown very quickly, and now stands at a population of 31.3 million. Between 2000 and 2010, Jakarta added more than 7,000,000 residents, one of the largest population gains of any city in history. Should this growth continue, and the population of Tokyo-Yokohama begin to decline, the largest city in the world could be Jakarta by 2030. Jakarta is also the largest city in size in the southern hemisphere, stretching beyond its city limits, into the regencies of Tangerang, Bogor, Bekasi and Karawang to  the large independent cities of Tangerang, South Tangerang, Depok, Bekasi and Bogor.

    Delhi, India’s capital, is not only the third largest city in the world, but is also the largest in India (25.7 million). That may be surprising, since Mumbai (Bombay) was the largest in India for decades and had been widely touted to become the world’s largest city. Delhi spreads from the National Capital Territory of Delhi into the states of Haryana and Uttar Pradesh. These areas include the modern edge city technology hubs of Gargaon and Noida (Figure 2).

    Seoul-Incheon is the fourth largest city in the world, with 23.6 million residents, Seoul-Incheon spreads from the core municipality of Seoul into suburban Gyeonggi and the independent municipality of Incheon. The core city of Seoul has stopped growing, and approximately 60 percent of the population is in the suburbs.

    Manila is the fifth largest city, with 22.9 million residents. Manila slipped from the fourth position according to recently obtained Philippine national statistics authority population projections. However, Manila continues to be one of the world’s fastest growing megacities and can be expected to pass Seoul-Incheon in the next few years. Manila spreads from the National Capital Territory into the adjoining provinces of Cavite, Laguna, Rizal and Bulacan.

    Sixth ranked Mumbai is a new entry to the top 10, with 22.9 million residents. The Mumbai urban area has been redefined to incorporate adjacent urban areas, which explains its larger population relative to last year. Mumbai extends from the municipality of Mumbai into the districts of Thane and Raighar.

    The sixth largest city is Karachi in Pakistan’s with 22.8 million residents. This population estimate is the least reliable among the largest cities. Pakistan’s last population census was nearly 20 years ago, and had been scheduled for March 2016. As of publication, the census has been postponed and no new date set.

    Shanghai dropped to the number eight position from sixth place last year. Shanghai’s population is estimated at 22.7 million residents. Like many cities across China, population growth has dropped substantially during this decade. Recently, the Shanghai city government announced that the population had fallen slightly over the last year, ending three decades of dramatic population growth in the last three decades. The Shanghai urban area is almost completely confined to the municipality of Shanghai, but has minor extensions into the provinces of Jiangsu and Zhenjiang.

    New York is the ninth largest city, with a population of 20.7 million. New York is the largest built-up urban area outside Asia and covers the largest land area of any urban area. New York extends into Long Island and the Hudson Valley in the state of New York, Connecticut and New Jersey. New York had been the world’s largest city before Tokyo, a distinction that it had held since 1925, when it surpassed London (now 33rd largest).

    The 10th largest city of Sao Paulo, with a population of 20.6 million. Sao Paulo is a new addition to the top 10, Latin America’s largest city and the core municipality. Sao Paulo stretches from its large core city in all directions, with approximately half of the population in the suburbs.

    Two cities fell out of the top 10, Beijing and Guangzhou-Foshan. Like Shanghai and some other cities of China, newer population estimates indicated a substantial decline in growth rates. Beijing is now the 11th largest city in the world, while Guangzhou-Foshan is 13th largest.

    Mexico City is ranked 12th largest in the world. Mexico’s capital has experienced a roller coaster ride in urban area rankings since the middle of the last century. In 1950, Mexico City ranked 17th in the world, according to United Nations estimates. By 2000, Mexico City was second in the world to only Tokyo Yokohama. During the period of its greatest growth, in the late 20th century, it was common to hear that Mexico City would eventually be the largest in the world (as was the case with Mumbai, above) but its once frenetic growth has cooled considerably.

    Los Angeles has also had its ups and downs. It is substantial growth in the first half of the 20th century brought Los Angeles from virtually nowhere to 12th largest in the world by 1950. As in Mumbai and Mexico City, there were those who expected Los Angeles to become the largest city in the world. By 1965, Los Angeles was the sixth largest city, trailing only Tokyo Yokohama, New York, Paris, London and Osaka Kobe Kyoto. Now, Los Angeles has fallen to 19th position and not only is unlikely to ever be the largest city in the world or even in the United States.` The 5 million population gap compared to New York in 2016 is little different from 1990.

    Distribution of Population

    Much has been made of the fact that the world now has more than one half of its population living in urban areas. More than one analyst has misunderstood this as meaning that the norm for world residents looks like Fifth Avenue in New York, central London or Paris or the huge shantytowns of Mumbai or Dhaka. In fact, however, most urban residents live in nothing like such environments (See: What is a Half Urban World?).

    Only 8.2 percent of the world population lives in megacities (built-up urban areas with more than 10 million population. In contrast nearly a quarter lives in cities of more than 1 million population, including the megacities. A larger 30 percent of the world population lives in urban areas under 1 million population, which includes the smallest towns. Rural areas still have nearly 46 percent of the world population (Figure 3).

    Most of the large built-up urban area population lives at densities between 4,000 and 10,000 per square kilometer, or approximately 10,000 to 25,000 per square mile. These population densities are typical in parts of Asia, Africa and South America. Another one quarter of the population lives at densities of below 4,000 per square kilometer or approximately 10,000 per square mile. These densities are principally found in Europe, North America and Oceania (principally Australia and New Zealand). Slightly less than one quarter of the population lives at higher densities, above 10,000 per square kilometer or 25,000 per square mile. These densities are largely limited to certain Asian and African nations, such as Bangladesh, the Democratic Republic of the Congo and Pakistan (Figure 4).

    The Future

    As has been noted before, much of the population growth in the world will be in Africa over the next century. However, in the next few decades the greatest urban population growth seems likely to be in Asia, where 57 percent of the large urban area population lives. Even with declining growth rates, such as in China, many millions more  rural residents are expected to continue moving into China’s  cities .

    Note on Availability

    The full Demographia World Urban Areas and its components can be downloaded as follows:

    Full Report:

    Demographia World Urban Areas

    By Component:

    Demographia World Urban Areas- Index

    Photograph: Cover of Demographia World Urban Areas: 12th Annual Edition

    Wendell Cox is principal of Demographia, an international pubilc policy and demographics firm. He is a Senior Fellow of the Center for Opportunity Urbanism (US), Senior Fellow for Housing Affordability and Municipal Policy for the Frontier Centre for Public Policy (Canada), and a member of the Board of Advisors of the Center for Demographics and Policy at Chapman University (California). He is co-author of the “Demographia International Housing Affordability Survey” and author of “Demographia World Urban Areas” and “War on the Dream: How Anti-Sprawl Policy Threatens the Quality of Life.” He was appointed to three terms on the Los Angeles County Transportation Commission, where he served with the leading city and county leadership as the only non-elected member. He served as a visiting professor at the Conservatoire National des Arts et Metiers, a national university in Paris.

  • America’s Software And Tech Hotspots

    Where is America’s tech and software industry thriving? In a new study conducted for the San Diego Regional Economic Development Corp., researchers took an interesting stab at that question, assessing which metro areas have the strongest concentrations of software developers, spread across a broad array of industries, as well as the best compensation and job growth, and access to venture capital funding.

    What they found is a geography dominated by traditional tech centers, particularly those with strong universities. The San Jose, Calif., metro area and Seattle led the way, followed by San Francisco and Boston. The back half of the top 10 is a bit more surprising, featuring Baltimore, Atlanta and Washington, D.C.

    All these metro areas have outsized concentrations of software developers compared to the national average. San Jose boasts an unparalleled concentration of talent, with 69.7 software developers per 1,000 employees, five times the average among the nation’s 50 largest metro areas. Seattle runs second with a concentration of 38.3 per 1,000 workers.

    These areas tend to have different areas of expertise. Software is now critical to many industries; not just computers, but also manufacturing, finance and services. In places like Washington and Baltimore, much of the work is related to the federal government, as is also true for seventh-ranked San Diego, which has long had a major military presence. The Bay Area, of course, dominates fields such as new media, search and computer systems design. In San Diego they tend to work in scientific research much more than their counterparts elsewhere in California.

    These ratings matter not so much in terms of the number of jobs — software publishers have added a net of 50,000 jobs since 2001, up 19%. Yet as software use has grown, there has been impressive growth across the board in the number of programmers: According to EMSI, the profession has added 350,000 jobs since 2003, 27 percent growth. Jobs in this category also carry a decent paycheck, with a median hourly wage of $44. In 2015, notes the San Diego report, software firms received $23.8 billion in venture capital—a 400% increase in investment since 2010.

    Greater Concentration Or Decentralization?

    Clearly metro areas like San Diego have good reason to sell themselves as software hotspots; the industry has grown three times faster in employment than the overall economy and expects 18.1 percent growth this year.

    But not all hotspots are equal, which is also true of tech in general. Indeed, according to EMSI data, the share of high-tech employment in the Silicon Valley/San Jose area’s economy  is more than six times the national average. Others that rank more than twice the national average include Washington D.C., San Francisco, Seattle, Boston, Raleigh and Austin, who are also our leaders in software. Others on the software list, such as San Diego, are above the national average, but only slightly – San Diego’s overall share of tech jobs relative to the national average has actually declined since 2001.

    Clearly metro areas that have had long-established tech communities do well, but perhaps this may prove not so much the wave of the future but the resonance of the past. In fact, if we look at which areas are having the most tech growth, many are not what would be widely considered tech hubs. Indianapolis, for example, has seen a 102 percent growth since 2001 in tech jobs while Las Vegas, Jacksonville and Nashville have seen strong growth of over 80 percent or more, and each has boosted its share of jobs in tech dramatically.

    But perhaps the most critical advantage is to those areas which have both high concentrations of tech jobs and also rapid growth. These areas would seem best positioned to advance in the coming years and include some of the study’s software superstars. Austin for example has expanded tech employment since 2001 by 89% and boosted its location quotient (the ratio of local share to national share of jobs in a sector) for tech employment from 2.14 to 2.32. Raleigh, San Francisco and Seattle have also expanded both in relative and absolute tech employment.

    Essentially we may be witnessing two parallel, and notionally conflicting developments, notes analyst Mark Schill of the Praxis Strategy Group. There are clearly a series of regions, as identified by the report, that have achieved critical mass in software and across many other tech fields. Yet at the same time, the most rapid growth is taking place largely in non-traditional tech hubs, including places like Salt Lake City, San Antonio, and Phoenix, all seeing rapid growth in tech jobs as well as a growing concentration.

    Big City Tech Bust

    The software study also reveals something that might not please many advocates for an urban-centered tech world. Despite their strident efforts to promote themselves as tech and software centers, our three largest cities — New York, Los Angeles and Chicago — have not fared terribly well. The one dense urban center that has seen rapid growth in terms of tech jobs and share has been the San Francisco-Oakland area, which has the advantage of being located next to Silicon Valley and the dominant centers of venture capital. The region also includes parts of the Peninsula, like San Mateo, that have emerged as important suburban tech hubs.

    In Los Angeles, the decline of the aerospace industry has stripped away its primary tech anchor. L.A., Chicago and NYC have posted average tech growth. If all the hype ascribed to “Silicon Alley” or “Silicon Beach” were matched by their performance, the numbers would look very different.

    This can be seen by comparing growth in software jobs, an area where dense urban areas are widely held to have big advantages. Between 2010 and 2014 software employment expanded only 13.6 percent in New York, and 11.7 percent in Los Angeles, compared to the median growth of 13.4 percent.

    This parallels their less than spectacular performance in our analysis of EMSI tech employment. Despite the almost endless discussion of Gotham as tech job hub, New York’s tech growth since 2001 has been a below average 27% while its tech locational quotient has dropped from 1.15 to 1.06, roughly the national average. Chicago did even worse, growing just 24% and actually seeing its locational quotient drop to 0.98, below the national average. But the big loser has been Los Angeles, once a premier tech hub, but clearly losing its edge. Since 2001 L.A. has managed only 9 percent tech growth and its relative concentration in tech jobs has fallen to 0.74, well below the national average.

    Looking Ahead

    The San Diego study, as well as our own analysis, suggests a diverse future for software and other tech related fields. First, there are the clear winners — places like San Francisco, Silicon Valley, Raleigh, Seattle, Austin — which continue to add both new jobs and boost their share of tech and software employment. Areas like these enjoy both momentum and critical mass, which all but guarantees a prosperous future for these metro areas as software comes to dominate more of our lives, and other industries.

    The second group, which includes key players like San Diego and Boston, will be fighting to hold onto their positions. They have experienced some growth, but their share of tech jobs has been falling and they may not have the momentum to make up for other disadvantages such as high housing prices and taxes. Such things may not slow superstar cities like San Francisco, but they seem to take some of the wind out of the sales of these less dynamic tech centers.

    Third, and most troubling, will be those places like New York and Los Angeles where the tech economy is often hailed as a savior, but does not seem, in relative terms, to be living up to the feverish advertising. Here high housing prices may be exacting a strong toll on the workforce. NYC and L.A. are both among the bottom six in terms new jobs in STEM (science, technology, engineering and mathematics-related positions); both actually have lost such workers since 2001, and now have workforces considerably less skilled in tech fields than the national average.

    Finally, and this is not something widely acknowledged, has been the strong gains of less expensive, less heralded cities. They do not always have above average concentrations of tech and software workers, but are experiencing impressive gains. Take Phoenix, where tech employment has expanded 78 percent since 2000, while software employment has grown 28.8 percent since 2010. Phoenix’s tech location index is, remarkably, now higher than that of Los Angeles. Other, not widely appreciated big gainers in software include Nashville (43.5 percent gain), Atlanta (48.6 percent) and Charlotte (up 42 percent).

    Given the ability of software firms to locate where they wish due to the intrinsic nature of their industry, we should expect not just consolidation to continue in certain markets, but also a simultaneous rapid dispersion of tech jobs. Yet neither the agglomeration nor the dispersion is likely to be evenly distributed. Among the nation’s 53 largest metropolitan areas, just 20 saw their relative concentrations of high-tech employment increase since 2001. Mapping the future of tech and software employment will need to consider both factors and those regions which fit neither the low-cost model or that of the hyper-concentrated area may need to sit and reconsider how they can get back into the digital game.

    This piece first appeared in Forbes.

    Full List: America’s Top 10 Software Hotspots (Forbes slideshow)

    Joel Kotkin is executive editor of NewGeography.com. He is the Roger Hobbs Distinguished Fellow in Urban Studies at Chapman University and executive director of the Houston-based Center for Opportunity Urbanism. His newest book, The Human City: Urbanism for the rest of us, will be published in April by Agate. He is also author of The New Class ConflictThe City: A Global History, and The Next Hundred Million: America in 2050. He lives in Orange County, CA.

  • Geography and the Minimum Wage

    Most commentary on California’s decision to increase the state minimum wage to $15 over time is either along the lines of it being a boon to minimum-wage workers and their families or a disaster for California’s economy.  Neither is accurate.  Different regions sill see different outcomes.  Central California, the great valley that runs from Bakersfield to Redding, once again, will bear a disproportionate burden. 

    Some workers’ income will increase, but hardly enough to afford a standard of living that most readers would find acceptable.  At 40 hours a week and working 52 weeks a year, the minimum-wage worker will earn $31,200 a year before taxes.  Try living on that in San Francisco or Santa Barbara.

    Then, there are the workers who will lose their job, or never get one in the first place.

    A $15 an hour wage would devastate some economies, but California is different.  Individuals and families may be devastated.  Regions may be devastated.  Coastal California, with the possible exception of Los Angeles and the far northern counties, will do just fine.  You will probably not be able to see an effect in their data.

    Central California is another story.

    California is in transition from a tradable goods and services producing economy to a consumption and non-tradable services producing economy.  Tradable goods and services are goods and services that can be consumed far from where they are produced.  Manufacturing is the classic example of tradable products, but thanks to the internet, services are also increasingly tradable. 

    These days, many services that were once non-tradable are tradable.  Tax preparation, legal research, accounting, and term-paper writing are examples of tradable services that were once non-tradable.  As a friend of mine says, anything done at a computer can be done anywhere in the world.

    Non-tradable services are those that must be consumed where they are produced.  Lawn care, haircuts, and home maintenance are some examples.

    The distinction is important because a minimum wage increase affects each differently.

    The initial impact of a minimum wage increase is to increase the cost of the goods or services, tradable or non-tradable.  It’s what happens after the increase in cost that makes the difference.

    Consider a minimum wage increase on one side of a street and not the other side.  You might consider walking across the street for a burrito, cup of coffee, or haircut, if the price is cheaper there.  This is the substitution effect.  It will be almost non-existent for non-tradable services with a statewide minimum wage increase.  No one will drive to Arizona for a haircut or cup of coffee. 

    Non-tradable services are left with only a price effect, to be discussed in a bit.

    Tradable producers, though, face a formidable substitution effect.  They are competing with producers worldwide.  If they raise their prices, it is likely that enough customers will switch to other producers that tradable producers will be forced to relocate for lower-wage workers of go out of business.  If they lack monopoly power, they are unlikely to be able to absorb the cost increase.

    One impact of California’s minimum-wage increase, then, will be an acceleration of California’s transformation to non-tradable services production and the permanent loss of tradable sector jobs, outside of fields like software.

    It is fundamental to economics that the higher the cost of any good or service, the less that will be consumed.  This is the price effect, and it affects tradable producers differently than non-tradable producers.

    Unless they have monopoly power, tradable producers will not see a price effect.  The world price will remain the same.  Total world consumption will stay the same.  The distribution of sellers, however, will change.  Agriculture is an excellent example of competitive world markets.  California will likely provide a smaller share of the world’s agricultural output.

    If the tradable producer has monopoly power, the price effect may be large or small.  If it is small, they will see a small decline in sales.  If it is large, they may have to absorb the increase, sacrificing some of their monopoly profits.

    Non-tradable producers will face a price effect.  How big that price effect is depends on the wealth of their customers and how essential the service is to the consumer.  A wealthy person will probably not change their behavior because of, say, a ten percent increase in the cost of haircuts.  A poor person may reduce the frequency of haircuts.

    Tradable sector and non-tradable sector businesses will attempt to minimize the cost increase of a minimum wage hike.  This is most easily achieved by replacing some labor with capital.  This is the production function effect.  Assembly line workers may be replaced with robots.  Waiters may be replaced with tablets at the table, as we’ve already seen in some restaurants.

    Some would argue that there is another effect, an income effect.  The idea is that the increased income, and spending of minimum-wage workers will more than offset the price and substitution effects.  This violates another fundamental economic principle, the one that asserts that there are no free lunches.  The minimum wage earner’s new income is not new wealth miraculously provided by the minimum-wage fairy.  For every new dollar the minimum-wage worker has to spend, someone else has one less dollar to spend. In fact, due to inefficiencies (distortions in product mix and markets resulting from non-market prices) created by the transfer, someone else must forego more than one dollar in order to create the dollar provided by wage increase.

    Analysis of price and substitution effects implies that different California regions will be affected differently by the minimum wage increase.

    Because wages are generally lower in Central California than in Coastal California, the minimum wage increase will be more impactful in Central California, amplifying both price and substitution effects relative to Coastal California.  Central California’s economy is also more dependent on tradable-goods production than is Coastal California, it will, therefore, be hurt more by the decline in tradable-goods producers.  Similarly, because Central California’s income is less than Coastal California’s, it will also see a greater price effect on its non-tradable producers.

    Central California is seemingly in perpetual recession.  Even in good times, many Central California counties see double-digit unemployment.  Colusa County’s unemployment rate was over 20 percent in the most recent data release.  The region also sees disparate impacts from California’s high energy costs, water policies, and regulatory infrastructure, all of which hit them much harder.

    Coastal Californians underestimate the economic differences between California’s regions.  They are huge.  California simultaneously has some of America’s wealthiest communities and some of its poorest.  It’s important that we remember that California, with about 12 percent of America’s population, has 35 percent of the nation’s welfare recipients.

    Most of California’s wealthy coastal citizens never see California’s poor inland communities.  Yet, wealthy Coastal Californians — particularly from San Francisco — dominate state policy.  They implement policy as if the entire state were as wealthy as the communities they live in.  The minimum wage increase is just the latest example.

    Decency would seem to require that California find ways to accommodate the circumstances and needs of our least advantaged citizens and regions.  We don’t though.  Instead we create policy that hurts our least advantaged and makes their challenging lives even more so.

    Bill Watkins is a professor at California Lutheran University and runs the Center for Economic Research and Forecasting, which can be found at clucerf.org.

    Unemployed woman photo by BigStockPhoto.com.

  • Liberals — Except When it Comes Home

    My old boss, Bruce Brugmann, who ran the Bay Guardian, told me early on in my career that you could tell the real politics of a big-city newspaper by the person they endorse for mayor.

    Nice liberal outfits like the New York Times support Democrats for president and (typically) governor and US Senate. The SF Chronicle doesn’t endorse many Republicans any more. But when it comes to the local stuff, the decisions on who should run the city where they live and operate and connect with the power structure, the truth comes out.

    The Times loved Ed Koch and backed Michael Bloomberg. The paper didn’t endorse Bill DeBlasio in the Democratic primary. The Chron backed Dianne Feinstein, John Molinari, Willie Brown, Gavin Newsom, and Ed Lee.

    There’s a perception that cities like SF, because they tend to vote overwhelmingly for Democrats, and send Democrats to the state Legislature and Congress, are by nature progressive communities. And that all breaks down when it comes to local issues, particularly when they involve real estate.

    The biggest Democratic Party donors in SF in the 1980 and 1990s were the members of the Shorenstein family, who hosted Bill Clinton at their home. They were also big downtown developers who spent that same Democratic money blocking any attempts to development limits.

    Our Democratic member of Congress, Nancy Pelosi, is either missing or on the wrong side on pretty much every land-use and development issue back at home.

    Gavin Newsom, who wants to be the next governor of California, got his start in local politics attacking homeless people.

    In other words, the gentrification and displacement in San Francisco is happening despite, and I could argue with the concurrence of, some of those “liberal” Democrats who, from a distance, seem much more progressive than they are when you look at their records right here at home.

    So we get what I call the David Chiu phenomenon – a person who pushed and promoted legislation backed by and in part written by Airbnb, which has driven thousands of housing units off the market, gets seen as a San Francisco progressive when he’s away in Sacramento.

    You can tell what a newspaper really thinks by its endorsement for mayor. And you can tell what a politician really thinks by what they do on the local issues that pit the power structure (in this case, tech, real estate, and the mayor) against the rest of the community.

    Which brings me, more or less, to Paul Krugman, the great liberal economist of the New York Times.

    Krugman is great on a lot of big national economic issues. He’s terrible when it comes to cities.

    The guy famously came out against rent control years ago, when any urban economist with any sense knows that rent control is one of the most powerful tools agaist displacement. It’s what makes an urban middle class possible in a city like San Francisco.

    And now he’s saying that cities need to reduce zoning rules and allow more housing, or any height, pretty much anywhere. He praises the idea that NY Mayor DeBlasio is pushing, which is similar to what SF Mayor Lee is pushing, which in essence cedes to the private market the responsibility to provide affordable housing and assumes that some modest percentage of “affordable” units in luxury towers that are geared to the same crooks and despots now in the news will be a real solution to the urban housing crisis.

    I shouldn’t have to keep saying this, but I will: You need to build at least 30 percent affordable housing in every luxury project just to stay even, and not make things worse. Which means if you want to add to the stock of affordable housing, you have to force developers to build 40, 50, 60 percent of the units for people of more modest means.

    That’s not even on the agenda in SF or NYC.

    If we took Krugman’s national approach – the rich ought to pay more taxes to pay for investment in the nation’s service and infrastructure – and applied it to cities, you’d get a very different approach. Urban developer profits have created great fortunes (Shorenstein, Trump); to a great extent, local governments have failed to tax those profits at a level that’s necessary to mitigate the impacts of their projects.

    Krugman ought to know that the middle class in an American city is not a natural consequence of capitalism. It requires strict regulations and controls. It means, sometimes, slowing down the booms that make a few rich so that the rest of us have a chance, too.

    That’s perfect liberalism, in the old school. Except that these great scholars and writers (and politicians) don’t seem to want to bring those policies back home.

    Author Tim Redmond, the former longtime editor of the San Francisco Bay Guardian, edits the online San Francisco publication 48 hills.

    This piece originally appeared at 48hills.org.

    By Prolineserver (Own work) [GFDL 1.2], via Wikimedia Commons

  • LSE/Netherlands Research Documents Price Effects of Tight Housing Regulation

    New research by London school of economics Professor Christian Hilber and Wouter Vermeulen of the Netherlands Bureau for Economic Policy Analysis provides strength and evidence of the connection between high housing prices and strong regulatory constraints. The paper advances the science by estimating the share of house price increases attributable to regulatory constraints. Hilbur and Vermeulen show that supply constraints are considerably more important in driving up house prices than the physical constraints (such as lack of land or topography) and lending conditions or interest rates:

    "In a nutshell, in our paper we use this unique data to test our prediction that house prices respond more strongly to changes in local demand in places with tight supply constraints. In doing so, we carefully disentangle the causal effect of regulatory constraints from the effects of physical constraints (degree of development and topography) on local house prices, holding other local factors constant and accounting for macroeconomic fluctuations induced, for example, by changing lending conditions or interest rates."

    Their conclusions are based on analysis of housing markets in the United Kingdom since 1979. Unlike the United States, Canada, Australia or New Zealand, the United Kingdom was fully engulfed by urban containment regulatory policy by that time.

    Perhaps the most important advance of the research was the author’s quantification of developable land. This is a relatively new direction in research, with perhaps the most important early contribution from Alberto Saiz of Harvard University, whose estimates relied on the assumption of a 50 mile radius of land from the cores of US metropolitan areas. My response  doubted the usefulness of measuring housing markets with a fixed radius, not least because since some metropolitan areas (and even built-up urban areas) extend beyond that distance. Hilbur and Vermuelen avoid this problem by estimating developed land by local authority area, which allows for analysis at the housing market level (which is usually larger than the local authority area).

    The authors also note recent research on the consequences of land use regulation to economic growth and stability. These include Hseih and Moretti, who found that without tight housing regulation, the gross product in the median city might be nearly 10 percent higher, and Glaeser et al research showing the greater volatility of prices in a tightly regulated environment.

    The authors summarize the problem:

    "Absent regulation, house prices would be lower by over a third and considerably less volatile. Young households are the obvious losers, yet macroeconomic stability is also impaired and productivity may suffer from constrained labour supply to the thriving cities where demand is highest."

    This is important research in a world struggling to restart healthy economic growth and reverse the decline of the middle-income standard of living.

  • A Commentary on the Notion of Extreme Commutes

    A recent piece by Joe Cortright in the City Observatory touched on the often discussed issue of extreme commutes, a favored topic among reporters complaining about sprawl and traffic congestion. The notion of extreme commutes is obviously a fun topic. But it is one that is ripe for analysis based on  travel time data that has been available through the Census since 1980 .

    Reporters like to focus on the longest commutes, generally anything more than an hour.  In early census data many of the travel time tabulations presented an upper limit category of “45 minutes or more”.   The 1980 census showed an average travel time of 21.7 minutes, rising to 22.4 minutes in 1990, a rather trivial increase of about 40 seconds in a decade in which we added 22 million commuters driving alone.  Not surprisingly such consumption of our road capacity couldn’t continue and in 2000 average travel times rose by more than three minutes despite an increase on the order of only 13 million solo drivers.  

    In my early work in Commuting in America I realized that averages are dangerous things, especially when the subject is speeds and travel times, so I began tracking the percentage of commuters who got to work in under 20 minutes and more than 60 minutes.  Twenty minutes is used because if you got to work in under 20 minutes you had absolutely nothing to complain about; and if you were over an hour then maybe some sympathy was in order.  As the data got better and the travel times got worse the Census Bureau introduced the notion of a 90 minute or greater commute which they labeled an “extreme commute”. 

    What’s behind it all? Is it as catastrophic as the average reporter will try to make it?  (They always manage to find someone who gets up at 4 am and travels three hours on a bus from Pennsylvania to Manhattan).  Examining the current trends reintroduced the substantial concern that all analysts must recognize – you have to keep asking: “is this a new trend I am seeing or just another part of the long, slow recovery from an extreme economic event?”  The passage of time suggests the latter, often to the disappointment of those who saw a new dawn of the behaviors they tend to endorse. The figure below shows that between 2000 and 2012 travel times were effectively constant at 25.5 minutes. After that, as employment began to improve travel times inched forward to 26 minutes in the 2014 ACS data. 

    Looking at the longer term patterns, back in 1990 just about half of the workers in America got to work in under 20 minutes.  That dropped to 45% in 2000 and now is trending further down to about 43% in 2014.   Much of the Midwest is still in that range, and if you add in the dramatic increases in those who work at home then we are still in the 50% range in much of America. 

    In comparaison the over 60 minutes category  is remarkably small. In 1990 we were at about 6% and at 8% in 2000. It has been rising slowly and at the present rate of change we still won’t reach 9% in this decade.  Having said that, we must recognize that we are now talking about over 11 million workers in the 60 minute plus category.

    Looking in greater detail at the disaggregate patterns we see that the trend in 60 to 89 minutes continued to rise, while the over 90 minute element dropped off.  What happened is that both categories rose through 2008 or so and then with the recession dropped off and now have gone through a slow resumption of expansion in the new decade.  

    Some of the trends that define travel

    One would expect that when jobs are scarce, as during the recent recession and long limited recovery, the average distance people would be willing to travel to find work would increase.   Not finding a  job in a preferred 30 minute travel time labor market shed around one’s home makes expansion to 45 minutes or an hour more feasible after being unemployed for months.  I am sure much of that happened, but the broad statistics tell a varying story.  The share of commuters over 90 minutes dropped; two important factors were in play that overwhelmed the statistics:

    #1 there’s nothing like 10% unemployment to improve congestion. When the number of workers declined road speeds improved, or at least didn’t continue to get worse.  So a previous 90+ minute trip might have improved to 85 minutes.   When your travel mate lost his job your solo commute got to be shorter.

    #2  The more important factor was that the kinds of jobs lost in the recession were exactly those that tended to be long distance.  A large share of the job losses were in construction and factory work.  Home construction, of course, mostly occurs at the edges of the region where workers often arrive by carpool.  And large factories today are often located in rural areas for logistical purposes – with workers traveling immense distances – for example  the car plants and refineries of the south. Note also that there were parallel very severe declines in carpooling in the period.  This was at least one of the many factors in that decline.  As the economy slowly improved we have seen the return to greater travel times as construction, manufacturing and other activities return and roads congest again. 

    The significant long term factors we need to recognize in our assessments of future prospects are these:

    The key driver of future commuting will be the need to find replacements for the retiring baby-boomers, particularly skilled workers.  In general that suggests large metro areas where the access to a variety of workers will be greatest. The larger areas have the best answer to the question “how many people with the skills I need can I reach in a half hour’s travel commuter shed from this location?” 

    One of the fundamental patterns of American commuting today is massive flows between counties.   In 1960 a bit more than nine million workers left their residence county to work, today it is over 37 million and the share of work travel is over 27% almost double the 60’s percentage.

    Planners have a dream of better “balance” in jobs and workers in communities that will promote walking/biking to work.  Some of that will happen as both suburban and central city Job/Worker ratios approach 1.0  from opposite directions. But  the realities of work travel are sharply different.  First of all about two-thirds of workers live in a household with other workers – whose job will they live near?  Workers, particularly the young, change jobs often. Will they move, incurring costs and further disruption in their lives every time they change jobs?  Not likely! 

    My own county of Fairfax County, Virginia illustrates the national pattern.  In 1980 it was a standard bedroom suburb with roughly 400,000 workers and 300,000 jobs for those workers, a J/W ratio of .73, the very definition of a suburb .  Flash forward to 2010 and the J/W ratio was at balance, .99, so that if all the workers who could, stayed in the county to work only 8,000 would have to leave to reach available jobs. But, in fact the county exported 280,000 workers and imported 272,000 with an overall flow of over 550,000 crossing its borders every day rather than 8,000. That’s what commuting is really all about.  Today, Fairfax County fits the definition of a central city with more jobs than workers yet still  the border crossings have reached over 570,000 every day.  The key point is that having a numeric balance in jobs and workers has little value, it is the match in the skills needed by employers and the skills possessed by resident workers that is crucial.

    Some closing thoughts

    These changes in a long term trend of people traveling significant distances to work with an interruption brought on by national employment trends.  The current penchant of rail transit proposals to reach farther and farther into the hinterlands to support the central city does not address the dynamic of ever more dispersed employment.  Transit has its highest share in trips over 60 minute and are a very significant part of intercounty and interstate travel.  The fact that they are a great deal slower than alternatives adds to the shares over 60 minutes. Many of our “metro” systems are closer to being commuter rail lines than city subways, BART, for example, the new Silver line in DC, for another, are excellent example.  Think if the entire subway investment in the Washington area had occurred inside the District borders, or at least inside the Beltway, there would have been a very real difference in being inside or not. 

    We can expect to see longer distance travel as more specialized skills are demanded by employers.  I recall in the eighties in China where the workers at the number one bicycle factory lived in apartments across the road and walked across the street every day to work.  Even where the government owned the factories, the housing, and the people that still didn’t work. When we are hiring systems engineers or any other highly skilled workforce element it will be even more impossible.     

    The dominant flow today is circumferential from suburb to suburb from far lower density housing to smaller work places than the number one plant in Shanghai. We don’t live outside the factory gate anymore. About 5% of those who move are seeking a better commute.  Most moving focuses on a better place with the amenities the household’s prefer and their commute is often the residual. As hard as we might try, minimizing the commute will not define people’s housing or job patterns in the future. Did I hear someone say autonomous vehicles.

    Alan E. Pisarski is the author of the long running Commuting in America series. A consultant in travel behavior issues and public policy, he frequently testifies before the Houses of the Congress and advises States on their investment and policy requirements.

    Photo by Nathan Harper, Bottleleaf

  • California Leaders Double Down on Dry

    “What do we do with this worthless area, the region of savages and wild beasts, of shifting sands and whirlwinds of dust, of cactus and prairie dogs? To what use could we ever hope to put these great deserts and these endless mountain ranges?”

    – U.S. Secretary of State Daniel Webster, on the American West, 1852

    The drought, if somewhat ameliorated by a passably wet winter in Northern California, reminds us that aridity defines the West. Our vulnerability is particularly marked here in Southern California, where the local rivers and springs could barely support a few hundred thousand residents, as opposed to the 20 million or so who live here. Bay Area, we’re talking about you, too, since about two-thirds of your drinking water is imported.

    The prospect of continued water shortfalls – perhaps made worse by climate change – poses something of an existential question for this state. In the past, California met the challenge of persistent dryness much as the Romans did in their heyday, by constructing massive waterworks that connected mountain runoff with the thirsty urban masses. Everything that made California the harbinger of the future, from rich farmland to semiconductors and our great cities, was predicated on water transfer.

    Now there is a sense that California’s expansion, its ability to create new communities and industries – outside of a few fields, like media and software – faces insurmountable constraints on water and other resources. This perspective has been favored by greens, anti-development NIMBYs and those who seek to corral all California growth into ever-denser, family-unfriendly environments.

    This mindset has been predominant over the past decade, as the state has invested little in new water storage or delivery systems, essentially doing nothing since the late 1970s, when the population was 16 million less. Like the Roman Empire in its dotage, we seem to have decided to live off the blessings of the past, a sure way, it seems, to guarantee a diminished future.

    Read the entire piece at The Orange County Register.

    Joel Kotkin is executive editor of NewGeography.com. He is the Roger Hobbs Distinguished Fellow in Urban Studies at Chapman University and executive director of the Houston-based Center for Opportunity Urbanism. His newest book, The Human City: Urbanism for the rest of us, will be published in April by Agate. He is also author of The New Class ConflictThe City: A Global History, and The Next Hundred Million: America in 2050. He lives in Orange County, CA.

    Photo of Lake Palmdale California Water Project by Kfasimpaur (Own work) [Public domain],via Wikimedia Commons