Blog

  • Japan Census 2015: Decline Less than Projected

    Headlines were recently made recently as Japan finally experienced a long predicted official decline in population. This is widely expected to be the beginning of a long decline in population, which the National Institute of Population and Social Security Research has projected will drop Japan’s population from its present 127 million to 43 million by 2100 (Chart). This loss equals or exceeds the population of all but 15 of the world’s nearly 200 nations, including Germany, the United Kingdom and France.

    Population projections are, of course, not an exact science. They can be accurate, or they can “miss by a mile.” The preliminary 2015 census figures indicate that the population loss since 2010 has been considerably less than predicted. Japan lost 950,000 residents since between 2010 and 2015,The previous 5-year census period had shown a gain of 280,000. Losing nearly a million population is a big deal. But losing 1.5 million would have been an even bigger deal, as had been projected by Japan’s National Institute of Population and Social Security Research. Over the past five years, Japan’s population loss was more than one-third less than expected (35 percent).

    The big question is “why?” The most obvious answer is a combination of factors, such as   more births than projected or a falling death rate. The Japanese enjoy long lives. In 2013, there were more people aged 100 or above than in the United States, despite, Japan’s 60 percent lower population. More than one in eight of the world’s centenarians live in Japan, while only one in sixty of the world’s people is Japanese.

    No analysis has been identified, nor is the detailed age data for such an analysis readily available. This is to be expected this soon after publication of the first census results. However, recent media reports indicate a continuing annual decline in births. The difference could also be the result of problems in the projection methodology.

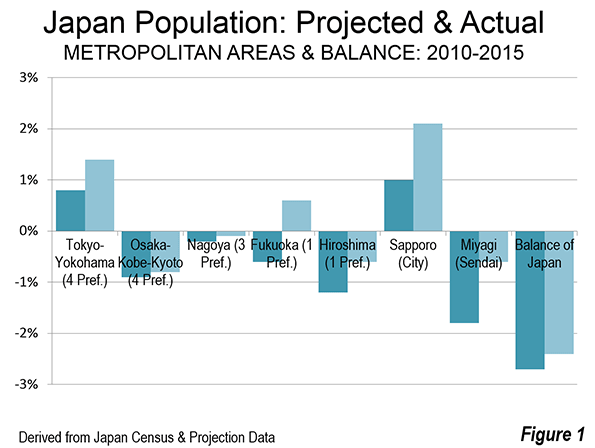
    Actual and Projected Population by Area

    As had been the case in the last census period (2005-2010) Tokyo was the big winner. Tokyo prefecture (note), which contains the 23 ku (cities) that constituted the city of Tokyo until its mid-1940s dissolution as well as suburbs, was expected to gain 190,000 residents, but added 355,000. Overall, the four-prefecture area of Tokyo-Yokohama, which includes Tokyo, Kanagawa, Saitama and Chiba prefectures added more than 500,000 residents, compared to the expected 275,000. The gain in Tokyo-Yokohama was 1.4 percent, nearly double the 0.8 percent expected.

    The other two megacities (over 10 million population) did not do so well. Osaka-Kobe-Kyoto (Osaka, Hyogo, Kyoto and Nara prefectures), which is larger than the Los Angeles-Riverside combined statistical area, lost 140,000 residents, nearly as many as the 164,000 projected. Osaka-Kobe-Kyoto was expected to lose 0.9 percent of its population, and nearly equaled that, at minus 0.8 percent.

    Nagoya, including the prefectures of Aichi, Mie and Gifu, lost 13,000 residents, two-thirds the 19,000 projected. Nagoya lost 0.1 percent of its population, slightly better than the minus 0.2 percent projected.

    The middle-sized metropolitan areas did better. The prefecture of Fukuoka, which includes the nation’s fourth largest metropolitan area, Fukuoka-Kitakyushu was expected to lose 0.5 percent of its population, Instead it managed a 0.5 percent gain. Hiroshima was expected to lose 1.2 percent of its population and lost only one-half that much (minus 0.6 percent).

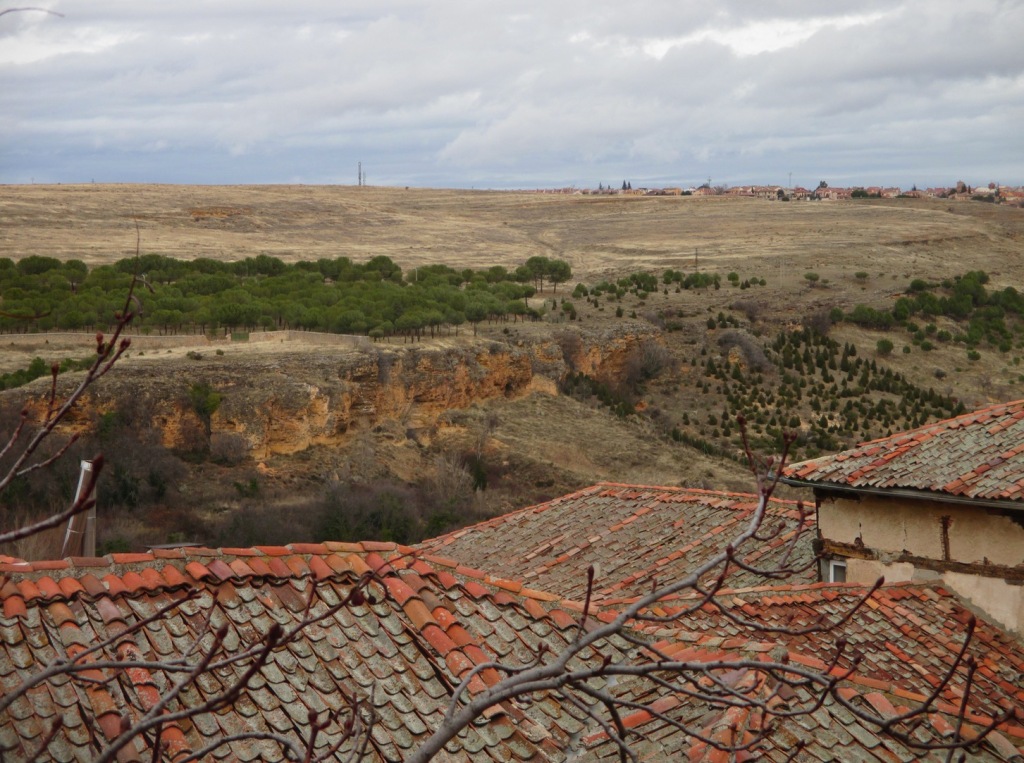
    The city of Sapporo, in Hokkaido prefecture, was a big winner more than doubling its projected 1.0 percent increase (Note 2). Sapporo had a population gain of 2.1 percent. Most of the Sapporo metropolitan area is in the city of Sapporo, and unlike many core municipalities, there is still room for greenfield development.

    Sendai, in Miyagi prefecture was particularly hard hit by the great earthquake and tsunami of 2011. That makes Sendai’s population performance all the more impressive. Sendai was projected to suffer a population loss of 1.8 percent. Yet, its population loss was two thirds less, at 0.6 percent.

    The balance of the nation even did better than expected. Outside the metropolitan areas listed above (and the city of Sapporo), Japan was expected to lose 2.7 percent of its population. The loss was somewhat more modest, at 2.4 percent.

    Government Concern

    Despite the better news out of the census, the government is taking the longer term population loss very seriously. Its Committee for the Future indicates that the prospect could be: “…impose a great burden on people that offsets economic growth, threatening to decrease the actual per-capita consumption level, or the metric for the actual quality and level of people’s lives.”

    Even Tokyo, which has escaped the effects of population decline will be at risk, according to the Committee: The Tokyo Metropolitan area, while unable to avoid the effects of hyper-aging, will lose the vitality of a global city…”

    The changing demographics are already evident in a near majority single person household population in the core Tokyo prefecture. In 2010, 46 percent of Tokyo prefecture households are single person, compared to just 32 percent at the national level, and 36 percent in Osaka prefecture, which has the second highest percentage, according to National Institute of Population and Social Security Research data. Moreover, Tokyo prefecture’s average household size, at 2.03 in 2010, was the lowest, by far in the nation, and well below the national average of 2.42. Like many core areas in the largest metropolitan areas around the world, Tokyo prefecture, less than the normal proportion of children is to be found.

    The government has established a goal of increasing the fertility rate from the present 1.4 (children per woman of child-bearing age) to 1.80 by 2030 and 2.07 by 2040. This would mean a population of 102 million in 2060, compared to the 87 million that current trends suggest. This would also eventually stabilize at around 90 million, more than double the presently projected figure of 43 million.

    Proposed government strategies have involved an array from expanding the use of paternity leave, making it easier for women to retain their jobs after childbirth, supporting better job security for younger people and extending to “support for matchmaking efforts by municipalities and local chambers of commerce.”

    More recently, the government has even hinted at encouraging immigration, which is a radical proposal for a nation that has generally not been welcoming of a large influx of foreigners: “In February 2014, the Cabinet Office revealed that Japan will likely only be able to maintain a population of more than 100 million if it accepts 200,000 immigrants annually from 2015 and the total fertility rate recovers to 2.07 by 2030.”

    There is much riding on Japan’s effort to halt or at least slow the decline of its  population. Other  nations, especially across East Asia and Europe, face similar difficulties, so Japan’s success or failure (and the latter seems more likely) could materially impact policies elsewhere in the decades to come.

    Note 1: Tokyo prefecture is officially called the Tokyo metropolis, which has led many, including some researchers to imagine it to be the metropolitan area. It is simply a jurisdiction within a metropolitan area more than three times as large.

    Note 2: The city of Sapporo is used, because Hokkaido prefecture is far too large to be a metropolitan area (labor market).

    Wendell Cox is principal of Demographia, an international pubilc policy and demographics firm. He is a Senior Fellow of the Center for Opportunity Urbanism (US), Senior Fellow for Housing Affordability and Municipal Policy for the Frontier Centre for Public Policy (Canada), and a member of the Board of Advisors of the Center for Demographics and Policy at Chapman University (California). He is co-author of the “Demographia International Housing Affordability Survey” and author of “Demographia World Urban Areas” and “War on the Dream: How Anti-Sprawl Policy Threatens the Quality of Life.” He was appointed to three terms on the Los Angeles County Transportation Commission, where he served with the leading city and county leadership as the only non-elected member. He served as a visiting professor at the Conservatoire National des Arts et Metiers, a national university in Paris.

    Photo: Sapporo (by author)

  • What Happens When Walmart Dumps You

    The first knock on Walmart was that it gutted the mom-and-pop businesses of small-town America. So what happens to those towns when Walmart decides to leave?

    What is the future of American retail? The keys might be found not only in the highly contested affluent urban areas but also in the countryside, which is often looked down upon and ignored in discussion of retail trends.

    Yet these small towns, as well as middle- and working-class suburbs, have produced many of the dominant trends in American retail, from discount chains to super-stores. So, too, could these communities create a new trend, as some of the former innovators, such as Walmart, have begun to close stores, leaving some towns and villages bereft of convenient, affordable retail.

    This year the world’s largest retail chain announced it was closing 154 stores, most of them “express” centers and other smaller stores that serve primarily small-town and urban markets, such as Oakland, California. The effect has been worst in poorer towns, notably in the Southeast and Appalachia, where there is little alternative retail in place.

    Walmart’s move, driven by flagging sales and profits, represents a shift away from the very working-class and small-town customers who drove its rise. It also reflects a growing disinterest among retailers in serving the nation’s beleaguered middle and working classes. One in six Walmart customers, notes one University of Michigan study, received food stamps in 2013, with an estimated average household income of $40,000 or less.

    In contrast, online shoppers, now a primary focus for Walmart, tend to be more affluent, with 55 percent of e-commerce shoppers living in households with incomes greater than $75,000. As Walmart and many other traditional “brick and mortar” stores have struggled with declining sales, online merchants have enjoyed an average growth of more than 11 percent annually since 2011. In this game, Walmart is clearly playing catch up.

    The other big Walmart bet seems to be superstores, which compete directly with ascendant retailers such as Costco. Yet these moves are crushing for smaller towns, who are generally too small to accommodate large centers. Say what you will about Walmart—historically low wages, mediocre selection, less than attractive stores—the Arkansas-based juggernaut brought affordable products from around the world to thousands of small communities and suburbs. Before then, smaller communities often were forced to either travel great distances to more urban locations or shop at small, often overpriced local stores.

    Back to the Futurem—and the Past?

    Now once again small towns are threatened with becoming desiccated islands cut off from the high-precision magnificence of American retail. In some cases, they might even become “food deserts,” cut off even from reasonably priced grocery items. This includes not only small towns but some hard-luck suburbs near major cities.

    No surprise then that some communities now resent Walmart for having essentially invaded Main Street, laid it to waste, and then abandoning it. Some places where Walmart have come in, such as Whitewright, Texas, a town of 1,600 in the northern reaches of the state, saw the retailer come in just last year, drive out of business some long-standing local stores, notably the longtime local grocery, and now, as part of its strategic change, leaving the town with little in the way of retail options.

    Tales of “the Walmart effect” on small towns, of course, are legion. In exchange for access to more affordable goods, communities sacrificed much that was unique—the local haberdasher, the mom-and-pop mini-department stores, the one-of-a-kind hamburger joint. In the 40 years after the first Walmart opened in Rogers, Arkansas, in 1962, the number of specialty retailers declined by 55 percent nationwide. In the same time period, the number of retail chain store locations , including Walmart, nearly doubled. Research conducted at Iowa State University in the ’90s found that, after a Walmart opened in a town, sales at specialty stores—sporting goods, jewelry, and gift shops—dropped by 17 percent within 10 years.

    Yet, fortunately, this may not prove to be the disaster that many predict. The new realities of retail, notably the inexorable shift toward online retail, suggests that rural communities and small towns are not as cut off as one might have expected. The ability to access Amazon in a small, remote Central Valley town in California is not much different from accessing Amazon in Los Angeles. For anyone even marginally computer literate, the retail world is more accessible than ever, but this time through a finger click than a stroll down the aisle.

    The Proliferation of Channels

    None of this suggests that the retreat of big boxes from smaller towns and some urban areas will be painless. Yet those who see this trend as the harbinger of the end of malls or Main Streets may be in for a surprise. Rather than die off, bricks-and-mortar shopping will change, adding new elements and moving from ever greater uniformity to more variety and differentiation, which are critical to independent business’s survival. Much of this change will take place in small towns, but also in suburban areas, which have long been the happy hunting ground of big boxes.

    Why not in the big cities? One of the chief ironies of our times is that chains and their attendant sameness now define much of our most sophisticated urban core—Starbucks on every corner, global brands and restaurants serving the same trendy cuisine. The recovery of large cities, suggests New York researcher Sharon Zukin, has also made them more alike by “bringing in the same development ideas—and the same conspicuous textual allusions and iconic corporate logos inevitably affixed to downtown architectural trophies—to cities across the globe.” Efforts to make the city “safer and less strange to outsiders’ eyes”—tourists, expatriates, media producers, and affluent consumers—are making one global city barely indistinguishable from another.

    At the same time suburbs and even smaller towns are becoming more diverse, and one of the chief causes of this diversity is the spread of millennials, with their own specific needs, into the peripheral areas surrounding core cities. This movement, once dismissed as inconceivable by some urbanists, is becoming more evident as census data show. And with more millennials entering their family-forming years, suggests economist Jed Kolko, this trend to suburbs and possibly smaller towns will only accelerate.

    The other great game-changer has been the rapid movement of ethnic minorities, particularly immigrants and their descendants, to suburbia. Roughly 60 percent of Hispanics and Asians already live in suburbs; more than 40 percent of non-citizen immigrants now move directly to suburbs. Between 2000 and 2012, the Asian population in suburban areas of the nation’s 52 biggest metro areas grew 66.2 percent, while in the core cities the Asian population expanded by 34.9 percent. Of the top 20 cities with an Asian population of more than 50,000, all but two are suburbs.

    As ethnics and millennials gather in suburbs and even small towns, we are starting to see the emergence of new retail forms in suburban areas. Orange County, California, for example, has long been seen as an area dominated by chains, and the largely suburban county is indeed sprinkled with scores of shopping centers, some of them massive, ranging from more working-class shopping centers in such cities as Orange or Santa Ana to more elite retail centers such as South Coast Plaza and Newport’s Fashion Island.

    Yet at the same time, the area is seeing the growth of new, unique retail districts that appeal to millennials, ethnics, and their descendants. Anaheim, for example, heretofore known for Disneyesque blandness, now features a thriving Packing District, a converted fruit-packaging structure now filled with numerous vendors, most of them local products such as confectionary, ethnic food and locally brewed beer. Several other projects, many in former office parks, have opened in places like Costa Mesa, drawing large numbers of suburbanites to unique agglomerations of smaller stores.

    Ethnic change is also transforming the retail environment in both suburbs and smaller towns. Throughout Southern California, Chinese, Korean, Vietnamese, and Mexican markets now proliferate. New developments in places like Irvine—now roughly 40 percent Asian—are filled with ethnic restaurants, shops, and boutiques. Similar trends can be seen in the emerging immigrant hubs, notably in Dallas-Fort Worth and Houston, but also in parts of New Jersey, Westchester, Northern Virginia, suburban Chicago, and in Seattle suburbs like Bellevue and Federal Way. Even the main street in Grand Island, Nebraska, home to meatpacking plants, is lined with, of all things, Honduran, Salvadoran, Mexican, and Haitian restaurants.

    At the same time, numerous suburban communities, particularly those with old downtowns dating from their agricultural pasts, have revived their own Main Streets. These areas may have a Walmart or Target nearby, or even adjacent, but now they also sport shopping, restaurant, and other cultural options, as well as an opportunity for promenading, once an important small-town activity. The list of communities doing this extends from places in Southern California—such as the old towns of Orange, Fullerton, and Laguna Beach—to older eastern towns like Montclair, New Jersey; Rockville Centre on Long Island; Naperville outside Chicago; as well as Carmel, Indiana. We may not be returning to Bedford Falls before the onslaughts of banker Henry Potter in It’s a Wonderful Life (1946), but smaller towns and suburban shopping area may prove far better able to adjust to the digital age than many suspect.

    Retail’s Increasingly Diverse Future

    Despite the erosion from online sales, the country’s retail structure is not about to go away. Even though overall department stores are doing poorly, as are some malls, many are also doing well, particularly in ethnic areas and more affluent suburbs. The importance of brick-and-mortar retail is still compelling enough that even Amazon may soon build its own physical bookstores; several other online sites have already done so.

    Of course, not all communities or Main Streets will thrive as the Walmarts and other large chains begin to cut back. There will indeed be many communities that continue to depopulate as younger people move away, and there is little hope that large retailers will come back to such places as markets dwindle and as more shoppers order online.

    Yet not all small towns, much less suburbs, face such a difficult future. Many smaller communities, particularly in attractive parts of the country, are beginning to see a wave of migration from aging boomers, who arrive with both significant cash and also often well-developed consumer tastes. Far more seniors, for example, retire to rural or semi-rural communities (PDF) than to urban districts. In certain areas—for example, Rocky Mountains towns, parts of inland California, and the hill country of Texas—may find their retail base growing, even if this means very different kinds of stores and services.

    Some small towns—and suburbs even more so—will be transformed by immigrants and millennials, who may want to set up their own unique shops along the very Main Streets once targeted by firms like Walmart. In wealthier communities, this may mean more boutiques and high-end restaurants. But among less affluent areas, other institutions, such as cooperatives—300 already nationwide and another 250 on the way, as well as farmers markets—could provide some of the products that many once found at Walmart.

    These changes may prove far more positive in the long run than many anticipate. A future with a slightly lower Walmart or other big-box footprint poses not just a challenge to communities once seen as unable to resist mass retailing but also a once in a lifetime opportunity. As the retail world become more digitally focused, and less big-box-dominated, there is a golden opportunity to restore the geographic and local diversity that has seemed doomed for nearly a half-century, but now may enjoy a new burst of life.

    This piece originally appeared in The Daily Beast.

    Joel Kotkin is executive editor of NewGeography.com. He is the Roger Hobbs Distinguished Fellow in Urban Studies at Chapman University and executive director of the Houston-based Center for Opportunity Urbanism. His newest book, The Human City: Urbanism for the rest of us, will be published in April by Agate. He is also author of The New Class ConflictThe City: A Global History, and The Next Hundred Million: America in 2050. He lives in Orange County, CA.

    Wal-Mart photo by Mike Kalasnik from Fort Mill, USA [CC BY-SA 2.0], via Wikimedia Commons

  • Suburban Sustainablity

    There’s a philosophical debate about what is “sustainable.” The two dominant camps tend to advocate on behalf of either the hyper efficient dense city or bucolic rural self sufficiency. Personally, I’m not a fan of either.


    The more finely tuned and efficient any system is the more vulnerable it is to disruption. There’s also an inevitable concentration of authority in large systems that doesn’t appeal to me.

    Screen Shot 2015-06-07 at 2.31.03 AM

    The picturesque farm out in the country has a romantic allure, but the reality is mostly isolation, lack of economic opportunity, and a stifling culture.

    Almost all of the built environment in North America is actually suburban which is neither fish nor fowl in terms of the urban/rural divide. And that isn’t going to change anytime soon.

    Screen Shot 2016-02-16 at 9.20.34 PM

    At the moment suburbs have none of the efficiencies of the urban core and none of the productive capacity of the countryside. Suburban residents are just as dependent on large centralized systems as people living downtown. Where does suburban food come from? Energy? Water? Where does suburban trash go? Sewerage? Who owns everything? (If you have a mortgage… the bank, not you.) A small family farm in the country can manage all these things right at home on a tight budget. But the average tract house is no different from a high rise apartment.

    Screen Shot 2016-02-17 at 1.12.42 PM

    Screen Shot 2016-01-30 at 10.24.54 PM

    That private vehicle that sits in the driveway appears to be a source of personal freedom unlike the city bus or subway. But the car is invisibly tethered to gas stations, pipelines, refineries, and ultimately to the oil fields of North Dakota, Venezuela, and Nigeria by way of massive corporations and no small amount of Big Government. Wall Street also finances these cars as well, so add that to the mix of dependencies. Suburbanites believethey’re more independent than city people. They aren’t.

    unnamed

    Screen Shot 2016-01-30 at 4.56.01 PM

    Screen Shot 2016-01-30 at 7.17.32 PM

    Screen Shot 2016-01-30 at 7.10.47 PM

    Screen Shot 2016-01-30 at 7.13.20 PM

    Segovia 054 (800x600)

    Screen Shot 2016-01-30 at 7.08.44 PM

    Historically this tension between efficient urbanism and rural productivity was resolved by building compact medium density towns that were immediately surrounded by farmland. Economic opportunity, high culture, and great efficiencies were baked in to every level of the built environment. Take a fifteen minute walk from the center of town and you’ll find water, grain, grazing livestock, orchards, and all other essentials for supporting the population. A two thousand year old settlement like this one in Spain demonstrates pretty clearly that this is a sustainable model. But how does it relate to American suburbs?

    Screen Shot 2016-01-30 at 5.29.30 PM

    Screen Shot 2016-01-30 at 5.29.11 PM

    Screen Shot 2016-01-30 at 10.03.43 PM

    Screen Shot 2016-01-30 at 10.04.38 PM

    Screen Shot 2016-01-30 at 10.04.57 PM

    Screen Shot 2016-02-18 at 12.40.44 AM

    Screen Shot 2016-02-01 at 2.27.06 AM

    Screen Shot 2016-01-30 at 10.24.23 PM

    The typical suburban home is surrounded by a modest patch of garden. Instead of growing a lawn (the largest single crop in North America) the land could be producing fresh food. Ornamental shrubs and specimen trees could just as easily be fruit bearing. No need to truck in refrigerated lettuce from 1,500 miles away. The supply chain is effectively reduced to a matter of feet. There’s no need for battery hens from a distant factory farm. This transforms a consumptive landscape into a productive property. No one is suggesting this is “self sufficient”. But it’s a huge step up from having a kitchen full of Lean Cuisine, Fruit Loops, and Go-Gurt from the supermarket.

    Screen Shot 2016-01-30 at 10.23.22 PM

    Screen Shot 2016-01-30 at 10.21.38 PM

    Screen Shot 2016-01-30 at 10.23.06 PM

    In addition to home gardens suburbia is full of places that can be transformed into community gardens. Every church, school, and vacant parking lot is a potential veggie patch or orchard.

    Screen Shot 2016-02-18 at 12.23.05 AM

    Screen Shot 2016-02-17 at 1.13.15 PM

    This solar water heater is the biggest bang for the green buck. A couple of tanks, some black boxes covered in glass, a little pump… and you’ve got free hot water for decades. The cheapest and greenest energy is always the power you don’t need to use in the first place.

    Screen Shot 2016-02-18 at 12.17.53 AM

    Screen Shot 2016-02-17 at 1.13.26 PM

    A modest number of photovoltaic panels can often provide nearly all the electricity for a suburban home, particularly if the house was first fitted with high efficiency lights and appliances. Combine this with loads of insulation, solar hot water, and a food garden and a suburban home begins to resemble a small family homestead in the country.

    Screen Shot 2016-01-30 at 10.58.30 PM

    Screen Shot 2016-01-30 at 10.56.36 PM

    Screen Shot 2016-01-30 at 2.14.11 PM

    Screen Shot 2016-01-30 at 2.14.28 PM

    Screen Shot 2016-01-30 at 2.14.46 PM

    Screen Shot 2016-01-31 at 2.44.44 AM

    Screen Shot 2015-09-09 at 11.58.24 PM

    The weakest aspect of suburbia has always been the impoverishment of the public realm. Suburbs are first and foremost about private space. In order to become more vibrant parts of the suburbs need to be activated with shared community spaces. These strip mall parking lot cafes may not resemble Paris, but they do the job in a straightforward cost effective manner. The food is good. The company is pleasant. Commerce and culture can start to take baby steps. If many more such places are allowed to gradually evolve and connect they might eventually turn in to something more refined and dynamic.

    Screen Shot 2016-02-01 at 2.52.37 AM

    Screen Shot 2016-02-01 at 2.53.06 AM

    There will always be people who prefer to drive no matter what. And the suburbs do provide serious challenges when it comes to alternative forms of mobility. Public transit rarely works well in dispersed sprawling environments. Honestly, I don’t think it’s worth even trying to serve most suburban neighborhoods with transit. But knitting together the viable parts of suburbia with bike infrastructure is so incredibly cheap that it’s worth doing in places where people value the option. Most folks may still drive, but they may not need to do it nearly as often if walking and biking are at least reasonable options.

    Screen Shot 2016-02-17 at 1.10.51 PM

    While I’m at it, I’d like to describe what isn’t sustainable. Massive solar arrays on suburban rooftops appear to be a step in the right direction. But look closer. This homeowner could have installed far fewer panels and spent the remaining money on added insulation and energy efficiency instead. But being frugal and productive was never really the goal here.

    Screen Shot 2016-02-17 at 1.12.17 PM

    Screen Shot 2016-02-17 at 1.11.46 PM

    Next to the sterile lawn are all sorts of toys that run on liquid fuels. I’m not saying people shouldn’t have playthings. I’m saying these items are expensive and disposable and were almost certainly bought on credit. The extended cab pick up truck has never seen a sheet of plywood, an eight foot length of pipe, or a bale of hay. It’s sport. Not utility. The speed boat isn’t exactly built for fishing. This is standard suburban debt and consumption. It’s fragile and unlikely to hold up well over the long haul.

    John Sanphillippo lives in San Francisco and blogs about urbanism, adaptation, and resilience at granolashotgun.com. He’s a member of the Congress for New Urbanism, films videos for faircompanies.com, and is a regular contributor to Strongtowns.org. He earns his living by buying, renovating, and renting undervalued properties in places that have good long term prospects. He is a graduate of Rutgers University.

  • What Price Urban Density?

    We regularly hear the argument that living in a compact city is more affordable than living in one that is more spread out. But what does the data actually show about the cost of housing in compact cities, and the cost of transport in these dense places? The relationship between those two expenses and the compactness of a city could tell us much about which kinds of places are most affordable, since those two costs together dominate household budgets.

    Advocates of denser urban environments have developed an index to measure the effects of a range of aspects of city living, such as vehicle miles traveled, traffic safety, congestion, the cost of housing, the cost of transportation, and health outcomes, among many other issues. The index takes into account several metrics, such as density, street accessibility and the mix of land uses.

    The index was conceived with the intent to study presumed negatives of city growth, and to make such growth “smarter.” Since the impulse to create it was advocacy-driven, it may lack objectivity. Notwithstanding this potential bias, and lacking alternative data, we used it as the default measure for our analyses, and consider our work a chance to test the validity and reliability of the index.

    First, we looked at housing costs. Casual and investigative observers seem to agree that housing costs do rise with city compactness. A recent report on the effects of compactness determined that housing costs increased by 1.1% for every 10-point increase in the compactness index. Other researchers have come to similar conclusions, using only population density as an indicator.

    Chart 1, which plots data from the 2015 Consumer Expenditure Survey, confirms this general agreement on the correlation between compactness and housing costs. But questions arise from the sharp differences between pairs of cities.

    For example, Boston and Atlanta residents use the same percentage of their budgets — 33% — for housing. Yet Boston’s compactness index is at least 90 points higher: 37.4 for Atlanta, vs 126.9 for Boston. According to Smart Growth theory, that difference should bring housing expenditures for Bostonians to 43%, about the same level that is experienced by New Yorkers.

    In another comparison, Boston and Miami differ little in compactness: 126.9 vs 112. Yet these two cities differ substantially in the percentage of household budget residents devote to housing costs – 33% vs 39%.

    Clearly, in both these examples and in the chart above, compactness is but one of many factors and, perhaps, not the dominant one in the relationship between a city’s housing costs and its compactness. Others need to be identified, quantified and incorporated. The trend, however, is indisputable: Greater compactness increases housing costs.

    Do transportation costs follow the same trend?

    According to theory, cities that are more compact offer more transport options, particularly public transit systems, some of which, like subways, outperform all other modes for time — especially work commute time — and provide travel options that are more affordable. Walking and biking may also be alternate means of mobility that help hold down household transport expenditures in compact cities. The association between density and high non-auto share of trips has already been demonstrated.

    Consumer Expenditure Survey data from 2015, when plotted, confirms this assumption. Chart 2 shows a decreasing proportion of the household budget being used for transportation as a city’s compactness index increases.

    However, as with housing costs, a close look at the differences between paired cities raises questions. Atlanta and Philadelphia share the same percentage of household budget expenditure on transport, 16%. Yet they differ by 70 points on the compactness index, 37.4 vs 109.05. Meanwhile, Washington and Seattle register an almost identical compactness index — 107.6 vs 104.6 — but the latter, contradicting theory, has transportation costs that are 3 percentage points lower, even though it lacks a subway. Both these cases demonstrate that the current model for measuring the impact of compactness needs fundamental refinements to improve its predictive value.

    So far, the data show two countervailing trends: Housing costs rise with compactness, while transportation costs fall. This finding leaves the question of whether more compact cities are more affordable to live in, at least with respect to these two expenditures that consume about half of a household’s budget.

    Using the same data from the CES for the 18 cities, we plotted the results of combining the two expenditures, as a percentage of the household budget.

    Chart 3 shows an inverse, albeit weak, association of compactness with combined household expenditures of housing and transportation. It clearly does not indicate that more compact cities are more affordable for the average household. Upon a closer look the chart reveals some instructive surprises.

    First, Atlanta appears among a group of five most affordable cities, even though it has by far the lowest compactness index (40.9) of all eighteen cities in the CES survey. According to traded wisdom, its transport costs, being almost entirely based on automobile travel, should overwhelm its housing expenditures.

    Contradicting theory, Atlanta posts next to lowest average housing cost ($16,316/year), and also one but lowest transportation costs ($8,086/year). When considering that average income in Atlanta is on a par with that in Los Angeles ($69,821 vs $69,118), and that its compactness index is 80 points lower than LA’s, its comparative affordability challenges current thinking about compactness and its effects.

    Second, four cities hover around the same point of the index (#110), yet they cover almost the entire gamut of budget percentage expenditure (49% to 54%) for combined housing-plus-transport costs. The same is true for five cities aligning around the #130 of the index.

    It’s apparent that current theory falls short of adequately explaining field data. A city planner would find little comfort in knowing that a fourfold range of compactness can be equated with the same level of affordability, or that the same level of compactness can be associated with a wide range of combined transportation and housing expenditures. If anything, these results suggest that, because average housing expenses are double those of transportation, a yet-to-be-determined density ceiling might be an effective means of increasing a city’s affordability.

    The CES data is only a snapshot in time that may reflect transient conditions, such as gasoline prices, local inflated real estate markets, congestion levels that affect gas consumption, effectiveness and reach of public transit and so on. Variability in these factors will always affect the average transport and housing expenditures. A predictive model should be robust enough to handle such fluctuations, if it is to have practical value.

    Yes, greater compactness is associated with higher housing costs and lower transportation costs. But, contrary to unsubstantiated assertions, when these are combined, the result is less — not more — overall affordability.

    Fanis Grammenos heads Urban Pattern Associates (UPA), a planning consultancy. UPA researches and promotes sustainable planning practices including the implementation of the Fused Grid, a new urban network model. He is a regular columnist for the Canadian Home Builder magazine, and author of Remaking the City Street Grid: A model for urban and suburban development. Reach him at fanis.grammenos at gmail.com.

    Flickr photo by Tim Bartel of a San Francisco neighborhood

  • Your City Is Not the Next Silicon Valley

    “No man needs sympathy because he has to work, because he has a burden to carry,” began Theodore Roosevelt, the U.S. president from 1901 to 1910. “Far and away the best prize that life offers is the chance to work hard at work worth doing.”

    No doubt, during Roosevelt’s time there was much work to do. In 1910, for example, nearly 40% of the country was still employed in agriculture. The percent of workers in industry—or manufacturing, construction, and mining—was at 30% and rising, driven by the revving of the Industrial Revolution.

    So, 70% of the country’s workforce made a living through labor. They made food to eat and the steel, railroads, cars, bridges, and buildings that modernized America.

    Cleveland was a prime benefactor. The manufacturing sector alone employed nearly 307,000 Clevelanders by 1967.

    But things changed. Labor-intensive industries matured, which ultimately means taking less people to produce more output. The percentage of the American labor force employed in agriculture stands at 2%, down from nearly 70% in 1840. This doesn’t mean we eat less food, but that technological advances have made the food sector ultra-efficient.

    Industry has been experiencing the same forces. Twenty percent of Americans are employed in manufacturing, mining, and construction. In the manufacturing sector, the national percentage is 8%, with Cleveland at 12%—down from 21% in 1990. Again, this doesn’t mean we don’t manufacture things— manufacturing output is at an all-time high nationally—it’s just that we need fewer people to produce more goods.

    Okay, so where do people work? The simple answer is services, or those sectors that make up the economy outside of agriculture and industry. Think legal, marketing, business, technology, education, healthcare, and hospitality. For instance, 20% of the nation worked in services in 1840. By 1960 that number was over 50%, before reaching nearly 80% by 2010.

    These numbers illustrate a shift in the U.S. economy over time, or from goods producing to service providing. To a large extent, these services are based on the production of ideas.

    Writing in the Harvard Business Review, the University of Toronto’s Roger Martin dubs this change the “rise of the talent economy”. Martin notes that in the 1960s, 72% of the top 50 U.S. companies owed their wealth to “the control and exploitation of natural resources.” Today, however, only 10% of the nation’s top companies are industry-based. Instead, over 50% of America’s companies are talent-based, such as Google, Apple, and Microsoft.

    “Over the past 50 years the U.S. economy has shifted decisively from financing the exploitation of natural resources to making the most of human talent,” writes Martin.

    Enter Silicon Valley. As Pittsburgh was to steel and Detroit to cars, Silicon Valley has been to the talent economy, particularly technology. It was there that the top minds clustered to design new-age circuits and microprocessors in the 1950s and 60s. It was also there that the best software engineers went to birth the internet, search engine, and social media in the 1990s and 2000s.

    On the backs of this talent came the wealth, not only the venture capital that has continually acted to “water” the region’s innovation, but also the rising wages of the workers. In fact, in Santa Clara, C.A., the county seat of Silicon Valley, the average salaried employee makes over $103,000 annually, approximately double that of Cuyahoga County employees and the U.S. workforce as a whole.

    The successes of Silicon Valley have led many regions to devise their own strategy to be a technology hub. Simply, there existed an “old” economy, so how does a region transition into the “new” economy, primarily one embodied by the high-end services and start-up culture of Northern California?

    Often, the tactics are rudimentary, like branding a part of your region as “Silicon X” so as to attract the components of a tech cluster. For instance, Philadelphia has “Philicon Valley” and New York has “Silicon Alley”, whereas New Orleans has “Silicon Bayou” and Portland has “Silicon Forest”. There’s “Silicon Swamp” in Gainesville, “Silicon Slopes” in Utah, “Silicon Harbor” in Charleston, and a variant of “Silicon Prairie” in Dallas, Chicago, Omaha, and Jackson Hole, Wyoming.

    Then, once you brand a part of your region “Silicon X”, the next step is to get the story out. A recent piece in Charleston Magazine entitled “The Rise of Silicon Harbor” is illustrative on this front. The author opens the piece by explaining that in Charleston there are “three local tech companies, all within three miles of each other”. The author then quotes a media outlet that states Charleston’s “Silicon Harbor is on its way to becoming the East Coast counterpart to California’s Silicon Valley”.

    This idea that your region can become the “next Silicon Valley”, well, its clickbait for online journalism—if only because folks wantto believe their hometown is the place of the future.

    For example, a recent Huffington Post piece hints “You Might Be Living in the Next Silicon Valley”. “Could Detroit become the next Silicon Valley?” echoes the industry magazine CIO. Meanwhile, a NewYorker piece is titled “How Utah Became the Next Silicon Valley”, while an Oklahoma story is headlined “Vision proposal aims at Tulsa being the next Silicon Valley”.

    Still, if everywhere is the next Silicon Valley, then nowhere is the next Silicon Valley. That’s the reality, and it’s important for cities to grasp it so they can plan their economic futures properly.

    “When it comes to tech, nobody can simply create the next Silicon Valley,” explains Aaron Renn, a Senior Fellow at the Manhattan Institute.

    “Just because a place has a number of startups doesn’t mean it’s destined to be a Silicon Valley,” Renn continued. “By all means celebrate a growing tech industry, but don’t get carried away.”

    But the bigger issue for regions looking for their economic future in Silicon Valley’s past is whether or not that’s even a sound strategy in the first place. Specifically, the tech economy is also a maturing, prone to the same job contractions, offshoring, and wage declines that hallmarked deindustrialization.

    According to data compiled by the Institute for Strategy and Competitiveness, four out of the top five tech clusters in the United States lost jobs from 1998 to 2013. San Jose, CA, the metropolitan area comprising Silicon Valley, led the way in contraction, going from nearly 160,000 tech jobs in 1998 to fewer than 74,000 in 2013—a decline of 54%. Telling, automotive employment in Detroit declined by less over the same time period, at 32%.

    These figures are in line with a new study out of Oxford University that found that while technology start- ups often create a lot of wealth, they are not good at creating many jobs. The study found that only 0.5% of the American workforce in 2010 were employed in industries that did not exist in 2000.

    “What I think the Oxford study is saying is that you’re not getting the kind of job growth from these kind of high-tech, high-growth, high-profitability startups that you had in the past,” said economist Jim Pethokoukis in the industry magazine Re/code.

    Why? A primary culprit is that tech jobs are becoming automated, just like farm and factory jobs before it. Specifically, tech companies over the last 15 years don’t need to hire as many people as they did in the 90’s because the software — loosely described as machines — is doing the work.

    For Jim Russell, the economic development blogger at Pacific Standard, the aging of the tech industry— Russell uses the term “tech convergence”—has echoes in the decline of industry. Russell discusses his life growing up on the run from macroeconomics, going from Erie, PA, to Schenectady, NY, to Vermont as his father, a General Electric engineer, tried to keep ahead of the wave of contractions.

    “He had an uncanny knack for moving our family just before the layoffs hit,” said Russell. “We were always racing to stay ahead of the economic restructuring.”

    Russell, whose wife is in tech sales, is experiencing the same game of cat and mouse today.

    “The tech industry enjoyed divergence until the end of the 1990s,” he’d note, explaining there were “fatter” times in emerging tech hubs like Boulder—where they’d lived.

    “But then the bubble burst,” Russell explained, “resulting in massive layoffs. Good friends were out of work.”

    Today, his family lives in Northern Virginia. That’s because it makes no economic sense for firms to house tech sales in Silicon Valley. This is partly due to the exorbitant cost of living in Northern California. But it is also due to the emergence of cloud computing, which has pushed tech everywhere— meaning tech hubs are increasingly nowhere.

    This maturation of tech has Russell wondering “whether Silicon Valley is the next Detroit”.

    Does this mean technology is no longer integral in regional economic growth? No. It just means the tech industry is changing. Detailing this change can both sharpen, if not make more realistic, a regional innovation strategy.

    According to the Manhattan Institute’s Aaron Renn, the issues boils down to this: “Do you have proprietary industry to marry to tech?”

    What Renn is getting at is the fact that tech in itself is a tool. It is by and large circuitry that allows access to information. But information is not knowledge. To give an example, information is the medical textbook, while knowledge is the application of information to become a heart surgeon. In other words, in what fields of applied knowledge can technology be tied to so as to further a given regional industry?

    Most recently, tech has been tied to the entertainment or leisure industry. “Silicon Valley started with tech for the sake of tech: making computers, search engines, and software,” says Cleveland technologist Eamon Johnson. “Now it’s 20-something dudes making solutions to replace what their mom did for them at home…laundry, food, rides around town, and recommendations on where to eat.”

    According to Johnson, the coming evolution of innovation is to use the next generation of computing power to go beyond tech’s capacity to distract or consume.

    “But techies need industry experts to give them problems so solutions can be worked on,” he says.

    This exactly what is happening in Cleveland with healthcare. Cleveland observes, treats, and innovates within the field human health like few other regions worldwide. As a result, the field of medical technology, or medtech, is gaining some traction in the region.

    This is evidenced by IBM’s recent acquisition of the Cleveland Clinic-spinoff Explorys, which is a “big data” health analytics firm. The company, based in Cleveland’s University Circle, is expanding its Cleveland office, perfecting its processes of how the region’s elite health “know-how” can be further mined through technology—thus creating more knowledge, and then more health innovation.

    These kind of developments are important. Medtech is still a frontier industry, and it fits in well with Cleveland’s area of specialization. So there’s plenty of room for a first mover advantage if the region can gets its medtech playbook right.

    Now, is medtech cool? Well that depends on your definition of “cool”. "You can work for a cool tech company with a texting app," said Explorys’ Charlie Lougheed to the Plain Dealer recently. "Or you can work for a company that improves health for millions of people."

    Returning to Teddy Roosevelt: that is a lot of work, and a lot of work worth doing.

    Richey Piiparinen is a Senior Research Associate who leads the Center for Population Dynamics at the Levin College of Urban Affairs at Cleveland State University. His work focuses on regional economic development and urban revitalization.

  • Why Jersey City is the New Brooklyn

    For hundreds of years, New York City has been viewed by Americans and foreigners alike as the default capital of the United States. Though not the official political capital city, New York, New York has been commonly viewed, and certainly among its own residents, as the de facto center for American culture, music, sports, food, and art.

    Although far more people migrate out of the New York area than come, it remains a primary destination for those who—in the words of Frank Sinatra—want to be a part of it.

    However, today being “a part of it”—particularly in Manhattan and the fashionista parts of Brooklyn—is a lot more difficult than it once was. It no longer involves just a suitcase and a dream. Those looking to move out to the Big Apple increasingly difficult, largely due to huge costs for housing.

    The chorus of complaints about skyrocketing real estate prices has become an ever growing occurrence in the area, as most New York City residents and newcomers alike struggle to make ends meet. For well over a decade Manhattan has been so popular, and so expensive, that the real estate boom has spread to other boroughs—in particular, the western reaches of Brooklyn, only a short subway ride from Manhattan.

    Once a significant and yet often ignored part of New York City, Brooklyn has for decades held its own identity within the city, usually in variance with more self-conscious Manhattan. However, in this most recent decade, we have seen a shift in that identity. Increasing gentrification and a multitude of new residents have transformed the area and created an unfortunate spike in house prices in their wake. An area that was once populated by longtime family residents and iconic brownstones, is now seeing giant penthouses selling for upwards of $4 million. In fact, as early as 2012, we were already seeing Brooklyn being labeled as the second most expensive place to live in the US.

    Brooklyn neighborhoods like Park Slope, DUMBO, Downtown and Williamsburg have seen an influx of new residents along with the resulting spikes in real estate prices. Even the recent trend of supertall residential buildings springing up throughout Manhattan has begun to infest Brooklyn, with developers planning new towers much taller than anything the borough has seen in the past. While longtime Brooklyn residents with rent-controlled and rent-stabilized properties, as well as current Brooklyn homeowners, have little to worry about, all of this is making for an increasingly prohibitive market for anyone hoping to move to the borough.

    The result of all of this has been a natural shift in the popularity of Brooklyn as a viable destination for new, young residents. So, while—not too long ago—Brooklyn was being touted as the new Manhattan, we are now seeing a rise in other cities vying to claim the coveted title of becoming the “new Brooklyn.” Of course, both of these New York boroughs will still remain popular, but generally younger people, at least those without jobs at Goldman Sachs or trust funds, simply cannot afford the new and skyrocketing prices required to make them their new home.

    Thus, with Manhattan and Brooklyn now both out of reach for many New York real estate shoppers, the much maligned state of New Jersey is suddenly becoming more appealing; and in particular, we are seeing the rise of the conveniently located municipality of Jersey City. Jersey City is located directly across the Hudson River from downtown Manhattan, and just like New York in the early 1990s the city is fast shedding its once dangerous reputation and emerging as an appealing option as a uniquely livable area.

    At one time, most residents of the area east of the Hudson River lumped Jersey City into “everything west of the Hudson.” In other words, it was dismissed out of hand immediately. However, more people are starting to learn that Jersey City is its own unique location, itself comprised of a number of distinct neighborhoods with individual charms and flavors. And most important of all, affordability.

    “Three or four years ago, when you would mention Jersey City to people who didn’t know the area, you’d get a concerned look,” Natalie Miniard, the owner of JCity Realty, told the New York Times, “now everybody wants to know more. It’s a much different conversation.”

    Generally the most desirable section of Jersey City for newcomers is downtown, thanks to its proximity to the Hudson River and concentration of trendy bars and restaurants. Popular spots here include the Jersey City location of Brooklyn’s Barcade, Skinner’s Loft, the Iron Monkey and the Roman Nose.

    And it’s convenient, too. Right in the middle of downtown Jersey City is the Grove Street PATH train station. Like every PATH station in Jersey City, Grove Street offers speedy service to several locations in Manhattan 24 hours a day, seven days a week. Unlimited monthly PATH cards are actually cheaper than monthly NYC subway Metrocards, and you can even use pay-per-ride Metrocards on the PATH. As an added bonus for residents, surrounding the Grove Street station is a pedestrian plaza which regularly hosts food fairs and street festivals.

    Of course, the gentrification train chugs on, and as with the more popular neighborhoods in Brooklyn, downtown Jersey City is already becoming so popular that many new residents are seeking even more affordable sections of the city. One such neighborhood is Journal Square, which is in close proximity to the Journal Square PATH station. Local flavor abounds in the Journal Square area, and prices in the neighborhood are still lower than downtown, despite being not too far in distance. A bit further from downtown Jersey City is the neighborhood known locally as the Heights.

    The Heights is a large section of Jersey City with plenty of lower priced options for real estate shoppers, thanks in part to being not quite as close to the PATH as Journal Square or downtown. However, the Heights is an area jam-packed with plenty of its own great shopping and local restaurants, especially along the main thoroughfare of Central Avenue. Most of the Heights is still within reasonable walking distance to the Journal Square PATH station, and walking from the Heights to the nearby city of Hoboken is also an option.

    With a variety of lively, singular neighborhoods and close proximity to Manhattan, Jersey City already boasts several parallels with the borough of Brooklyn. Though it cannot yet compete in terms of culture and “street cred,” developers are rushing to construct tens of thousands of new, affordable residential properties, hopping on the newest fashionable real estate bandwagon while it is still hot. What this means is that it is certainly the right time to move to Jersey City. Housing prices are lower across the board than in most sections of Brooklyn—and certainly anything in Manhattan—and the options for condos, rental apartments and even entire houses are multiplying by the day. And people are starting to take notice. An increasing influx of residence—according to the most recent US census data, the total number of residents increased by six percent between 2010 and 2014— revitalizing the cultural and social scene, and many more people are expected to soon follow. With all of this in mind, it would not be a surprise if in the next few years we find fewer people moving to New York City altogether, and many more looking to the exciting reborn metropolis of Jersey City.

    Cary is an Oregon native with a flair for fashion and organic gardening. She’s passionate about writing and enjoys hiking, reading, and cooking. When she isn’t writing about economics and real estate, or health and fashion, she is playing with her rescue pitbull, Mazie. 

  • America’s Most Urban States

    To the untrained eye, looking at a map of metropolitan America can lead one to the conclusion that at least half the nation’s land area is covered by urbanization. This is illustrated by Figure 1 below, which is a Census Bureau map of metropolitan areas as defined in 2013. These areas cover approximately 1.675 million square miles, which represents 47 percent of the US land area.


    Metropolitan Land: More Rural than Urban

    However, someone well informed in urban geography would quickly retort that most  metropolitan areas are more rural than  are urban and, in total,  the only 3% of the nation’s land area is in urban development. This shown by data in the 2010 census, which counts as urban all settlements with at least 2,500 population (a complete list of the 3,600 urban areas is at http://demographia.com/db-uza2010.pdf).

    The difference is between two very different definitions of the city. The physical city, called the urban area in the United States, the built-up urban area in the United Kingdom, the unité urbaine in France and population center in Canada is the area of continuous urbanization (or development). The metropolitan area is a much larger geography that includes areas from which a substantial portion of the working population is employed in a core area that is, in the United States it is central counties, an area typically far larger than what was formerly called the “central city” or the “core city.” Figure 2 is a map of urban areas, which indicates the best approximation of the extent of urbanization in the United States.

    Within metropolitan areas, the area between the principal urban area and metropolitan area boundaries is largely rural, but may also include urban areas. For example, in Los Angeles, Santa Clarita, Palmdale and Lancaster are secondary urban areas located between the principal urban area and the metropolitan boundary.

    In the Riverside-San Bernardino metropolitan area, the Needles urban area also lies between the principal urban area and the metropolitan area boundary. However, Needles is more than 200 miles away from the city halls of either Riverside or San Bernardino and it would take a commuter at least three hours to reach either place, assuming no traffic congestion. In the United States, metropolitan areas are composed of entire counties and where there are larger counties, as in Riverside-San Bernardino, the metropolitan area contains much more area than represents a reasonable commuting distance. This also makes any urban research based on metropolitan area densities nonsensical, because they are driven by rural rather than urban densities.

    Urban research needs to be performed using urban densities. That can be at the metropolitan area level or even the state level.

    Highest Urban Density in California

    It may be surprising that California, which largely defined the suburbanized urban form that developed after World War II has the highest urban population density in the nation (Figure 3). California’s urban areas have an average density of 4300 per square mile. California has the three most densely populated large urban areas in the country: Los Angeles at approximately 7000 residents per square mile, San Francisco at approximately 6300 residents per square mile and San Jose with approximately 5800 residents per square mile. Indeed, San Jose, which does not even have a pre-World War II urban core (because it had too small a population at the time) is approximately 10% denser than the urban area with the nation’s largest pre-World War II urban core, New York (5300 residents per square mile).

    Even before the radical densification policies of Senate Bill 375 were implemented, California’s high density credentials were impeccable. Among all urban areas in the nation, 21 of the densest 25 are in California, including Richgrove, an urban area of less than 3000 residents in a population density of over 10,000 per square mile. Richgrove is located in Tulare County, in the San Joaquin Valley, 10 miles east of State Highway 99, in the Delano area. Not only is Los Angeles nearly twice as dense as international densification model Portland, but San Francisco, San Jose, Sacramento, Riverside – San Bernardino and San Diego are also more dense than Portland, not to mention Fresno, Oxnard, Stockton, Los Banos, Simi Valley and Modesto and, of course Richgrove (as well as others).

    New York has the second highest state urban population density at 4200 residents per square mile. Again, perhaps surprisingly, Nevada has the third highest population urban density, though well below New York at 3300 residents per square mile. Las Vegas is the fifth highest density urban area over 1,000,00 residents, at 4500 residents per square mile Only one other state, Hawaii, has an urban population density above 3000 residents per square mile (3200). Honolulu, with fewer than 1,000,000 residents, has an urban density of 4800 per square mile.

    Rather than being dominated by the states with the urban areas perceived to be the densest, in the East and Midwest, seven are in the West, which has, like California, a reputation for urban sprawl. Only New Jersey, much of which is suburban New York or Philadelphia, as well as Illinois, home of the nation’s third largest urban area, Chicago, rank in the 10 densest states for urbanization.

    Lowest Urban Densities in New Hampshire and the South

    Eight of the 10 least dense states are in the South. Two are in the East, one of which should be no surprise, Maine, where all of the urban areas are somewhat small. (Figure 4) New Hampshire, however, may be surprising, since so much of the population is located in suburban Boston. One of the least accurate urban myths is about Boston as a dense urban area. Yes, it is dense inside Route 128 (Interstate 95), but beyond that it exhibits densities about the same as Atlanta, which is the least dense urban area in the world that has more than 2 million residents.

    There were also some surprises outside the top and bottom 10. Nebraska ranked 11th in urban density, well above its Great Plains peers. Texas ranked 13th, at 2400 per square mile, nearly equaling number 12 Maryland. Connecticut, which is in the New York commuting zone ranked 38th.

    Highest Urban Land Percentages in the Northeast Corridor

    While California has the densest urbanization, it is by no means the most urbanized in terms of its amount of urban land area. Only 5 percent of California’s land area is urban, somewhat more than the national average, but 22 states have larger urbanization percentages. Four states are bunched up near the top, with between 37 percent and nearly 40 percent of their land area under urban development, New Jersey, Rhode Island, Massachusetts and Connecticut (Table).  Each of these states is in the Northeast Corridor,  home to nearly 50 million residents, that stretches from the suburbs south of Washington, through parts of 10 states and the District of Columbia, to the Boston suburbs of New Hampshire.

    However, most states are far less urbanized. The fifth and sixth most urbanized states, Delaware and Maryland, are also in the northeast megalopolis, barely have as much urban land as the top four, at approximately 20 percent urbanized. It is another big drop to number seven Florida, at 14 percent.

    Most States Have Little Urbanization

    As would be expected, Alaska has the least urbanization, covering less than 0.1 percent of its land area. Wyoming is the second least urbanized, at 0.2 percent, closely followed by Montana (also 0.2 percent), North Dakota and South Dakota (both at 0.3 percent). The tenth least urbanized state, Utah, has only 1.1 percent of its land occupied by urbanization.

    All of this indicates that the urbanization that houses more than 250 million residents in the United States covers only a much more modest share of its land than often thought (3.0 percent ). This is even truer outside the Northeast Corridor.

    Built-Up Urban Areas in the United States
    State & DC Totals: 2010
    State/District Urban Population Urban Land Area (Square Miles) Urban Density (Square Miles) Urban Density (Square KM) Urban Density Rank Urban Popu-
    lation %
    Urban Popu-
    lation % Rank
    Urban Land/ Total Land Urban Land % Rank
    Alabama      2,821,804       2,207     1,278        494         49 59.0%           42 4.3%        23
    Alaska         468,893          260     1,803        696         36 66.0%           37 0.0%        50
    Arizona      5,740,659       2,187     2,625     1,014         10 89.8%             9 1.9%        33
    Arkansas      1,637,589       1,097     1,493        576         42 56.2%           45 2.1%        32
    California    35,373,606       8,219     4,304     1,662           1 95.0%             1 5.3%        21
    Colorado      4,332,761       1,528     2,836     1,095           7 86.2%           14 1.5%        37
    Connecticut      3,144,942       1,826     1,722        665         38 88.0%           11 37.7%          4
    Delaware         747,949          407     1,838        710         35 83.3%           17 20.8%          5
    District of Columbia         601,723            61     9,857     3,806 100.0% 100.0%
    Florida    17,139,844       7,403     2,315        894         16 91.2%             6 13.7%          7
    Georgia      7,272,151       4,797     1,516        585         41 75.1%           23 8.3%        12
    Hawaii      1,250,489          393     3,181     1,228           4 91.9%             5 6.1%        20
    Idaho      1,106,370          499     2,217        856         19 70.6%           30 0.6%        45
    Illinois    11,353,553       3,946     2,878     1,111           5 88.5%           10 7.1%        15
    Indiana      4,697,100       2,525     1,860        718         34 72.4%           29 7.0%        17
    Iowa      1,950,256          953     2,046        790         25 64.0%           39 1.7%        35
    Kansas      2,116,961          973     2,176        840         21 74.2%           25 1.2%        38
    Kentucky      2,533,343       1,411     1,796        693         37 58.4%           43 3.6%        25
    Louisiana      3,317,805       1,968     1,686        651         39 73.2%           27 4.5%        22
    Maine         513,542          360     1,428        551         44 38.7%           50 1.2%        39
    Maryland      5,034,331       2,005     2,511        970         12 87.2%           13 20.5%          6
    Massachusetts      6,021,989       2,987     2,016        778         29 92.0%             4 38.1%          3
    Michigan      7,369,957       3,623     2,034        785         27 74.6%           24 6.4%        19
    Minnesota      3,886,311       1,705     2,279        880         17 73.3%           26 2.1%        31
    Mississippi      1,464,224       1,106     1,324        511         47 49.3%           47 2.4%        30
    Missouri      4,218,371       2,054     2,053        793         24 70.4%           31 3.0%        28
    Montana         553,014          297     1,861        718         33 55.9%           46 0.2%        48
    Nebraska      1,335,686          524     2,549        984         11 73.1%           28 0.7%        43
    Nevada      2,543,797          767     3,315     1,280           3 94.2%             3 0.7%        42
    New Hampshire         793,872          644     1,233        476         50 60.3%           40 7.2%        14
    New Jersey      8,324,126       2,920     2,851     1,101           6 94.7%             2 39.4%          1
    New Mexico      1,594,361          827     1,929        745         30 77.4%           21 0.7%        44
    New York    17,028,105       4,092     4,161     1,607           2 87.9%           12 8.7%        11
    North Carolina      6,301,756       4,609     1,367        528         46 66.1%           36 9.5%        10
    North Dakota         402,872          184     2,192        846         20 59.9%           41 0.3%        47
    Ohio      8,989,694       4,420     2,034        785         28 77.9%           20 10.8%          8
    Oklahoma      2,485,029       1,307     1,902        734         31 66.2%           35 1.9%        34
    Oregon      3,104,382       1,107     2,805     1,083           8 81.0%           18 1.2%        40
    Pennsylvania      9,991,287       4,705     2,123        820         22 78.7%           19 10.5%          9
    Rhode Island         955,043          401     2,384        920         14 90.7%             7 38.3%          2
    South Carolina      3,067,809       2,382     1,288        497         48 66.3%           34 7.9%        13
    South Dakota         461,247          226     2,038        787         26 56.7%           44 0.3%        46
    Tennessee      4,213,245       2,905     1,450        560         43 66.4%           33 7.0%        16
    Texas    21,298,039       8,746     2,435        940         13 84.7%           15 3.3%        27
    Utah      2,503,595          915     2,737     1,057           9 90.6%             8 1.1%        41
    Vermont         243,385          156     1,559        602         40 38.9%           49 1.7%        36
    Virginia      6,037,094       2,665     2,265        875         18 75.5%           22 6.7%        18
    Washington      5,651,869       2,375     2,380        919         15 84.0%           16 3.6%        24
    West Virginia         902,810          640     1,410        544         45 48.7%           48 2.7%        29
    Wisconsin      3,989,638       1,879     2,123        820         23 70.2%           32 3.5%        26
    Wyoming         364,993          195     1,876        724         32 64.8%           38 0.2%        49
    United States  249,253,271   106,386     2,343        905 80.7% 3.0%
    Data source: US Census Bureau.


    Wendell Cox is principal of Demographia, an international pubilc policy and demographics firm. He is a Senior Fellow of the Center for Opportunity Urbanism (US), Senior Fellow for Housing Affordability and Municipal Policy for the Frontier Centre for Public Policy (Canada), and a member of the Board of Advisors of the Center for Demographics and Policy at Chapman University (California). He is co-author of the "Demographia International Housing Affordability Survey" and author of "Demographia World Urban Areas" and "War on the Dream: How Anti-Sprawl Policy Threatens the Quality of Life." He was appointed to three terms on the Los Angeles County Transportation Commission, where he served with the leading city and county leadership as the only non-elected member. He served as a visiting professor at the Conservatoire National des Arts et Metiers, a national university in Paris.

    Photograph: Downtown Chicago from the Air (by author)

  • California Valued for Cash, Not Candidates

    California may be the country’s most important and influential state for technology, culture and lifestyle, but has become something of a cipher in terms of providing national political leaders. Not one California politician entered the 2016 presidential race in either party and, looking over the landscape, it’s difficult to see even a potential contender emerging over the coming decade.

    We are a long way from the California dreamin’ days of Richard Nixon, Ronald Reagan and even the early Jerry Brown era. Today we approach national politics largely as spectators – and our rich residents as donors – to storms brewing in other regions.

    In contrast, New Yorkers clearly have the moxie to rise. Ted Cruz even lambasted “New York values” in his to-date failed attempt to derail Donald Trump. Just watch Trump and his new consigliere, New Jersey Gov. Chris Christie, in action, they’re quintessential New York egomaniacal tough guys.

    The Democrats also have a big New York imprint, with the front-runner, Hillary Clinton, a former New York U.S. senator and current resident. Her diminishing challenger, Bernie Sanders, is an aged Jewish boy from Brooklyn.

    And, waiting in the wings, with his billions and his ego ready to propel him, sits former New York City Mayor Michael Bloomberg. Some East Coast observers see him as a potential running mate for Clinton, which certainly would make fundraising less important.

    But it’s not just New York’s political culture that has shaped this election. The biggest non-Trump drama of the race has been the bitter conflict between two Florida politicians, the departed Jeb Bush and Marco Rubio, now the rapidly fading hope of establishmentarian Republicans. Texas, too, has expressed at least the more doctrinaire aspect of its political culture in inflicting Ted Cruz on the electorate. Even the Rust Belt has had its moment, in the quixotic, but at least fundamentally decent, campaign of John Kasich.

    Read the entire piece at The Orange County Register.

    Joel Kotkin is executive editor of NewGeography.com. He is the Roger Hobbs Distinguished Fellow in Urban Studies at Chapman University and executive director of the Houston-based Center for Opportunity Urbanism. His newest book, The Human City: Urbanism for the rest of us, will be published in April by Agate. He is also author of The New Class ConflictThe City: A Global History, and The Next Hundred Million: America in 2050. He lives in Orange County, CA.

    Photo by Steve Jurvetson from Menlo Park, USA (Hillary Clinton Looking Forward) [CC BY 2.0], via Wikimedia Commons

  • The Great Vancouver Exodus: Why I’m Almost Ready to Leave the City

    It was one of those Sundays in early January when you wake up to bright, stark sunlight streaming through your blinds.

    My fellow Vancouverites might know the one. It’s been grey and dreary for months. You open your curtains to a brave new world and see, with sudden, startling clarity, all of the dust that had gathered in the cracks of your life while you had been hibernating through the long winter.

    Every year, on this particular day in January, I find myself wandering around the city alone in an unsettled daze—one hand on this first pulse of summer, wondering how, with all of the dust and cracks, I can keep on pushing forward.

    It was freezing out, being January and a cloudless day, but I needed to get out of the house.

    At that point, I had been “home” in Vancouver for a month after spending half a year in Europe.

    In that month, I spent a lot of time with my head between my hands complaining to friends about how torn I was between feeling the need to put my adult life together in my hometown and wanting to get on a plane back to Europe in search of a new place to call home.

    My best girlfriend then said to me, “Get away from the city. Go for a walk. Go to Stanley Park, wander into the forest and think about it. What do you really want? What makes you happy? Don’t think about what society says you should be doing. Think about what you should be doing.”

    “But it’s coooooold,” I said.

    “Oh princess,” she said. “Suck it up, bundle up, and thank me later.”

    And so, on that particular day in January, I dug out my warmest clothes, which, either ironically or coincidentally, looked very Pacific Northwest—red plaid flannel shirt, TNA Sea-To-Sky sweater (that one every girl in Vancouver owns), dark jeans, brown combat boots, fur-lined parka, knit gloves, and white toque (that’s what we call beanies in Canada).

    I walked to the SkyTrain (the Vancouver metro) and rode towards the glass towers rising out of Vancouver’s downtown core. I passed the offices of the Central Business District where all lights had been switched off for the weekend, and to the far end of the downtown Vancouver peninsula where the 1001-acre Stanley Park is located.

    I meandered into the park. West Georgia Street turned into Lost Lagoon into a forest trail where the light got darker and the trees thicker with every step I took.

    In the month that I had been “home,” I had come across a lot of questions, which were driving me to bouts of insomnia, frenzies of SkyTrain platform pacing, and uncharacteristically melodramatic speech.

    Away from the bustle of the city and my 9 to 5 job, I was able to start working through these questions.

    “Am I meant to settle down in this city, or is my home to be elsewhere in the world?”

    “Is it wiser for me to lay the foundations for my future in Vancouver, or should I start digging elsewhere?”

    “If I am meant to stay, do I have the courage to do so?”

    “If I am meant to leave, do I have the courage to do so?

    As I wandered deeper into Stanley Park, the din of traffic from the Lions Gate Bridge fading into a cacophony of crows in the trees and my breath misty puffs in the crisp January air, I found my answers.

    And it broke my heart.

    It’s time to leave Vancouver.

    There is an interesting phenomenon that has been occurring at an increasingly rapid pace over the past number of years.

    We call it the “Exodus of Millennials,” or, as I like to put it “The Great Vancouver Exodus.” 

    There is an affordability crisis in this city. Vancouver is ranked the 2nd least affordable city in the world next to only Hong Kong. Considering what it costs to live in places like New York or London, our dilemma here should be quite apparent.

    Housing prices have grown at an alarming rate. As of 2016, 91% of single-family homes are valued at over $1 million. Our salaries have not grown to match.

    One of my best friends is a realtor. For years, she has been saying, “Get into the market as soon as you can.”

    The rest of us who are less educated in real estate would talk about waiting for the real estate bubble to burst.

    I entered the industry myself recently and began paying attention to trends and numbers. Vancouver’s bubble isn’t going to burst anytime soon. It’s either get in as soon as possible, or get out of town.

    It’s ridiculous, really.

    Let me put it this way.

    For four years, I worked full-time. One of my offices was on Burrard where the rent per square foot is the second highest in Canada. One of my other offices was a block away and I had an unobstructed view of the Olympic Cauldron. I spent a lot of time ordering people around.

    You’d think I was doing pretty well for myself.

    In those four years, I first lived in a 300 sq. ft. apartment that cost 1/3 of my salary and was located on Drake between the noisy Granville and Burrard Bridges. I then moved to Commercial Drive and lived in an unremarkable 1-bedroom walk-up that hadn’t been updated since the 70s. Every so often, I’d come across a stray silverfish.

    In that time, I tried to save for a down payment. Four years of saving later, all I could afford was a single-roomed shoe box in an up-and-coming (read: will be safe in 20 years) neighborhood.

    It was then that I decided it wasn’t worth spending my hard-earned money on a shoe box that I’ll nevertheless be paying off for twenty years. So I bought myself a one-way ticket to Europe instead.

    Note: the person I used to share the apartment on Commercial Drive with now lives up the street. He pays $850 a month (1/4 of his salary) for a 75 sq.ft. bedroom in a 100-year-old house shared with some ten people. The house is so old it appears impossible to keep clean, every stair is caving in the center, and the floorboards are obnoxiously squeaky. It recently sold for $1.4 million.

    Over the past few years, I have found myself at increasingly more going-away parties.

    “My start-up got funded in New York,” says one departee (yes, I made that word up).

    “I just got promoted to head office in Toronto,” says another.

    And every one of them says things like, “I’m moving to San Francisco, London, Berlin, Madrid, Paris, Beijing, Hong Kong, Singapore, whatever, because I can’t afford to be here anymore.”

    For the most part, my core group of about five friends remained unaffected. However, having spoken at length to them recently, I realized that they are all seriously considering joining the Exodus.

    They all started thinking about it at the same time. Their timelines for leaving fall within the same year. Their reasons for leaving are similar. My consideration of the aspects of my own Exodus line up perfectly with theirs.

    In fact, in the month that I’ve been “home,” one of my closest friends has already made it to San Francisco.

    My best girlfriend is in the process of saving to move somewhere tropical with her husband so they can work as diving instructors.

    Even the realtor, who has been making a killing off of our real estate market, is ready to go.

    “I’m going to London next year to get my Master’s,” she said. “We are so secluded here and I feel like there’s a lot more I could be doing for both myself and the world.”

    I’ve seen the outrageous amounts of money realtors pull in. She has all of the makings of a realtor—smart, driven, ambitious, organized, well-spoken, well-dressed, attractive, and trustworthy—and she is good at it.

    For someone like her want to give up a real estate market like Vancouver is saying something.

    When it comes to business, Vancouver is a satellite city. I dare even say that Canada is a satellite country.

    As a marketer who often works cross-border with the US, I have always been miffed at the huge discrepancy between marketing budgets allotted to the US vs. Canada.

    “There just isn’t enough of a market in Canada,” I’m always told.

    Fun fact: the entire population of Canada can fit into the State of California.

    When it comes to international business, Canada usually concedes to the decisions of the US division. When it comes to national business, Vancouver usually concedes to Toronto.

    If you’ve never experienced this, allow me to tell you that it is frustrating to have to follow directions from a voice over a phone located three time zones away and in a completely different part of the country.

    Therefore, everyone is leaving. Those of the ambitious, career-oriented kind are all fleeing for greener (and more affordable) pastures elsewhere. This is happening so rapidly and thoroughly that the entire future of the Vancouver economy is being threatened.

    Twenty-five countries later, I still think Vancouver is one of, if not the most beautiful city in the world.

    But it is precariously poised to become a ghost town and I am far from ready for the afterlife.

    And so, all reason is pointing me to join the Exodus.

    By this point, I had wandered from the north end of Stanley Park to the south end.

    I sat down on a bench by the water somewhere between Second and Third Beach facing the sunset.

    I was terrified. Is it really true that I am meant to leave everything familiar because I am being priced out of the housing market in my hometown?

    Yet I silently thanked my best girlfriend.

    My head was clear.

    I need to leave Vancouver.

    My walk ended at the stone-stacked Inukshuk at the far end of English Bay. The Inukshuk is an iconic symbol of Vancouver, having been the basis for our 2010 Winter Olympics logo.

    I stood there for a while, watching the last orange rays of sunset disappear behind the mountains and shivering in the winter chill.

    I realized I was saying goodbye.

    It’s almost time to join the Exodus.

    Grace Pacifica Chen is a Vancouver-based marketing consultant, brand manager, travel blogger, and creative writer. Follow her on Twitter and Instagram @pacificachen.

  • Now They Get It: Health, Class, and Economic Restructuring

    In the past few months, many commentators have responded to a recent study that shows increasing death rates among middle-aged white Americans. Some have suggested that the increase is the consequence of material poverty resulting from economic restructuring and the neoliberal agenda over the last several decades.

    Globalization, trade liberalization, deregulation, privatization, and reductions in the welfare state have not only led to downsizing in many industries, they have also reduced wages and benefits, contributing to growing economic inequality. The nature of many jobs has also changed. Work has been intensified, hours have become increasingly irregular, and workers face anxieties about the loss of their jobs and electronic monitoring of their work. These changes leave workers feeling vulnerable and stressed, and that together with anti-union laws and poorly enforced labor laws limit their ability to fight back. As someone who taught courses in Occupational Safety and Health for many years, I am all too aware that these workplace stresses and the limits of workers’ agency are associated with increases in cardiovascular disease, physical and mental disorders, and acute injuries. In other words, while research has focused on increasing mortality rates, changes in work also contribute to increased health problems, which may, in turn, explain the increases in alcoholism and drug abuse that Anne Case and Angus Deaton see as key factors in the rising death rates.

    Workplace stress and insecurity are among the “hidden injuries of class” that compound material poverty. As people adapt to changes in and the loss of work, they become more isolated, and, too often, lose their sense of community and self worth. Worse, they internalize insecurity, blaming themselves for problems at work or for not being able to find a decent job or support their families. That people blame themselves should not surprise us, given the persistent ideal of the American Dream, which promises that individual effort will pay off in upward mobility. No wonder people who have lost jobs or who are working hard but still struggling economically see their challenges as a moral failure or character flaw.

    For anyone who has studied the social costs of deindustrialization, none of this is news. In the 1980s, Harvey Brenner determined that for every one percent increase in unemployment there were 650 homicides, 3300 admissions to state mental hospitals, 500 deaths by cirrhosis of the liver, 20,000 deaths by suicide. Other studies focused on displaced workers in the late twentieth century showed increases in incarceration, insomnia, headaches, smoking, child and spousal abuse and stomach disorders, not to mention suicide and drug and alcohol abuse. In many ways, the current research shows not a new trend but rather the long-term impact of economic restructuring and neoliberalism on workers’ lives.

    What is new is that these patterns no longer seem to apply primarily to the working class. While Case and Deaton note that poorer and less-educated white people had even higher mortality rates, their study suggests that the pattern also applies to the middle class. This may be what most surprised commentators, for whom the report offered dramatic evidence of an important change in American culture. As Paul Krugman suggested, “We’ve seen this kind of thing in other times and places – for example, in the plunging life expectancy that afflicted Russia after the fall of Communism. But it is a shock to see it, even in an attenuated form, in America.” Krugman and others asked how this could happen. In an interview with Vox, Deaton commented that the middle-aged white people in his study had “lost the narrative of their lives.” While this certainly applies for many in the working class, as Sherry Linkon noted in November, it is also true for growing numbers of middle-class Americans who may have been even more invested in the American Dream.

    Also new is the racial pattern. In the 1970s and 80s, death rates for African Americans rose, but in recent decades, they have fallen as the rates for whites have risen. Andrew Cherlin suggests that the difference could be explained by people’s perceptions of how they are doing compared with others like them. As Cherlin writes, “It’s likely that many non-college-educated whites are comparing themselves to a generation that had more opportunities than they have, whereas many blacks and Hispanics are comparing themselves to a generation that had fewer opportunities.” Put simply, if white working-class people see themselves as losing ground, they may be more likely to consider suicide or engage in self-destructive behaviors.

    The impact of economic restructuring on material poverty and health has a long history. In the last 40 years, increases in poverty and the declines in the health of the working class were rationalized as “acceptable” losses associated with major economic change. But what has changed is the demographic landscape. No longer are mortality and morbidity issues associated primarily with the working-class and African Americans. Now, job loss and economic insecurity are impacting the middle class and whites.

    I’m reminded of an old adage: when poverty comes in the door, love goes out the window. As middle-class whites increasingly experience the kind of economic insecurity that became normal for so many working-class people years ago, some are losing not just love but also their health and even their lives.

    This essay was first published by the Working-Class Perspectives blog, which offers weekly commentaries on current issues related to working-class people and communities.

    John Russo is a visiting fellow at Kalmanovitz Initiative for Labor and Working Poor at Georgetown University and at the Metropolitan Institute at Virginia Tech. He is the co-author with Sherry Linkon of Steeltown U.S.A.: Work and Memory in Youngstown (8th printing).