Blog

  • An Improbable And Fragile Comeback: New Orleans 10 Years After Katrina

    In the fall of 2005, many saw in postdiluvial New Orleans another example of failed urbanization, a formerly great city that was broken beyond repair.Yet 10 years after a catastrophe that drove hundreds of thousands of its citizens away, the metro area has made an impressive comeback.

    New Orleans’ resurgence since Katrina has come courtesy of $71 billion in federal funds and the determination and verve of New Orleanians themselves, as documented by Tulane geographer Rich Campanella, who provided research and direction for this article. It also benefited from the generosity of thevolunteers who worked in the recovery efforts as well as that of neighboring cities, notably Houston, which housed thousands of evacuees. Many have now returned, joined by newcomers from around the country, determined to turn around the city. “A city,” notes urban historian Kevin Lynch, “is hard to kill,” and New Orleans is proving that assertion.

    New Orleans’ comeback reflects not only improved levees and disaster management planning but a break from the region’s famously corrupt politics. Author Joel Garreau once described the city as a “marvelous collection of sleaziness and peeling paint.”  Today the metro area, and Louisiana, is earning higher marks for efficiency and business friendliness.  In Forbes’ annual ranking of the Best States For Business, Louisiana has risen from dead last in 2006 to 29th place in 2014, while Chief Executive Magazine ranks the state as having the ninth best business climate in the country, up from 45th in 2008.

    Perhaps most compelling has been the improvement in the public schools, which were  once among the worst in the country. After the storm, most of the campuses were converted to charter schools, which now educate over 80% of the parish’s schoolchildren. New Orleans now outperforms not only the rest of the state but the nation in terms of high school graduation rates, which have risen to 73% in 2014 from 54% in 2004, and the percentage of students on grade level in grades 3-11 is at 68%, up from 25% in 2000.  As Allison Plyer, executive director of the Greater New Orleans Community Data Center, put it in 2013, “Greater New Orleans is in some ways rebuilding better than before.”

    Growth, But Also A Rebound In Poverty

    The improvements in governmental institutions have, along with federal aid, sparked something of a jobs boom in New Orleans. The metro area recovered all the jobs lost in the recession by 2012 while the nation remained 3% below its pre-recession level.  The economy has expanded into some new sectors, such as digital media, while there has been a strong recovery in longtime core sectors liketourism and shipping, with an expansion of the port. After lagging the country for a generation, post-Katrina New Orleans surprised everyone by outperforming it.

    But there are signs that New Orleans’ rate of growth is leveling out, as might be expected with the tailing off of federal recovery spending. In our annual ranking of the cities creating the most jobs, themetro area has dropped from 26th place in 2013 to 43rd. This slowdown could worsen the biggest challenge facing New Orleans: its historic legacy of poverty.

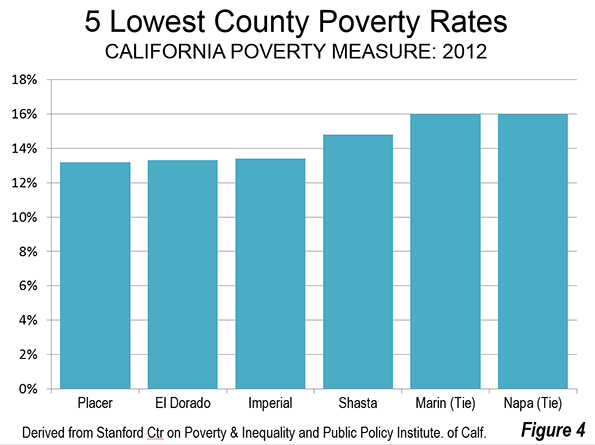
    Greater New Orleans and the central city in particular have among the nation’s highest poverty rates and inequality. Even before Katrina, the city had over 26,000 blighted properties, a number that doubled after the storm.

    As more evacuees have returned, poverty rates in the city and the metro area have resurged. Between 2007 and 2013 Orleans Parrish’s poverty rate rose from 21% to 27%, just about where it was in 1999. At the same time, the gap between white and African-American incomes and poverty rates remain well above the national averages.  Incarceration rates in Orleans parish are almost four times as high as the national average, and  the rest of the metro area also has incarceration rates considerably above the national average.  New Orleans’ murder rate fell to the lowest level last year since 1971, but it was still the ninth highest among major U.S. cities.

    A Demographic Resurgence

    Yet some new demographic trends offer hope.Critically, the region finally has begun to reverse a demographic decline spanning more than a generation in which the urban core steadily lost young, educated people and families to the suburban periphery and beyond.  

     The immediate aftermath of Katrina saw an influx of “YURPS,” or Young Urban Rebuilding Professionals — urbanists, environmentalists and social workers who headed South to work in the recovery efforts, in nonprofits and government programs, seeking to be part of something important.After that came a wave of well-educated professionals, who saw personal opportunity in the region’s rebounding economy. Campanella estimate this latter group at around 15,000 to 20,000strong.   Along with them, says Campanella, have come a fair number of artists, musicians, and creative types seeking to join in what they perceived to be an undiscovered bohemia in the lower faubourgs of New Orleans.

    The New Orleans metro area’s population of college graduates increased by roughly 44,000 from 2007 to 2012, a 25% increase, double the national average of 12.2% over that span.

    These educated newcomers are widely credited not only with helping rebuild New Orleans, but also sparking an increase in start-up companies well above the national pace and boosting the city’s economic diversification. Employment in the New Orleans area’s information sector — high-paying jobs in entertainment, games, software — grew 21.2% between 2007 and 2012, more than twice the national average, according to Praxis Strategy Group.

    Is Gentrification A Threat?

    This promising development, however, brings with it a set of problems, among them concern, particularly among African-Americans, about gentrification of inner-city neighborhoods. Many African-Americans, notes city employee Lydia Cutrer, have “trust issues after many broken promises, and feel like outsiders are taking over.” Or, as former New Orleanian Sherby Guillory, a health care worker and now a Houston resident put it acidly, “They want to build a shining city on a hill, but without the people.”

    A map of the city by Campanella (below) shows where this turnover in population is the most advanced. He observes that the newcomers are attracted to a particular type of neighborhood – places with distinctive, historic housing stock, and close to areas that have already gentrified, or that never economically declined, like the Garden District. The arc of gentrification spreads through uptown New Orleans, around Audubon Park and Tulane and Loyola universities, with a curving spout along the St. Charles Avenue/Magazine Street corridor through the French Quarter and into the Faubourg Marigny and Bywater. These areas have in many cases been incubators of New Orleans’heavily African-American music and food culture, and now are losing some of those old connections.

    Courtesy of Richard Campanella

    Courtesy of Richard Campanella

    As elsewhere gentrification is widely welcomed in the real estate and business communities, but also poses dilemmas, even for newcomers. Indeed gentrification threatens to undermine one of the very reasons young people are so attracted to New Orleans — its unique local culture. Boilerplate yuppie restaurants selling beet-filled ravioli is no substitute for fried okra and other traditional specialties.

     The Physical Challenge Of Rebuilding

    As Katrina demonstrated all too well, poverty in New Orleans is deeply intertwined with  the geographic challenges of the region. Most predominately African-American neighborhoods were located in the low-lying areas of the city, easily susceptible to flooding, while more affluent, usually white neighborhoods were on higher ground.  

    Some have suggested moving the region’s entire population to higher ground, but political and fiscal realities, plus social resistance to closing down heavily damaged, far-flung neighborhoods, paved the way for resettlement patterns that have not reduced human exposure to the hazard of surge flooding.

    But there’s no question that $14.5 billion in taxpayer dollars have gone to good use in keeping thosehazard at bay — at least for the next few decades. The Army Corps of Engineers’ new Hurricane Storm Surge Risk Reduction System — composed of heightened levees, floodwalls, surge barriers, gates, and pumps — now  protects the metropolis from storms that have a 1% change of occurring in any given year. That’s much less than the city needs, but it’s a lot more than it had before Katrina, and the Risk Reduction System (note that it’s no longer called a “flood protection system”) worked well during Hurricane Isaac in 2012.

    That’s the good news. The bad news, Campanella observes, is that the coastal wetlands beyond the system, starved of sediment and freshwater, continue to subside and erode at rapid paces in the face of rising sea levels and intruding sea water.

     A Difficult Road Ahead 

    Solving New Orleans’ geophysical problems is critical for long-term growth.  “We have to approach this as a win-win proposition,” says the Nature Conservancy’s Seth Blitch. “Everyone knows if we do nothing, it’s a lose-lose for everyone.”

     In the near term obstacles include the growing disparities of race and class, the fall in oil prices, and the strengthening dollar,which could slow the recent surge in capital investment into Louisiana’s industrial economy that has come on the heels of the surge in natural gas production.  

    While challenges abound, progress over the past 10 years is undeniable, and few  would have predicted the city would have come this far so soon in addressing its long-term challenges. “None of this would have happened without Katrina,” says Loyola theologian and philosopher Michael Cowan. “It changed forever what had been an inertial environment. After Katrina, it was like operating in zero gravity. Katrina broke the pattern.”  

    This piece first appeared at Forbes.com.

    Joel Kotkin is executive editor of NewGeography.com and Roger Hobbs Distinguished Fellow in Urban Studies at Chapman University, and a member of the editorial board of the Orange County Register. He is also executive director of the Houston-based Center for Opportunity Urbanism. His newest book, The New Class Conflict is now available at Amazon and Telos Press. He is also author of The City: A Global History and The Next Hundred Million: America in 2050. He lives in Orange County, CA.

    Photo montage by Richard Campanella.

  • Urbanists Missing Strategy Gene

    Looking at the things now decried by so many urbanists, ranging from urban renewal to freeways to restrictive zoning that makes building difficult, it’s notable how many of them are well-nigh ubiquitous.  Surely some city, somewhere must have realized that these were mistakes, if mistakes they were. But very few did.

    Why is that?

    Thinking about cities takes place in a world without any concept of strategy. Harvard business professor Michael Porter, the godfather of strategy, has said, “Competitive strategy is about being different. It means deliberately choosing a different set of activities to deliver a unique matrix of value.”  This is exactly the opposite of thinking that goes into cities, in which no matter what the locale, urbanists or policy advocates of various stripes always seem to have the same solutions that they prescribe for every community, regardless of how different our places are.

    To see this in action, just look at how some urban advocates see the future in Chicago.  Today’s urbanist orthodoxy says cars bad, transit good – basically always and everywhere.  This logic has been internalized by them in Chicago. Consider a recent proposal by the city to reduce parking requirements an increase density near transit stops.  This one is actually a laudable policy that makes a lot of sense.

    But it’s worth considering the broader strategic context in Chicago. What is it, fundamentally, that sets the city apart in the marketplace? Why live in Chicago instead of say New York, San Francisco, or Boston?

    When you compare Chicago against other cities that are providing a genuine big city urban product, you see that Chicago has two killer advantages:

    1. Price. A middle management couple with children can actually afford to buy a sizeable, 2-3 bedroom, modern condo, with a parking space, in the city.  Even if taxes go up substantially to pay off its mountain of debt, Chicago will retain a big cost advantage over coastal metros. Many of the city’s neighborhoods remain very reasonably priced, even for working class households.  Unlike the way a lot of other cities are trending, Chicago is much more than micro apartments for Millennials. It’s a place you can actually afford to stay and raise a family.

    2. Car Friendliness.  Chicago gives you the best of both worlds. You can ride the L, take a bus, walk, bike, or taxi when it suits your needs, but still own and park a car affordably and use that when it makes sense.

    The latter point is one urbanists are loath to acknowledge, but is huge, particularly for families. Parents can commute by transit to the Loop, cab to dinner, walk with the kids to the corner ice cream shop, etc.  But when they want or need to, they can pile into the car and drive to a full sized supermarket, Target, Home Depot, Costco, etc. and stock up. (And their large apartments and condos mean they can actually store the stuff they buy).  They can also strap the kids into car seats and drive to Wisconsin on the weekend, or to visit family. Or have a car for reverse commuting to the suburbs.

    To see the value of this, consider this interview with a resident of New York’s Upper West Side, who cites as the best thing about a local grocery store called Fairway that, “You could find everything at Fairway.” This might seem an odd compliment in most of America, where grocery stores that carry “everything” are ubiquitous. But not in some of these places like central New York, which are dominated by bodegas and small footprint stores, you can’t drive, and there’s nowhere to put a massive supply of food anyway.

    On Saturday, for example, I, also on the Upper West Side, needed a bottle of regular light (non-extra virgin) olive oil to make mayonnaise. By the time I needed it, I knew Trader Joes would have massive lines stretching around the entire store. So I walked to the nearest (small) grocery store, which only had extra virgin olive oils. Faced with either a long walk to another grocery, which also might not have it, or trying my luck with various nearby bodegas, I ordered it on Amazon Prime Now for two hour delivery. Luckily I didn’t need it immediately. Delivery is awesome, but it should be possible to find basic things without resorting it.

    I can assure you in my old place in Chicago, one quick trip to Jewel or any of the other plentiful supermarkets would have taken care of that.  Stores like that, or like Sam’s Wine and Spirits and host of others, only exist because they are able to draw from a trade area served by the car, and because people can buy large quantities best transported by car.

    In short, the car is a bit part of what gives Chicago its livability advantage over coastal cities. So while accommodating those who don’t own a car is great, degrading the urban environment for those who do is not.

    Unfortunately, this is what many transport advocates want to do.  For example, they are backing a proposed Bus Rapid Transit (BRT) line on Ashland Ave that would reduce the number of travel lanes from four to two, and ban most left turns, for 16 miles.  Fortunately, this appears to be dying on the vine in the face of neighbor opposition, but it’s a valuable lens into urbanist thinking.

    Where Ashland Ave. BRT fails is not in its attempt to improve transit service or to accommodate those who choose not to have cars. Rather, the problem is that it is rooted in a vision, propounded mostly by coastal urbanites, that believes car use should be deliberately discouraged and minimized – ideally eliminated entirely – in the city. Thus the project is not just about making transit better, but also about actively making things worse for drivers. That might work in New York, San Francisco, or Boston, where the car is more dubious, but in Chicago this philosophy would erode one of the greatest competitive advantages the city enjoys. In Chicago, the car free strategy only works along the north lakefront and downtown, not the Ashland Ave corridor or most of the rest of the city.

    The no-car philosophy as the norm, not just an option, would undermine one of the greatest strategic advantages of Chicago. Why would you want to do that? Particularly when it would also make family life in the city more difficult for many. There is where urbanists need to start putting on their strategic thinking hat. Otherwise they may end up undermining the very places they seek to improve.

    There is certainly plenty of room to make investments in non-car travel modes in Chicago.  The North Main L clearly needs renovation, and it’s ridiculous that the CTA spent so much money on much more lightly traveled lines while ignoring its crown jewel.

    But where Chicago has the chance to really shine is in urban cycling. The city is nearly ideally suited for bicycling. It’s flat. Its citizens are hardy types who aren’t afraid of a little cold or bad weather. A grid street system combined with diagonal routes provides fast anywhere to anywhere biking in ways often even faster than transit, which often requires transfers for destinations other than the Loop.  Buffered or fully protected bike lanes are feasible in many places without major degradation of the driving experience. Plus, with the city’s financial problems, bicycle infrastructure is very attractive on a price/performance basis. Chicago has already done a lot for biking under Emanuel, and it can easily continue to do more.

    But actively degrading the ability of residents to use a car in the city is not a good idea for Chicago.

    Advocates for urban areas have a lot of good ideas that can make our cities better, but they need to think about how those ideas apply in the context of specific city or neighborhood in question. One size fits all thinking didn’t work in the past, and it’s still a bad idea today.

    Aaron M. Renn is a senior fellow at the Manhattan Institute and a Contributing Editor at City Journal. He writes at The Urbanophile.

    Chicago photo by Bigstock.

  • Poorer Nations Set for 99% of Population Growth

    According to the new United Nations World Population Prospects: The 2015 Revision, the population of the world is projected to rise from 7.3 billion in 2015 to 11.2 billion in 2100. This represents a 53 percent increase. However, over the period, population growth will moderate substantially. This is indicated by the annual growth rate the first year (2015 to 2016), at 1.1 percent, compared to the last year (2099 to 2100) at 0.1 percent. Annual population growth is projected to decline 90 percent from the beginning of the period to the end (Figure 1).

    Growth by Continent

    The distribution of growth among the continents will be anything but even. Approximately 83 percent of the growth is projected to be in Africa, which is to grow approximately 270 percent. Asia is expected to account for 13 percent of the world’s growth and add 11 percent to its population. Northern America (Note), while growing 40 percent is expected to account for four percent of the world’s population growth. Latin America and the Caribbean are expected to account for 2.2 percent of the world’s growth, and add 14 percent to their population. Europe (including all of Russia) is expected to decline in population by 13 percent (Figure 2).

    Population Growth by Income Status

    World population growth is expected to vary widely by current income status (Figure 3). Income status is indicated on page 137 of this United Nations publication.

    The world’s high income nations are expected to add only eight percent (111 million) to their population and will represent only three percent of the population growth. These nations are principally in North America and Europe, but also include Japan, South Korea, Saudi Arabia and others.

    The world’s upper middle income nations are expected to experience a population decline of three percent, which amounts to a loss of 82 million residents. China, Russia, Mexico, South Africa, Iran and Brazil are examples of upper-middle income nations. When combined with the high income gain noted above the more affluent half of the world’s nations would add 29 million residents, or just 0.7 percent of the world’s growth. This is fewer people than live in the Tokyo metropolitan area.

    This means that more than 99 percent of world growth from 2015 to 2100 is expected to be among the lower income nations. The lower middle income nations would gain 2 billion people, representing 52 percent of the population growth.  The lower-middle income nations include India, Indonesia, Nigeria, the Philippines, Vietnam, Guatemala and others.

    The lower income nations would gain 1.8 billion people, capturing 47 percent of the world’s growth. The lower income nations include Bangladesh, Tanzania, Myanmar, the Democratic Republic of the Congo and others.

    In the high income and upper middle income regions, population growth will be also anything but consistent. Nations such as the United States, the United Kingdom, France, Canada and Australia are expected to grow far faster. The United States is expected to add 40 percent to its population and more than four times the population growth of all of the upper half of nations. Canada (up 39 percent) and Australia (up 77 percent), combined, are expected to add more population than the total upper income half of nations.  These gains will be largely offset by losses in Japan, Germany, South Korea, Italy and others.

    Largest Population by Nation

    China, with the largest population in 2015, is expected to fall behind India in 2050 and remain in second place by 2100. India is expected to be the largest nation in both 2050 and 2100. However, India’s population will be less in 2100 than it was in 2050.

    Eight of the 10 most populated nations, including India and China are expected to have a lower population in 2100 than in 2050 (Figure 4). Pakistan is expected to reach its population peak in 2095 and start declining in 2096. This leaves only the United States among today’s today’s 10 largest nations that is expected to be adding population in 2100. The growth rate between 2099 and 2100 (0.2 percent) is expected to be considerably below the growth rate at the beginning of the period (2015-2016), which was 0.7 percent.

    By 2100, there are expected to be substantial changes to the top 10 nations in population. Five of the 10 largest nations in the world are expected to be in Africa. This is an increase from one in 2015 (Figure 5). Nigeria will have replaced the United States as the third largest nation, with approximately 750 million people, having more than quadrupled in size. The Democratic Republic of the Congo (Congo – Kinshasa) would rank fifth, and is expected to reach 390 million people, quintupling in size. Tanzania would rank eighth, reaching 300 million residents, nearly 6 times its 2015 population. Ethiopia would have more than 240 million residents, 2.5 times its current population and would rank ninth. The 10th largest nation would be Niger, with 210 million residents, a figure 10 times its 2015 level. Among the African nations in the top 10, only Ethiopia would be declining by 2100, having reached its population peak in 2097.

    Pakistan would retain its current sixth position, while Indonesia would fall from 4th to 7th. As noted above, India would be the largest nation in China would be second largest in 2100. By that date India would have an overall gain of approximately 350 million people from 2015, while China would lose 370 million people. The United States would add more than 125 million people. Brazil, which is currently ranked 5th, would lose approximately 10 million people and fall to 13th position. Eighth ranked Bangladesh, which was long among the fastest growing nations in the world, would gain only 10 million people and fall to 14th position. Russia, ranked 9th, would fall to 23rd, losing 25 million residents. Mexico, ranked 10th, would gain 20 million residents, and would be ranked 18th in 2100.

    The Uncertainty of Projections

    Of course projections of any kind are subject to wide error ranges. Economic growth, the extent of poverty, wars, social trends, medical advances and other factors can interfere. The simple fact is that none of us and no organization knows the future for sure. One study of UN population trends in six Southeast Asian nations found that 1980 projections from 1950 were 13.9 percent off by nation, with a range from minus 20 percent to plus 27 percent. There had been some improvement in comparing 1975 projections to 2000 actual populations, with an average error of 8.2 percent. The range was little improved, from minus 23 percent to plus 25 percent. Obviously projections are likely to be much more accurate in early years and the chances for greater accuracy are improved in larger nations or regions.

    A World of Challenges

    Regardless of the extent of accuracy, which cannot be known at this point, the projections indicate a continuation of trends that cause concern. A world that is experiencing virtually 100 percent of its growth in its poorest areas cannot help but face a tougher future. This makes it clear that the principal priority of governments around the world should be to improve affluence and reduce poverty. The challenges are gargantuan, but focusing on these issues is likely to result in a better, though less than ideal, world.

    Note:  Northern America includes Canada, the United States, Greenland, Bermuda and the French territory of Saint Pierre and Miquelon.

    Photograph: Western Railway Headquarters (Churchgate), Mumbai, India (by author)

    Wendell Cox is Chair, Housing Affordability and Municipal Policy for the Frontier Centre for Public Policy (Canada), is a Senior Fellow of the Center for Opportunity Urbanism (US), a member of the Board of Advisors of the Center for Demographics and Policy at Chapman University (California) and principal of Demographia, an international public policy and demographics firm.

    He is co-author of the "Demographia International Housing Affordability Survey" and author of "Demographia World Urban Areas" and "War on the Dream: How Anti-Sprawl Policy Threatens the Quality of Life." He was appointed to three terms on the Los Angeles County Transportation Commission, where he served with the leading city and county leadership as the only non-elected member. He served as a visiting professor at the Conservatoire National des Arts et Metiers, a national university in Paris.

  • The Challenge of the Digital City

    The people we associate with don’t necessarily live right next to us. This is more common than ever before, as social media and other communication technologies allow us to stay connected with people across the globe. But as our urban social networks – the ones that define our lives in cities – continue to transcend traditional geographic boundaries, we must strike a balance along this line.

    Ultimately this is not about choosing one way or another. We should contribute to the growing digital infrastructure while also staying in touch with society’s innate emotional fabric. The task is not simple, but in order to properly adapt to this modern urban form, it’s up to city leaders, business managers, and the rest of the working class to understand today’s spatial, social, and emotional city contexts.

    A Digital Urban Fabric

    People from the same city may attend different schools, travel to different often far-off vacation spots, or go to various international business conferences. Knowledge is gained, experiences take place, and relationships are developed across the world that are all brought back to home-cities.

    When we experience these institutions and destinations, we typically experience them with others who share similar interests, socio-economic statuses, or career plans. And with social media we can maintain and navigate this social relationship however closely we’d like.

    Just recently researchers from MIT published a paper that outlined this idea: that social distance is a greater determinate of city networks than geographic distance. Cities have traditionally been analyzed at the national scale, with social data and activity being compared to other cities around the country. But now the urban environment is being explored at a deeper level, and we’re beginning to understand how people form sub-communities within their cities. Department of Civil and Environmental Engineering (CEE) Associate Professor Marta González, co-author of the paper explains:

    "We found that geography plays only a minor role when forming social networking communities within cities. Unlike the country [as a whole], cities have more dispersed communities.”

    The implications of this work is that by understanding how social networks are developed, and how connections are maintained, policy makers can make better informed decisions when working with different social groups. Leaders can examine social data to understand how epidemics are spread, and how new innovations should be applied in cities. Gonzalez even predicts new, progressive uses for social media:

    "We are envisioning social media apps for social good – in this case, sustainable adoptions in the city."

    These new insights are reaffirming that the way we experience our cities is being affected by our digital connections. The urban network is evolving. Cities are traversing geographic boundaries, and people are networking with those that share common interests, passions, and goals, rather than with their geographic neighbors. Our country is a compilation of different cultures, all of which are found in different geographic locations. Is it not appropriate to say that our cities are sharing these same diverse characteristics?

    Maintaining Earthly Ties

    This abstract conception of urban life is important to grasp for both scientific and personal reasons, but as we speed along this path of digital connections, physical interaction will play an especially important role in preserving civic relations.

    Information from the General Social Survey tells us that neighborly relations have declined significantly since the 1970s, a trend which hampers community planning efforts as well as crime prevention. In fact, a third of Americans have never interacted with their neighbors and neighborhood relations represent less than a quarter of all social ties. A 2010 PEW study also shows that 28% of us know none of our neighbors’ names, with young people at the forefront of this somewhat depressing reality. That is, while about 50% of Baby Boomers know all or most of their neighbors, the same is true for only 27% percent of millennials.

    The reason for this? Internet use alone has not been directly linked to neighborhood decline, but those who use social networking services are 30% less likely to know their neighbors. Researchers from the University of Toronto conducted an ethnographic study of Canada’s “wired” city, Netville. The authors’ findings complement the MIT study on social distance:

    “people are much more likely to associate with those that are more like themselves in terms of lifestyle, stage in the lifecycle, beliefs, and participation in common activities, than what can be easily found through physical proximity.”

    Rather than favor one side or the other, new social apps are trying to find that balance between digital and face-to-face interactions, using social media to enhance the physical neighborhood experience. Nextdoor is a Facebook-like app that lets neighbors add each other as friends and discuss community issues. RipeNearMe is also encouraging neighborly exchanges by allowing people to sell left over produce that grows on their lawns. Our cities are so diverse, and people are associating with others based on social proximity, but new technologies like these are fostering friendly engagement and constructive community dialogue throughout both digital and physical networks.

    In terms of business, telecommuting has been on the rise- a prime example of business’s growing digital infrastructure. Remote employees maintain corporate ties through the Internet and e-mail, and creative types can access a global platform for artistic demonstration.

    Such digital connections let workers create flexible schedules, decrease or eliminate commute times, and strive for a greater work-life balance. The benefits are far and wide, but the downside to what can result in worker isolation can be longer, distracted work hours and stifled creativity. Working at the office can boost creativity and enhance our social network, and even Yahoo and Reddit have gone so far as to shut down telecommuting in efforts to promote physical connectivity.

    There are two sides to this personal interaction coin. Both face-to-face communication and telecommuting have their positives, and we should be looking to cater to them both, as each works better for different people. Community hubs such as Wi-Fi connected cafés and retail centers give workers a space to interact with others, stay close to home, and be productive. Rather than shun the workplace or ban telecommuting altogether, a better approach involves investing our energies in local amenities that integrate physical and digital experiences, amenities that are demanded by today’s modern worker.

    Living in a Digital City

    Meanwhile, cities around the globe are experiencing a cultural homogenization in part as a result of digital advancements. There will always be those nuances that distinguish cities from each other – food, arts, architecture, language, and even politics – but these urban intricacies are getting harder to seek out as corporate chains increasingly dominate local economies and online mega-stores lure shoppers off the streets and into digital shopping malls.

    Design, music, culinary and fashion trends are also a function of digital proliferation. The artistic eye in a New York gallery is subject to some of the same inspirations as that in a Parisian loft thanks to YouTube, Tumblr, and Internet libraries. Such a cultural proliferation surely comes with its benefits (creative inspiration, a larger consumer base, and greater cultural access), but the disintegration of local ties has its troubling side effects. Today with online media we have easy access to a greater variety of cultures, but we must consider the cultural dilution that results from globalization. And while we engage with far-off societies whether through business, social, or artistic relations, we sometimes ignore the creative production, or potential, in our own backyards.

    There has been some blowback from these trends, as hipsters take up organic, local, and sustainable causes. But even these habits only feed back into the global cloud. Cities thousands of miles away from each other are finding their streets filled and dominated by similar environmental, political, and artistic ideologies. In order to prevent the local from being dictated by the global, or the national for that matter, we should focus our efforts on cultivating the relationships, as well as creative and economic potential at the local level, using progressive technologies and social urban spaces.

    Tying together the Digital and the Physical

    Cities are now part of a growing, global system and are becoming subject to the same determining factors. But the social ties that are coming to define this urban network are not one-dimensional. They’re also constructed from friendship, love, and the human desire to be with others. They make up our own mental infrastructure- shaping our perceptions of others and everyday experiences. But as these networks are transitioning into the digital realm we need to remember that the physicality of these networks are just as important for our own well-being. 

    Public spaces are crucial for fostering this traditional interaction. Parks, shopping districts, co-working spaces, open-universities can serve as social hubs- places where people of different social spheres can come together in a real-life setting. With good design and proper maintenance we can ensure that these spaces offer us a meeting area to explore and strengthen our digital ties at an even greater level.

    So while social networks might at times defy geography, they are enhanced and more thoroughly explored when they materialize in ‘real-life’. The cities we live in today are not even close to being entirely digital, but they aren’t completely physical either. We spend hours online, communicating through airwaves and searching through the ‘cloud’, but we still act out our daily lives with every muscle in our body. But how can we properly integrate these two dimensions, so that we can lead socially connected, and meaningful lives?

    Lying somewhere between the digital and the physical is a potential substrata, which is neither completely digital or physical, conceptual or concrete, yet it ties us all together. We can think of it as a shared human essence, a collective understanding of what it means to be alive, and what it means to be with others. So no matter which physical city we’re in or culture we’re experiencing, it’s from this thread that all of social life stems. It’s from this strand that we can explore and derive true meaning behind our actions.

    We call this a digital city not just because we’re all connected in this new technological age, but because we’re intertwined amongst a new social fabric: a modern social system that is both digital and physical, global yet local. This substrata manifests throughout our digital social networks as well as the built urban infrastructure, but the governing body of this modern urban experience remains out of sight- embedded in the depths of our own emotions. 

    As we navigate city streets, we’ll need to keep our minds open. To be independent citizens, free to explore at our own will and pursue our passions, we’ll need to uncover the governing laws – whether we interpret them scientifically, or spiritually – and be critically aware of the people and events that may appear as opportunities or threats.

    Highly conceptual, yet surprisingly relevant, this city we all inhabit is an exciting place to learn, play, consume, and create. We can either choose to remain aloof in the digital, or keep stagnant in the physical. Or we can consciously settle on a new frontier that combines digital possibilities with a keen focus on physical space.

    Charlie Stephens is a researcher at the Chapman University Center for Demographics and Policy, and an MBA candidate at the Argyros School of Business and Economics at Chapman University. He is also a regular contributor to the creative business site PSFK.com and the founder of substrand.com, a social awareness site that helps people, businesses, and communities understand their cultural environments and connect in new grounds.

  • A Visit to Kazan

    St. Petersburg and Moscow are typical destinations in Russia, but if you’re looking for other places to visit, where do you go? I can’t claim to answer that question as I have not fully surveyed the realm, but I did visit the city of Kazan for a day, so want to share a few observations and photos.

    Kazan is a city of a bit over a million people about 450 miles east of Moscow (a flight of around 1:20). It’s the capital of the Tatar Republic of the Russian Federation. The Tatars were a nomads of Turkish ethnicity who established an independent kingdom in the region before being conquered by Ivan the Terrible. They are very proud of their unique ethnicity and history, and have obtained a great deal of autonomy (at least as much as exists in Russia). Originally the province was called Tatariya, but they renamed it Tataristan. To locals, the “-stan” suffix suggests strength and independence on par with other fully independent republics in the region. While they can certainly choose whatever name makes them feel most proud, names ending in “-stan” certainly don’t inspire confidence in America. I don’t think they fully understand the negative brand equity in that term, but don’t let the name scare you off. It’s a modern and as far as I can tell perfectly safe city.

    In fact, it’s extraordinarily modern and new. There’s been a vast amount of infrastructure investment, much of it done in conjunction with international sporting events. They hosted the 2013 Summer Universiade (an Olympics for students, I gather), and the 2015 World Aquatics Championship was underway while I visited. They’ve got a brand new airport, brand new freeway network, numerous new buildings, etc.

    Looking at Kazan in fact, you might get the impression it’s a boomtown. But it’s not a boom of the type you’d find in the US based on private sector growth. Though the region boasts oil and gas reserves and several manufacturing operations, most revenues go to the federal treasury in Moscow, so it would appear that Putin has showered the region was cash and that is the reason for the construction boom. The difference vs. St. Petersburg, which appeared to be starved for money, was evident. Everything in Russia is more or less state directed, and this is no exception.

    Having said that, the state could have invested in purely megalomaniacal projects as has happened in some other regional -stans. Instead a lot has gone into core infrastructure. Yes, some of it is tourist oriented, but the neighborhoods infrastructure I saw was in pretty good shape, and my cab driver said that the city had done a ton of upgrades to neighborhoods streets and such too. They also built a short metro system, though apparently it is under-patronized.

    Putin has been favoring the region with money in part to highlight and reward what Russians described to me as “good Muslims.” The Tatar region is about 55% Muslim and 45% Russian Orthodox. The split is basically along ethnic lines (though there’s a segment of Tatars that converted to Christianity). The Muslims in the area have long been known for their moderate brand of Sunni practice, and religious relations have been good, including a high degree of intermarriage (or so I’m told). Google tells me there were some extremist attacks in 2012, so I’m not sure what the status of that is, but I personally wouldn’t let it stop me from visiting there.

    The locals are really pushing the religious co-existence angle, which makes sense in a world that is looking for examples of Christianity and Islam getting along. That’s a shrewd marketing strategy.

    They also have gone beyond the modern and have pushed historic preservation. While no one is going to confuse Kazan for St. Petersburg, they have tried to restore what they have and have focused on obtaining UNESCO certifications. They are also pushing the Tatar cultural angle. There are plenty of elements of regional cuisine and I thought the food was excellent. Of course they would send me to their best places, but since I was only there one day, that didn’t matter. Kazan also has an important university, so has some attributes of a college town. Several famous Russians spent time living in Kazan, including Leo Tolstoy and Maxim Gorky.

    Is Kazan a must-see? No. But if you’re interested in checking out a Russian city other than the big two, it’s definitely worth a visit.

    I’ll share a few photos. The one at the top is the main entrance to the Kazan Kremlin. (The term kremlin is an old word meaning “fortress”). Here’s the Russian Orthodox cathedral there:

    Kazan, Russia - August 2015

    There was originally a mosque in the kremlin that was destroyed when Russians conquered the area. Recently, a new mosque was built on the site to maintain the symbolic religious balance in the area. I think it’s a very nice building.

    Kazan, Russia - August 2015

    They have their own leaning tower.

    Kazan, Russia - August 2015

    The main street leading to the kremlin.

    Kazan, Russia - August 2015

    The kremlin has nice views. There are several rivers and lakes in the area, including the Volga, and plenty of nice vistas.

    Kazan, Russia - August 2015

    Take a nice stroll along the lake.

    Kazan, Russia - August 2015

    Renovated buildings in the old Tatar Quarter

    Kazan, Russia - August 2015

    There’s a bit too much hardscape on that redone street for my taste. But it’s interesting because they took out a streetcar and pedestrianized the street. Apparently the vibrations were causing problems with the old buildings in the area, so they wanted to eliminate all vehicles.

    Not sure what this is, but it’s in my Kazan file.

    Kazan, Russia - August 2015

    Dittos.

    Kazan, Russia - August 2015

    I’ll wrap up with a bit of transport geekery. Yes, they have a bike share system.

    Kazan, Russia - August 2015

    Their new metro system is in the Russian style with lots of marble, etc. The system “M” logo is similar to Moscow but in green (the traditional color of Islam). Instead of Moscow style tap cards they are using plastic tokens.

    Kazan, Russia - August 2015

    A metro station.

    Kazan, Russia - August 2015

    Station name signage. I believe the top is Russian and the bottom is the Tatar language, which is also written using the Cyrillic script. Interestingly, for at least while into the Soviet period, Tatar was written using the Latin alphabet, but they were apparently forced to change.

    Kazan, Russia - August 2015

    Signs.

    Kazan, Russia - August 2015

    Here’s a train in the station. These are the exact same trainsets as the new Moscow ones I mentioned by didn’t have a picture of.

    Kazan, Russia - August 2015

    As I said, I was only there a day but was glad I went. It was good to get to see a city further into the Russian interior. Lots of money is being spent there, so I’d expect many further developments in the future.

    Aaron M. Renn is a senior fellow at the Manhattan Institute and a Contributing Editor at City Journal. He writes at The Urbanophile, where this piece first appeared.

  • California: “Land of Poverty”

    For decades, California’s housing costs have been racing ahead of incomes, as counties and local governments have imposed restrictive land-use regulations that drove up the price of land and dwellings. This has been documented by both Dartmouth economist William A Fischel and the state Legislative Analyst’s Office.

    Middle income households have been forced to accept lower standards of living while less fortunate have been driven into poverty by the high cost of housing.Housing costs have risen in some markets compared to others that the federal government now publishes alternative poverty estimates (the Supplemental Poverty Measure), because the official poverty measure used for decades does not capture the resulting differentials. The latest figures, for 2013, show California’s housing cost adjusted poverty rate to be 23.4 percent, nearly half again as high as the national average of 15.9 percent.

    Back in the years when the nation had a "California Dream," it would have been inconceivable for things to have gotten so bad — particularly amidst what is widely hailed as a spectacular recovery. The 2013 data shows California to have the worst housing cost adjusted poverty rate among the 50 states and the District of Columbia. But it gets worse. California’s poverty rate is now more than 50 percent higher than Mississippi, which long has set the standard for extreme poverty in the United States (Figure 1).

    The size of the geographic samples used to estimate the housing adjusted poverty rates are not sufficient for the Supplemental Poverty Measure to produce local, county level or metropolitan area estimates. However, a new similar measure makes that possible.

    The California Poverty Measure                           

    The Public Policy Institute of California and the Stanford Center on Poverty and Inequality have collaborated to establish the "California Poverty Measure," which is similar to the Supplemental Poverty Measure adjusted for housing costs.

    The press release announcing release of the first edition (for 2011) said that: "California, often thought of as the land of plenty" in the words Center on Poverty and Inequality director Professor David Grusky, is "in fact the land of poverty."

    The latest California Poverty Measure estimate, for 2012, shows a statewide poverty rate of 21.8 percent, somewhat below the Supplemental Poverty Measure and well above the Official Poverty Measure that does not adjust for housing costs (16.5 percent).

    The California Poverty Measure also provides data for most of California’s 58 counties, with some smaller counties combined due to statistical limitations. This makes it possible to estimate the California Poverty Measure for metropolitan areas, using American Community Survey data.

    Metropolitan Area Estimates

    By far the worst metropolitan area poverty rate was in Los Angeles, at 25.3 percent. The Los Angeles County poverty rate was the highest in the state at 26.1 percent, well above that of Orange County (22.4 percent), which constitutes the balance of the Los Angeles metropolitan area. However, the Orange County rate was higher than that of any other metropolitan area or region in the state (Figure 2). San Diego’s poverty rate was 21.7 percent. Perhaps surprisingly, Riverside-San Bernardino (the Inland Empire), which is generally perceived to have greater poverty, but with lower housing costs, had a rate of 20.9 percent. The two counties, Riverside and San Bernardino had lower poverty rates than all Southern California counties except for Ventura (Oxnard) and Imperial.

    The San Francisco metropolitan area had a poverty rate of 19.4 percent, more than one-fifth below that of Los Angeles. San Jose has a somewhat lower poverty rated 18.3 percent (Note 1). The metropolitan areas making constituting the exurbs of the San Francisco Bay Area had a poverty rate of 18.7 percent. This includes Santa Cruz, Santa Rosa, Stockton and Vallejo. Sacramento had the lowest poverty rate of any major metropolitan area, at 18.2 percent.

    The San Joaquin Valley, stretching from Bakersfield through Fresno to Modesto (Stockton is excluded because it is now a San Francisco Bay Area exurb) had a poverty rate of 21.3 percent, slightly below the state wide average of 21.8 percent. The balance of the state, not included in the metropolitan areas and regions described above had a poverty rate of 21.2 percent.

    County Poverty Rates

    As was noted above, Los Angeles County had the highest 2012 poverty rate in the state (Note 2), according to the California Poverty Measure (26.1 percent). Tulare County, in the San Joaquin Valley had the second-highest rate at 25.2 percent. Somewhat surprisingly, San Francisco County with its reputation for high income had the third worst poverty rate in the state at 23.4 percent. This is driven, at least in part, by San Francisco’s extraordinarily high median house price to household income ratio (median multiple). In this grisly statistic, it trails only Hong Kong, Vancouver and Sydney in the latest Demographia International Housing Affordability Survey. Wealthy Santa Barbara County has the fourth worst poverty rate in the state, at 23.8 percent. The fifth highest poverty rate is in Stanislaus County, in the San Joaquin Valley (county seat Modesto), which is already receiving housing refugees from the San Francisco Bay Area, unable to pay the high prices (Figure 3).

    The two lowest poverty rates were in suburban Sacramento counties (Note 2). Placer County’s rate was 13.2 percent and El Dorado County’s rate was 13.3 percent. Another surprise is Imperial County, which borders Mexico and has generally lower income. Nonetheless, Imperial County has the third lowest poverty rate at 13.4 percent. Shasta County (county seat Redding), located at the north end of the Sacramento Valley is ranked fourth at 14.8 percent. Two counties are tied for the fifth lowest poverty rate (16.0 percent), Marin County in suburban San Francisco and Napa County, in the exurban San Francisco Bay Area (Figure 4).

    Weak Labor Market and Notoriously Expensive Housing

    The original Stanford Center on Poverty and Inequality press release cited California’s dismal poverty rate as resulting from "a weak labor market and California’s notoriously expensive housing." These are problems that can be moderated starting at the top, with the Governor and legislature. The notoriously expensive housing could be addressed by loosening regulations that allow more supply to be built at lower cost. True, the new supply would not be built in Santa Monica or Palo Alto. But additional, lower cost housing on the periphery, whether in Riverside County, the High Desert exurbs of Los Angeles and San Bernardino Counties, the San Francisco Bay Area exurbs or the San Joaquin Valley could begin to remedy the situation.

    The improvement in housing affordability could help to strengthen the weak job market, by attracting both new business investment and households moving from other states.

    Regrettably, Sacramento does not seem to be paying attention. Liberalizing land use regulations is not only absent from the public agenda, but restrictions are being strengthened (especially under the requirements of Senate Bill 375). In this environment, metropolitan areas like Los Angeles, San Francisco, San Jose and San Diego could become even more grotesquely unaffordable, and the already high price to income ratios in the Inland Empire and San Joaquin Valley could worsen. All of this could lead to slower economic growth and to even greater poverty, as more lower-middle-income households fall into poverty.

    Note 1: San Benito County is excluded from the San Jose metropolitan area data. The California Poverty Measure does not report a separate poverty rate for San Benito County.

    Note 2: Among the counties for which specific poverty rates are provided.

    Wendell Cox is Chair, Housing Affordability and Municipal Policy for the Frontier Centre for Public Policy (Canada), is a Senior Fellow of the Center for Opportunity Urbanism (US), a member of the Board of Advisors of the Center for Demographics and Policy at Chapman University (California) and principal of Demographia, an international public policy and demographics firm.

    He is co-author of the "Demographia International Housing Affordability Survey" and author of "Demographia World Urban Areas" and "War on the Dream: How Anti-Sprawl Policy Threatens the Quality of Life." He was appointed to three terms on the Los Angeles County Transportation Commission, where he served with the leading city and county leadership as the only non-elected member. He served as a visiting professor at the Conservatoire National des Arts et Metiers, a national university in Paris.

    Photograph: Great Seal of the State of California by Zscout370 at en.wikipedia [CC BY-SA 3.0], from Wikimedia Commons

  • Goodbye, Single Family Home? But wait…..

    New urbanist utopians love to decry Americans’ love of the single family home, and to extol the virtues of a higher-rising denser city as more efficient and environmentally responsible. Without expounding on the immensely destructiveness of such a utopian viewpoint to physical and psychological well-being of a large majority of people, nor of the scientific absurdity of the claim of efficiency and  environmental goodness, I will for now present only some maps and data of what the real world is like.

    People vary in needs and preferences over the life course. It is indeed the case that young adults, usually unmarried (and yes increasingly for a longer time), and perhaps a fair share of elderly widows or widower, or even empty-nesters, together as many as one-third of persons, may prefer and enjoy an urban lifestyle, and apartment living. These are the people, for example that are flocking into a growing Seattle, bidding up the price of housing, to take up jobs at Amazon and similar businesses, and even supporting planning calls for replacing a sizeable share of single family homes, with higher density housing.

    But this phenomenon ignores the further housing reality that the other two-thirds of people are in families, with children or other relatives, or even unrelated people who rent rooms, who much prefer homes on lots, with some private space. Even those young singles jumping into downtown Seattle may marry, have children, and as they have done generation after generation, and look, yes, for homes with yards and space for a car, so they can go and explore the environs beyond the city.

    What’s out there?

    Table 1 summarizes the national data on population living in different kinds of housing. For whatever reasons you will not find this information in any census publication or city or state reports! They are quite difficult to find and require gleaning from PUMS (Public Use Micro Sample) data.

    Table 1 Shares of population by Type of Housing, 2010
    Type # Units % of Units  Population % of population     Ave HH Size
    Single family 76.5 67.4 216.6 72.2 2.83
    Small apartments 15 13.3 37.7 12.6 2.51
    Large apartments 15.9 14 28.3 9.4 1.78
    Mobile Homes 7.4 6.5 17.2 5.7 2.2
    ALL  114 100 299.5 100 2.6
    Units and population in millions


    The key information is that single family homes. Including duplexes for which each unit a separate address account for 67.4 % of occupied housing units in 2010 (61.6 % in totally separate structures), and housed a convincing 217 million, 72.2 % of the population (not including those in group quarters), at an average household size of 2.83. Note well: that’s almost 3 out of 4!

    Mobile homes are mostly banned from big cities, but in the real world of providing shelter for the less affluent in many areas, they are 6.5% of units, housing over 17 million, another 5.7% of the population, at an average household size of 2.2.

    About 31% of units, 13.3% in structures with 2 to 9 units, and 14% in structures with 10 or more units, are in apartments, and house 22% of the population (12.6 in the smaller structures, 9.4 in the larger) at an average household size of 2.5 and 1.8 respectively, or 2.2 for all apartments. 

    The relative importance of single family homes and of apartments varies significantly across states (and cities or counties if we had the data), but this is best seen with the help of the included maps.

    It is interesting to start with mobile homes, to find out where they are most common. In 11 states over 10% of people live in mobile homes. The highest is 15.5% in SC, followed by NM at 13.9, WY, 13.2, WV, 12.9, MS, 12.6, then AL and NC, 12.1, states with high shares of less affluent people.  Most higher shares are across the warmer south, but are also high in the northern Rockies. Indeed the lowest shares are across the middle of the country from CA to New England. The lowest share is DC at 0.0, then HI, .2, but are also quite low in MA, .7, CT, .9, RI, and NJ at 1.0, mostly small and very metropolitan states. Typical states close to the average of 5.7% are AK and NH at 5.7, MO, 5.5., and NV, 5.2.    

    Apartment living is quite a bit higher in selected states. The District of Columbia is by far the highest at 56%, as it is the central city of a giant metropolitan region. Next highest is New York at 46%, actually a consequence of New York City. These are followed by MA, 35, RI, 34, HI, 34 and NJ, 30.  HI may be expected to have higher apartment shares, due to the high value of desirable land, MA, RI and NJ, because of very high metropolitan shares, including New York City suburbs. Moderate apartment shares occur in CA, 24, IL, 27, FL, 24, and NV, 25.  Average shares of 22% occur in TX, VT, NH, and MD. At the other extreme, apartment living is amazingly low (under 14%) in WV, 10.5, ID 11.9, NM, 12.9, MT, 13.5, OK, 13.8, and MN, 14—mostly less metropolitan.

    Single family homes dominate most of the country. The highest shares, over 80, are for IA, KS, MN and NE, a contiguous sub region of the north central US, and somewhat surprising, PA. Actually not surprising: PA, 18, MD, 21, DE, 15, and VA, 10, have unusually high shares of “attached” 1 unit row houses with separate numbers and yards – not the image of single family home in most of the country. Shares are almost 80 in Mormon UT and ID, and in MI. In general, with the exceptions of NY and most of New England, shares are higher across the northern and central US than across the south, perhaps because of the greater shares of mobile homes to the south. The lowest shares are in the states with the highest shares of apartments, DC, NY, but still 52%, MA, 64, RI, 65, HI, 66, and  FL, 67, but already over 2/3! Right at the US average of 72% are AK, AZ, CA, NC, NH, TX and WY, a not geographically obvious or coherent set!

    The story for metropolitan areas

    Data are available for large “millionaire” metropolitan areas. These offer few surprises, reinforcing the story from the data for states. Table 2 distinguishes the information for 52 large metro areas, and the rest of the US. The large metro areas contain a little over half of the US population (51%).

    Table 2 Population by housing types, large metropolitan areas and the rest of the US
          Metro Rest of US
    Type      Units Population  % of Pop Ave HH Size Units Population % of Pop Ave HH Size
    Sing Family          40.2 112 73 2.78 36.3 104 71 2.89
    Apartments 17.7 37 24 2.1 11.8 29 20 2.4
    Mobile 1.7 4 2.6 2.2 5.8 13 9 2.2
    All  59.6 153 100 2.57 53.9 146 100 2.71

    The share of population in single family homes differs only slightly between the large metro areas and the rest of the country, but the share of people in apartments is much higher in  the big metro areas (24 to 20), while the share of people in mobile homes  is much higher outside of the large metro areas (9 versus 2.6). The slightly higher single family share for the metro areas is a little misleading, however, because the metro set has a much higher share of an intermediate category of housing, “1 unit attached”, meaning row houses, separate addresses and yards, but of higher density than the detached single family home.

    Mobile home shares are especially lower in the biggest metro areas, most notably megalopolis, as Boston, .2 and Washington DC, .3. The highest metro share are in the south, e.g., Birmingham, 8, Tampa, 7, Riverside, 6, Jacksonville, and San Antonio, 6.

    The share of the population in single family homes  is not surprising for the most part, that is, lowest (under 70%) in most of the older and largest metro areas, NY, Boston, Chicago, San Francisco, Los Angeles, and Miami, and highest in intermediate sized across most of the country. The highest shares ae for Kansas City, 84, Pittsburgh, Oklahoma City and Richmond, 83, and Atlanta, Columbus, Detroit and St. Louis, 82. The cases of Philadelphia, Baltimore, Washington, and Richmond are special, as the high single family shares are actually a result of high shares of row housing, e.g., 32% in Philadelphia, 24 in Baltimore, 20 in Washington, 10 in Richmond.

    The population shares in apartments also reflect the size and importance of the metro area, with the addition of Miami, highest in New York Metropolitan Area, 41, (52% in the NYC part), San Francisco-Oakland, 33, Chicago, 32, Providence,33, Boston, 41, LA-Anaheim, 31.5 (33 in the LA part), and Miami, 30. The lowest shares tend to be in the interior eastern US, plus Richmond in the east and Riverside in the west: Birmingham and Oklahoma City, 12, Riverside and Pittsburgh, 13, and Jacksonville, Kansas City, Richmond and St. Louis, 14. Metro areas in a middle range (23 to 25%) include Seattle, Hartford, New Orleans, Baltimore, Buffalo, Las Vegas, and San Jose, middle sized and scattered across the country.

    Average household size

    Average household size in part reflects the kind of housing, but equally the age and ethnic composition of the population, not part of this data set. The average US number is 2.63, but 2.57 in the metro areas, and 2.71 for the rest of the US. It is highest for single family homes, 2.83 for the US, 2.78 in the metro set, 2.89 for the rest of the country, 2.2 for apartment dwellers and 2.2 for mobile home folks. As expected average values for smaller apartment structures (2 to 9) is higher in the smaller buildings than in larger ones, 2.5 compared to 1.8.

    Average values for states vary from 2.22 in ND (due to a combination of an influx of energy workers, high share of college students, and remaining seniors), 2.26 in the District of Columbia (large share of single persons), 2.35 in ME, 2.36 in IA, and 2.237 in WV (older populations) to the very highest in UT (well..) at 3.17, then CA at 2.95, AK 2.86, AZ and TX, 2.84, reflecting ethnic composition. Right in the middle are NY and DE, 2.63. Metro area average household size varies from a high of 3.1 for Riverside, then 3 for Anaheim, 2.91 for San Jose, 2.83 for Los Angeles and Dallas, all with high Hispanic populations  and levels of young immigrants.  At the low size end are NY at 1.98, the only area under 2, reflecting the high share of apartments and of singles, particularly in New York City, then Jacksonville, 2.23, Tampa, 2.28, Richmond, 2.35, and Orlando, 2.36, — in Florida a result of in-migration of older households without children.   The middle areas at 2.57 are Las Vegas, Miami, and Minneapolis.

    Conclusion

    There is no likelihood of the demise of the single family home, or even of significant attrition, simply because the large majority of people demand them. But there will be some reduction in a few areas where demand for housing is high but the land supply constrained, geographically or by growth management, as in Seattle, coastal California, New York, and Boston, with high shares of non-families. On the other hand, continuing concentration of population in giant metropolitan areas is not inevitable, as a costs drive people elsewhere. In the end, barring a national clampdown on suburbs, the balance of housing types may not change greatly.  

    Richard Morrill is Professor Emeritus of Geography and Environmental Studies, University of Washington. His research interests include: political geography (voting behavior, redistricting, local governance), population/demography/settlement/migration, urban geography and planning, urban transportation (i.e., old fashioned generalist).

  • Preparing for the Impact of Driverless Cars

    The buzz has been building about driverless cars for a while now, and this week I want to talk about a couple of new articles on the topic followed by my own thoughts.  The first is a McKinsey article based on MIT research:

    Full speed ahead: How the driverless car could transform cities

    “By combining ride sharing with car sharing—particularly in a city such as New York—MIT research has shown that it would be possible to take every passenger to his or her destination at the time they need to be there, with 80 percent fewer cars

    Clearing the roads of four out of five cars has momentous consequences for cities, by measures such as environment, traffic, efficiency, and even parking. In most cities, for example, designated parking accounts for a huge amount of land, which ends up being useless for most of the day. With fewer cars, much of this space could be freed for other uses. Such reductions in car numbers would also dramatically lower the cost (and related energy consumption) of building and maintaining the roads. One engineering study found that automation could quadruple capacity on any given highway. And, of course, fewer cars also means less noise and a smaller environmental impact. 

    Driving patterns of individual cars can be algorithmically optimized as well. Because autonomous vehicles don’t get lost, they create less congestion and shorten travel times. More important, self-driving cars would also make for much safer roads; more than 30,000 people a year die in automobile-related deaths in the United States every year and 1.2 million worldwide.”

    I do have one quibble with the assertions above: yes, there will be fewer cars, but I suspect there will be a similar number of car *trips* (for example, one taxi providing 20 trips/day instead of 10 owned cars each providing two trips/day), and that means just as much wear and tear on the roads,unless a lot more car sharing happens (i.e. one vehicle carrying multiple people on separate trips at the same time).  More on that later…

    The second article is from The Economist and chock full of interesting facts:

    • Cars sit idle 96% of the time.
    • Google thinks self-driving taxis could have utilizations of 75%+.
    • Stanford estimates we’ll need 70% fewer cars to provide the same trips.
    • “The idea that autonomous vehicles will be owned and used much as cars are today is a “tenuous assumption”, says Luis Martinez of the International Transport Forum, a division of the OECD, a think-tank. Fleets of self-driving vehicles could, he says, replace all car, taxi and bus trips in a city, providing as much mobility with far fewer vehicles. An OECD study modelling the use of self-driving cars in Lisbon found that shared “taxibots” could reduce the number of cars needed by 80-90%. Similarly, research by Dan Fagnant of the University of Utah, drawing on traffic data for Austin, Texas, found that an autonomous taxi with dynamic ride-sharing could replace ten private vehicles. This is consistent with the finding that one extra car in a car-sharing service typically takes 9-13 cars off the road. Self-driving vehicles could, in short, reduce urban vehicle numbers by as much as 90%.”
    • 94% of accidents are from human error, and these could be eliminated.
    • “A study by the Eno Centre for Transportation, a non-profit group, estimates that if 90% of cars on American roads were autonomous, the number of accidents would fall from 5.5m a year to 1.3m, and road deaths from 32,400 to 11,300.”
    • “As well as being safer, self-driving vehicles would make traffic flow more smoothly, because they would not brake erratically, could be routed to avoid congestion and could travel close together to increase road capacity. A study by the University of Texas estimates that 90% penetration of self-driving cars in America would be equivalent to a doubling of road capacity and would cut delays by 60% on motorways and 15% on suburban roads. And riders in self-driving vehicles would be able to do other things. Morgan Stanley calculates that the resulting productivity gains would be worth $1.3 trillion a year in America and $5.6 trillion worldwide. Children, the elderly and the disabled could gain more independence.” 
    • “With cars in constant use, much less parking space would be needed. Parking accounts for as much as 24% of the area of American cities, and some urban areas have as many as 3.5 parking spaces per car; even so, people looking for parking account for 30% of miles driven in urban business districts. By liberating space wasted on parking, autonomous vehicles could allow more people to live in city centres; but they would also make it easier for workers to live farther out. If you can sleep on the journey a longer commute becomes feasible, notes Mr Fagnant, who foresees a “simultaneous densification of cities, and expansion of the exurbs”.

    Again, I think it’s worth noting that even though the number of vehicles drops, the amount of vehicle-miles probably stays pretty steady or maybe even increases as people can be productive on longer commutes.  In essence, there will be fewer vehicles, but they will get used up/worn out much more quickly from their high utilization (similar to buses today), so the car industry may be safe from complete collapse, although it will certainly be massively disruptive.

    A key question is how much car sharing will occur, which reduces prices and increases efficiency by picking up and dropping off multiple people along routes.  It can be a bit awkward sharing a vehicle with strangers.  I would not be surprised to see someone like Uber custom design a vehicle with individual personal compartments.  Imagine 5-6 private individual seating compartments in a 6-door SUV-sized vehicle.  When it pulls up, an indicator tells you which door to get into for your compartment, and then alerts you again when it’s time for you to get out, based on the destination you put into your smart phone.  Private ride, shared prices and efficiency – best of both worlds.  Mass adoption of shared rides would solve our traffic congestion problems almost overnight.

    A couple of additional thoughts: If most accidents get eliminated, do we still need shoulders? Maybe those could be converted to extra lanes?  The same for street parking if vehicles are continuously utilized – long-term those spaces might be convertible to additional lanes, adding surface street capacity.  Or in some cases, it might make sense to expand the sidewalk/public realm into that space instead.

    So what should cities be doing now to prepare for this future?

    1. Loosen up or even eliminate minimum parking requirementsnow so available parking starts shrinking naturally over the next few years.  This will also enable greater infill and density in cities as well as supply much-needed new housing stock.
    2. Stop investing in new rail transit – they’re not going to be able to achieve their payback before this revolution (if they ever could in any case).  Managed-lane networks are a better investment, as they can be used for buses, HOVs, and toll-payers now, and easily switched over to automated vehicles later.

    It’s going to be a brave, brave new world…

    Tory Gattis is a Founding Senior Fellow with the Center for Opportunity Urbanism, and co-authored the original Opportunity Urbanism studies. Tory writes the popular Houston Strategies blog and its twin blog at the Houston Chronicle, Opportunity Urbanist, where he discusses strategies for making Houston a better city. He is the founder of Coached Schooling, a startup to create a high-tech network of affordable private schools ($10/day) combining the best elements of eLearning, home and traditional schooling to reinvent the one-room schoolhouse for the 21st century. Tory is a McKinsey consulting alum, TEDx speaker, and holds both an MBA and BSEE from Rice University.

    By Driving_Google_Self-Driving_Car.jpg: Steve Jurvetsonderivative work: Mariordo [CC BY 2.0], via Wikimedia Commons.

  • Urban Rebirth in a Cincinnati Rowhouse

    I filmed this story in Cincinnati’s Over-the-Rhine neighborhood. As always, my far more talented friend Kirsten Dirksen did the editing. There are also glimpses of other nearby neighborhoods such as East Walnut Hills and some views for the city taken from across the Ohio River in Kentucky. Michael Uhlenhake is an architect and long time resident of the city. The story of his own practice and home renovation follows the trajectory of the city as a whole.

    Rust Belt cities like Cincinnati, Pittsburgh, and Buffalo are all much better than many people imagine. I tell folks that if you want Brooklyn, or Portland, or Wicker Park in Chicago, or the Mission in San Francisco, but at 1/10th the price… go to these fabulous, but seriously undervalued smaller cities in the Midwest. Not only will you save a huge amount of money, but waves of cool people have already started to colonize these neighborhoods ahead of you. You won’t be a lone pioneer.

    I love the magnificent architecture, the cool people, and the gorgeous natural beauty that surrounds the city. And I’m incredibly excited that many of the best historic neighborhoods are coming back to life after a fifty year slumber brought on by middle class exodus to the suburbs, deindustrialization, and general neglect. There’s a serious pent up market demand for vibrant, mixed use, walkable neighborhoods all across the country with shockingly little supply. We just haven’t built places like this since World War II and there’s a hunger for it in the real estate market. After decades of decline and abandonment Cincinnati is being repopulated by a new generation of people who value urban living.

    Check out this similar video from Walnut Hills in Cincinnati.

    And here’s one from Yellow Springs, Ohio if a small college town in the country is more your style.

    John Sanphillippo lives in San Francisco and blogs about urbanism, adaptation, and resilience at granolashotgun.com. He’s a member of the Congress for New Urbanism, films videos for faircompanies.com, and is a regular contributor to Strongtowns.org. He earns his living by buying, renovating, and renting undervalued proper

  • Obama, the Left Downsizing the American Dream

    Barack Obama has always wanted to be a transformational president, and in this, at least, he has been true to his word. The question is what kind of America is being created, and what future does it offer the next generation.

    President Obama’s great accomplishment, arguably, has been to spur the evolution of a society that formerly rested on individual and familial aspiration, and turn it into a more regulated and centralized regime focused on broader social and environmental concerns. This tendency has been made much stronger as the number of Americans, according to Gallup, who feel there is “plenty of opportunity ahead” has dropped precipitously – from 80 percent in 1997 to barely 52 percent today.

    The shift away from the entrepreneurial model can also be seen in the constriction of loans to the small-business sector. Rates of business start-ups have fallen well below historical levels, and, for young people in particular, have hit the lowest levels in a quarter century. At the same time, the welfare state has expanded dramatically, to the point that nearly half of all Americans now get payments from the federal government.

    In sharp contrast to the Bill Clinton White House, which accepted limits on government largesse, the newly emboldened progressives, citing inequality, are calling for more wealth transfers to the poorer parts of society, often eschewing the notion that the recipients work to actually improve their lives. The ever-expanding regulatory state has powerful backing in the media, on campuses and among some corporations. There is even a role model: to become like Europe. As the New York Times’ Roger Cohen suggests, we reject our traditional individualist “excess” and embrace, instead, Continental levels of material modesty, social control and, of course, ever-higher taxes.

    Read the entire piece at The Orange County Register.

    Joel Kotkin is executive editor of NewGeography.com and Roger Hobbs Distinguished Fellow in Urban Studies at Chapman University, and a member of the editorial board of the Orange County Register. He is also executive director of the Houston-based Center for Opportunity Urbanism. His newest book, The New Class Conflict is now available at Amazon and Telos Press. He is also author of The City: A Global History and The Next Hundred Million: America in 2050. He lives in Orange County, CA.

    Barack Obama Photo by Bigstock.