Blog

  • Rethinking the Scandinavian Model

    During a tour to Paris, Bruce Springsteen explained that his dream was for the US to adapt a Swedish style welfare state. The famous musician is far from alone in idealizing Nordic policies. The four Nordic nations (Denmark, Finland, Norway and Sweden) are often regarded as prime role-models the policies to be emulated by others. Internationally, advocates of left of centre policies view these countries as examples of how high tax social democratic systems are viable and successful. Paul Krugman, for example, has said: “Every time I read someone talking about the ‘collapsing welfare states of Europe’, I have this urge to take that person on a forced walking tour of Stockholm”.

    This admiration has a long history. In the mid-1970s Time Magazine described a country that sounded much like a utopia. “It is a country whose very name has become a synonym for a materialist paradise”, the international magazine wrote and continued to report about Sweden: “No slums disfigure their cities, their air and water are largely pollution free… Neither ill‑health, unemployment nor old age pose the terror of financial hardship.” Similarly, political scientist John Logue argued in 1979: “A simple visual comparison of Scandinavian towns with American equivalents provides strong evidence that reasonably efficient welfare measures can abolish poverty as it was known in the past; economic growth alone, as the American case indicates, does not”. Logue believed that the greatest threat to the Nordic welfare states was that they were too successful; eliminating social problems to such a degree that people forgot the importance of welfare policies.

    The high regard comes as no surprise. Nordic societies are uniquely successful. Not only are they characterised by high living standards, but also by other attractive features such as low crime rates, long life expectancy,  high degrees of social cohesion and even income distributions. Various international rankings conclude that they are amongst the best, if not the best, places in the world in which to live. One example is the “Better Life Index”, complied by the OECD. In the 2014 edition of the index Norway was ranked as the nation with the second highest level of well-being in the world, followed by Sweden and Denmark in third and fourth position. Finland ranked as the eighth best country.

    The OECD “Better Life Index”


    1. Australia

    2. Norway

    3. Sweden

    4. Denmark

    5. Canada

    6. Switzerland

    7. United States

    8. Finland

    9. Netherlands

    10. New Zealand


    If one disregards the importance of thinking carefully about causality, the argument for adopting a Nordic style economic policy in other nations seems obvious. The Nordic nations – in particular Sweden, which is most often used as an international role‑model – have large welfare states and are successful in a broad array of sectors. This is often seen as proof that a ”third way” policy between socialism and capitalism works well, and that other societies can reach the same favourable social outcomes simply by expanding the size of government. If one studies Nordic history and society in‑depth, however, it quickly becomes evident that the simplistic analysis is flawed.

    To understand the Nordic experience one must bear in mind that the large welfare state is not the only thing that sets these countries apart from the rest of the world. The countries also have homogenous populations with non-governmental social institutions that are uniquely adapted to the modern world. High levels of trust, strong work ethic, civic participation, social cohesion, individual responsibility and family values are long-standing features of Nordic society that pre-date the welfare state. These deeper social institutions explain why Sweden, Denmark and Norway could so quickly grow from impoverished nations to wealthy ones as industrialisation and the market economy were introduced in the late 19th century. They also play an important role in Finland’s growing prosperity after the Second World War.

    Take Sweden as an example. In 1870 free markets were introduced in this agrarian society. During the coming 100 years Sweden combined low taxes, liberal regulations and strong working ethics to experience an unrivalled growth rate in Europe. In 1870 Sweden’s GDP per capita was 57 per cent lower than in the UK. In 1970 it had risen to become 21 per cent higher. The shift towards high taxes and state involvement actually began   occurred around 1970, resulting in a long-lasting period of stagnation that was broken through ambitious market reforms during the 1990s and onward.

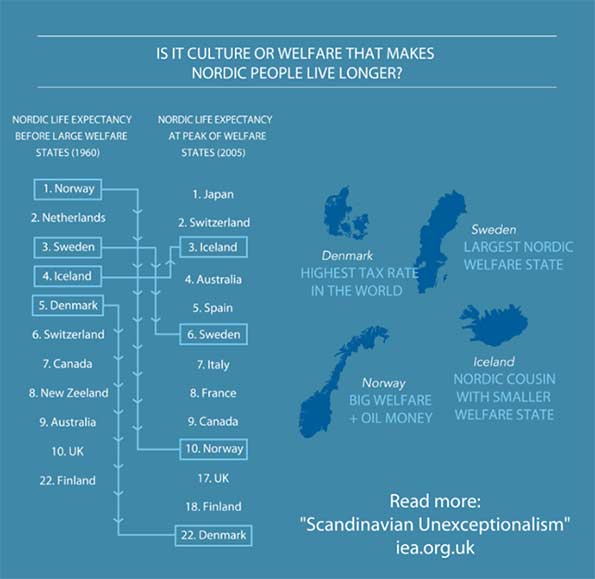
    Perhaps even more interestingly, even the social progress that Nordic countries are admired for developed during the latter part of the 19th century and the first half of the 20th century, developed not under socialism but at a time when Nordic countries combined free markets and low taxes with small (and efficient) welfare states. Researchers have for example shown that it was during this period that Sweden and Denmark developed a relatively equal income distribution. Long life expectancy is another example. In the picture below I show the life expectation at birth is shown for various OECD nations in 1960 – when Nordic nations had small welfare states – and 2005 – when Nordic welfare states were at their peak. In both periods Nordic countries were characterized by relatively long life expectancy, but if anything, this was more the case when the countries had small rather than large welfare states. The reason is simply that everything is not politics, cultural attributes such as a love for nature and healthy diets explains much of Nordic citizens good health.

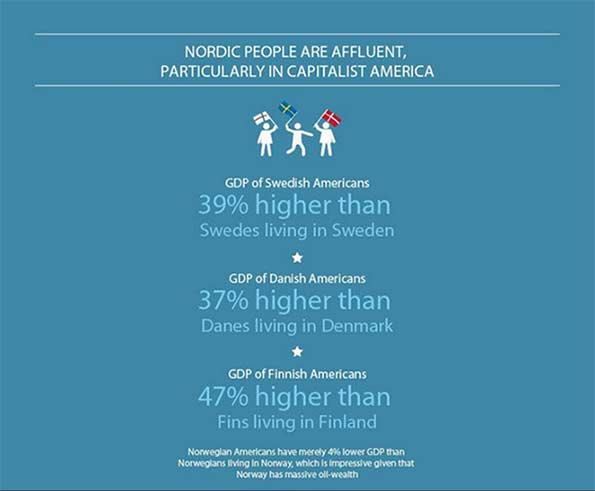
    Similarly, it comes as no surprise that descendants of the Nordics who migrated to the US in the 19th century are still characterised by favourable social outcomes, such as a low poverty rate and high incomes. In fact, as shown below, Nordic Americans have considerably higher living standard in capitalist America than their cousins in the Nordics. This is interesting, since those Nordic citizens who migrated to the United States in large groups during the 19th and 20th centuries were anything but an elite group. Rather, it was often the poor who left for the opportunities on the other side of the Atlantic.

    A key lesson from the success of Nordic society lies in what can broadly be defined as “culture matters”. We should not be surprised that it is these nations, with their historically strong work ethic and community-based social institutions, t  have had fewer adverse effects from their welfare states and are therefore used as the poster child for those wishing to extol the benefits of active welfare policies. On the other hand, Southern European countries with similar sized welfare states and size of government have had less favourable outcomes.

    Paul Krugman is right in noting that a forced walking tour of Stockholm disproves the idea of the collapsing welfare states of Europe. Nordic societies have not collapsed under the weight of welfare policies, particularly since they have lately adopted by introducing market reforms, reducing the generosity of welfare programs and cutting taxes. Such a tour may perhaps also be wise for Krugman himself, in teaching that Scandinavian countries have been rather unexceptional. The normal economic rules apply: incentives, economic freedom, a strong self-sufficient culture and a regime of good governance all matter when it comes to economic success. The question that remains is whether Scandinavian countries will continue their return to the free-market roots that have historically served them so well. If so, the Nordic culture of success can in combination with sound policies allow growth, innovation and entrepreneurship to flourish.

    Dr. Nima Sanandaji is a research fellow at CPS, and the author of “Scandinavian Unexceptionalism – Culture, Markets and the Failure of Third-Way Socialism”. The book, which was recently released is currently being translated to a number of different languages. The entire book is available through the Institute of Economic Affairs which has published it.

  • What Jane Jacobs Got Wrong About Cities

    Few people have had more influence on thinking about cities than the late Jane Jacobs.

    The onetime New Yorker turned Torontonian, Jacobs, who died in 2006, has become something of a patron saint for American urbanists, and the moral and economic case she made for urban revival has been cited by everyone frompundits and think tanks to developers.

    However, though widely celebrated for her insights and unabashed embrace of dense urbanism, Jacobs may ultimately prove more influential than relevant. Her writing was often incisive and inspiring, particularly when she opposed planning and overdevelopment and embraced the role of middle-class families in cities. But the urban revival that has actually taken place is at variance with her own romantic version of cities and how they work.

    Currently the American cities that are doing best are not those with a flourishing middle class but those have become the preferred playgrounds of the rich and famous—New York, San Francisco, even Washington, D.C. At the same time, vast portions of urban America remain cut off from society’s mainstream.

    The Nature of the New Urban Revival

    When Jacobs published her most important work, The Death and Life of Great American Cities,in 1961, America’s cities were clearly in trouble. Racial tensions and a massive flight to suburbia were undermining the promise of cities, and the only response of planners at the time seemed to be to expand freeway access, tear down old neighborhoods, construct massive apartment blocks, and subsidize big employers.

    Jacobs rightly opposed these approaches, and constructed a far more human and enduring vision of urbanism. Her appealing perspective was based on middle-class neighborhoods, families, and grassroots economic activity. Her maxim about the best role for places remains a guiding light to those who care about upward mobility: “A metropolitan economy, if it is working well, is constantly transforming many poor people into middle-class people, many illiterates into skilled people, many greenhorns into competent citizens. … Cities don’t lure the middle class. They create it.”

    Yet when cities did begin to come back—a handful in the ’80s and then again more around the time of the millennium—the revivals were in many ways the opposite of her grassroots vision. Instead of creating more family-oriented middle-class neighborhoods, the urban revival ended up being based on “luring” the affluent, the still forming young person, or the accomplished, childless professional than generating a new middle class.

    Witold Rybczynski noted in 2010 that the rise of successful urban cores increasingly has little in common with Jacobs’s romantic bottom-up organic urbanism:

    “The most successful urban neighborhoods have attracted not the blue-collar families that she celebrated, but the rich and the young. The urban vitality that she espoused—and correctly saw as a barometer of healthy city life—has found new expressions in planned commercial and residential developments whose scale rivals that of the urban renewal of which she was so critical. These developments are the work of real estate entrepreneurs, who were absent from the city described … but loom large today, having long ago replaced planners and our chief urban strategists.”

    As Rybczynski suggests, the current rise of “urban vitality” derives not from the idiosyncratic, diverse and, if you will, democratic form that Jacobs celebrated but in a more manufactured matter that at times outdoes suburbs for conformity and boredom.

    The Evisceration of the Urban Middle Class

    Jacobs’s vision failed in large part because today’s cities play a different economic role than they did in the past. The economic basis of her New York—small businesses, manufacturers, business service firms employing masses of middle-class workers—has declined while the city has evolved into what Jean Gottman called the “transactional metropolis,” dependent on the most elite financial services, high-end consumption, and the all too present media industry.

    This urban economy has many strengths but increasingly relies on the rich. A Citigroup study suggested that cities, particularly New York and London, have become “plutonomies”—economies driven largely by the wealthy class’s investment and spending. In this way the playground or luxury cores serve less as places of aspiration than geographies of inequality.

    New York, for example, is by some measurements the most unequal of American major cities: Gotham’s 1 percent earns a third of the entire city’s personal income—almost twice the proportion for the rest of the country.

    Other luxury cores exhibit similar patterns. A 2014 recent Brookings report found that virtually all the most unequal large central cities—with the exception of Atlanta and Miami—are dense, luxury-oriented cities such as San Francisco, Boston, Washington, New York, Chicago, and Los Angeles. Although high-wage jobs have increased in these metropolises, the bulk of new employment in cities like New York has been in low-wage service jobs.

    As urban studies author Stephen J.K. Walters notes, these cities tend to develop highly bifurcated economies, divided between an elite sector and large service class. He notes this is “the opposite of [Jane] Jacobs’s vision of cities” that relied on “transforming” poor people into the middle-class people

    Even diversity, often cited by Jacobs as a great asset of cities, has suffered. Among the most successful cities today are what analyst Aaron Renn has labeled “the white cities”—places like Boston, San Francisco, Seattle, and Portland, Oregon—which have historically been home to relatively small and now shrinking, minority populations. San Francisco’s black population is 35 percent lower than what it was in 1970. In the nation’s whitest major city, Portland, African-Americans are being driven out of the urban core by gentrification, partly supported by city funding. Similar phenomena can be seen inSeattle and Boston, where long existing black communities are rapidly shrinking.

    In the more diverse big cities like Los Angeles, New York, and Chicago, gentrification takes place alongside growing concentrations of poverty. It is often forgotten, according to demographer Wendell Cox, that 80 percent of the increase in urban core population in the last decade was from poor people; overall, despite the growth of poverty in suburbs, the core poverty rate remains more than twice as high.

    Nor is this situation necessarily improving. During the first 10 years of the new millennium, neighborhoods with entrenched urban poverty actually grew, increasing in numbers from 1,100 to 3,100 and in population from 2 million to 4 million. “This growing concentration of poverty,” note urban researchers Joe Cortright and Dillon Mahmoudi (PDF), “is the biggest problem confronting American cities.”

    We see this in places like Brooklyn and Chicago, two much-hyped epicenters of urban gentrification. Brooklyn’s poorer sections—a quarter of the residents are onfood stamps—have become even more so, notes analyst Daniel Hertz. Incomes between 1999 and 2001, he notes, dropped overall, falling in the poorer areas even as they soared in the more gentrified neighborhood closer to Manhattan and surrounding Prospect Park.

    Hertz found similar, if more extreme, phenomena in Chicago, which has also seen an unwelcome return to high crime rates, particularly in its poorer sections. Gentrification has indeed expanded into formerly working- and middle-class neighborhoods, but poverty and despair still characterize much of the city. As Chicago urban analyst Pete Saunders has put it: “Chicago may be better understood in thirds—one-third San Francisco, two-thirds Detroit.”

    Here Comes the Childless City

    Arguably Jacobs’s biggest miscalculation related to urban demographics. As H.G. Wells predicted well over a century ago, cities now depend in large part on affluent, childless people, living what Wells labeled a life of “luxurious extinction.” Jacobs’s contemporary, the great sociologist Herbert Gans, already identified a vast chasm between suburbanites and those who favor urban core living who he identified as “the rich, the poor, the non-white as well as the unmarried and childless middle class.”

    Jacobs never got this point, perhaps because she instinctively hated where families were in fact headed: the suburbs. Like many intellectuals in the ’50s and ’60s, she saw no need for suburbs, even as they experienced explosive growth, just dense city surrounded by traditional countryside.

    Perhaps nothing of Jacobs seems more dated than her assertion that “suburbs must be a difficult place to raise children.” She lovingly portrayed neighborhoods like her own West Village as ideal places where locals watched out for each other. She wrote about how “Mr. Lacey, the locksmith, bawls out one of my sons for running into the street, and then later reports the transgression to my husband as he passes the locksmith shop. Mr. Lacey, with whom we have no ties other than street propinquity, feels responsible for him to a degree.”

    At best, Jacobs’s compelling portrait from 1961 is something of an anachronism. Families in urban apartments today, notes Cornell researcher Gary Evans (PDF), generally have far weaker networks of neighbors than their suburban counterparts, a generally more stressful home life, and significantly less “social support.” Toronto author Phillip Preville notes, “In the years since, all the Mr. Laceys of the world have died and gone to downtown heaven,” he notes. “We can all talk Jane’s talk, but some people are pickled in Jane’s brine.”

    Certainly statistics back up Preville’s assertion. Greenwich Village today now largely consists of students, wealthy people, and pensioners. Despite the presence of many young people, children and teens between 5 and 17 account for only 6 percent of the Village’s population, far below the norms for New York City (PDF), and less than half the 13.1 percent found across the United States’s 52 largest metropolitan areas. Overall, Manhattan has among the lowest percentage of children in the country; a majority of its households are made up of singles.

    This pattern holds across the country. According to census data, in 2011 children 5-14 constitute about 7 percent in core districts across the country, roughly halfthe level seen in suburbs and exurbs. By 2011 people in their 20s constitute roughly one-quarter of the residents in urban cores, but only 14 percent or fewer of those who live in suburbs, where the bulk of people go as they start to reach the point of establishing families.

    Even in Toronto, generally seen as one of the world’s most livable cities and Jacobs’s chosen home, Statistics Canada notes that for every person who moved from the hinterlands to the city, 3.5 moved towards the periphery. The people most likely to move out are 25 to 44, people entering the stage of family formation. As one Torontonian, who recently moved to the suburbs, observed: “The big city has its uses. It served me well, and I served it back. Living in Toronto enabled me to transform my life in ways I dearly wanted: marriage, fatherhood, career advancement. That transformation has brought with it needs that Toronto cannot adequately provide: personal space, affordability, an emphasis on community over privacy. The intensity and the anonymity of the city now hinder my life more than they help. Simple as that. I’m outta here.”

    Overall, high-density cores, whether in Canada, America, or East Asia, consistently exhibit the lowest percentages of children. The far more ultra-dense cities of East Asia—Hong Kong, Singapore, and Seoul—exhibit the lowest fertility rates on the planet (PDF), sometimes less than half the number required simply to replace the current population. Due largely to crowding and high housing prices, 45 percent of couples in Hong Kong say they have given up on having children.

    In Asia people have few opportunities to move to lower-density housing. But in the United States, with abundant and often much cheaper land, super-urbanity often serves as a kind of way station in which people spend only a portion—often an exciting and career-enhancing one—of their lives. But when they grow older, and particularly when they decide to start families, they tend to leave for the periphery.

    Getting Beyond Nostalgia

    Nostalgia makes people feel good. Some still dream about a coming revival of diverse, child-friendly, dense city neighborhoods. They dream, in the words of oneauthor, of bringing us “back to the way we were, when most people lived in cities, did not own a car, walked or took the bus or train to work, and lived in much smaller residences.”

    Wishing to return to something that last predominated a half-century ago does not mean it will occur. Just as conservatives who hearken for a return to the ’50s are sure to be disappointed, urban advocates who suggest a “return to the city” for middle-class families will be as well. Both minorities and millennials, often thought of as spearheading a “back to the city” drive, are, according to most indicators, moving out to the suburbs as they enter their 30s and start families.

    Dense urbanity, of course, remains a huge contributor to the nation’s economy and culture. Urban centers are great places for the talented, the young, and childless affluent adults. But for most Americans, the central city offers at best a temporary lifestyle. It does not fit with what people can afford and where they want to live. There is a reason why 70 to 80 percent of Americans in our metropolitan areas live in suburbs, and those numbers are not likely to change appreciably in the coming decade.

    Cities, as Jacobs hoped, have indeed experienced a renaissance, but not in the form she preferred. To be sure, this revival is a hell of lot better than the urban dystopia that developed in the years after Jacobs’s Death and Life of Great American Cities first appearedBut it’s time to recognize that we are not seeing a renaissance of the kind of middle-class urbanity that she loved and championed. That city has passed into myth, and, unless society changes in very radical ways, it is never going to come back.

    This piece originally appeared at The Daily Beast.

    Joel Kotkin is executive editor of NewGeography.com and Roger Hobbs Distinguished Fellow in Urban Studies at Chapman University, and a member of the editorial board of the Orange County Register. He is also executive director of the Houston-based Center for Opportunity Urbanism. His newest book, The New Class Conflict is now available at Amazon and Telos Press. He is also author of The City: A Global History and The Next Hundred Million: America in 2050. He lives in Orange County, CA.

    By Phil Stanziola [Public domain], via Wikimedia Commons

  • Special Report: Maximizing Opportunity Urbanism with Robin Hood Planning

    This is the first section of a new report authored by Tory Gattis for the Center for Opportunity Urbanism titled Maximizing Opportunity Urbanism with Robin Hood Planning. Download the full report (pdf) here.

    Across America and the developed world, we face a well-reported crisis of income stagnation, rising inequality, a declining middle class, and a general lack of broad prosperity. Yet contemporary urban planning seems disconnected from this crisis, focusing instead on pedestrian aesthetics, environmentalism, and appealing to the supposed preferences of the wealthy and the “creative class.” This approach increasingly dominates urban thinking, expressed often as New Urbanism or Smart Growth. In this perspective, dense and usually older cities like New York, Portland, and San Francisco have been held up as models. For the most part, planners see their world through the perspective of an architect – an architect of the physical form of cities. But what if they tried the perspective of an economist – an architect of opportunities for people to have a better life?

    Cities matter far more than they used to as engines of opportunity and upward social mobility – the very essence of the American Dream. As the basis of the economy has shifted from industry to services, proximity to others now matters more than ever before. A factory can be anywhere and ship its products anywhere, but, generally speaking, most services need to be in-person. This is pushing more and more of the population to agglomerate around not so much cities, as defined by their political boundaries, but major metros, including numerous suburban rings, where the vast majority of the population resides. In many metros, limited housing supply has driven up home prices and rents to levels where much of the middle and working classes are either unable to buy or must pay a heavy portion of their incomes in mortgages or rents.

    This is occurring as economic and technological factors have directed ever more wealth to a relatively small population of elites, whose demand for specialized services – whether personal spending or that of the corporations they control – has become a major part of the economy. Economic opportunity is driven not just by proximity to others in general, but by proximity to the very small but critically influential super-affluent class – what Citigroup research calls the “Plutonomy”. iv In some markets, such as Miami, New York and San Francisco, the locational preferences of this class – who often have several residences and many are foreign buyers – has been yet another driver of major metro agglomeration and higher housing prices, particularly where there are strong land use regulations.

    Family sizes have shrunk and reduced fertility rates are leading towards destabilizing demographic implosions in Europe, Japan, and China – and the U.S. trend is moving in the same direction.vi As nations seek to improve fertility rates, one of the greatest challenges is a shortage of family-friendly housing with sufficient space. If that space is not affordable, then people do the next best alternative: shrink their family size. Whereas families used to be comfortable with multiple children per bedroom, the modern standard is one bedroom for every child – not to mention the “home office” for virtual work by the dual-income parents. With the large suburban house both regulatory out-of-favor and unaffordable in some metropolitan areas, families are forced to shrink to live in expensive density, or pay very high prices and rents for what used to be considered standard middle class homes.

    The planning community generally has few answers to these dilemmas, but in practice the steps they often advocate may actually be making it worse. A dominant tenet of Smart Growth actually seeks to restrict suburban development and encourage density to contain urban expansion. Draconian regulations – and ever higher costs – are piled on any new developments. On the other side, pressure from NIMBY homeowners often limits development of any kind – including high-density. In some areas, exclusionary zoning – such as tight restrictions on multi-family housing – is used to prevent minority, disadvantaged, or lower-income populations from moving in nearby.

    All in all, the net effect is a suffocating restriction on new housing supply even as demand increases, leading to skyrocketing home prices. This has the effect of making affluent NIMBY homeowners, who are disproportionately white and older, quite happy since their homes prices, sans new competition, are almost certain to increase. But the system works like a “Robin Hood in reverse” for younger, middle and working class families that lose out. This is a major driver of inequality – in fact, recent analysis indicates that homeownership completely accounts for the rise in inequality in recent decades. xii Planners have to take a hard look in the mirror and face an uncomfortable truth: whether they have been conscious of it or not, they have been direct accomplices in the rise of inequality and the decline of the middle and working class.

    Download the full report (pdf) from the Center for Opportunity Urbanism.

    Tory Gattis is a Founding Senior Fellow with the Center for Opportunity Urbanism, and co-authored the original Opportunity Urbanism studies. Tory writes the popular Houston Strategies blog and its twin blog at the Houston Chronicle, Opportunity Urbanist, where he discusses strategies for making Houston a better city. He is the founder of Coached Schooling, a startup to create a high-tech network of affordable private schools ($10/day) combining the best elements of eLearning, home and traditional schooling to reinvent the one-room schoolhouse for the 21st century. Tory is a McKinsey consulting alum, TEDx speaker, and holds both an MBA and BSEE from Rice University.

  • The Incompetence Hypothesis to Explain the Great Recession

    Seeking an understanding of the Great Recession, I am finding that most of the 2008 financial crisis and its aftermath can be explained by incompetence. In the final weeks of writing a book on the systemic failure in US capital markets, I had to re-read the Securities and Exchange Commission (SEC) Inspector General’s 2009 report on their failure to stop Bernard Madoff despite having received credible evidence of a Ponzi scheme. The inspector concluded that it did not have anything to do with the fact that an SEC assistant director was dating (and later married) Madoff’s niece; or that Madoff had held a Board seats at important financial regulators.* Despite eight substantive complaints and two academic journal research reports over 16.5 years about problems with Madoff’s investments, Madoff was never caught. In the end he turned himself in, admitting to a $64 billion Ponzi scheme. The inspector’s conclusion: incompetence.

    In economics, ‘interest’ – whether it be self-interest or interest group pressure – is the ‘safe’ explanation for outcomes that are detrimental to the public. If interest group pressure (or even populism) is behind a bad policy decision, then it is not a ‘mistake.’ Rather, it is an intentional, rational decision as described by Chicago School economist and Nobel laureate George Stigler. However, if a policy decision is the result of bad judgment, then Stigler cannot explain it. Brazilian economist Luiz Carlos Bresser-Pereira suggests that the relevant variable in this case is incompetence. Incompetence is an independent explanatory variable; it cannot be explained in rational or historical terms.

    Incompetence arises from three sources: 1) ignorance, 2) arrogance, or 3) fear. Policy advisors and regulators may be guilty of applying theories second-hand but with great authority and self confidence. They may be ignorant of the complexities of economic theory and they may apply abstract economic theories inappropriately to specific policy problems. For example, they allowed banks to engage in a wide range of investments under the financial theory of ‘diversification.’ That theory works for portfolios but not for businesses, which need to specialize to realize the gains from their comparative advantage. Financially derived theories like this were applied automatically, transformed into a series of clichés.

    ‘Diversification’ in a portfolio of financial investments lets you increase the returns while reducing the risk. But in business it means ‘splintering’ which destroys performance capacity and increases risk. Financial institutions are tools to be used in furthering the efforts of the broad economy: the more specialized financial institutions become, the greater their performance capacity. Increased productivity from specialization comes with better quality as businesses become more adept at their specific products and services. The differences in natural aptitudes and abilities produce economic benefits when tasks are matched to capabilities. The more experience a worker has at performing a task, they more efficient they become in doing the work. As management guru Peter Drucker wrote: ‘Organizations can only do damage to themselves and to society if they tackle tasks that are beyond their specialized competence.’

    An example of an economic theory applied arrogantly is Washington’s constant fawning over ‘free market solutions’ when the rules, regulations and court decisions covering capital markets fill the bookshelves of law offices around the world. There is no such thing as a free market – no economist of value believes that the perfectly competitive market exists. The Wall Street Bailout is a good example of the third source of incompetence – fear. Consider this description of the exchange between Treasury Secretary Henry Paulson, Federal Reserve Chairman Ben Bernanke and the senior legislators from the House and Senate on Thursday, September 18, 2008:

    Sen. CHRISTOPHER DODD: Sitting in that room with Hank Paulson saying to us in very measured tones, no hyperbole, no excessive adjectives, that, "Unless you act, the financial system of this country and the world will melt down in a matter of days. "
    JOE NOCERA: Bernanke said, "If we don’t do this tomorrow, we won’t have an economy on Monday."
    Sen. CHRISTOPHER DODD: There was literally a pause in that room where the oxygen left.
    Inside the Meltdown, Frontline February 17, 2009, WGBH Educational Foundation, Boston. 

    Regardless of the source of the incompetence, the visible results are 1) failure to take correct strategic policy decisions, and 2) failure to adopt well-designed reforms.

    Policy decisions are the day-to-day management decisions that usually produce immediate results. In monetary policy, for example, these would be interest rate decisions. Interest rate policy decisions need to be made at the right time and to move rates in the right direction.

    Reforms produce medium-term outcomes that may or may not require legislative approval. The Dodd-Frank Act, which was supposed to reform Wall Street and protect Main Street, in reality created very little change but suggested that financial regulators reform their own rules. Poor reforms may be the result of incompetent designs and not just pressure from interest groups, although this also happens.

    Bresser-Pereira’s analysis offers one more alternative explanation for the cause of bad policy and reforms. Between interest and incompetence lies ‘confidence building.’ It is simply doing what is expected in an effort to gain the confidence of financial supporters. If we substitute “Goldman Sachs” for “United States” and “Wall Street” for “developed countries” in this quote from Bresser-Pereira, then his description of ‘confidence building’ is as true of Washington, D.C. as it is of Brazil:

    ‘They do not limit themselves to seeing the United States and, more broadly, the developed countries, as richer and more powerful nations, whose political institutions and scientific and technological development should be imitated. No, they see the elites in the developed countries both as the source of truth and as natural leaders to be followed. This subordinate internationalism ideology, already called ‘colonial inferiority complex’ and entreguismo**, is as detrimental to a country as old-time nationalism. What I am singling out as a major source of incompetent macroeconomic policies is the uncritical adoption of developed countries’ recommendations.’

    If we say that bad policy decisions are always rational, motivated by interest, then we must conclude that policy-makers are ‘dishonest, protecting their own interest or those of their constituencies rather than the public interest’ (Bresser-Pereira).  If this view were always true, then the world would look more like communist Russia in 1980 than the way it does today. How would entrepreneurs and consumers have financed not only the invention but the proliferation of microchips, cell phones, and personal computers that have made the world safer and easier to navigate; how would they have discovered and made widely available artificial hearts, HIV medications and targeted cancer therapies? Since 1981, the number of poor people in the world declined for the first time in history, by 375 million. Global life expectancy was 68 in 2014, up from 61 in 1980; infant mortality is down to 49.4 per 1000 live births in 2014 from 80 in 1980. Yet as a result of the havoc wrecked upon the global economy in 2008 by incompetent regulators, policy makers and bankers, global unemployment grew from 20 to 50 million while falling incomes combined with rising food prices to raise the number of undernourished people in the world by 11%.

    A solution, from this perspective, lies in cleaning house of the incompetent staff from Washington to Wall Street and improving recruiting methods to build competence for the future.

    * Madoff has a seat on the Board of the International Securities Clearing Corporation, one of the predecessor organizations to the Depository Trust and Clearing Corporation, the world’s largest post-trade processing center. Madoff was also Chairman of the NASDAQ, and had seats on the Boards at the National Association of Securities Dealers (now the Financial Industry Regulatory Authority – the same organization that failed to act on a referral letter from the SEC to stop R. Allen Stanford’s Ponzi scheme.
    **Brazilian Portguese roughly translated as ‘appeasement’ or ‘submission.’

    For more information:
    Luiz Carlos Bresser-Pereira, Latin America’s quasi-stagnation, in A Post Keynesian Perspective on 21st Century Economic Problems, Elgar, UK. http://www.bresserpereira.org.br/
    The World Factbook 2013-14. Washington, DC: Central Intelligence Agency, 2013.
    https://www.cia.gov/library/publications/the-world-factbook/index.html

    Susanne Trimbath, Ph.D. is CEO and Chief Economist of STP Advisory Services. Dr. Trimbath’s credits include appearances on national television and radio programs and the Emmy® Award nominated Bloomberg report Phantom Shares. She appears in four documentaries on the financial crisis, including Stock Shock: the Rise of Sirius XM and Collapse of Wall Street Ethicsand the newly released Wall Street Conspiracy. Dr. Trimbath was formerly Senior Research Economist at the Milken Institute. She served as Senior Advisor on United States Agency for International Development capital markets projects in Russia, Romania and Ukraine. Dr. Trimbath teaches graduate and undergraduate finance and economics.

  • The Evolving Urban Form: Jing-Jin-Ji (Dispersing Beijing)

    China’s cities continue to add population at a rapid rate, despite a significant slowdown in population growth. Although overall population is expected to peak around 2030, the urban population will continue growing until after 2050. China’s cities will be adding more than 250 million new residents in the next quarter century, according to United Nations projections. China’s cities will add nearly as many people as live in Indonesia, the world’s fourth largest country, more than live in Brazil and 10 times as many as live in Australia.

    Two of China’s six megacities (urban areas with more than 10 million population) are nearly adjacent, within 90 miles (150 kilometers) of one another. The urban areas of Beijing and Tianjin have a combined population of 35 million and are among the fastest growing in the world. This is an increase of nearly 60% from the 2000 population of 21 million.

    The Jing-Jin-Ji Megalopolis

    The faster growing of the two, Beijing, is the national capital. Beijing is encircled by five freeway standard ring roads or beltways. These are numbered 2 through 6, with the first ring road being surrounding the Forbidden City. Its population is served by a number of additional expressways and the world’s longest subway. For some time there has been discussion of integrating the metropolitan areas of a much larger region. A principal purpose is dispersion — to redistribute activities, such as government administration and manufacturing away from Beijing’s congested core to peripheral locations.

    Over the past year, there have been various announcements describing the process. The  megalopolis would be called Jing-Jin-Ji, and would be composed of Beijing, Tianjin and Hebei province. An alternative name would be the "Capital Economic Circle." The name, Jing-Jin-Ji is constructed of the last syllables of "Beijing" and "Tianjin," along with "ji," which is the pronunciation of the one character Mandarin abbreviation for Hebei.

    The Need for Dispersal

    Beijing has just become too dense and too crowded. Traffic congestion already is among the worst in the world. According to The Sydney Morning Herald, the situation has become so bad that officials intended to limit the population of the Beijing municipality (province) to 23 million, only slightly above the population that is nearing 22 million. They also intend to reduce the population of central districts by 15%.

    Important steps are already being taken. Construction has begun on a new facility to house Beijing municipality functions in the suburban district ("qu") of Tongzhou. This subsidiary center is a 40 minute drive from the city center. Tongzhou borders the municipality of Tianjin and, according to the Beijing Municipality government is itself growing about one-quarter faster than the Beijing municipality itself.

    There are also plans to move many of the manufacturing facilities that have located in Beijing to the other jurisdictions. The extent of the manufacturing dominance of Beijing is illustrated by the much larger "floating population," of Beijing, which consists of migrants from other parts of the country who lack local residence permission (hukou). According to data in the China Yearbook 2014, Beijing has more than double the ratio to its population of migrant workers as Tianjin and nearly 10 times the ratio of Hebei, which has more than two-thirds of the megalopolis population.

    One large automobile manufacturer has already completed moving out of Beijing to Huanghua, a county level city in the Hebei municipality of Cangzhou, which borders Tianjin to the south.

    Geography of Jing-Jin-Ji

    The jurisdictions comprising Jing-Jin-Ji have approximately 110 million residents. The gross land area is approximately 216,000 square kilometers (83,000 square miles), approximately the land area of Romania or the US state of Idaho. No one, however, should imagine a Phoenix or Portland type sprawl of such a magnitude. As is indicated the Table, the overall population density of Jing-Jin-Ji is only 500 residents per square kilometer (1,300 per square mile).  The largest urban areas comprise only 3.5% of the land area, yet contain approximately 40% of the population. Despite the massive urbanization of Beijing and Tianjin, and the other large urban areas, Jing-Jin-Ji has a population that is 40% rural.

    Components of Jing-Jin-Ji
    Jurisdiction Total Population (2013) Density (per KM2) Principal Urban Area Population (2015) Urban Density (per KM2)
    Beijing 21.2      1,300 20.2      5,100
    Tianjin 14.7      1,200 10.9      5,400
    Jing-Jin-Ji Core 35.9      1,300 31.1      5,200
    Baoding 10.2         500 1.3      5,900
    Langfang 4.4         700 0.5      3,800
    Canzhou 7.2         500 0.5      3,800
    Tangshan 7.5         600 2.4      8,700
    Zhangzhiakow 4.6         100 1.2      9,200
    Qinhuangdao 2.9         400 1.0      6,500
    Chengde 3.7         100 0.1      4,300
    Inner Jing-Jin-Ji 40.5         300 7.0      6,600
    Shijiazhuang 10.4         700 3.4    17,000
    Handan 9.2         800 2.0    11,900
    Xingtai 7.1         600 0.7      6,000
    Henshui 4.3         500 0.4    11,800
    Outer Jing-Jin-Ji 31.0         600 6.5    12,500
    Jng-Jin-Ji 109.2         500 44.6      5,900
    Population in millions.
    Jurisdition population from government sources
    Urban area population from Demographia World Urban Areas


    The Nearby Urban Areas

    In addition to Tianjin, other urban areas are expected to gain functions, jobs and residents from Beijing. Baoding, an urban area to the southwest of Beijing is expected to gain hospitals, educational institutions and government offices. Baoding has a population of 1.3 million and is a former capital Hebei, but was displaced by Shijiazhuang in 1967. Shijiazhuang, with a population of 3,4 million, is located  in the outer ring of Jing-Jin-Ji.

    Langfang is unusual in being a discontinuous municipality, part of which is an enclave surrounded by Beijing and Tianjin (as is Hebei province), and the other part located to the south of both jurisdictions. Langfang is in the path of growth of both Beijing and Tianjin. The urban area of Langfang is still relatively small, with 500,000 residents. The urbanization along the Jingtang Expressway through Langfang nearly reaches the development of Beijing to the northwest and Tianjin to the southeast.

    Tangshan is directly north of Tianjin and east of Beijing. Tangshan seems likely to benefit from the dispersion of functions, jobs and residences by virtue of its proximity to both of the megacities. A new high speed rail line has just been announced that would connect Tangshan with Beijing in 30 minutes. Tangshan gained international notoriety in 1976 when it was struck by a devastating earthquake (photo here) that virtually flattened the city and killed at least 240,000 people (estimates of the earthquake death toll reach 800,000). Tangshan has been completely rebuilt, with impressive modern architecture (photograph above, taken from an earthquake memorial), but not appreciated by all. One architectural critic has insensitively bloviated that the new architecture "has been more destructive to Tangshan’s urban history than the great earthquake." Today, Tangshan is an urban area of 2.4 million.

    Qinhuangdao, an urban area of 1 million, lies just beyond (northeast of) Tangshan on the way to Shenyang and China’s Dongbei (Manchuria). Qinhuangdao could profit from its well placed seaport.

    Transportation Improvements

    Important transportation improvements have been announced. There are plans to expand Beijing’s subway, which already has the highest ridership in the world and is second longest (after Shanghai). New suburban train lines will be built and new high speed rail lines will connect the cities within Jing-Jin-Ji that are farther apart. There will be considerable expansion of the already comprehensive expressway system, including Beijing’s seventh ring road, which is to be fully completed by 2017. Already, approximately 400 kilometers have been completed, much of it through the mountains to the west of Beijing.

    Decentralizing Beijing

    Jing-Jin-Ji would be China’s third megalopolis, joining with the Yangtze Delta (centered on Shanghai) and Pearl River Delta (centered on an axis from Guangzhou to Shenzhen). But Jing-Jin-Ji is substantially different and not so obvious a candidate for integration. Jing-jin-ji’s urban areas are located farther apart than in the Pearl or the Yangtze. Yet its concentration of development is greater, especially in the Beijing core, which provides much of the justification for decentralization.

    Wendell Cox is Chair, Housing Affordability and Municipal Policy for the Frontier Centre for Public Policy (Canada), is a Senior Fellow of the Center for Opportunity Urbanism (US), a member of the Board of Advisors of the Center for Demographics and Policy at Chapman University (California) and principal of Demographia, an international public policy and demographics firm.

    He is co-author of the "Demographia International Housing Affordability Survey" and author of "Demographia World Urban Areas" and "War on the Dream: How Anti-Sprawl Policy Threatens the Quality of Life." He was appointed to three terms on the Los Angeles County Transportation Commission, where he served with the leading city and county leadership as the only non-elected member. He served as a visiting professor at the Conservatoire National des Arts et Metiers, a national university in Paris. 

    Photograph: Tangshan’s modern architecture, from an earthquake memorial (by author)

  • Latino Politicians Putting Climate Change Ahead of Constituents

    Racial and economic inequality may be key issues facing America today, but the steps often pushed by progressives, including minority politicians, seem more likely to exacerbate these divisions than repair them. In a broad arc of policies affecting everything from housing to employment, the agenda being adopted serves to stunt upward mobility, self-sufficiency and property ownership.

    This great betrayal has many causes, but perhaps the largest one has been the abandonment of broad-based economic growth traditionally embraced by Democrats. Instead, they have opted for a policy agenda that stresses environmental puritanism and notions of racial redress, financed in large part by the windfall profits of Silicon Valley and California’s highly taxed upper-middle class.

    Nowhere in California is this agenda more clearly manifested than with state Senate President pro Tem Kevin de León, who represents impoverished East Los Angeles. De León has proclaimed addressing “climate change” as the Senate’s “top priority” and is calling for, among other things, disinvestment from fossil fuel companies. Rarely considered seem to be the actual impacts of these policies on the daily lives of millions of working- and middle-class Californians.

    War on Blue Collar Jobs

    Despite vastly exaggerated claims about the prospects for so-called green jobs since the passage of Assembly Bill 32, the landmark 2006 climate change law, California is adopting policies detrimental to growing the higher-wage blue-collar sector. Green policies favoring expensive alternative energy have fostered energy prices that, for industrial users, are an estimated 57 percent higher than the national average. No surprise, then, that California has produced barely half the rate of new manufacturing jobs as the rest of the nation.

    Read the entire piece at the Orange County Register.

    Joel Kotkin is executive editor of NewGeography.com and Roger Hobbs Distinguished Fellow in Urban Studies at Chapman University, and a member of the editorial board of the Orange County Register. He is also executive director of the Houston-based Center for Opportunity Urbanism. His newest book, The New Class Conflict is now available at Amazon and Telos Press. He is also author of The City: A Global History and The Next Hundred Million: America in 2050. He lives in Orange County, CA.

    By Neon Tommy (Senator Kevin De Leon) [CC BY-SA 2.0], via Wikimedia Commons

  • How To Develop Detroit

    Detroit’s downtown is gentrifying— or, to be more accurate, a very small portion of the 139 square miles that make up the city is doing so, as it becomes populated by a new generation of workers. But the city’s vast, remaining area is mostly blighted. A massive effort has been made to remove substandard and neglected homes, creating large sections ripe for redevelopment. We believe that a model community for families could be built within that devastated area, and we’ve launched a kickstarter campaign to get development going. You can look at this idea in detail on our new video, too: https://www.youtube.com/watch?v=cGOY_04k7Vw. A minimum land area of fifty acres would be a significant enough mass to provide a sustainable approach to growth. Here’s what we would like to see:

    At Rick Harrison Site Design Studio our redevelopment model is vastly different from existing models that either want to turn Detroit into farmland, or to place the existing population into high-rise projects. Both those approaches would need subsidies to be achieved. Our model takes a ‘market focused’ approach that is competitive with the cookie-cutter housing of the surrounding suburbs.

    The plans we’ve developed at well over 900 sites during the past twenty-five years have averaged a 25 percent reduction of infrastructure, compared to conventional design. This reduction of street paving and utility mains has translated into increased green space per resident. For Detroit, our goal is to eliminate 60 percent or more of the existing infrastructure, and recapture the right-of-ways for residents. That will enable us to increase density while also increasing space.

    We will start from scratch and design the main trails first. The street system will reduce both time and energy, compared with designs in the surrounding suburbs. All the homes will have interior floor plans and living spaces that coordinate with adjacent open spaces and views. And every home will have an energy savings HERS rating of 50 or better, so more of the resident funds can be used for better living, rather than going towards energy that escapes from a chimney. Elegant, meandering walkways will connect every home to the main trail system.

    A half-century ago Detroit was America’s model city. Then, segregation and racial tensions led to the riots of 1967, which created a mass exodus to the suburbs. Those residents and businesses that could afford a new home on a large lot left the city. I began my planning career in 1968, designing those Detroit suburban subdivisions.

    Let’s make Detroit a leader again by increasing living standards, connectivity, property values, tax base, open space, density, and safety while significantly decreasing construction costs, environmental impacts, energy usage, and the enormous infrastructure that currently plague the city. Detroit was once an inspiration for other cities. We’d like to make it an inspiration again.

  • The Geography of Ideology Ultra R, Ultra D and 50 to 50

    Recently I grouped all US counties into several categories, from True Believers R and D, R and D leaning groups, and also those areas that are more equally divided. In anticipating the 2016 election, I take here a brief look at a small number of counties (2012 data) that are extreme cases of R voting (over 90%, 28 counties), of D voting (over 80%, 26 counties), and of 50:50 voting (39 counties from 49.7 to 50.3 D vote). These are also shown on the maps. Note that the D counties in blue don’t look impressive, as they are small in area, but big in votes. How do these three sets differ in geography and in character?

    Set 1: Ultra Republican

    The extreme R counties are an amazing set. Ten of the 28 (8 in Utah, 2 in Idaho) are dominantly Mormon. The non-Mormon counties include 17 scattered across the high plains from Montana, 1, Nebraska, 3, Kansas, 1, Oklahoma 1, and 11 in Texas, with one outlier in eastern Kentucky. Only one is east of the 100th Meridian, famous for dividing east and west in the US. All these counties are basically conservative on social issues.

    Overall densities are far lower and rural shares far higher than for the other sets. They are overwhelmingly white (92%) and less than 1% black on average. They have the highest shares of husband-wife families, with and without children, and the lowest shares of single parent families, roommates and singles. For example the black population is essentially 0 in half the counties. Husband-wife and children households ae exceptionally high in 5 counties: Franklin, ID; and Duchesne, Morgan, Sevier, and Uintah Utah—all Mormon. The roommate share is under 2 percent in 7 counties, compared to a national average of almost 5.

    Male labor force participation averages a high 73% and unemployment a low 3.8%. As expected for these locations, farming is a frequent occupation in these counties, exceeding 10% in 8 counties, as in MT, NE, and TX. Finally church attendance is far higher than in the other sets, averaging 71% compared to 48% in the set 2 counties.  

    The Mormon counties exhibit some variation in size and settlement. Five are all rural, four are rural and small town (micropolitan), but one is a small metropolis, Utah county (Provo, with Brigham Young University), perhaps the heart of Mormon orthodoxy. The 18 non-Mormon counties include 13 small rural counties and 5 counties (all in Texas) with small cities.

    Since the total vote in these counties was only 234,000 (76,000 without Utah county!) and 92% R, it is probably not worth a Democrat candidate spending much effort in these locales. Yet it is possible that without the “negativity” of race, an Anglo woman at the top of Democratic ticket should do better in conservative white settings. 

    Set 2: Ultra Democratic   

    The extreme D counties are similarly an amazing set, just in different dimensions. The dominant characteristic is the very high minority share – in all 26 counties – and correlated with that high shares of single parent families, unemployment, and general and especially child poverty. The minority share averages 81%, with 43% black. Thirteen have high black shares: mostly southern and rural, in AL, GA, MS, but also Washington, DC, Baltimore, and Prince George, MD. Four have high Hispanic shares: TX, NM, three Native American (ND, SD, WI), and six are more racially mixed: San Francisco and Alameda, CA, Philadelphia, and 4 New York city boroughs.

    The second distinguishing feature is dense urban character and sheer size, but only for a subset of 12 counties, as 9 are rural or small town minority counties. The large urban counties include San Francisco, Alameda, Washington DC, Orleans, Prince George, Baltimore, St. Louis, Bronx, Kings, New York, Queens, and Philadelphia. These set 2 metropolitan counties are mainly coastal (plus St. Louis and Orleans),   while rural minority counties are mainly in the northern plains, (Native American) or the southern “Black belt”.

    The small city minority counties are Macon, AL (Tuskegee), Hancock, GA, Taos, NM, Starr and  Zavala, TX,  Claiborne, Holmes and Jefferson, MS, and Shannon, SD, leaving only 3 totally rural counties, Greene, AL, Sioux, ND and Menominee, WI. 

    These highest D counties also have the highest share of people 18-44, of singles and of roommate households, and the lowest in families, as well as being lowest in labor force participation and church attendance but highest in poverty and unemployment.

    Even though highly Democratic, with a 2012 D vote of 4,000,000 to 700,000 R, the total vote is so large that it may be worth a fair Republican campaign effort simply to reduce the giant D margin, which was key to the 2008 and 2012 D wins. Without the dominance of race, Republicans might do better, if voter turnout of minorities falls.

    Set 3: Balanced 50-50 counties

    The set 3 counties with a 50:50 D and R split, are far more diverse and complex, as we might expect, and suggest how difficult they can be for candidates to create convincing messages!  These counties are intermediate in density and are quite high in shares of micropolitan territory, that is, independent small city counties.

    Of the 39 counties, 6 are entirely rural (GA, IA, MS and WI (3)), while one (Harris-Houston) is a giant metropolitan core county with almost half the total vote of these set 3  counties. Five are suburban to large metro areas – in GA, MD, NJ, PA, and WA.  Five are small metropolitan areas, Lincoln, NE (Lancaster), Florence, SC, State College (Centre), PA, Montgomery, VA (Blacksburg), and Canton (Stark), OH. Thus 23 are small city micropolitan, with counties in AR, CA, CO, IL, IA, MD, MI, MN, MS, NC, OH, OR, SC, WA, and WI.

    While the set 1 counties are all but one in the western half of the country, and the set 2 counties, coastal urban or southern rural-small town, the set 3 counties are most prevalent in the upper Midwest: IL 2, IA 5, MN 3, WI 5, MI 1, OH 1, and NE 1, almost half the counties, with another ten in the south, AR 1, MS 2, GA 2, SC 2, FL 1, NC 1, and VA, 1. The single largest cluster of these 50:50 counties is in northwestern Wisconsin, with an additional county across the state line in Minnesota.

    In social and economic characteristics these counties tend to be intermediate between the set 1 and set 2 counties, for example averaging 22% minority (closer to set 1 than to set 2), but fairly high in a few counties in the south. They tend to be a little closer to the set 2 D set on the social dimension: shares of roommates, singles, and in religiosity, but closer to the set 1 R set in economic, income and job variables, as in higher labor force participation and lower poverty rates. 

    Clearly these set 3 counties represent the impressive diversity of the more balanced areas of American electorate, where campaigning will be especially critical.

    Table  1 Differences between D, R and 50:50 Sets
    Averages
    Variable Set 1 R Set 2 D Set 3 50:50  
    Age 18-44 30 39 33  
    White 92 33 82  
    Black 0.7 43 11  
    Minority 16 81 22  
    HW w children 28 11 20  
    Single parent 10 29 16  
    Singles 22 30 28  
    Urbanized area 3 54 21  
    UC (small city) 18 11 26  
    Rural 82 32 53  
    Male Labor Force Participation 73 62 69  
    Unemploy 3.8 12.2 7.3  
    Services 15 22 17  
    Farm 7 1 1.7  
    Churches/100 4 1.5 1.8  
    Poor 13 26 14.5  
    Child Poor 17 36 18  


    Conclusion

    These counties are but a small sample of the 3,180 counties. Yet they represent the extreme drivers of a well-publicized American polarization, but also where we see a non-polarized America. The regional concentrations of the three helps illuminate the amazing differences in American cultural and political geography.

    Richard Morrill is Professor Emeritus of Geography and Environmental Studies, University of Washington. His research interests include: political geography (voting behavior, redistricting, local governance), population/demography/settlement/migration, urban geography and planning, urban transportation (i.e., old fashioned generalist).

  • In Comparing Metro Areas, the Devil is in the Details

    Frequently I see examples of metro areas comparing themselves to other, more successful metro areas.  Metro area movers and shakers take a deep dive into the intricacies of what makes a “good” place tick, and try to implement the takeaways in their metro.  This is a reasonable action, but I believe it misses the point.  There is more to examine by taking a deep dive within your own metro than looking at another.

    Surely there are physical scale, density and economic differences between metro areas that are worth exploring.  But those differences can be overstated.  Milwaukee, for example, will never be the Silicon Valley, for a host of reasons. Just as importantly, the reverse is true. 

    When I see that, say, Kansas City wants to do what Portland’s doing, or Grand Rapids wants to do what Nashville’s doing (totally fabricated examples, I might add), I cringe for three reasons — 1) distinctiveness, not homogeneity, should be the hallmark of cities and metro areas; 2) metro areas are already far more alike than different, in terms of their built environment and even their economies; and 3) there is more inequality that is evident within metro areas than between them.

    Why is it that, when looking at the marketplace of metros, they try to emulate successes rather than striking out for distinctiveness?  This generally stands in opposition to what happens in business, where firms seek to deliver a product that is of better quality, or less expensive, or offers more options, in order to stand out in the marketplace. 

    Unfortunately we end up having metro areas chasing advantages they will never be able to attain.  The Bay Area’s combination of entrepreneurship and top-tier education, leading to the R&D work that supports Silicon Valley, is only tangentially replicable in a handful of metros nationwide.  The low-tax, low-cost advantage that many interior metro areas enjoy over their coastal brethren is not something that can be done in the high-tax, high-cost coastal metros.

    Addressing the third point will lead to greater city and metro growth than trying to replicate what any other metro area purports to be doing at a metro scale.

    Let me offer one example.  Below you’ll see a table that shows the top 25 metro areas from 2010, organized by median household income.  The data is from the Census Bureau’s American Community Survey in 2011 (although there is more recent data available, the reason for using this dataset will become clearer below):

    Median household income for the top 25 metro areas falls within a fairly narrow range.  Together, the metros have a median of medians, if you will, of $57,783, with a standard deviation of about $7,300.  The Tampa/St. Petersburg metro area comes in at the lowest ($46,890), while San Francisco/Oakland comes in as the highest ($76,911). 

    At the metro level, there are easy answers to explain why some metro areas are where they are — the supercharged, tech-driven or eds-and-meds economies lift San Francisco and Boston, while the presence of larger numbers of retirees in some Sun Belt metros, and deindustrialization that saw jobs move away, depresses incomes in Tampa, Miami, Pittsburgh or Detroit. 

    It’s data like this that reinforces the simple tropes that drive our understanding of metro areas.

    But what if we look within a metro area?

    I have a dataset that has 2011 American Community Survey data for 283 municipalities within the Chicago metro area, as well as the 55 zip codes that comprise the city of Chicago.  This data covers about 8.5 million of the 9.5 million within the broader metro area, excluding a handful of outlying exurban counties in Illinois as well as a few counties in Indiana and Wisconsin.  By looking at finer grained data that examines municipalities, and breaks down the behemoth that is the region’s core city of Chicago, we can see how there are greater differences within the a metro area than between them.

    Median household income falls within a far broader range within the Chicago area than in the top 25 MSA dataset.  In 2011, the median of median household incomes for the 338 places identified was $68,325, which is completely understandable when one considers higher income suburban municipalities being over-represented in the dataset.  The range, however, is what stands out — the highest median household income was in North Shore Kenilworth ($242,188) while the lowest was in Chicago’s 60621 zip code, which corresponds with the city’s Englewood neighborhood ($19,692).  What’s crazy, though, is that the standard deviation for median household income in the Chicago area in 2011 ($32,700) is nearly double the actual number for the 60621 zip code. 

    There were 68 municipalities and city zip codes that had median incomes below $50,000 in 2011; there were 54 municipalities and city zip codes above $100,000.  One group presently drives metro area economic policymaking, while another remains largely ignored.

    There is greater variation within metros than there is between them.  This idea should inform our urban policymaking.  (Note: I use Chicago only because I have the data for it.  I imagine other metros, particularly large ones, will have similarly large ranges; the range likely decreases as metros get smaller, but remains to some extent.)

    For decades economic developers have relied on two economic strategies to improve conditions that influence data points like median household income — 1) attract more skilled businesses and workers, and 2) work like hell to retain skilled businesses and workers. The first strategy works in metros that have relied on migration for growth; the second works almost nowhere.

    As I see it, there is an opportunity for dramatic metro area improvement by those that focus on talent development, rather than talent attraction or retention.  When metro areas focus on the successes of our nation’s metro area “winners”, and try to implement a talent attraction/retention strategy, they relegate themselves to the whims of a select group who, for a variety of reasons, can choose to be anywhere.  Developing talent — investing in early, secondary and higher education, forging strong links between higher education and the business community, supporting entrepreneurship and investment — can pay dividends.  At some point, metros that become proficient at talent development will find that that activity evolves into talent attraction, creating the vibrant economic environment that all metros desire.

    Pete Saunders is a Detroit native who has worked as a public and private sector urban planner in the Chicago area for more than twenty years.  He is also the author of “The Corner Side Yard,” an urban planning blog that focuses on the redevelopment and revitalization of Rust Belt cities.

    Lead photo: View of the Life Sciences Complex, UB School of Medicine at the University at Buffalo, with downtown Buffalo, NY in the background.  Panoramas such as this can make any place look fantastic, but the devil is in the details.  Source: medicine.buffalo.edu.

  • The Cities Leading A U.S. Manufacturing Revival

    Manufacturing may no longer drive the U.S. economy, but industrial growth remains a powerful force in many regions of the country. Industrial employment has surged over the past five years, with the sector adding some 855,000 new jobs, a 7.5% expansion.

    Several factors are driving this trend, including rising wages in China, the energy boom and a growing need to respond more quickly to local customer demand and the changing marketplace.

    To generate our rankings of the best places for manufacturing jobs, we evaluated the 373 metropolitan statistical areas for which the U.S. Bureau of Labor Statistics has complete data over the past decade. Our rankings factor in manufacturing employment growth over the long term (2003-14), medium term (2009-14) and the last two years, as well as momentum.

    The Rust Belt Is Back

    No part of America suffered more from the de-industrialization of the past 40 years than the Great Lakes states. Yet as manufacturing  has come back, particularly the auto industry, many of the region’s economies have begun to resurge. Despite all the fashionable chatter over the question of whether we’ve reached “peak car,” the auto industry has enjoyed six straight years of increased sales, driven by low interest rates, the need to replace older cars and rising consumer confidence.

    The epicenter of this trend is exactly where the industrial decline hit hardest: Michigan, which sweeps the top three places on our list of the big cities generating the most new manufacturing jobs. The state has now recovered about 40% of the manufacturing jobs it lost during the recession. The Detroit-Dearborn-Livonia metropolitan area ranks No. 1 among the country’s 70 largest metropolitan areas for manufacturing employment growth over the time period for our study. Since 2009 the Detroit area has seen a remarkable 31.3% rebound to 89,300 industrial jobs, including a 9.8% expansion last year. This growth has helped begin to reverse a long-standing decline in employment overall—still down 12.3% since 2003—with overall employment up 5.9% since 2009.

    Detroit’s recovery is not just a matter of inertia, but reflects a unique combination of circumstances. The area is home not only to many skilled workers, but boasts the second largest concentration of engineers among the country’s 85 largest metro areas, behind only Silicon Valley.

    In second place is Warren-Troy-Farmington, in the Detroit suburbs, where manufacturing employment is up 38.8% since 2009. In third place is Grand Rapids-Wyoming, a longtime furniture-making hub where an uncommonly high share of jobs is in manufacturing, one in five; the metro area has seen industrial employment rebound 27.9% since 2009.

    Another Midwest hotspot has been Toledo, Ohio, only 60 miles from Detroit, which ranks first among the mid-sized cities we evaluated, with a 17.4% jump in industrial employment since 2009.

    Southern Cooking

    The other big cluster of industrial hotspots is in the Southeast. Manufacturing has been heading to the region for several decades, recently primed by  major investments from German and Japanese companies, among others. A prime example is Nashville-Davidson-Murfreesboro, Tenn., No. 4 on our list, where manufacturing employment has jumped 23.9% since 2009. Japan’s Nissan and Bridgestone have establishing manufacturing plants in Central Tennessee, which has also created opportunities for small domestic parts companies in the region. Nissan also relocated its U.S. headquarters to the area in 2006 from Southern California. And domestic auto makers are have become major players in the Southeast—Ford employs some 14,000 in the Louisville, Ky., area, which checks in at No. 7 among our largest MSAs. The South, notes a recent Brookings study, now has the highest number of workers in the country employed in “advanced industries,” which tend to be the higher paying, more technically oriented parts of the factory economy.

    Other areas that have become primary places for new industrial investment include such Deep South locations as Savannah, Ga., No. 2 on our mid-sized list, as well as No. 8 Columbia, S.C., a major center for German car companies, and No. 10 Charleston, S.C., which has benefited from the expansion of Boeing and aerospace suppliers there. These areas missed much of the  industrial revolution a century ago but are playing an impressive game of catch-up. Each has seen their industrial workforces grow over 20% since 2009. Other southern stars include Cape Coral-Ft Meyers, Fla., No. 4 on our mid-sized city list. Our small cities list also turns up Southern outperformers:  No. 2 Naples-Immokalee-Marco Island and No. 3 Sebastian-Vero-Beach, Fla.

    The Energy Belt

    Falling oil prices may be causing the oil and gas industry to rein in exploration and drilling budgets, but it provides an enormous boon for downstream industries such as refining and petrochemicals. This could keep industrial job growth going in two of our top MSAs that are in the oil patch.  Oklahoma City, where manufacturing job growth has soared 23.1% since 2009, ranks sixth, and  Houston, where the industrial workforce has expanded 19.8% over the same time  span, ranks ninth. Houston now is home to 257,300 manufacturing jobs, the third largest concentration in the country.

    As in Detroit, Houston’s industrial rise is powered by more than by brawn. The area ranks sixth among the nation’s major metros in number of engineers per capita. If the Bay Area is master of the digital economy, Houston ranks as the technological leader of the material one; it is the capital for the energy-driven revival of U.S. industry.

    Smaller energy-rich areas that have also experienced rapid industrial growth. These include two Louisiana metro areas, No. 3 Baton Rouge and No. 7 Lafayette, third and seventh, respectively on our mid-sized metro area list, as well as Midland, Texas, fifth on our small areas list. Perhaps most surprising, given its location in anti-carbon California, has been the steady growth in Bakersfield,  which stands fifth on the mid-sized list and is home to some of the nation’s largest oil fields. With 20.3% industrial growth since 2009, the area, sometimes known as “little Texas,” is the only metro area in the Golden State to make it to the top 10 in either the large or mid-sized list.

    A Shift To Smaller Cities

    Once American industry was identified predominately with big cities: New York in 1950, according to economic historian Fernand Braudel, had the largest industrial economy in the world, employing a million workers, mostly at small manufacturers. In the 1970s and 1980s, the industrial zeitgeist moved increasingly to Los Angeles, which vied with Chicago as the largest center for factory jobs.

    Today this pattern is changing dramatically. Besides the move toward the south and energy hotbeds, industry has been expanding in smaller cities as well as suburban areas beyond the core cities, says University of Washington geographer Richard Morrill. This is not unique to the United States; Germany, which has perhaps the most admired industrial sector in the world, also has dispersed its industrial base, largely to smaller cities.

    The reasons for this shift vary, from strict environmental laws in Northern cities, as well as stronger unions, and cheaper land elsewhere.

    For example, although the New York state capital Albany ranks fifth on our big metro area list, driven in large part by semiconductor manufacturing, New York City stands at a weak 62nd out of 70. Since 2009, New York has lost 3.3% of its manufacturing jobs; the city’s industrial workforce now stands at a paltry 74,700, a dramatic decline from some 400,000 as recently as the early 1980s.

    Yet with its powerful array of media, business service and hospitality businesses, New York appears to be able to withstand deindustrialization more than the two largest industrial MSAs, Chicago and Los Angeles. The one-time “city of big shoulders“ and its environs has also lost industrial jobs since 2009, down to 278,000 from 286,500 in 2011, and a far cry from the 461,600 it had in 2000.

    The decline has been, if anything, more rapid in 59th place Los Angeles. This process began with the loss of more than 90,000 aerospace jobs since the end of the Cold War. Los Angeles’ industrial job count stands at 363,900 — still the largest in the nations but down sharply from 900,000 just a decade ago.

    Does Industrial Growth Still Matter?

    Clearly deindustrialization has a bigger impact in some areas than others. Cities like San Francisco and New York appear better positioned for the post-industrial transition than Chicago or Los Angeles, where manufacturing lingered longer and the elite service or tech industries are not nearly as predominant. Yet the impact of industrial decline — or resurgence — may be more important in the future than many suppose.

    This is particularly critical for blue-collar workers, for whom industrial jobs tend to pay more. Welders and other skilled workers are increasingly in short supply, particularly as baby boomers begin to leave the workforce. Many of the cities which did well in our rankings are among the best in building new training partnerships with their industrial employers—these are skills that are decreasingly taught in the modern secondary and college curricula. In some places, vocational skills have recently been commanding higher post-graduation salaries than traditional college degrees.

    Industrial growth also provides an opportunity for emerging cities, particularly in the South and the energy belt, to add to their employment base and, in some cases, their connections with international markets. Over-dependence on manufacturing, as the Rust Belt experience showed, can be dangerous, and the need to diversify employmentremains critical. Threats to future growth include the strong dollar, the decline in the energy sector and economic weakness abroad reducing exports.

    But factory jobs remain an important asset for many regions. They may not be the central force they once were, but these jobs seem likely to continue making a big difference in the fates of many economies, both big and small.

    This piece originally appeared at Forbes.

    Joel Kotkin is executive editor of NewGeography.com and Roger Hobbs Distinguished Fellow in Urban Studies at Chapman University, and a member of the editorial board of the Orange County Register. He is also executive director of the Houston-based Center for Opportunity Urbanism. His newest book, The New Class Conflict is now available at Amazon and Telos Press. He is also author of The City: A Global History and The Next Hundred Million: America in 2050. He lives in Orange County, CA.

    Michael Shires, Ph.D. is a professor at Pepperdine University School of Public Policy.

    Auto manufacturing photo by BigStockPhoto.com.