Before taking my trip to Havana, one thing that I was curious about was how a half-century of Communism had affected the built fabric. While there are obvious disadvantages to economic stagnation, I figured that it would have at least created a charming-looking city. There are, after all, a handful of U.S. cities, and numerous European ones, that have resisted growth, modernization, and the automobile, only to remain quaint and historic. But it didn’t take even a 10-minute cab ride from the airport to realize that my assumption about Havana had been naïve—even if it is still held by many of the city’s blissfully uncurious tourists.
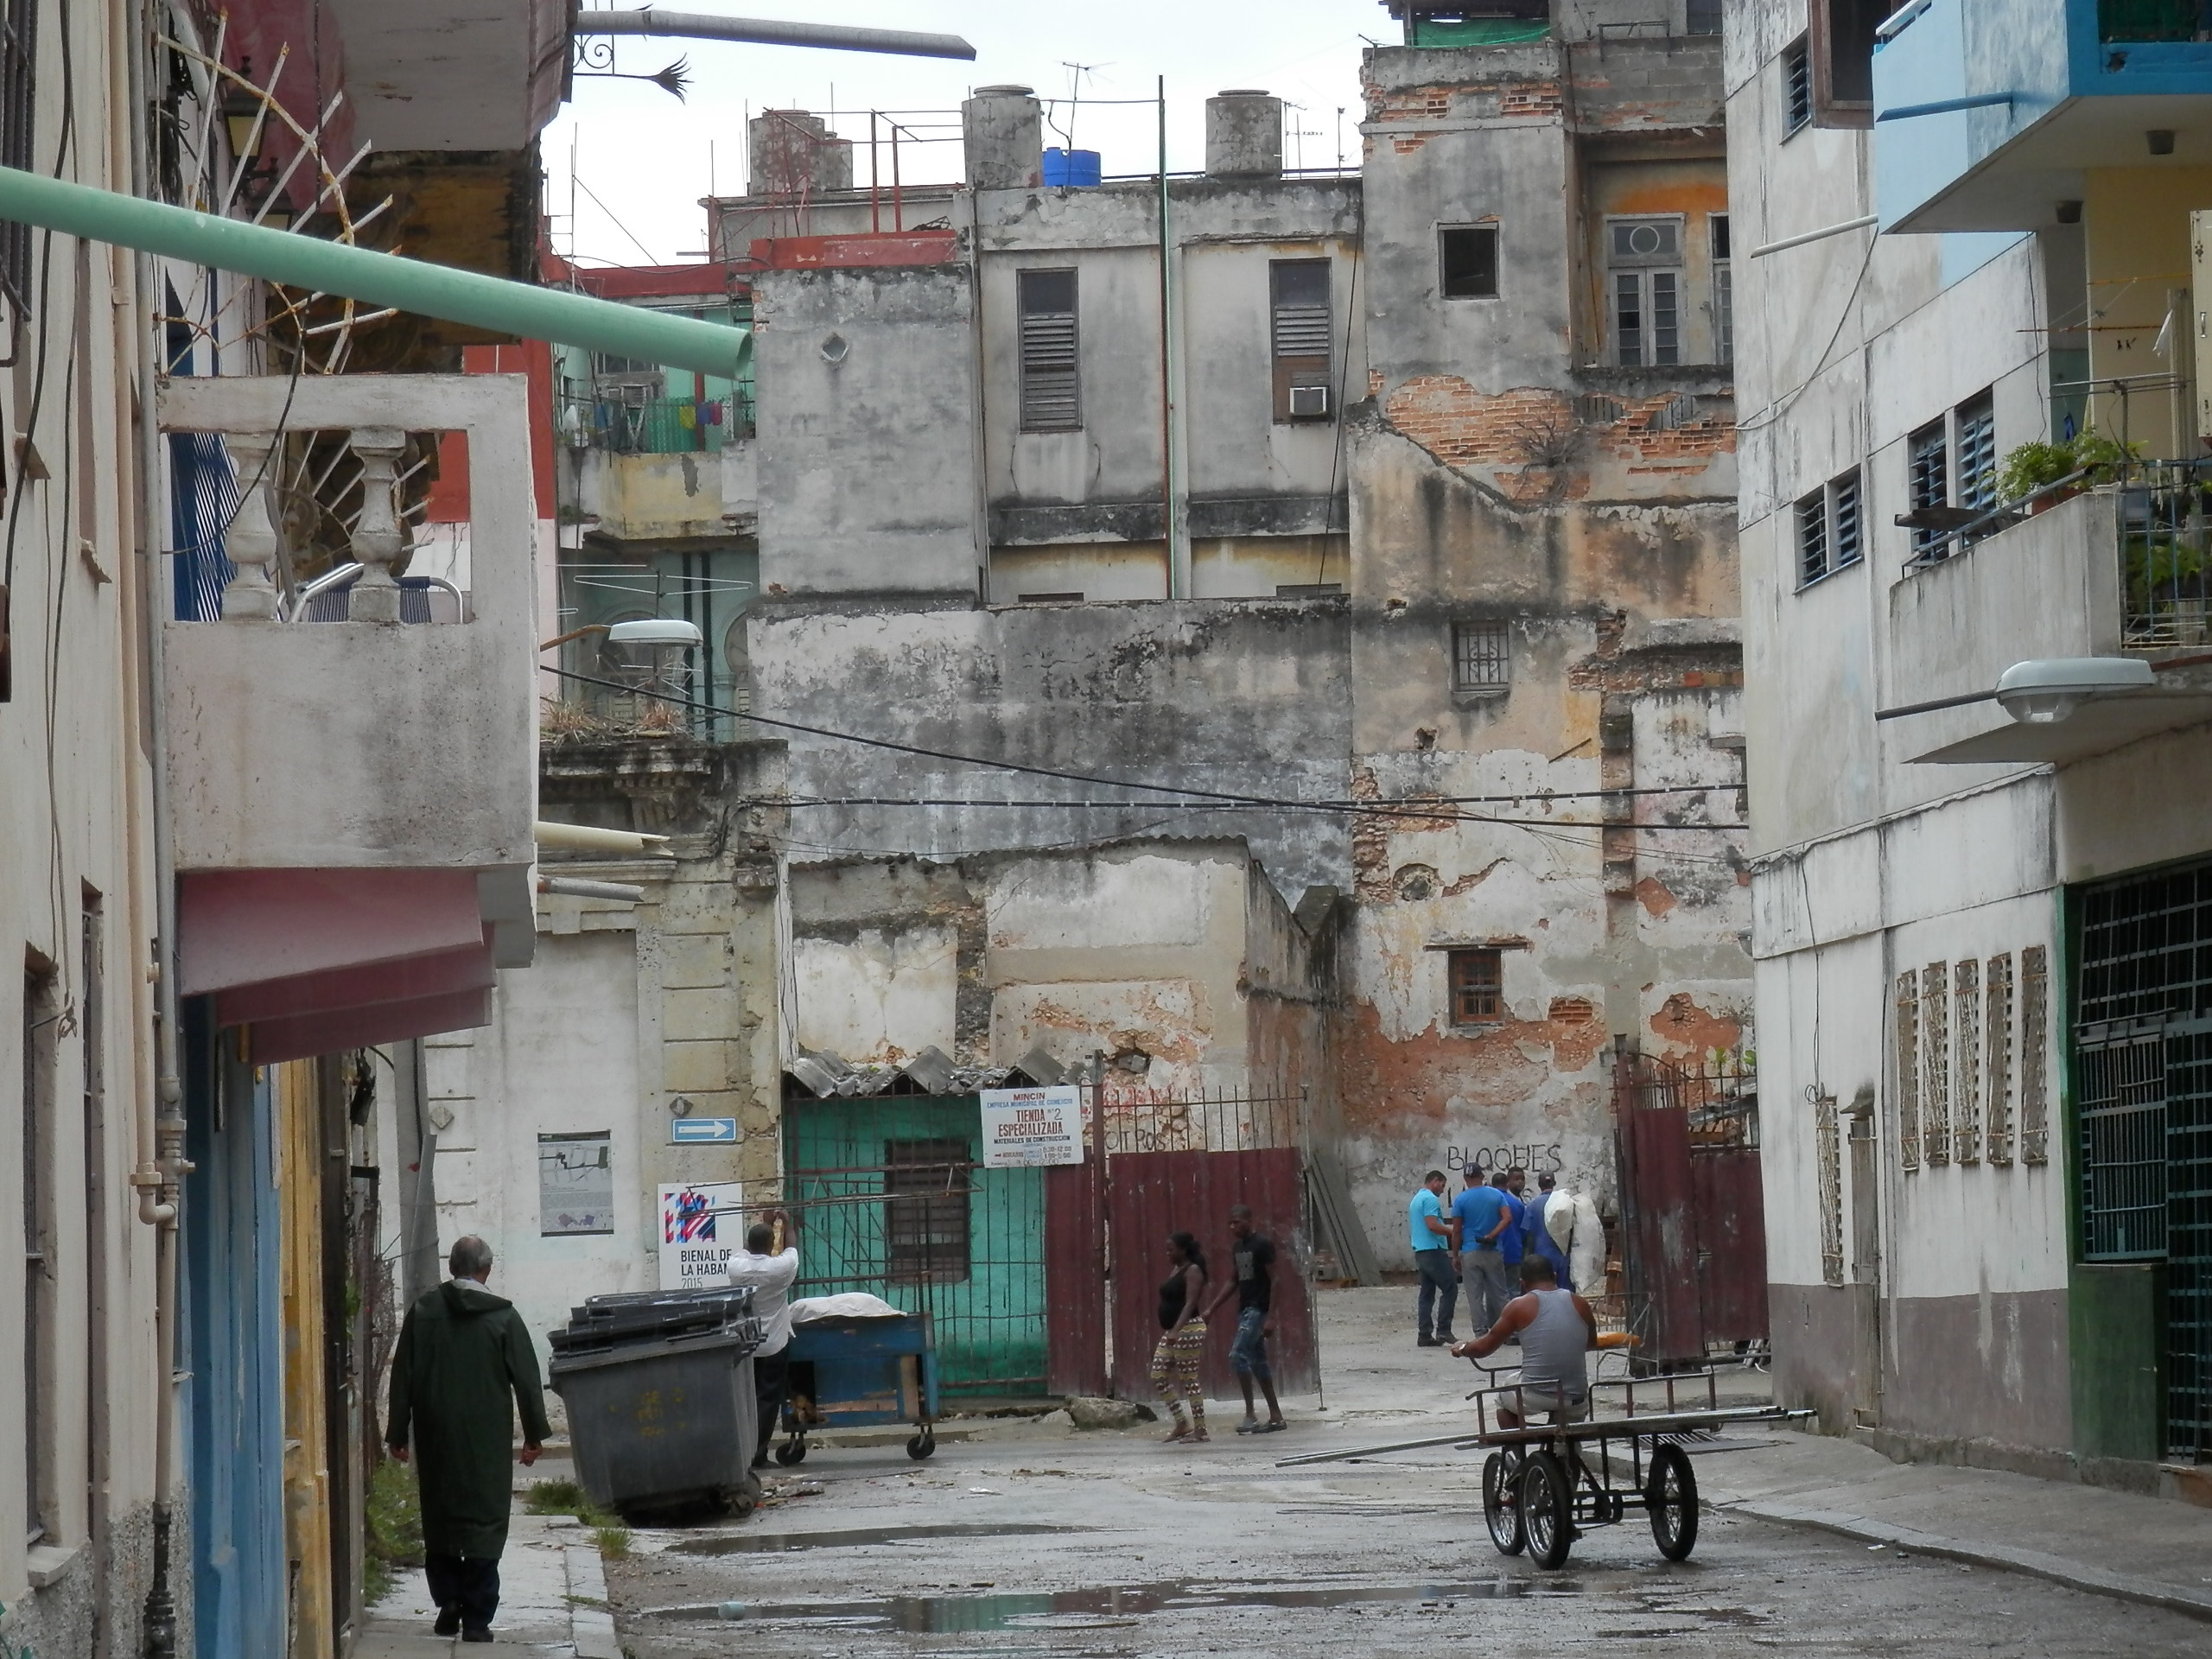
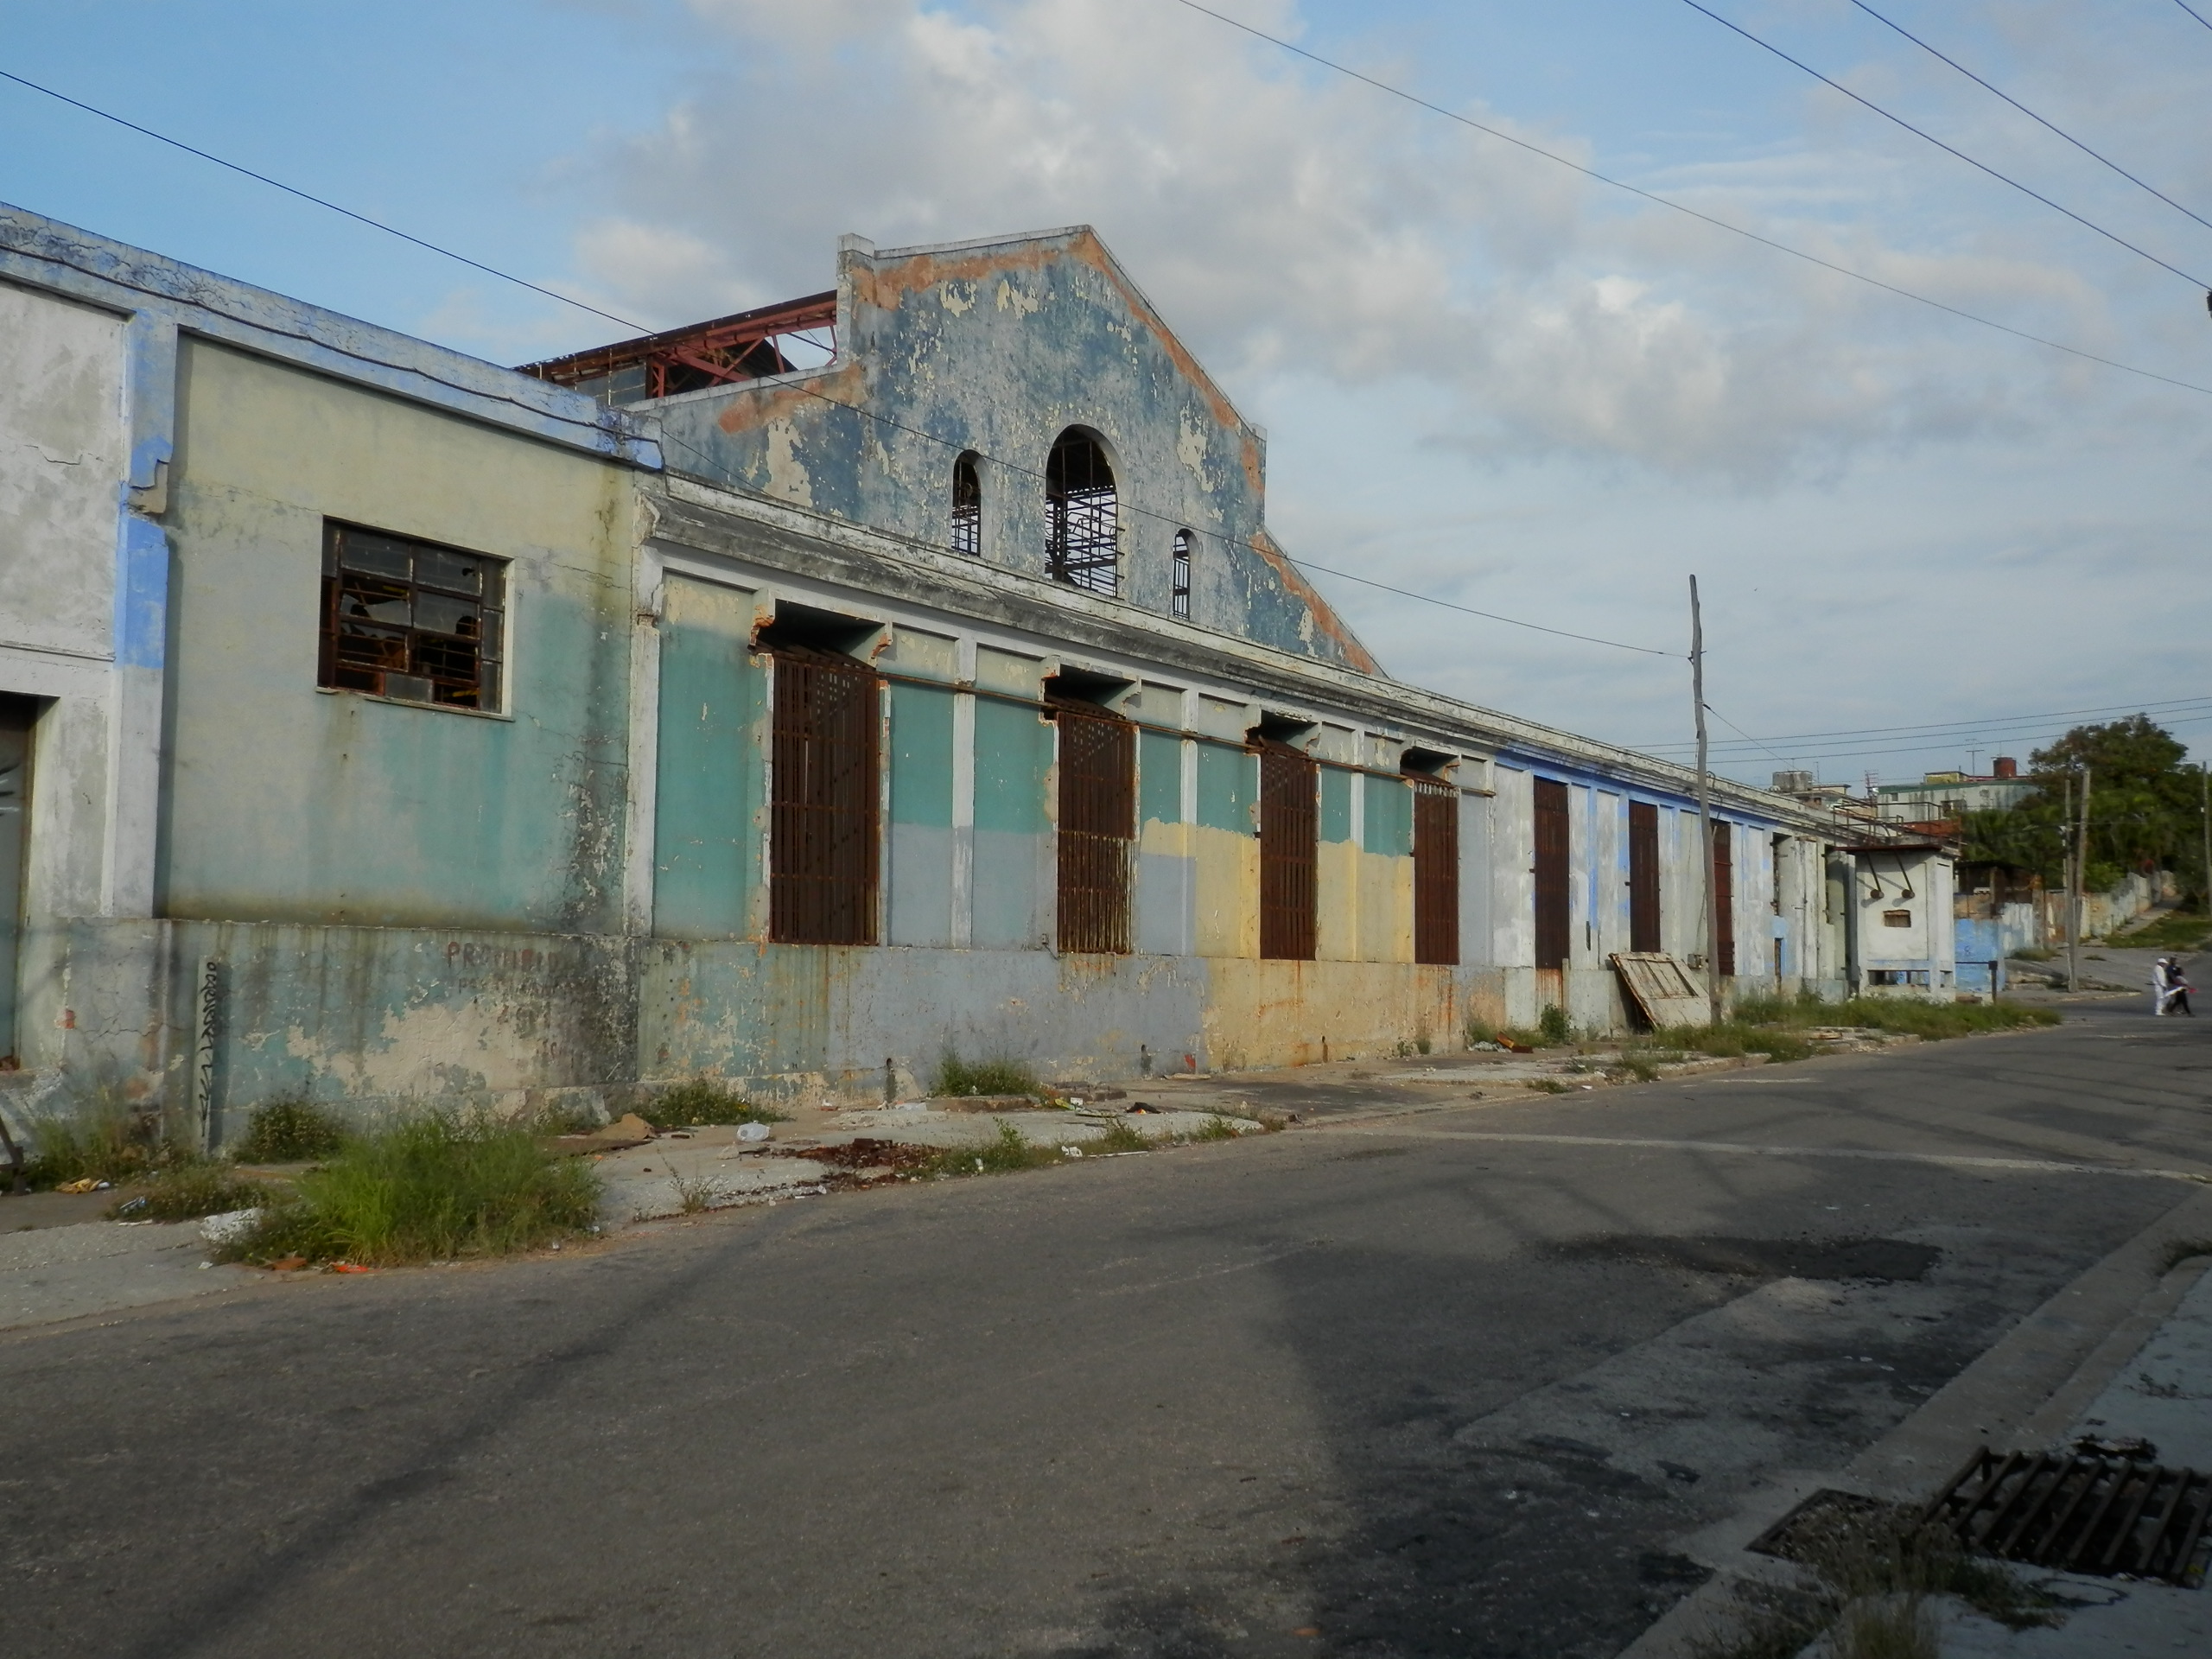
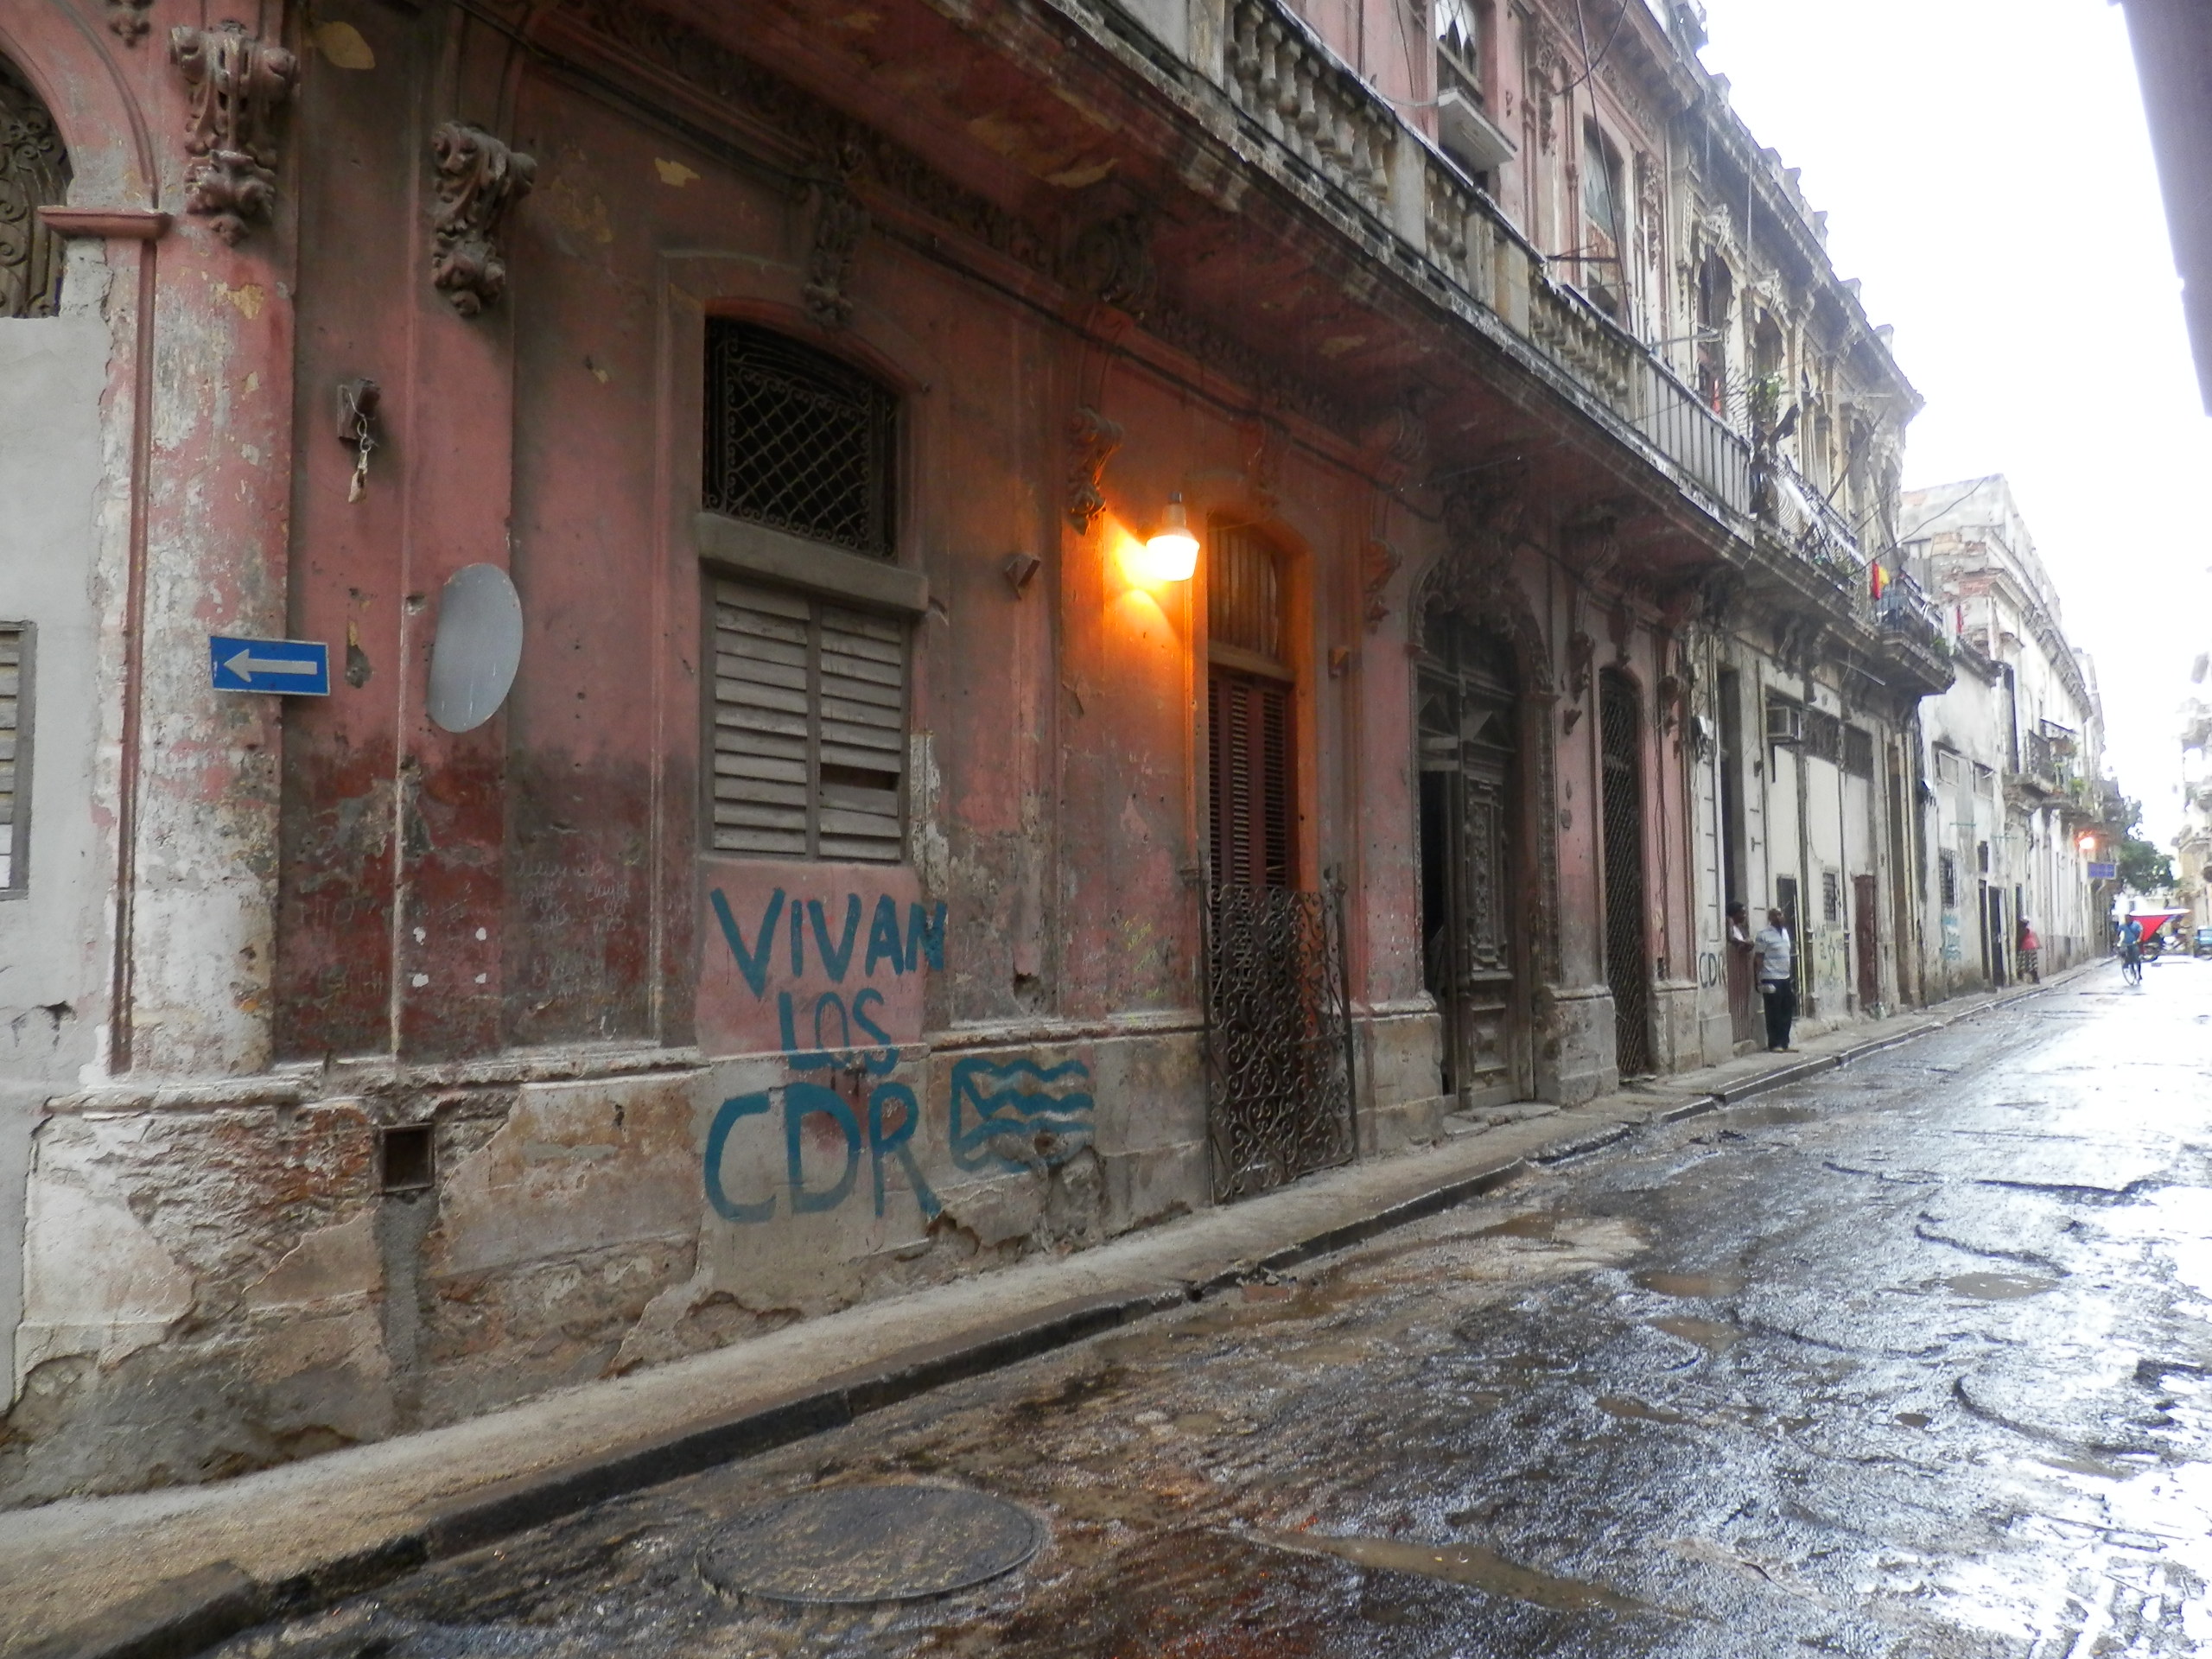
In fact, very little about Havana has been “preserved.” Instead, everything in the city is merely old, and because little gets produced, nothing is replaced. This applies to the automobiles, furniture, hand tools, manufacturing equipment—and most certainly the buildings. Collectively, this stagnation has destroyed the look of the city, with a physical blight that stretches nearly every block from downtown to the outer slums.
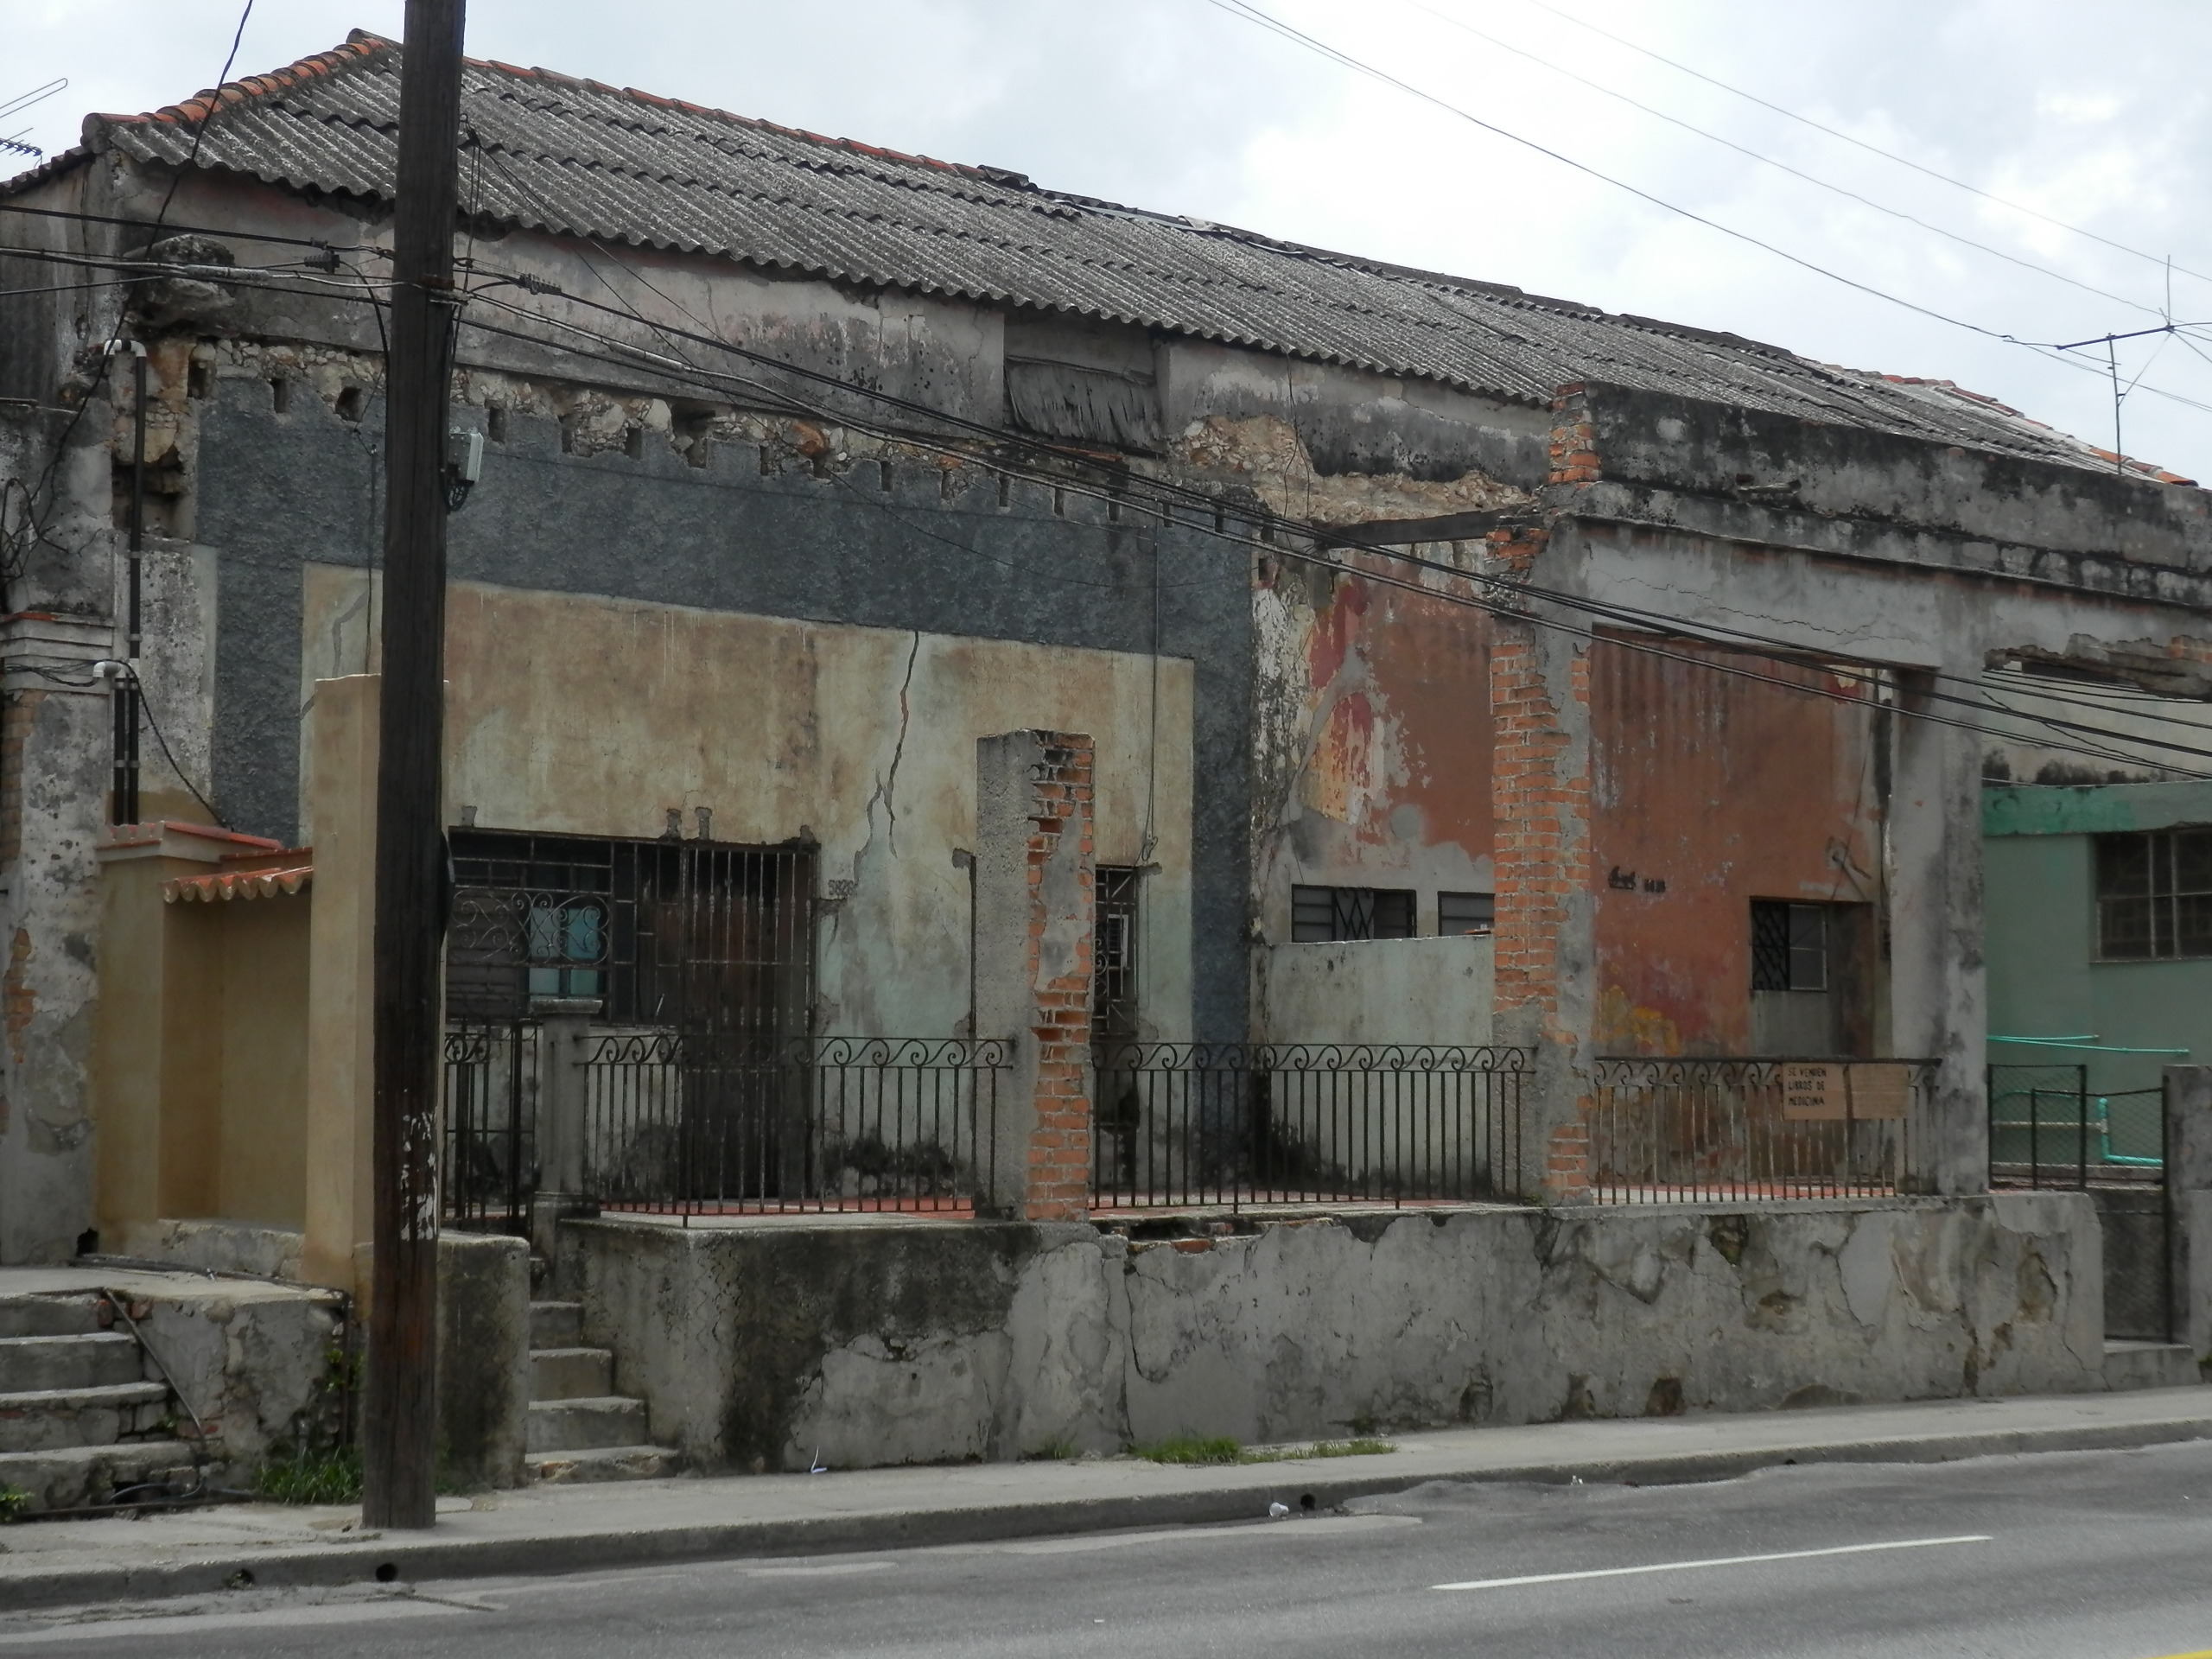
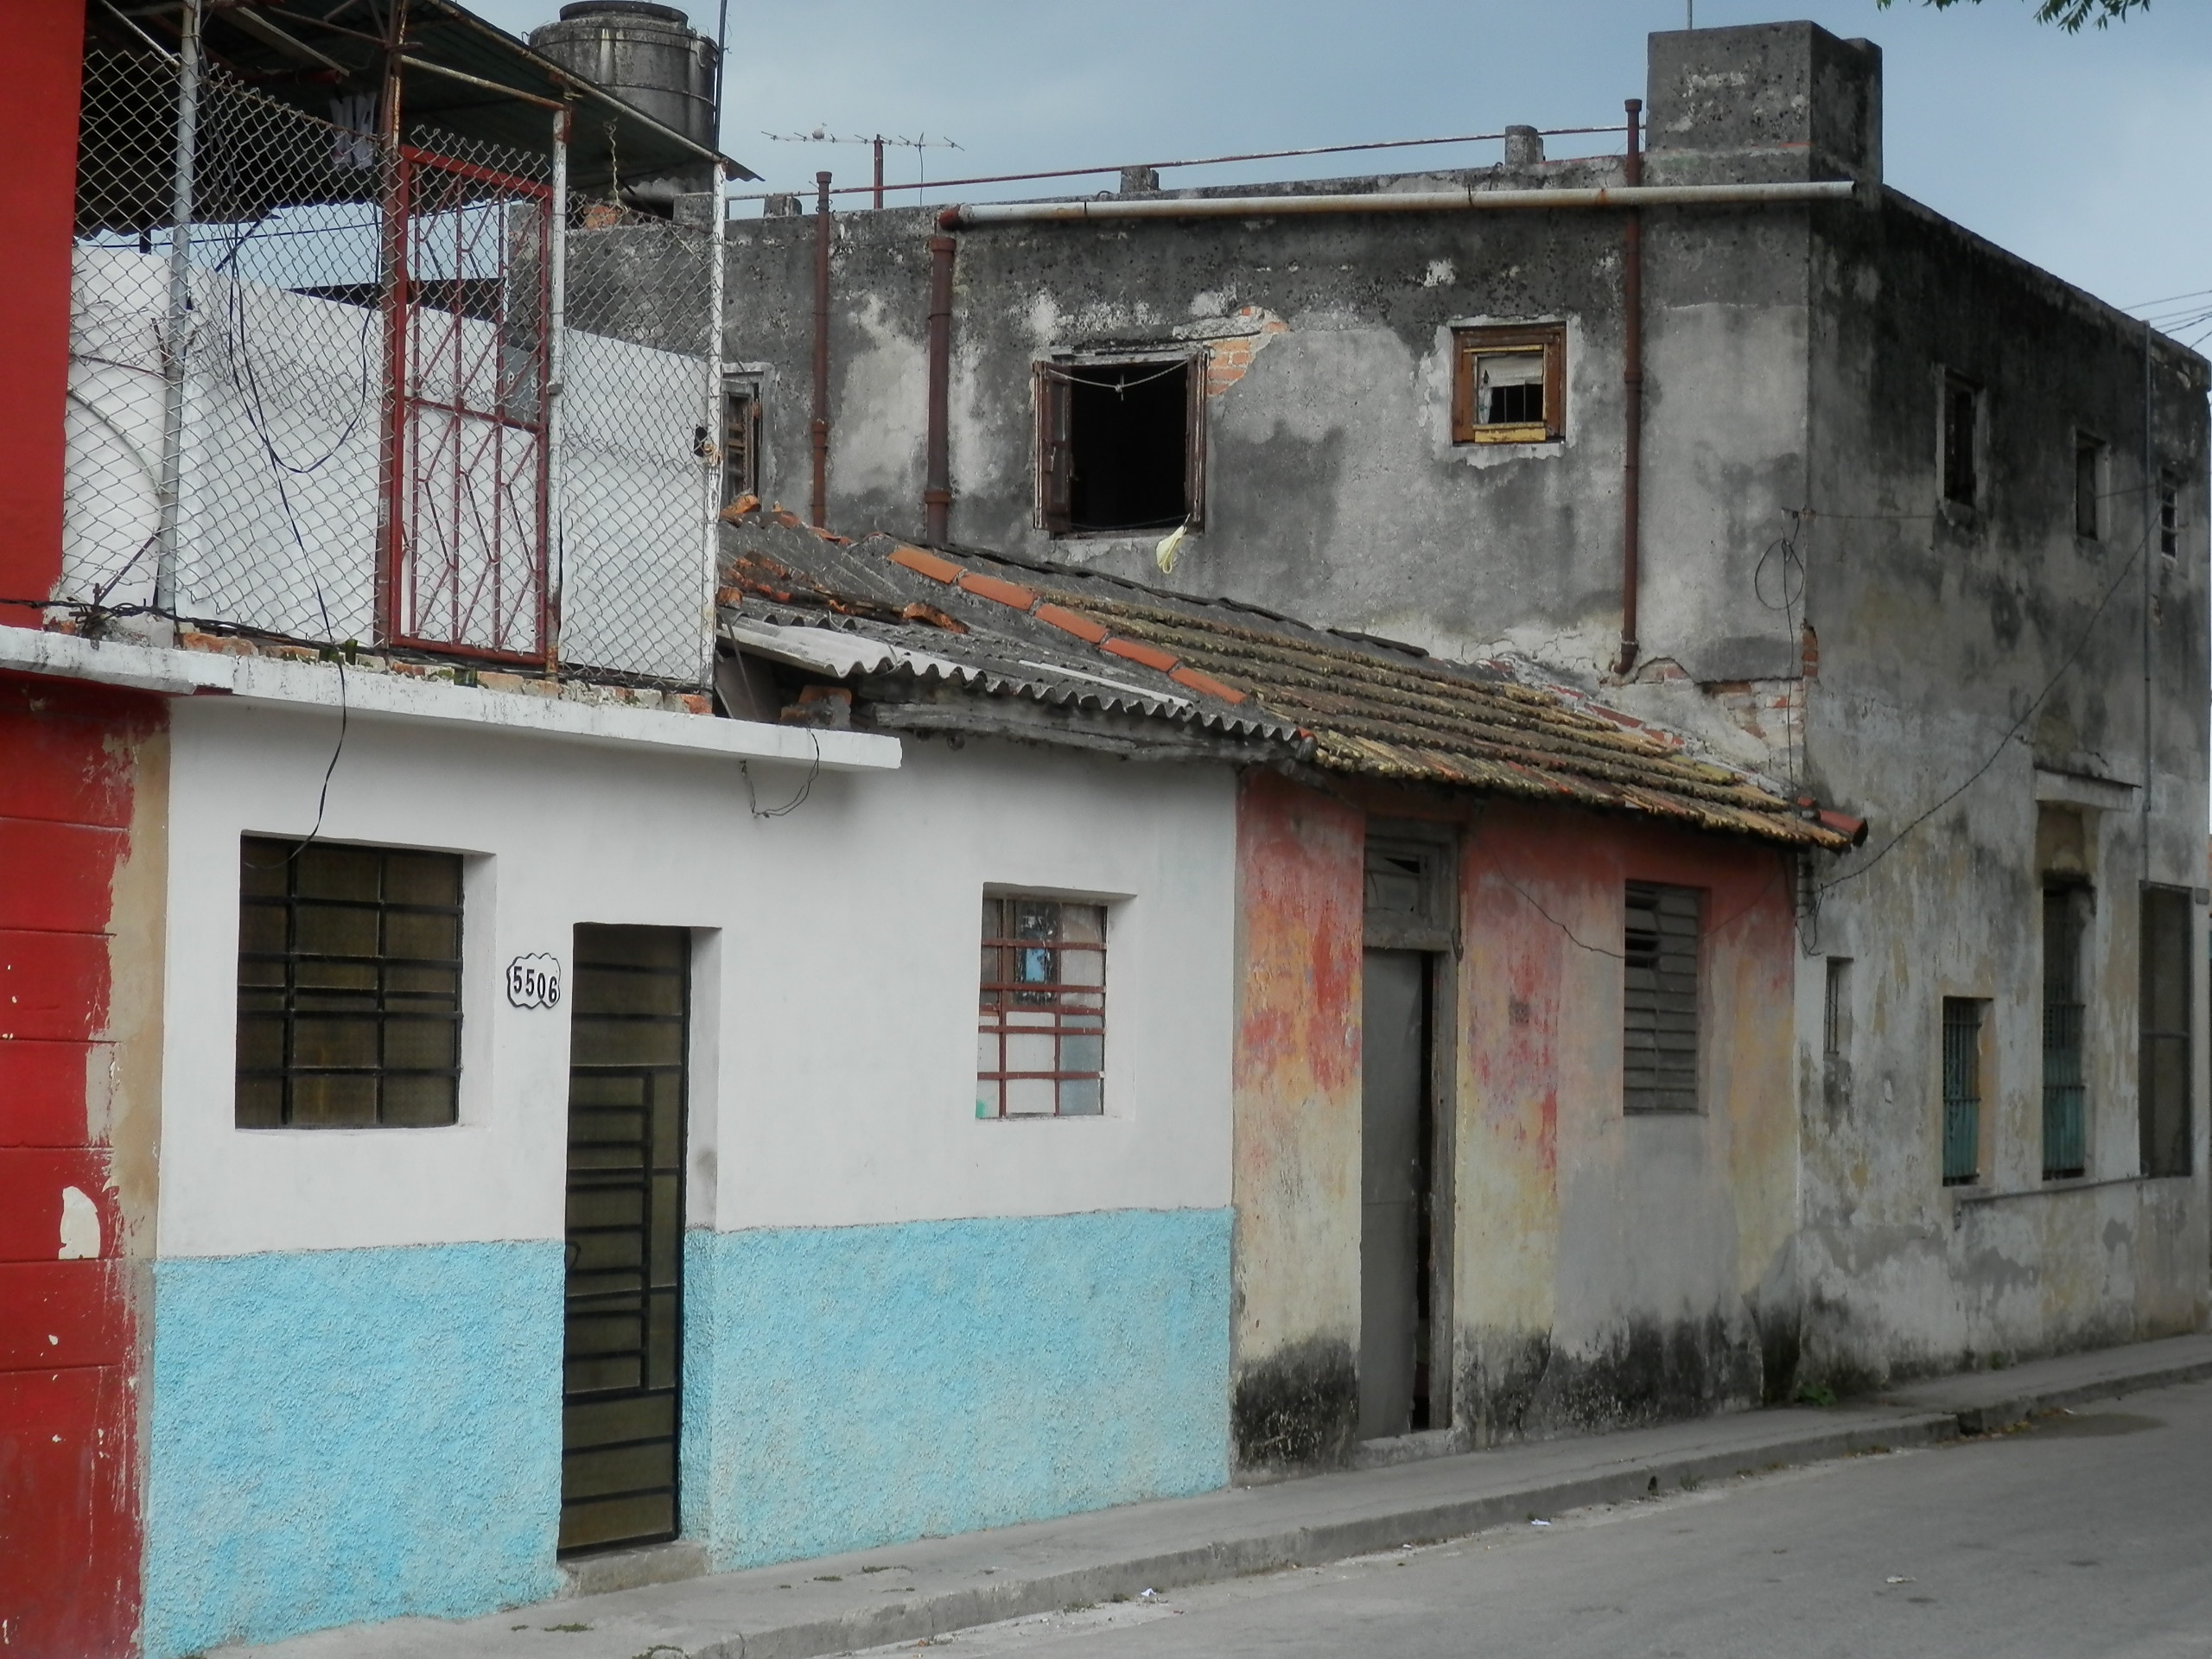
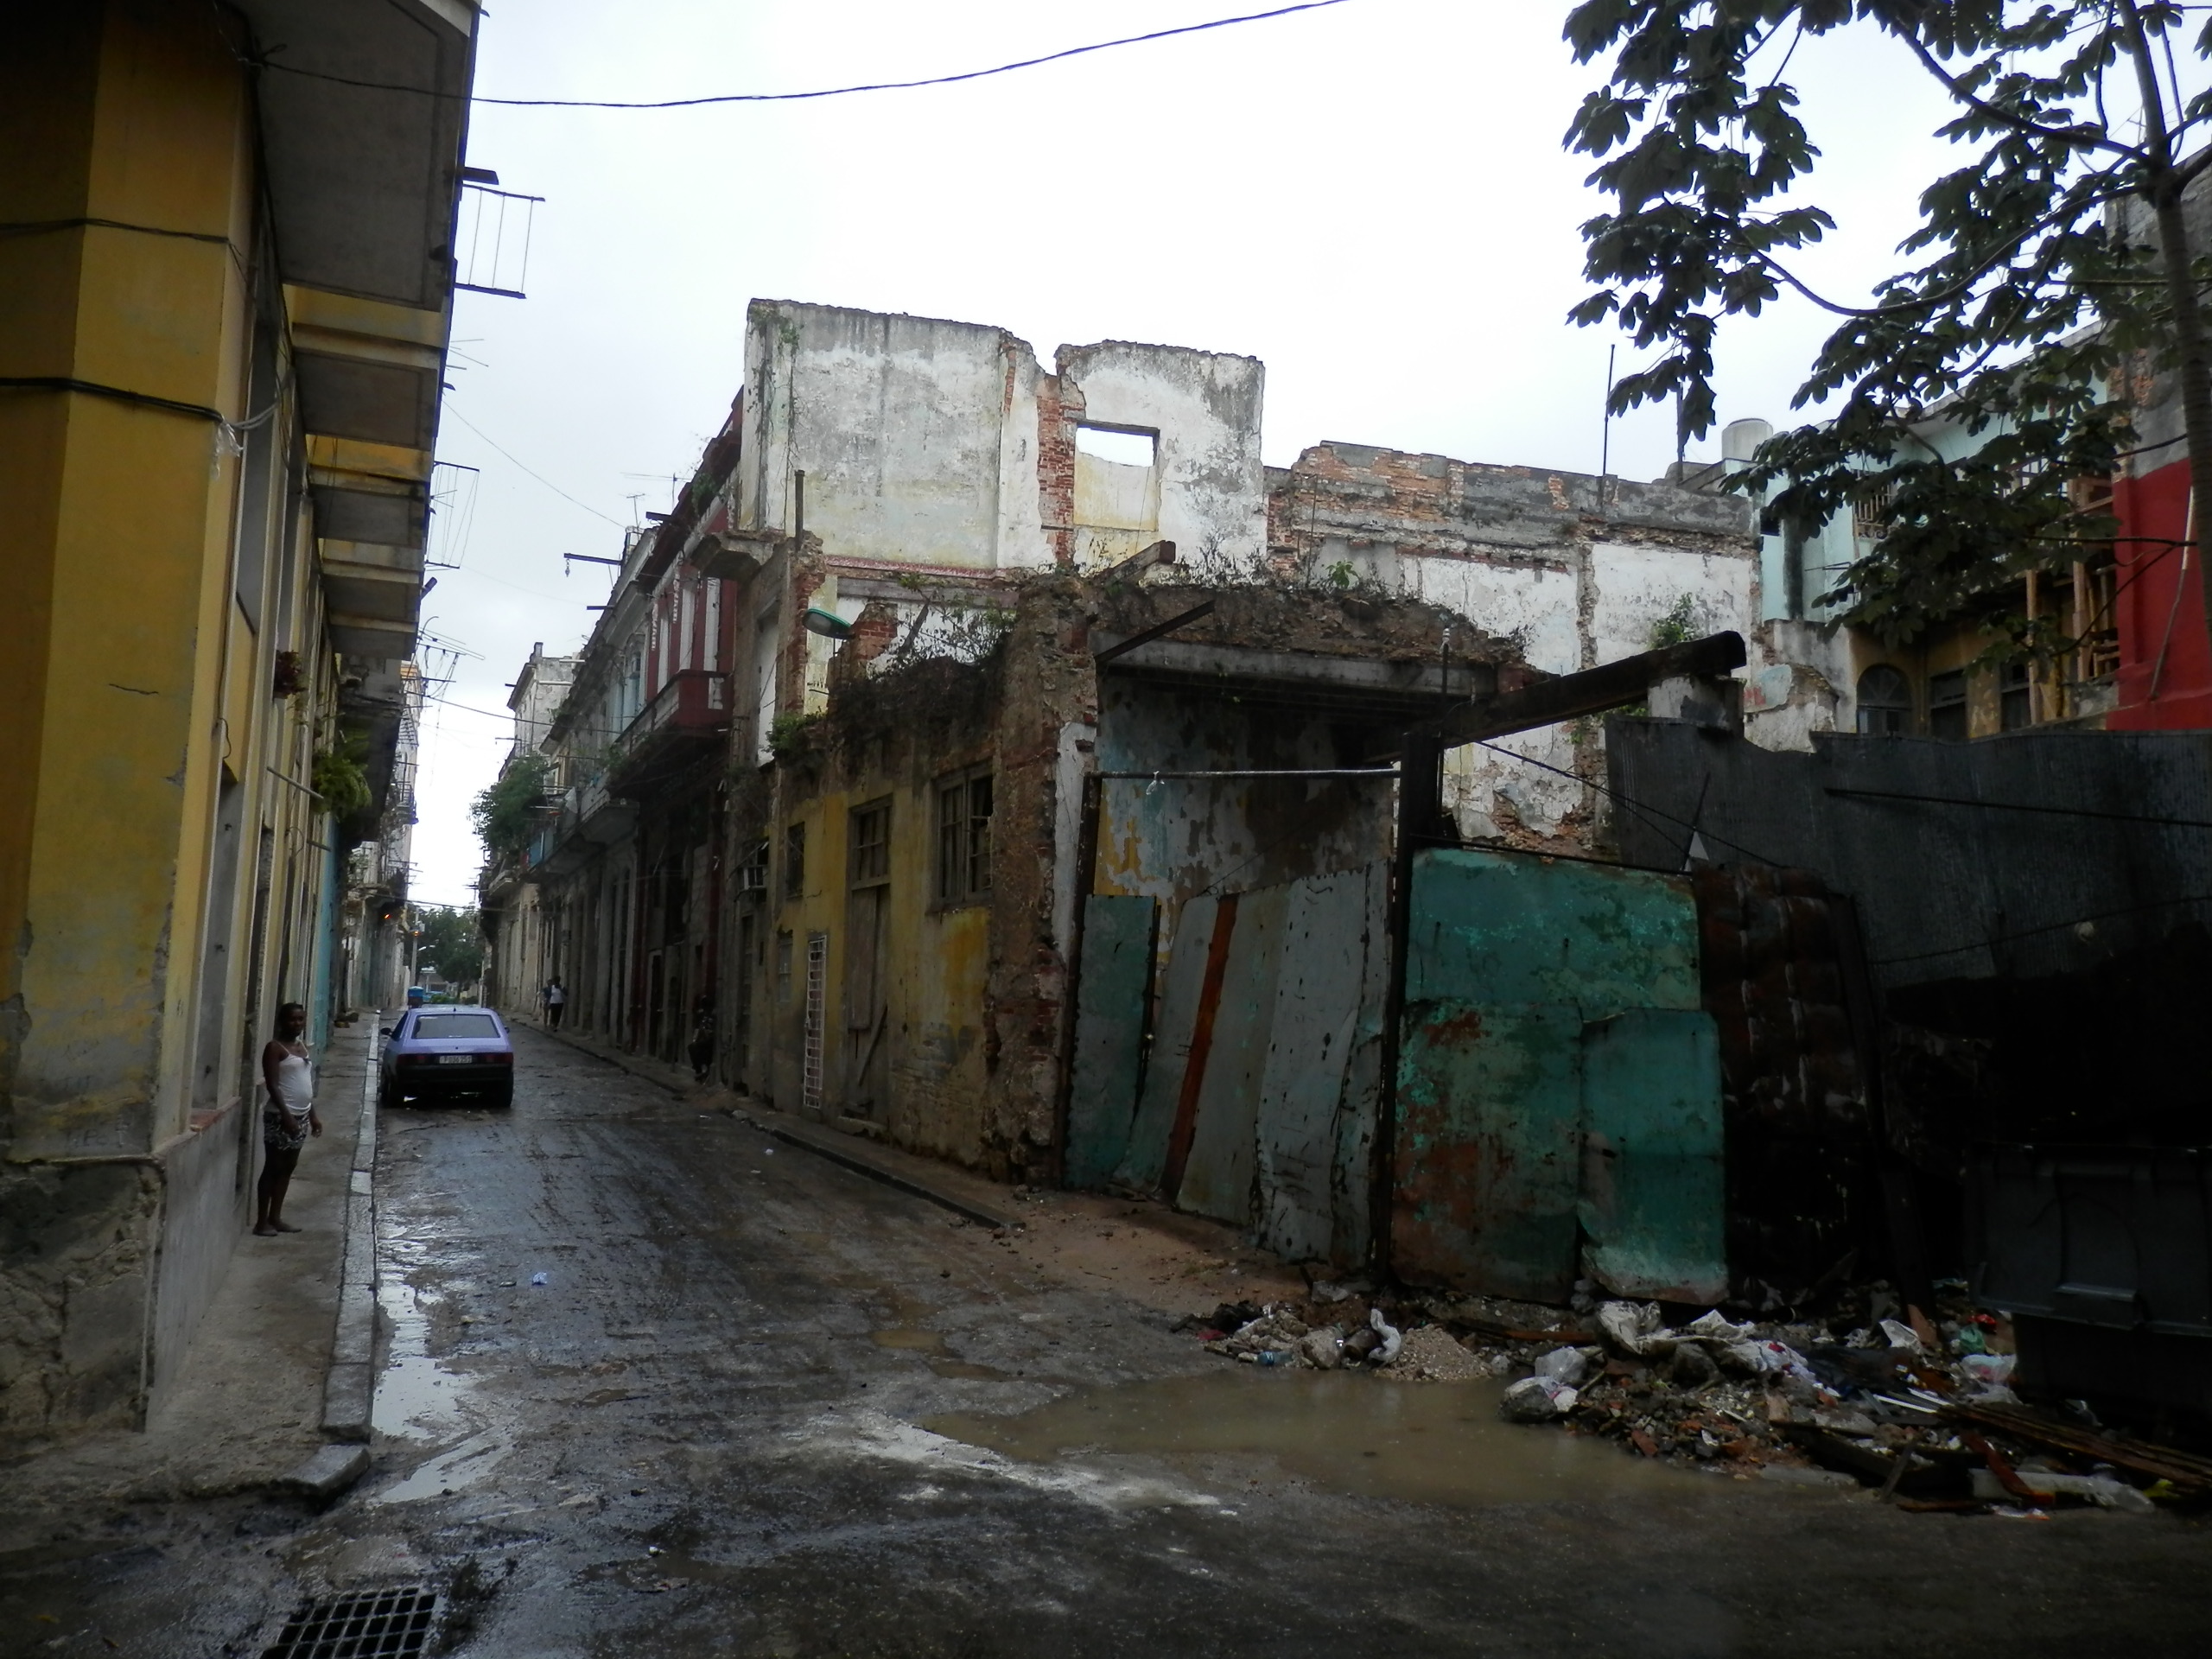
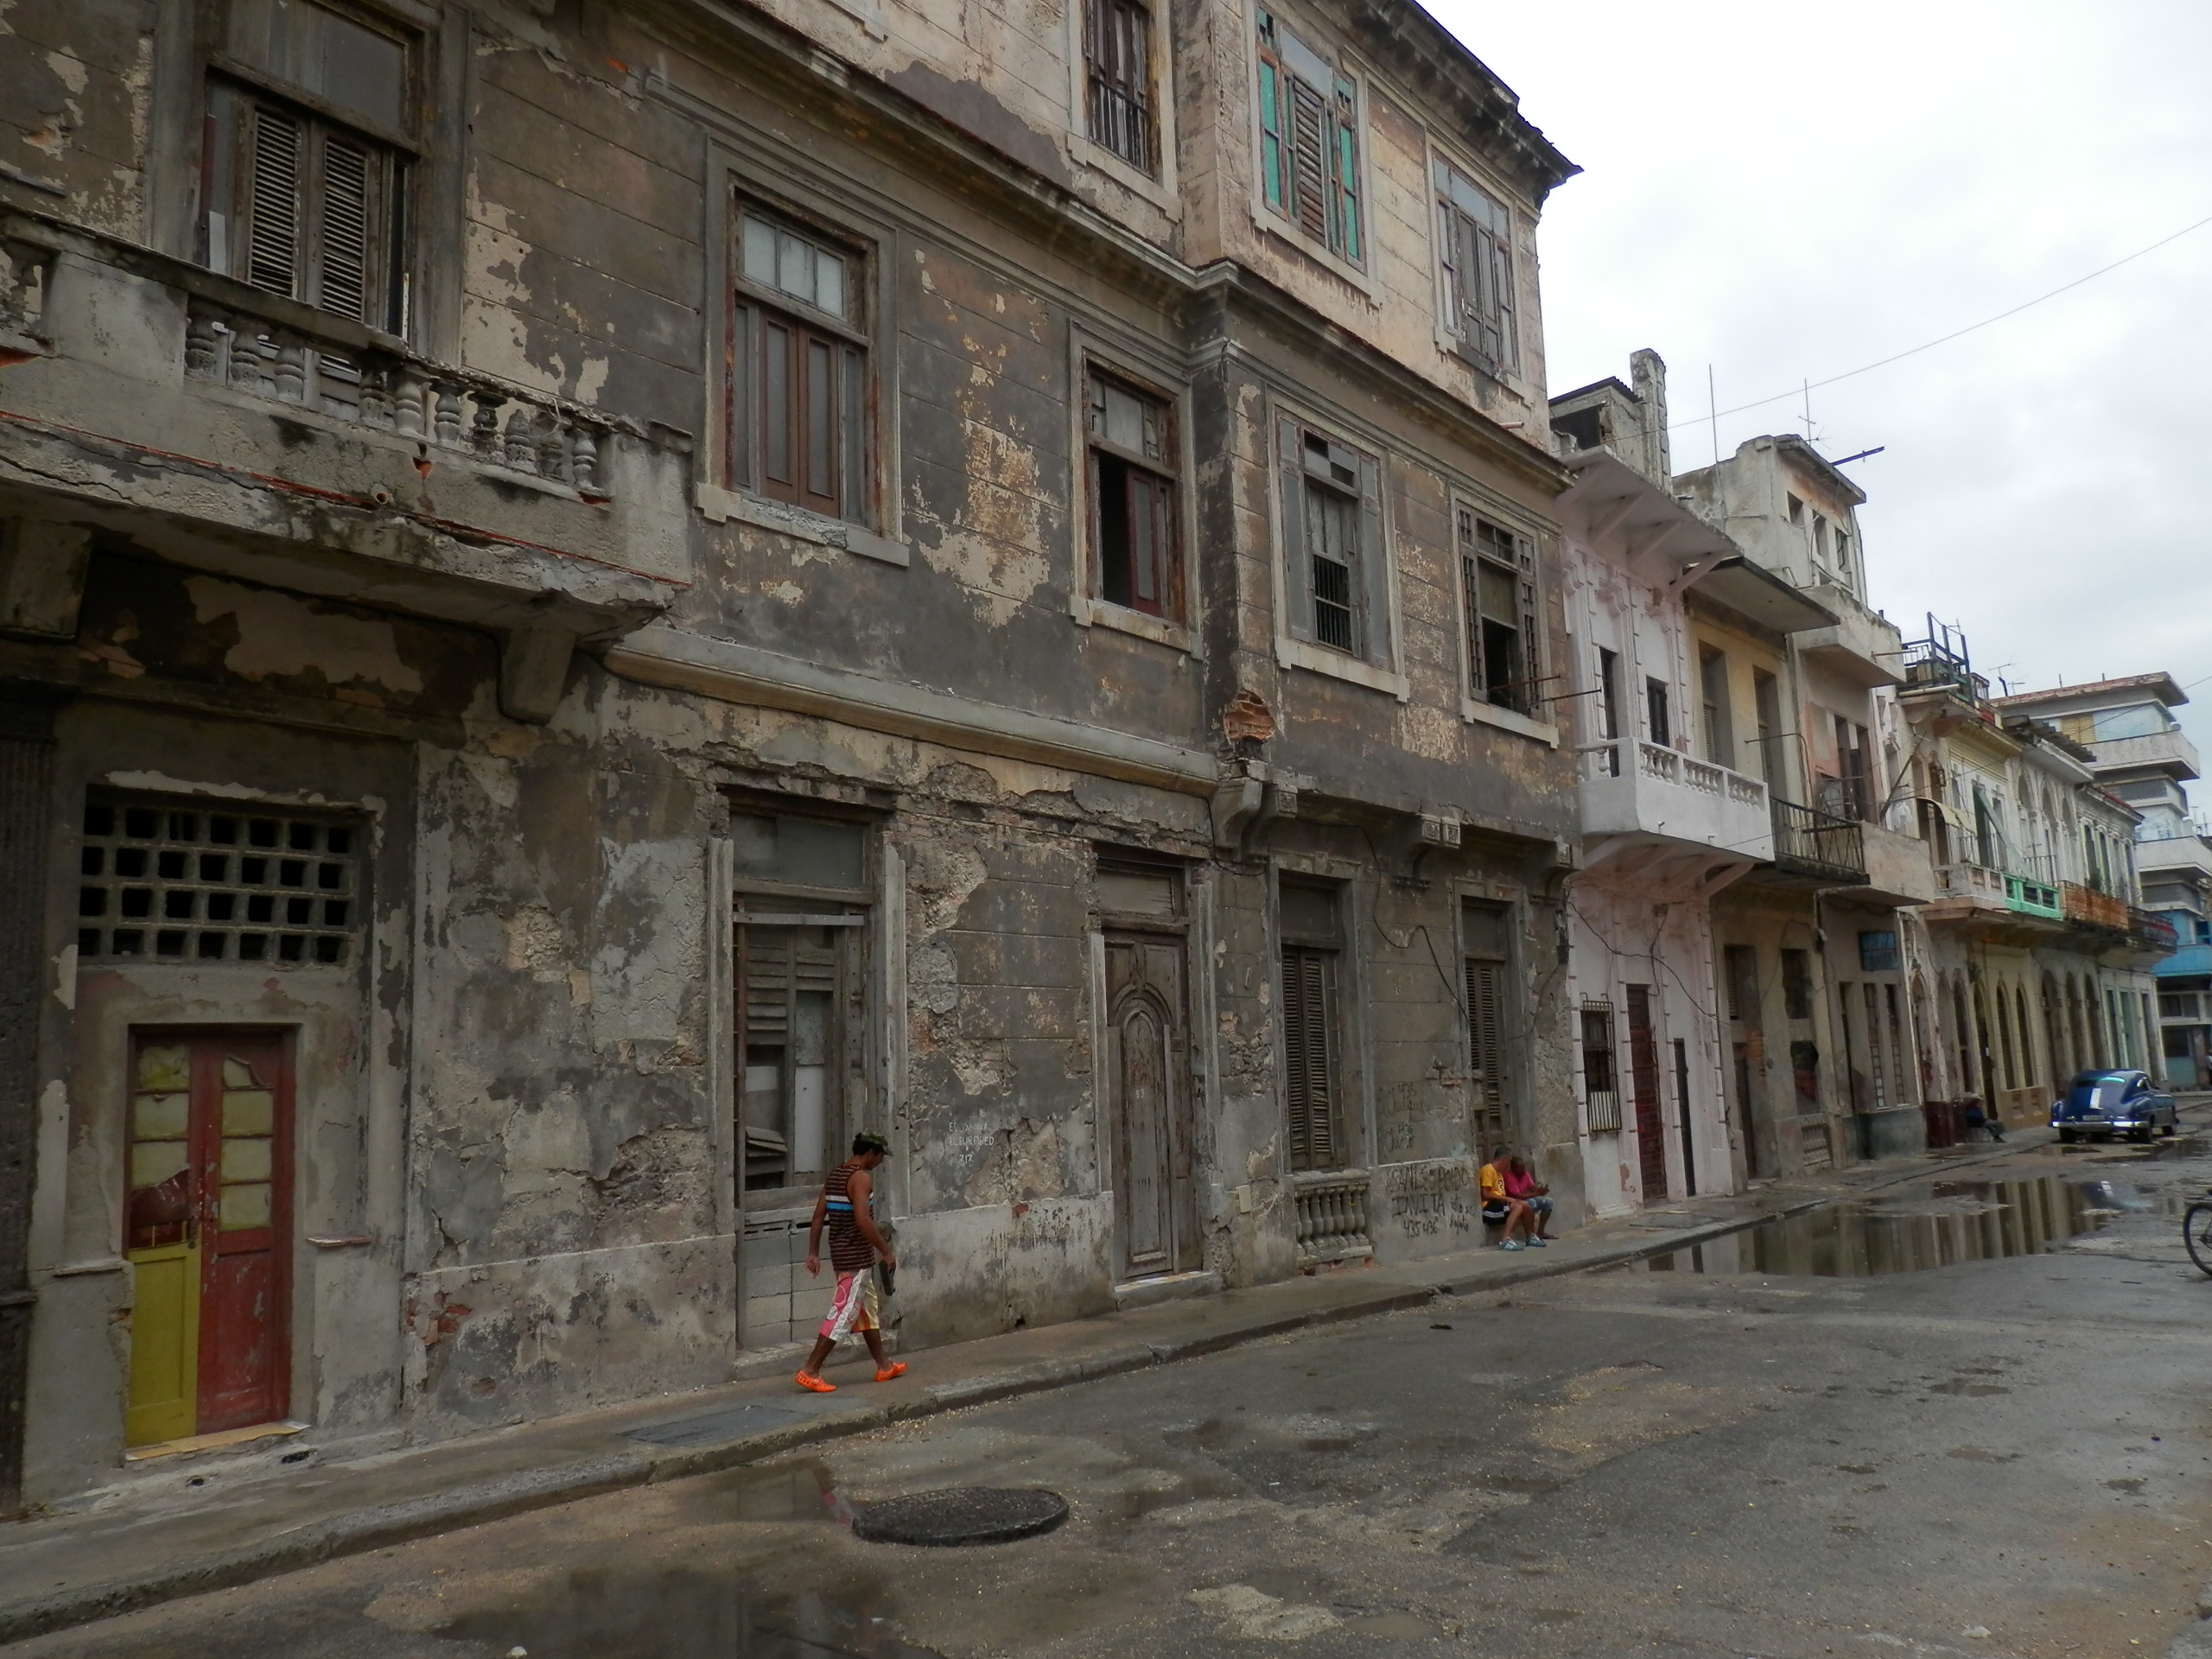
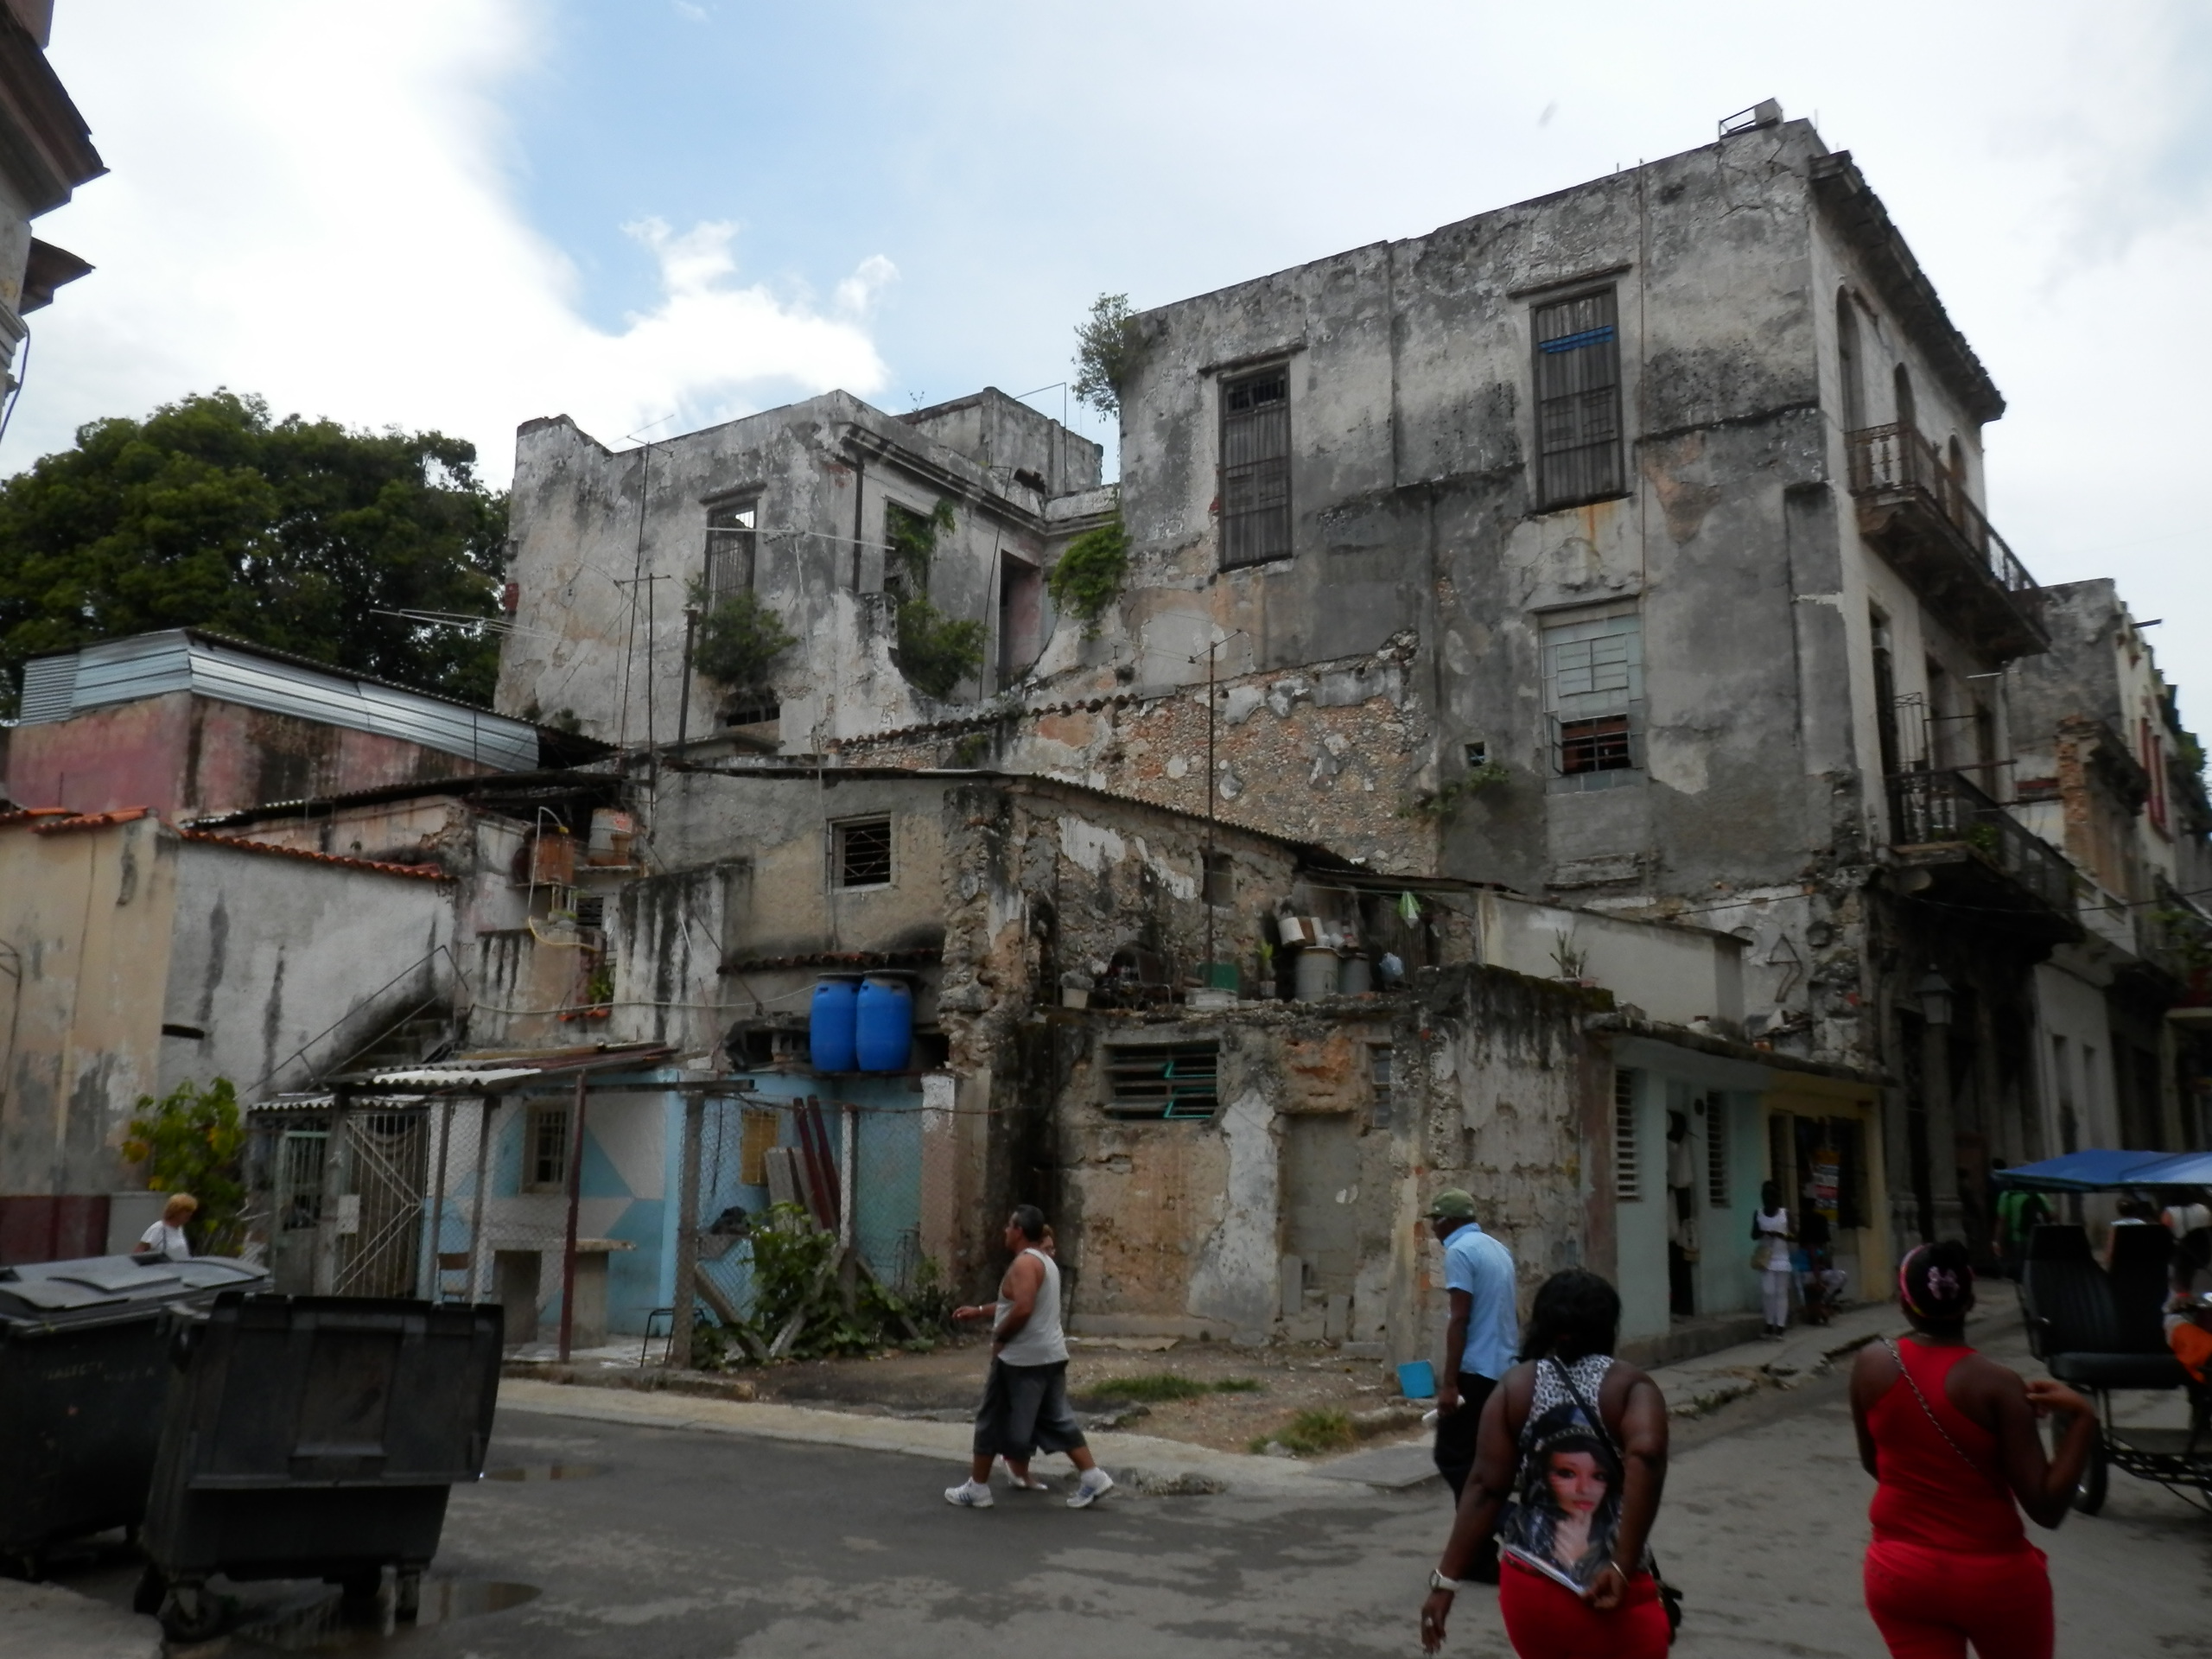
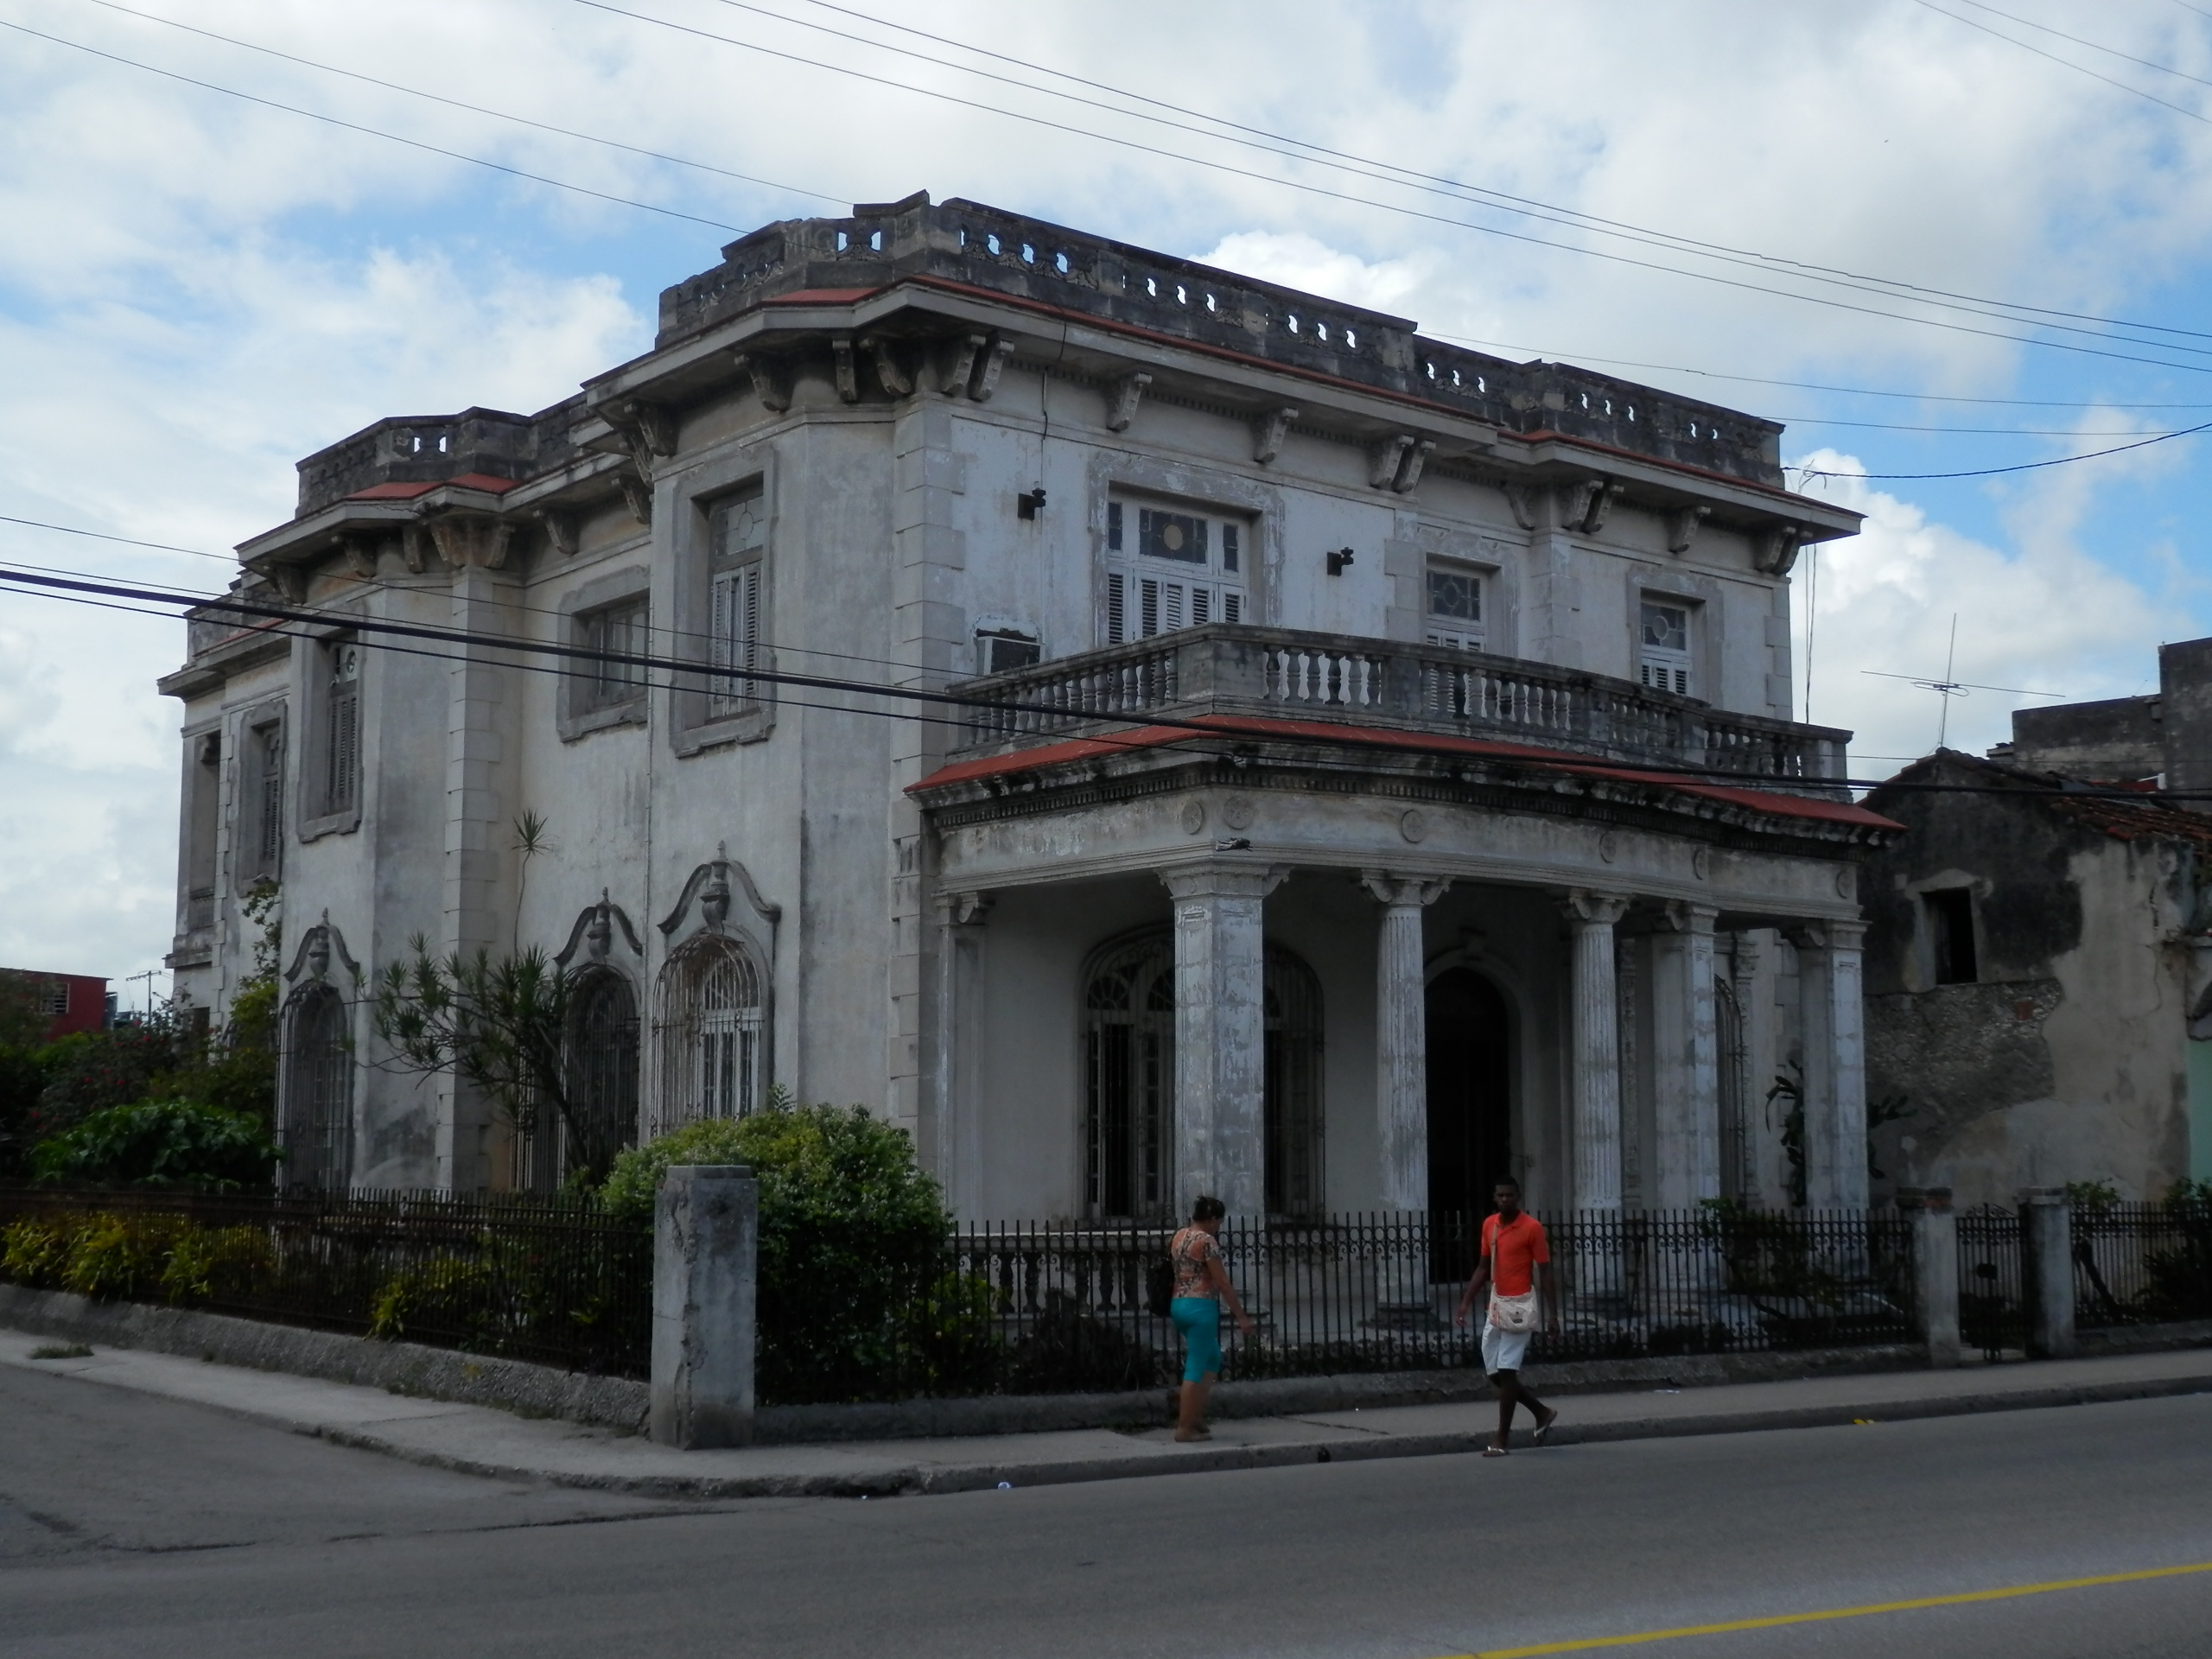
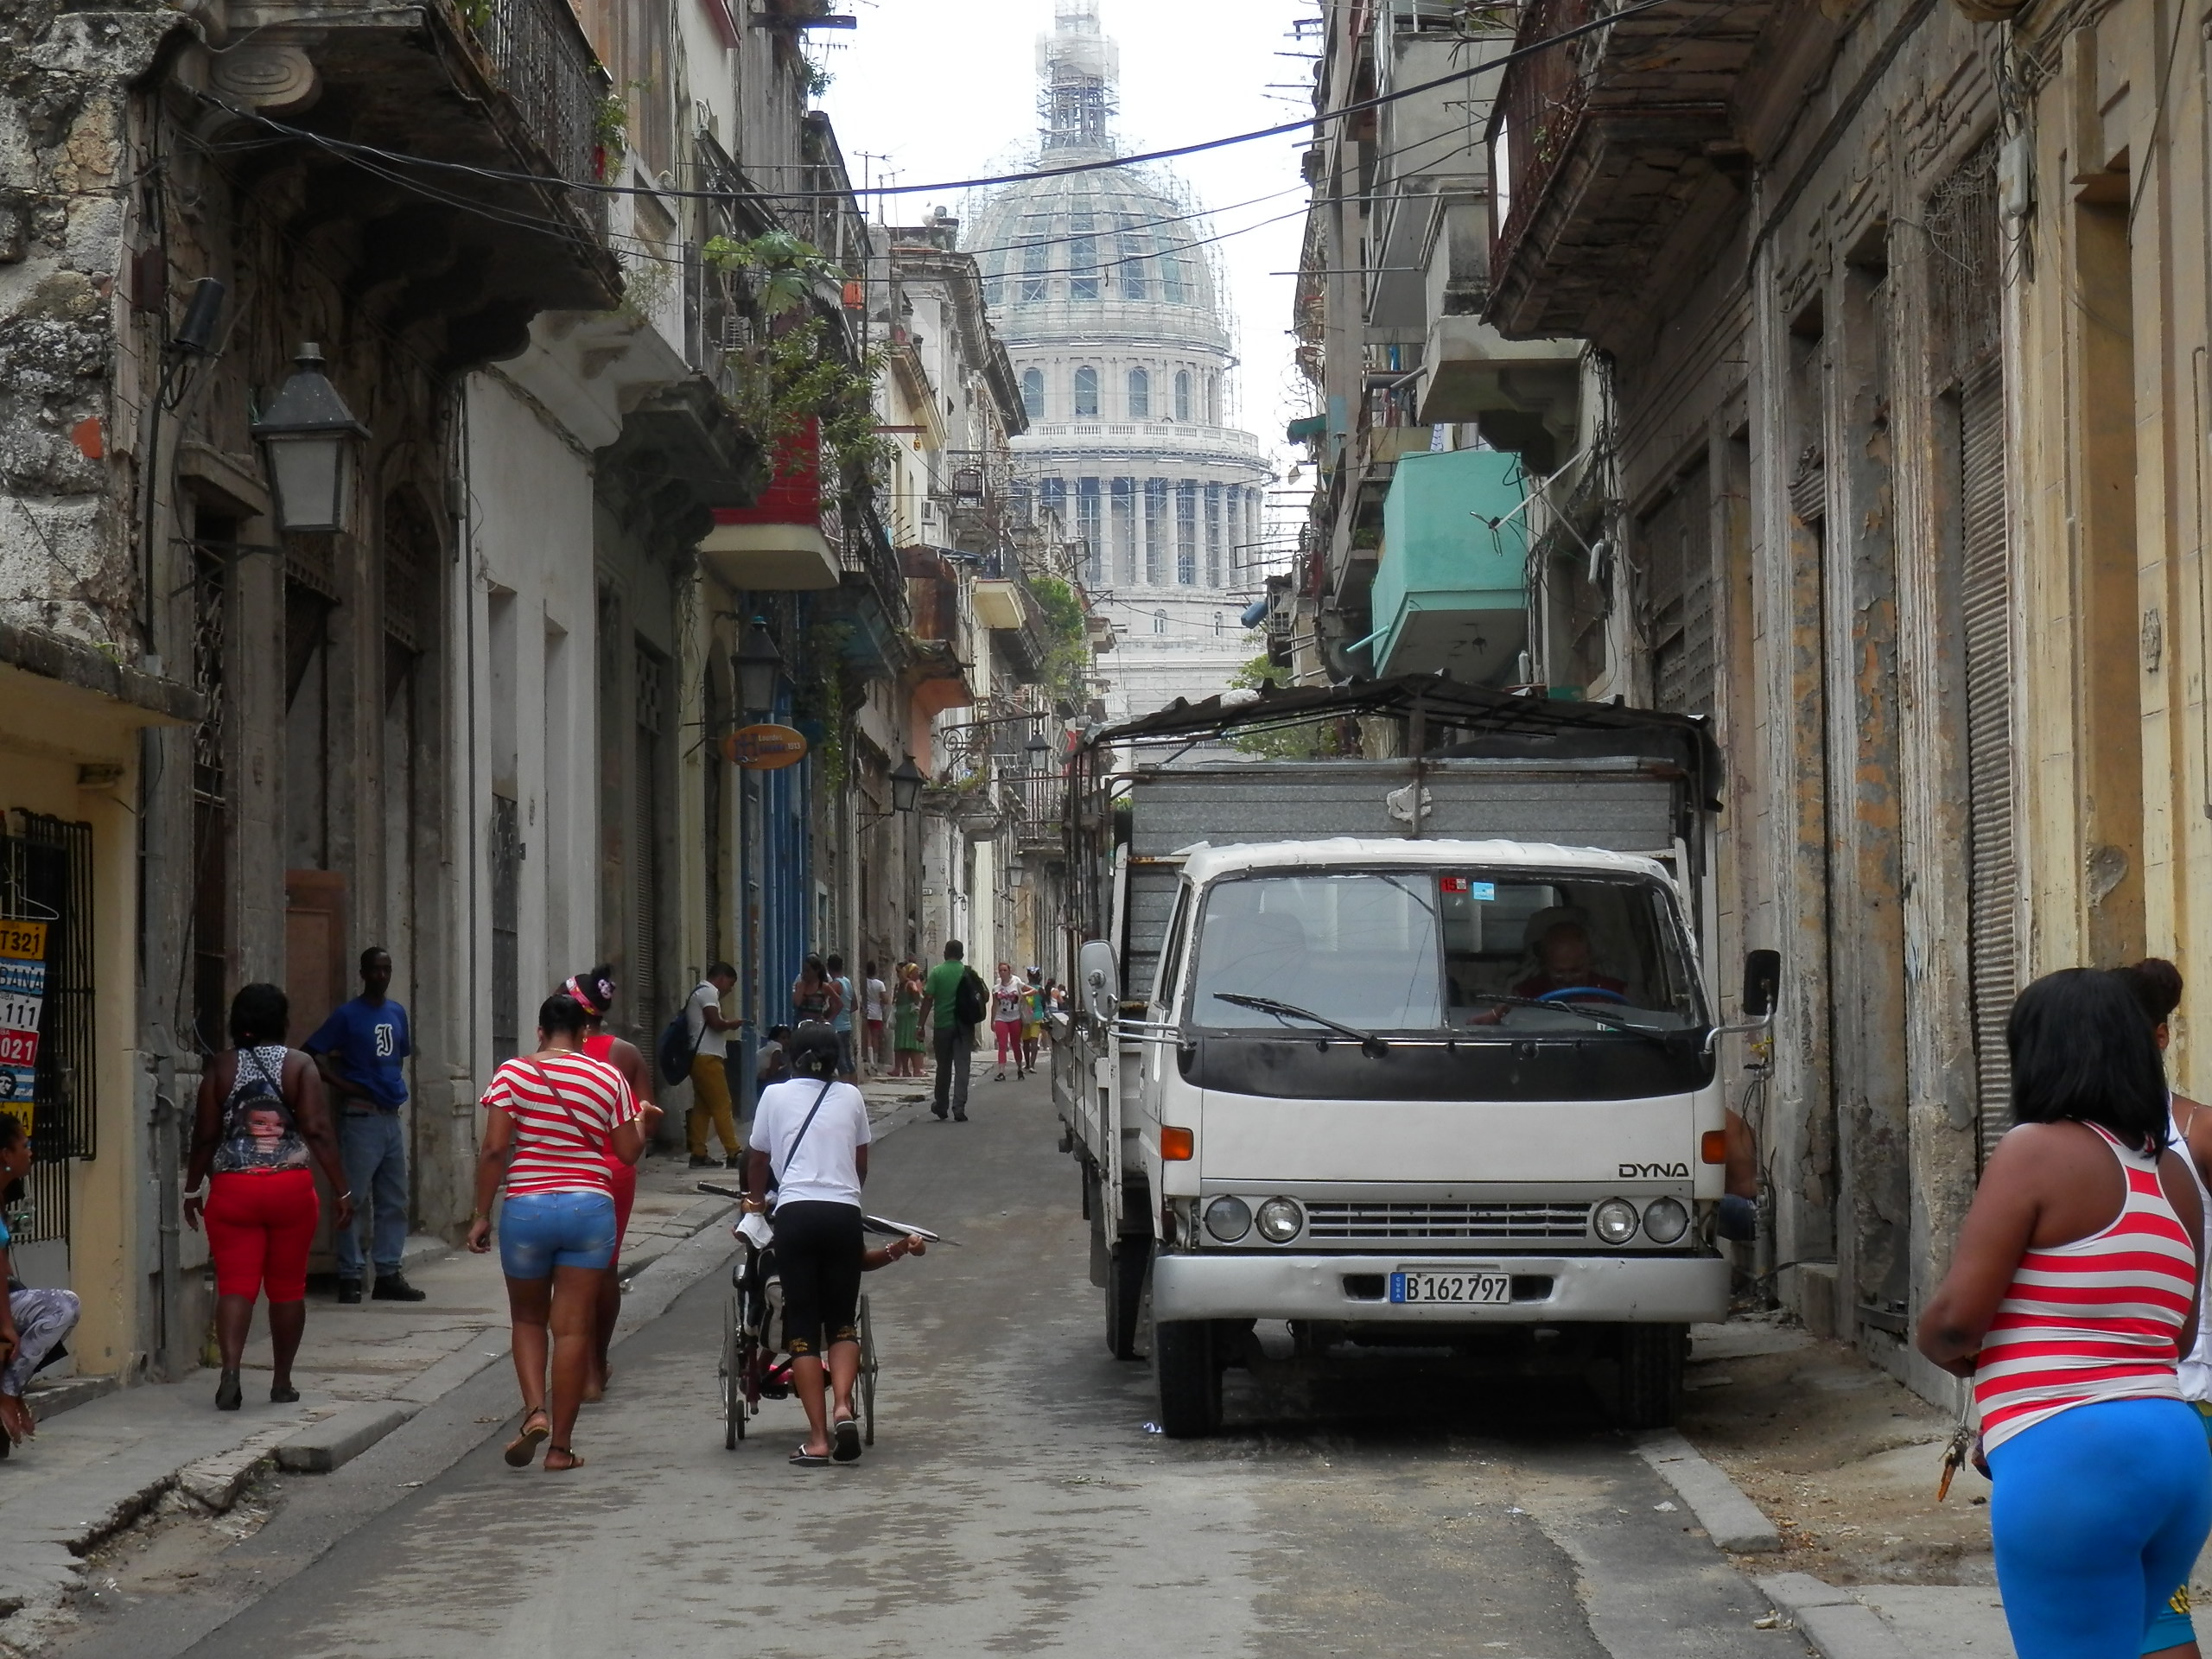
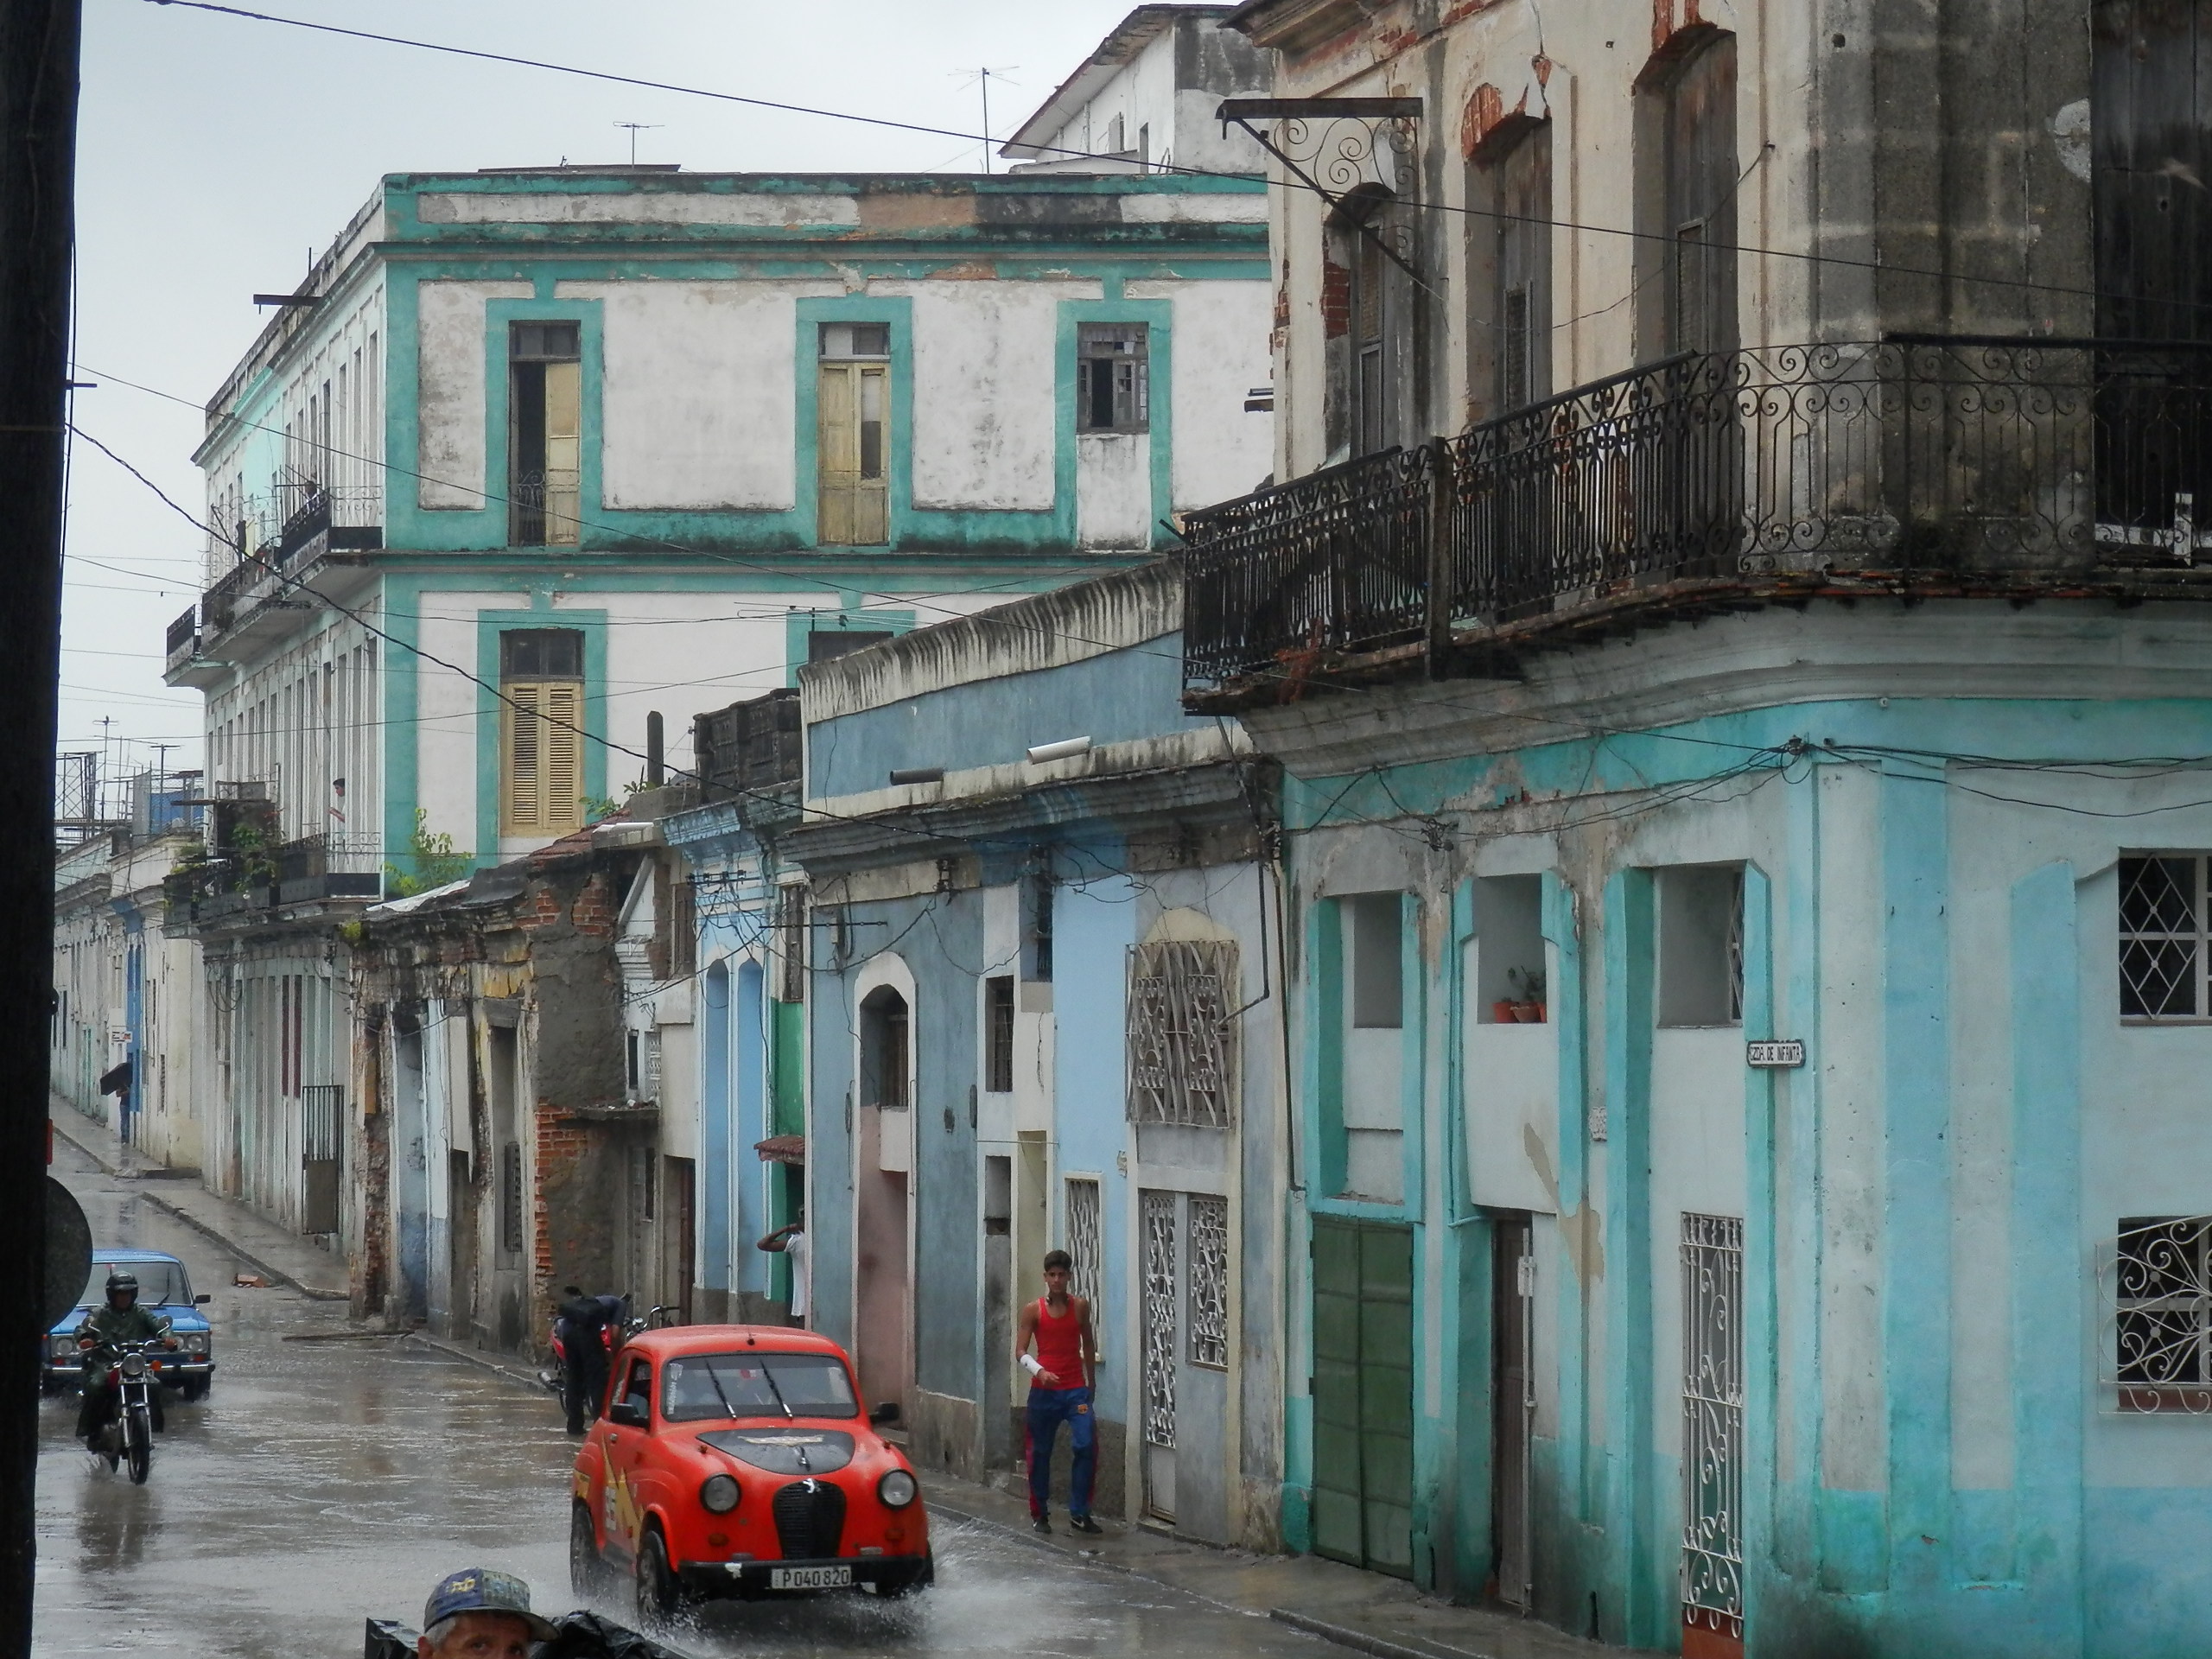
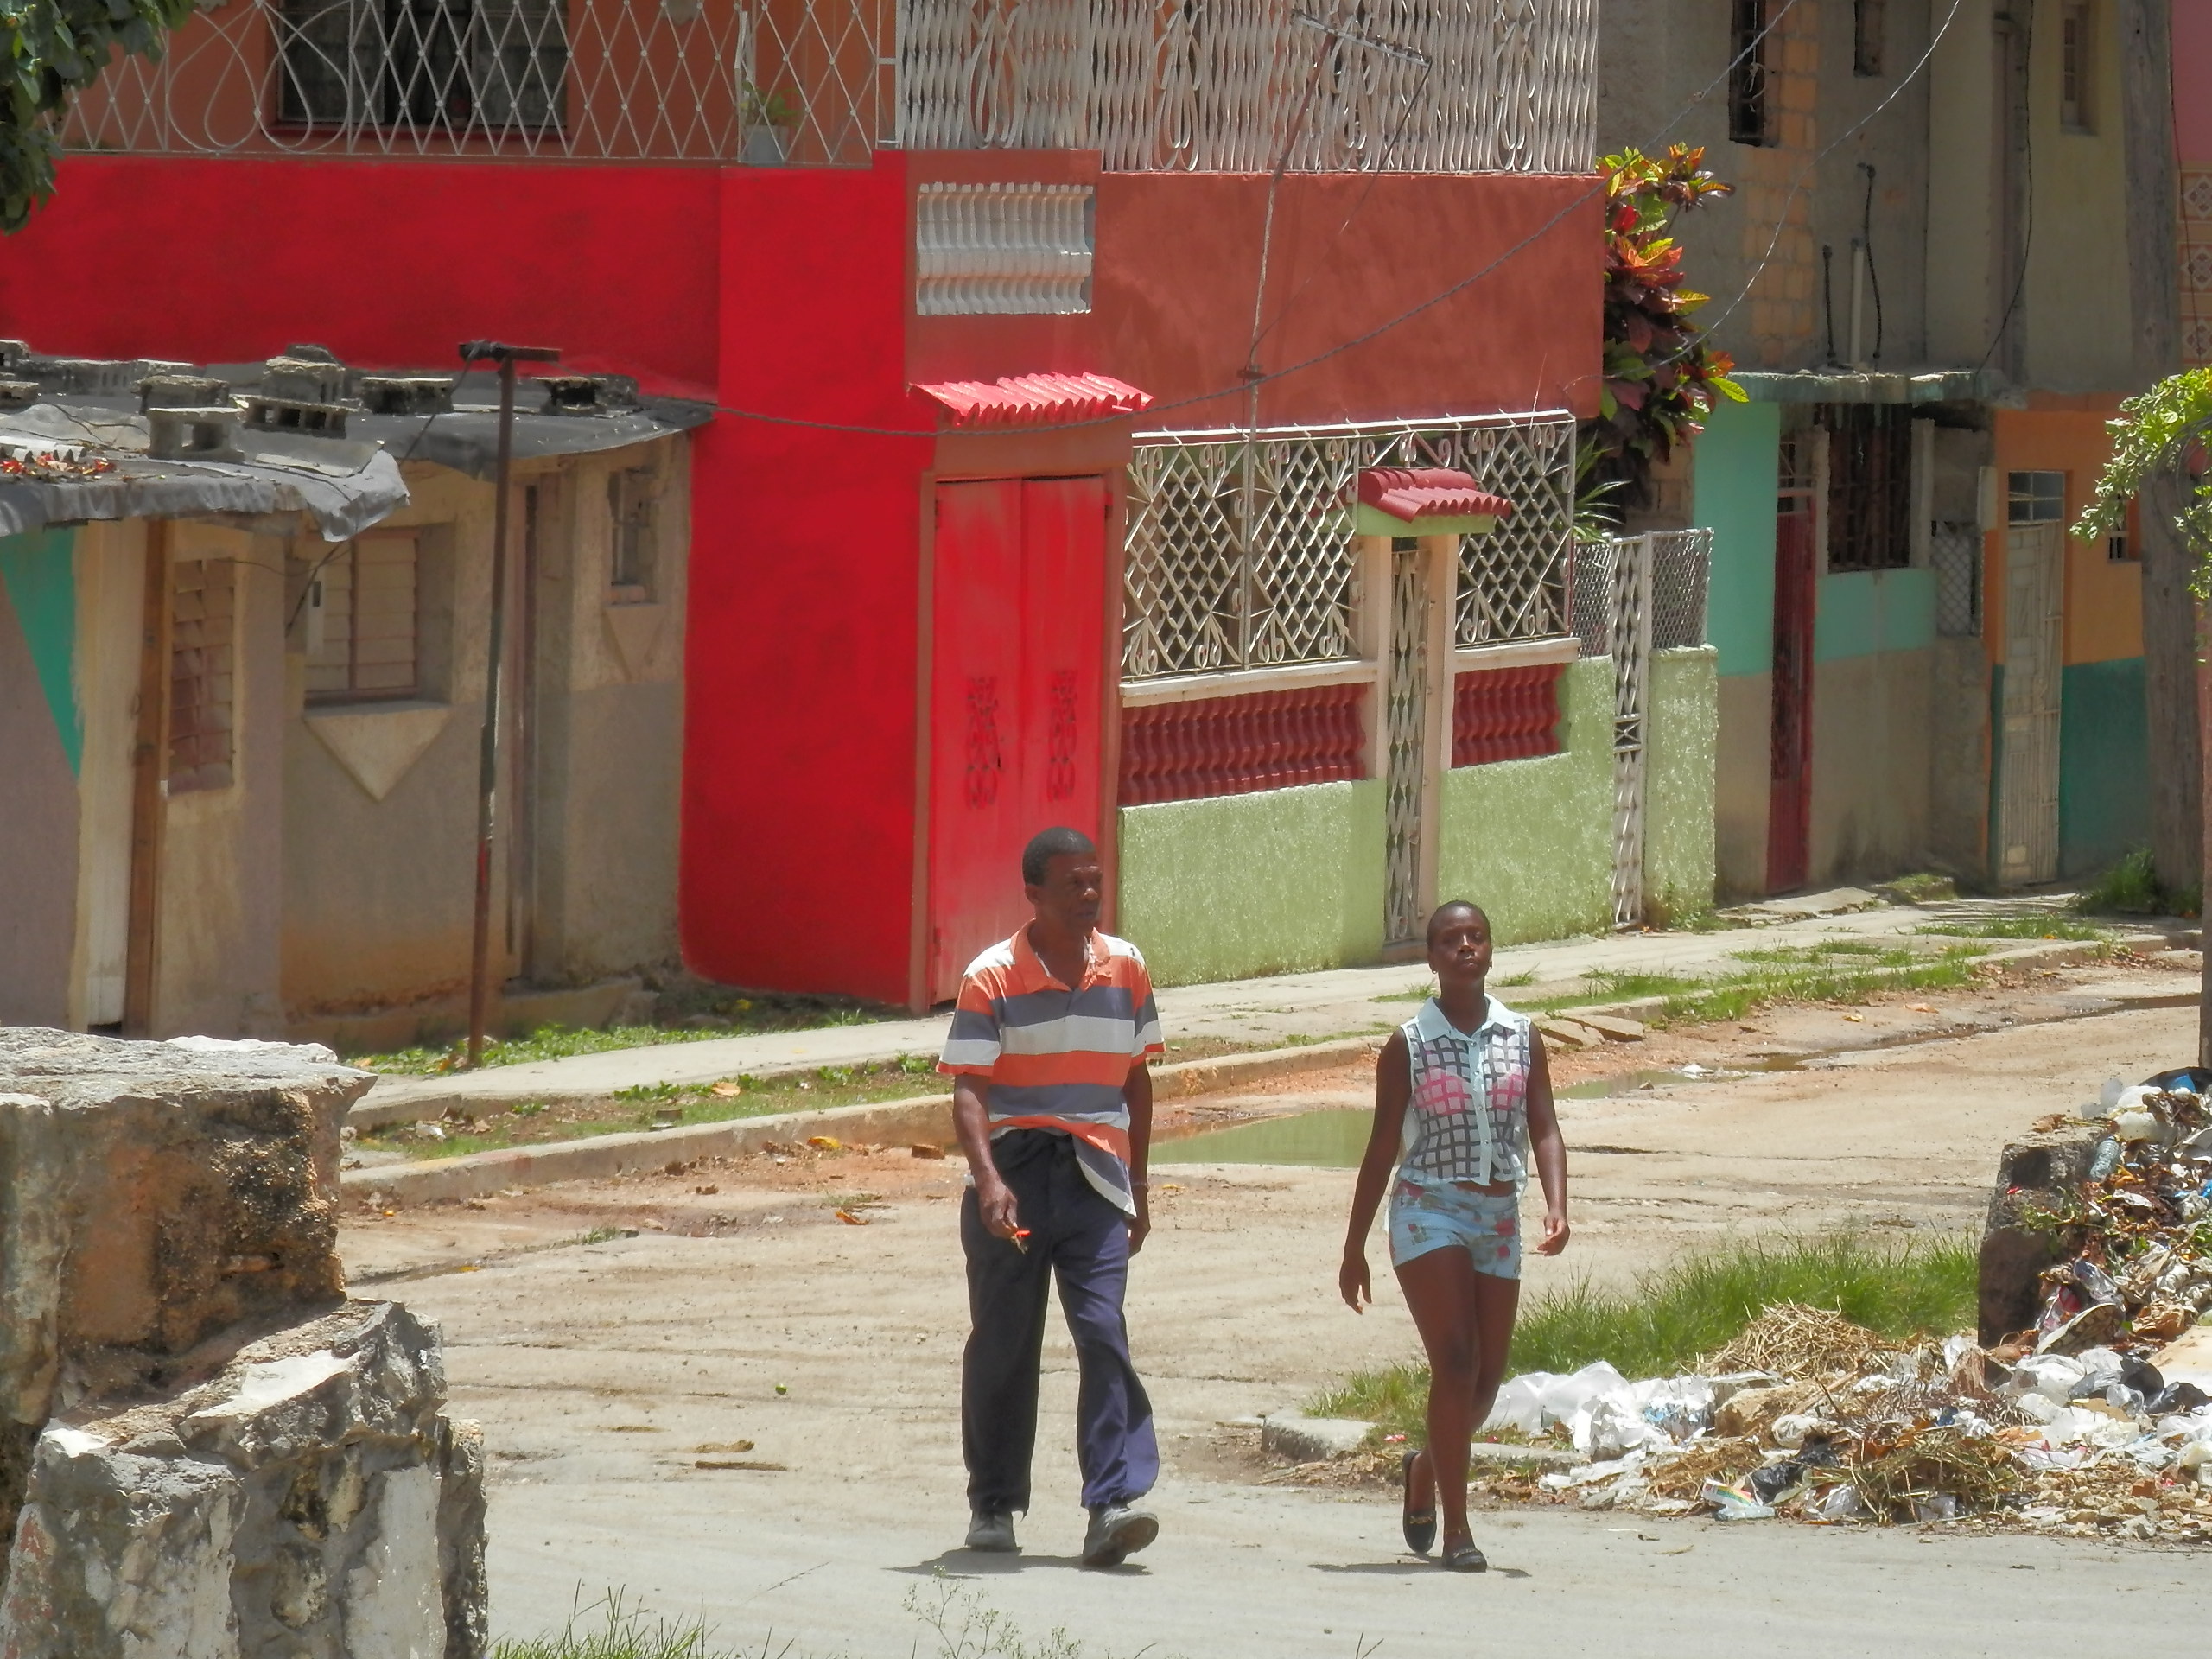
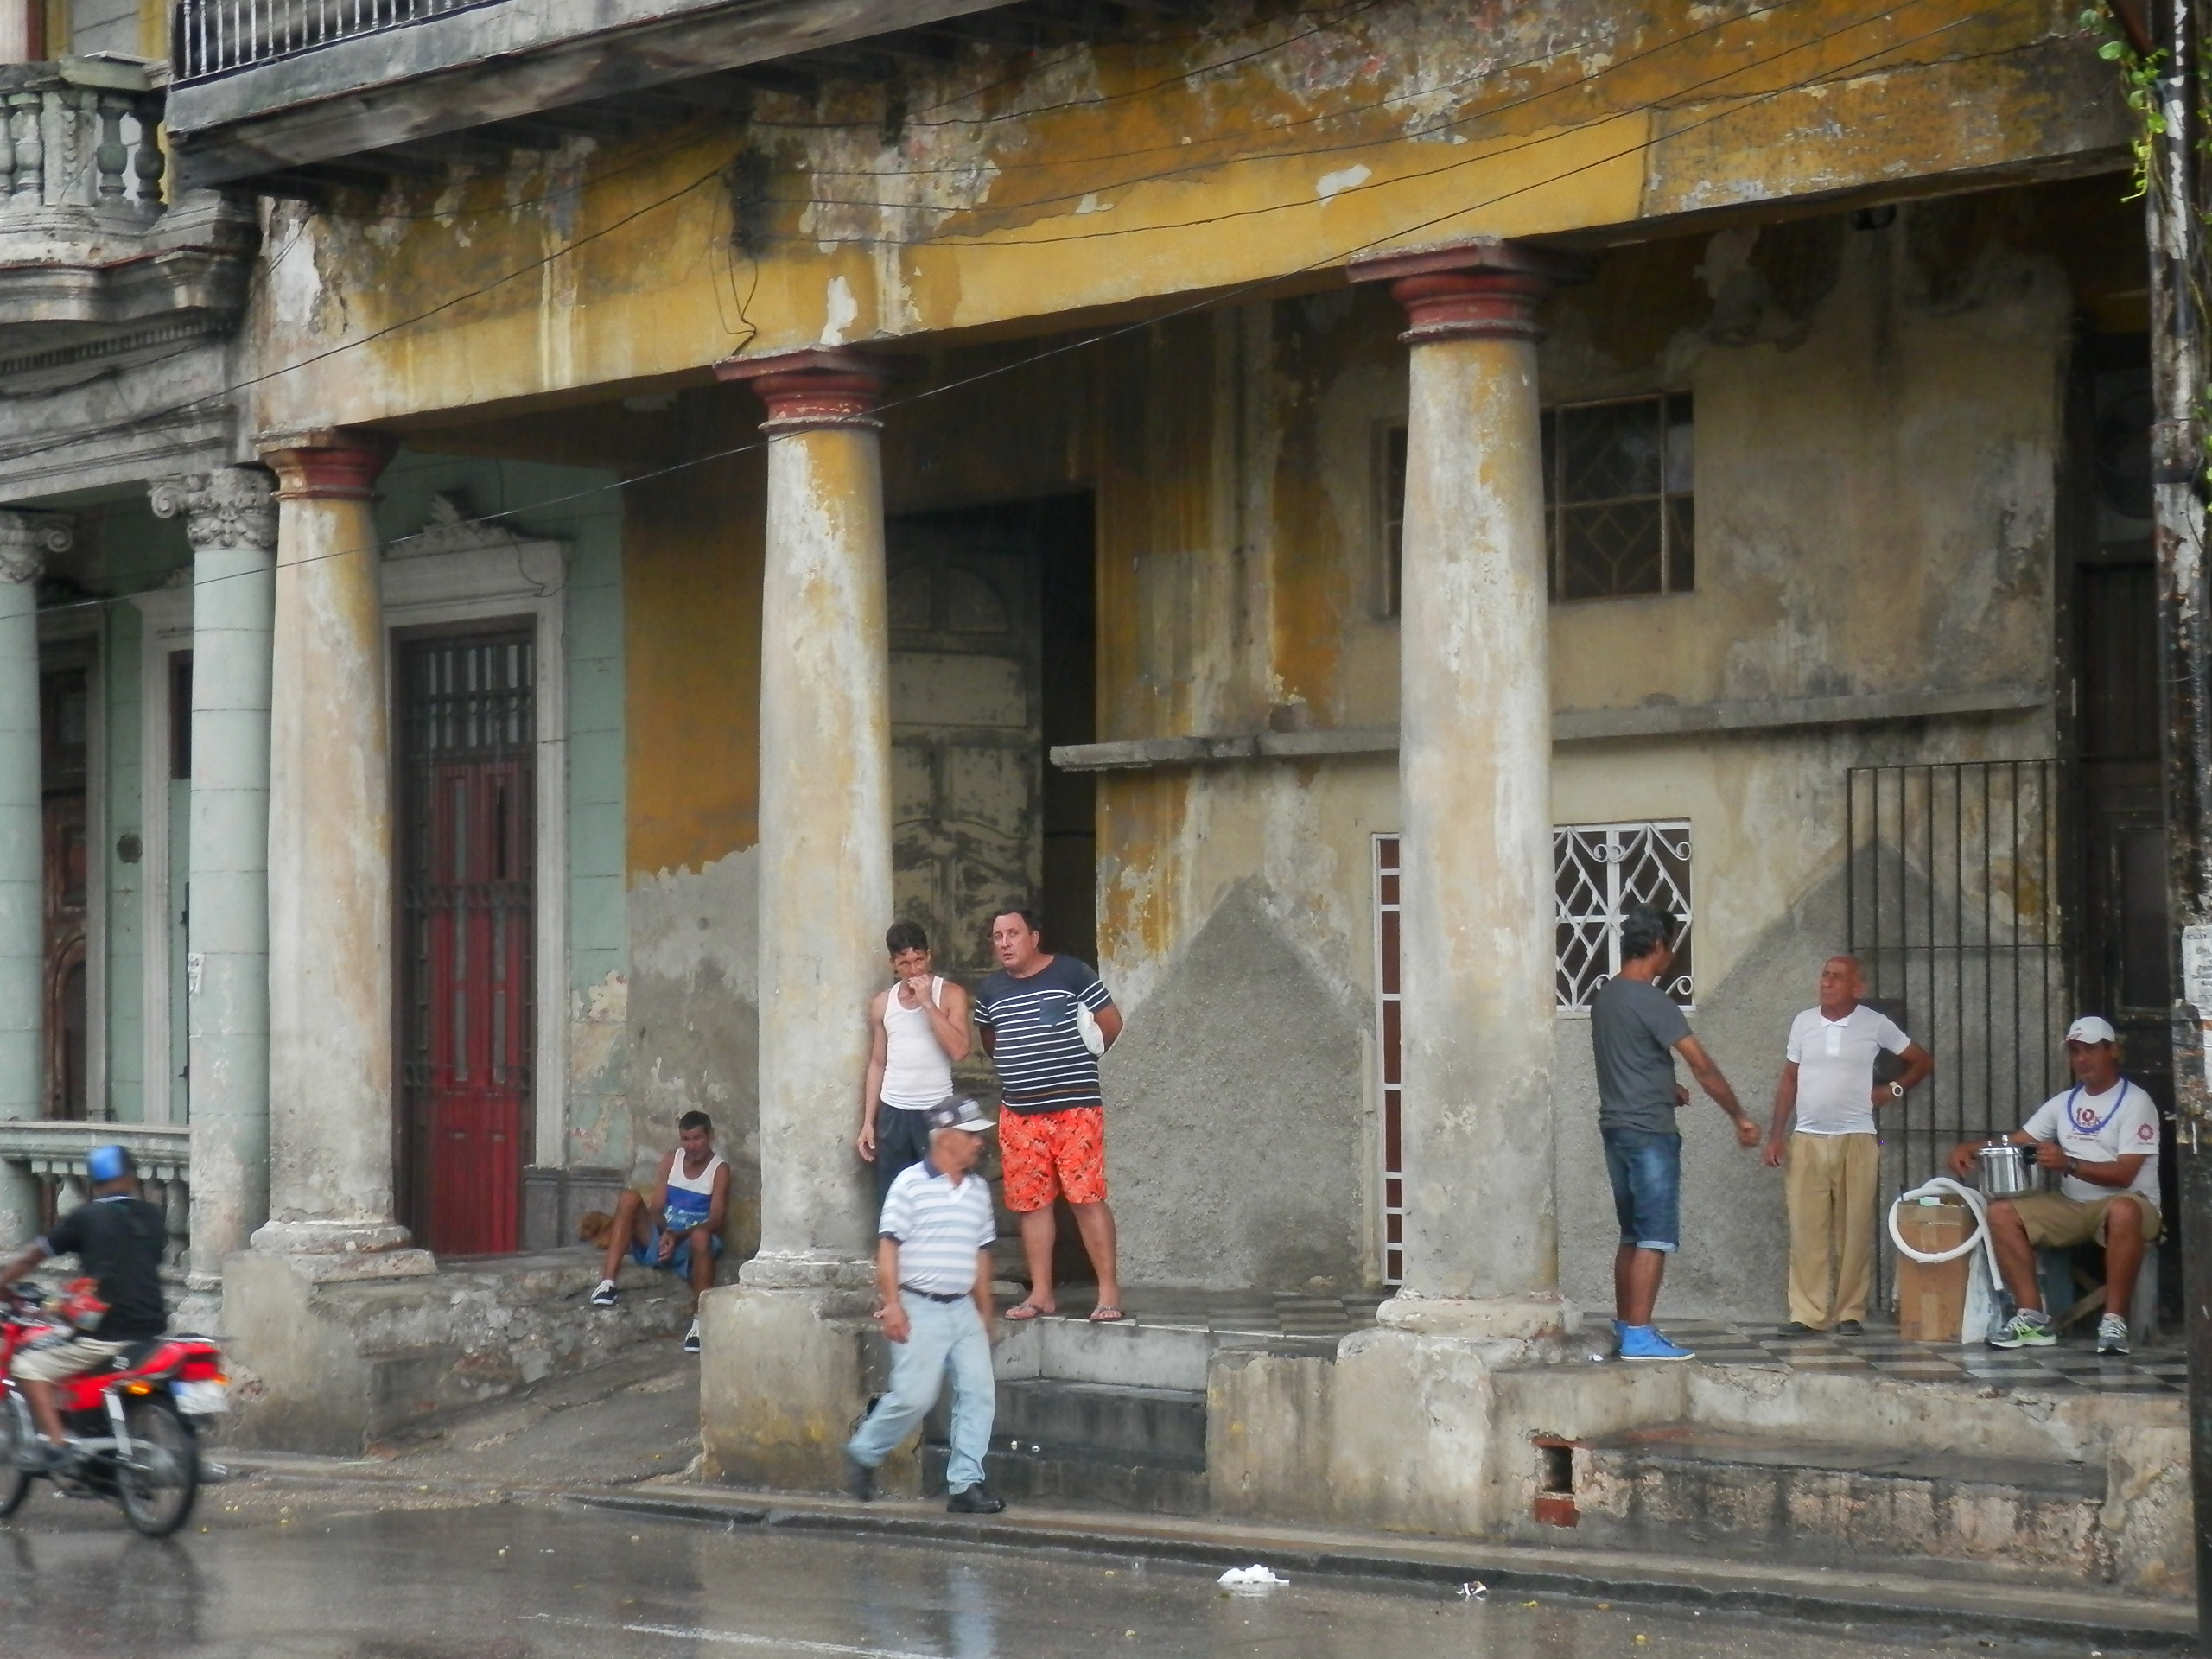
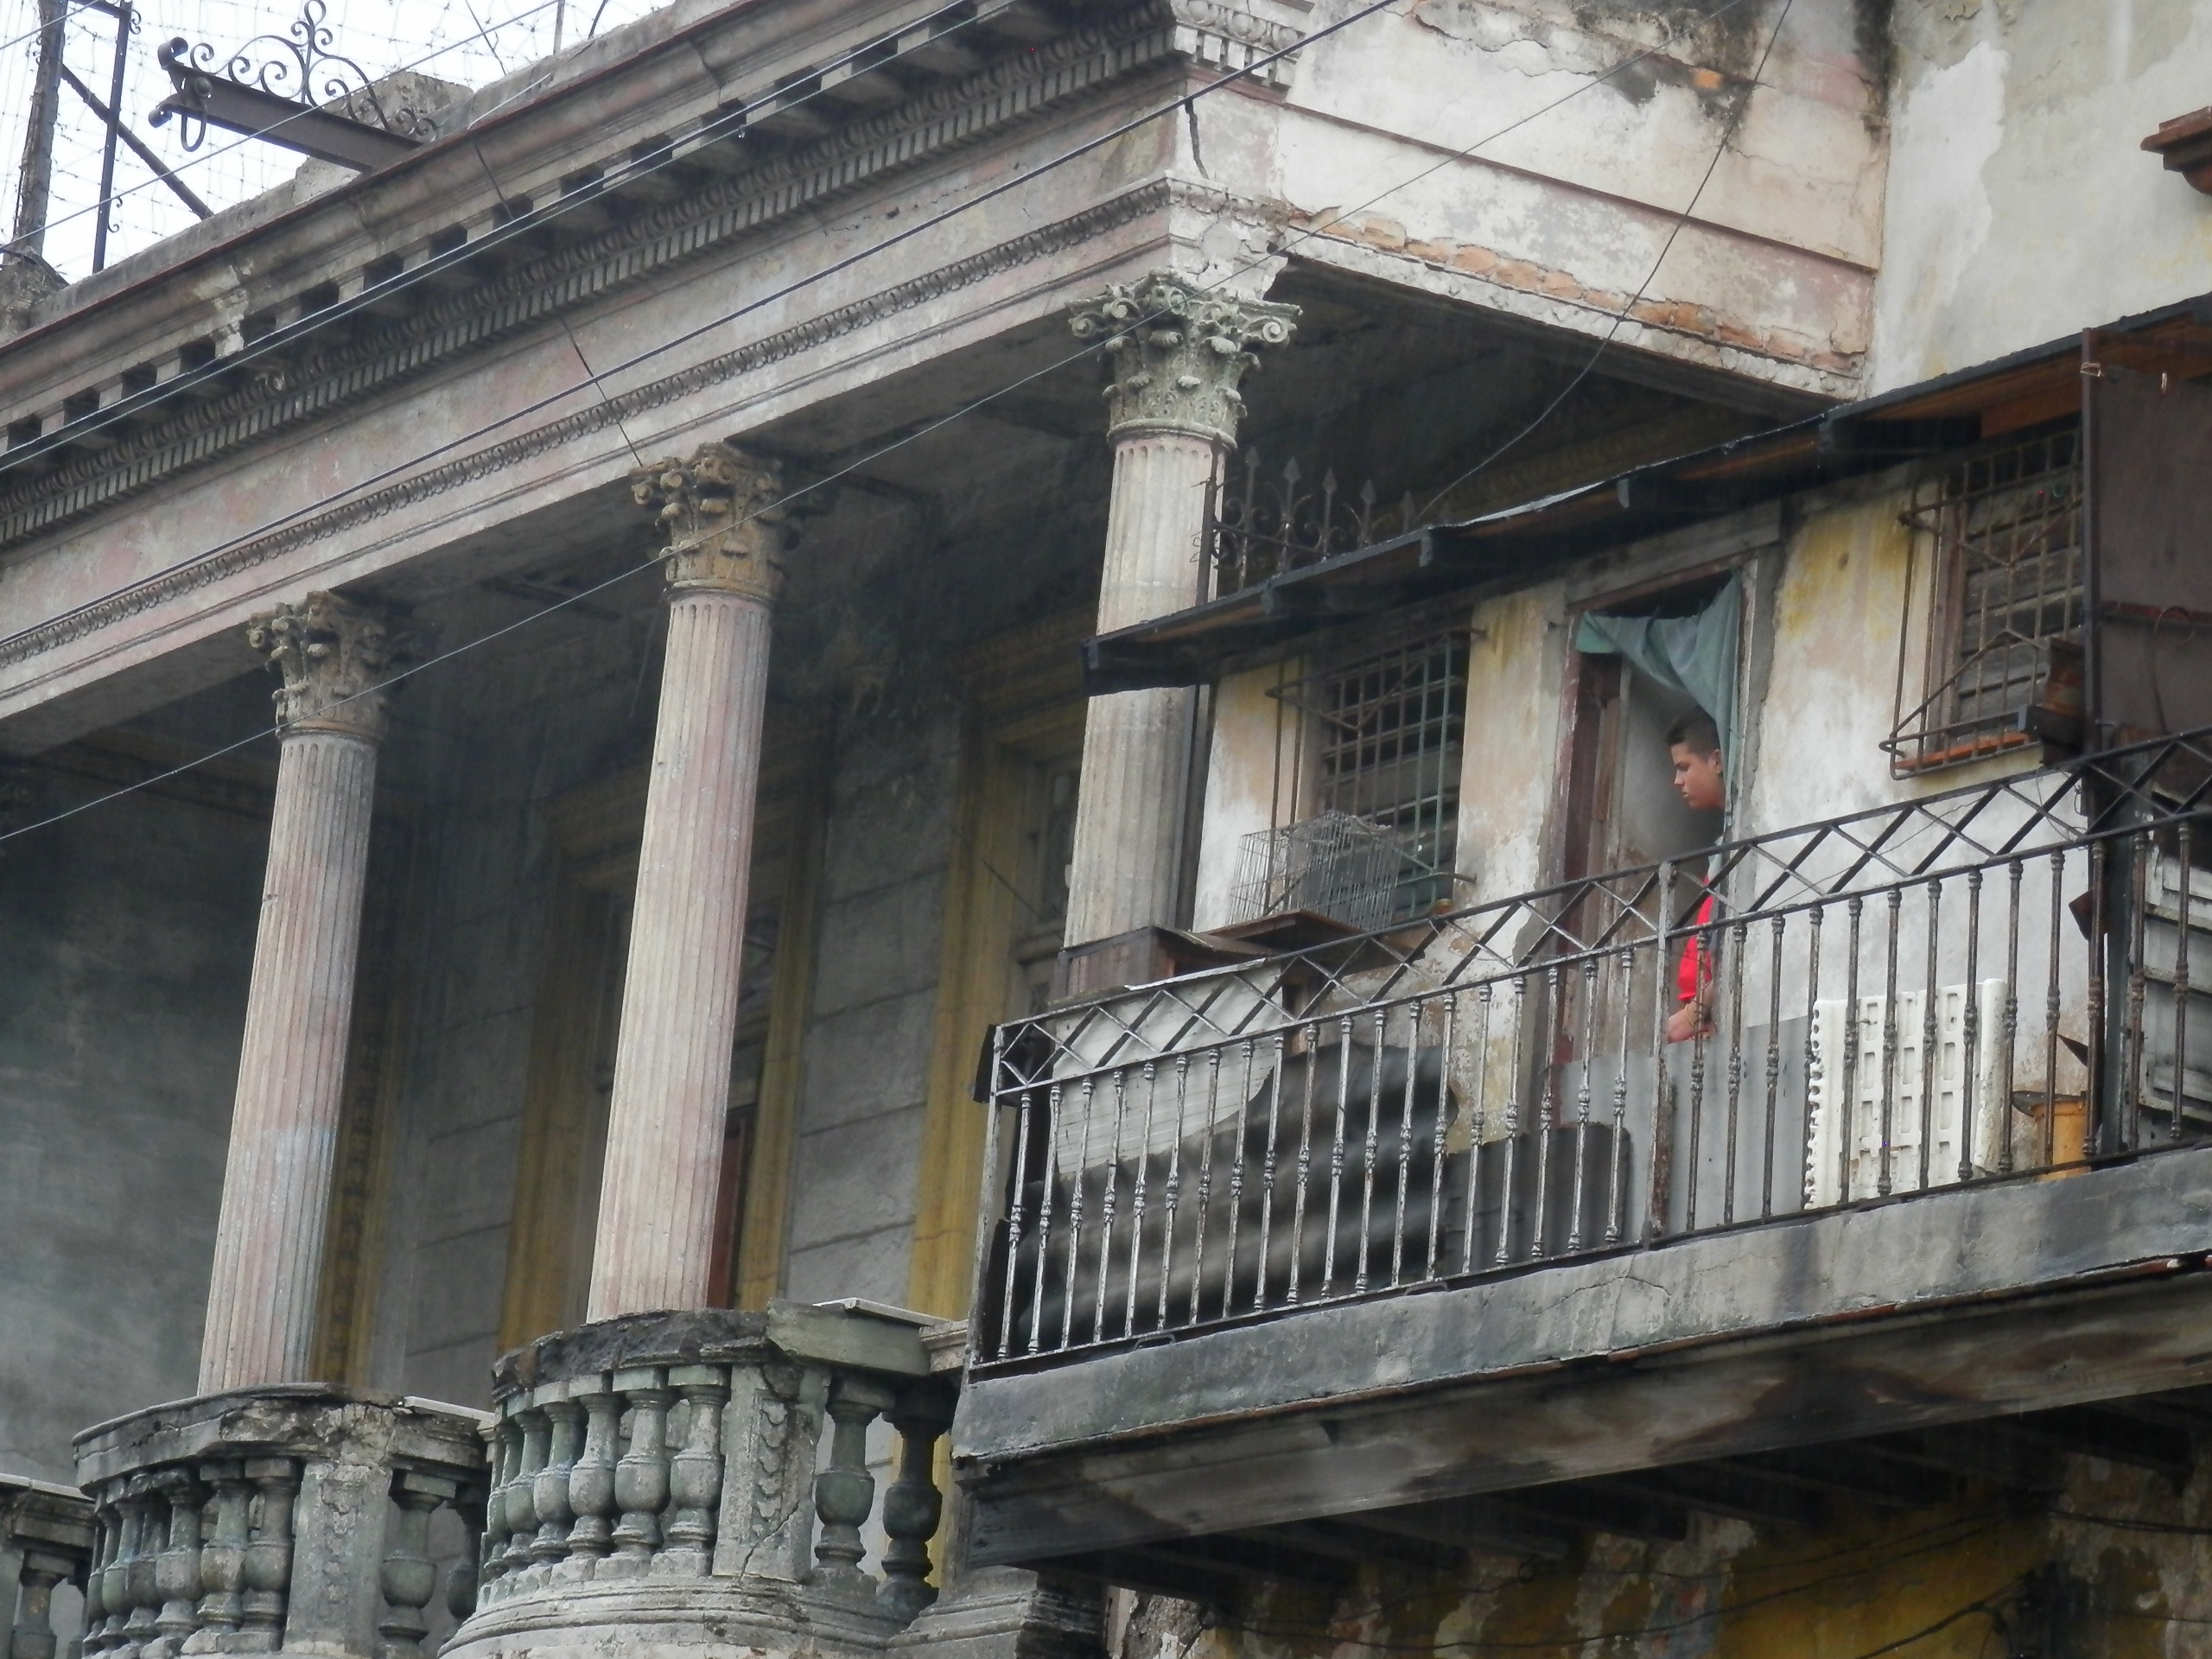
If I could define in one statement what Havana looks like, after four days of extensively biking and walking through, I’d call it the Latin American Detroit. It was a once-great city that declined because of bad policies, and its pervasive ruination serves as a constant reminder of this. The houses themselves, while large and ornate, are almost uniformly inadequate by U.S. standards. If they have not crumbled to the ground altogether, many are caving in. The foundations are crooked, full of holes, and marred by broken windows and doors. Because of Havana’s European roots, stucco is a common material, but on most buildings is falling off, or in some cases has disappeared. Almost every building has dirt and grime, while some are covered in it.
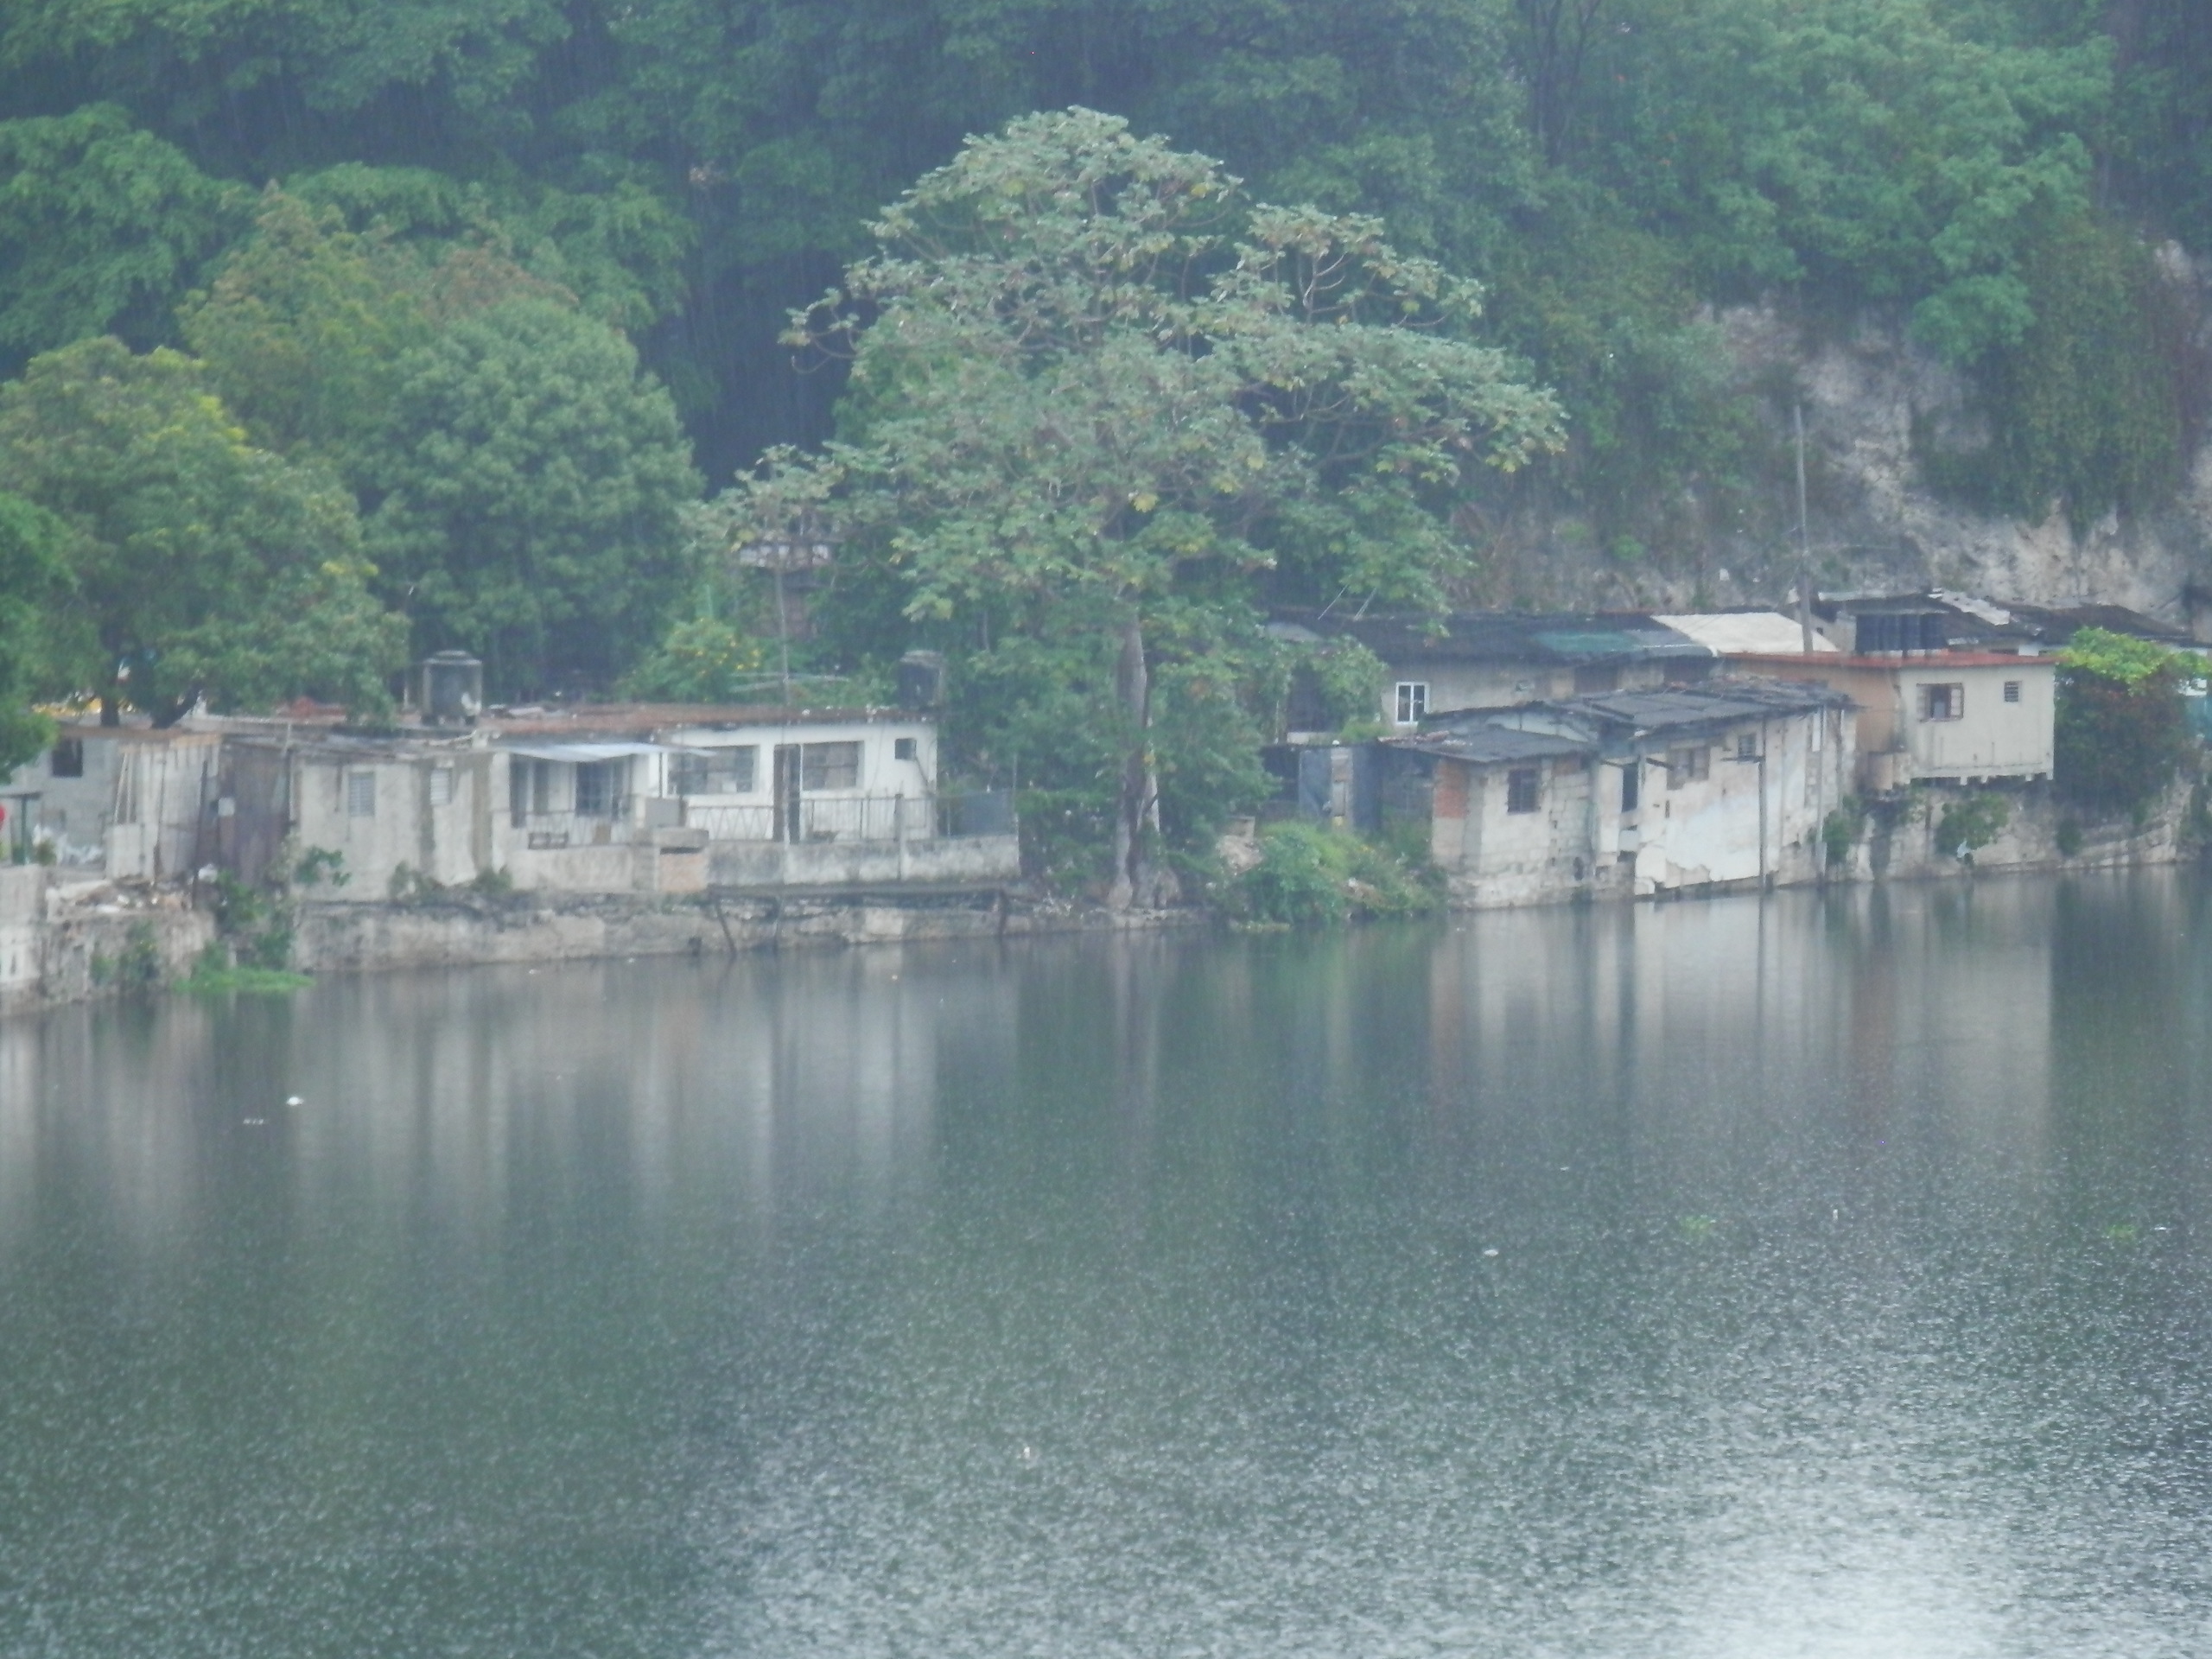
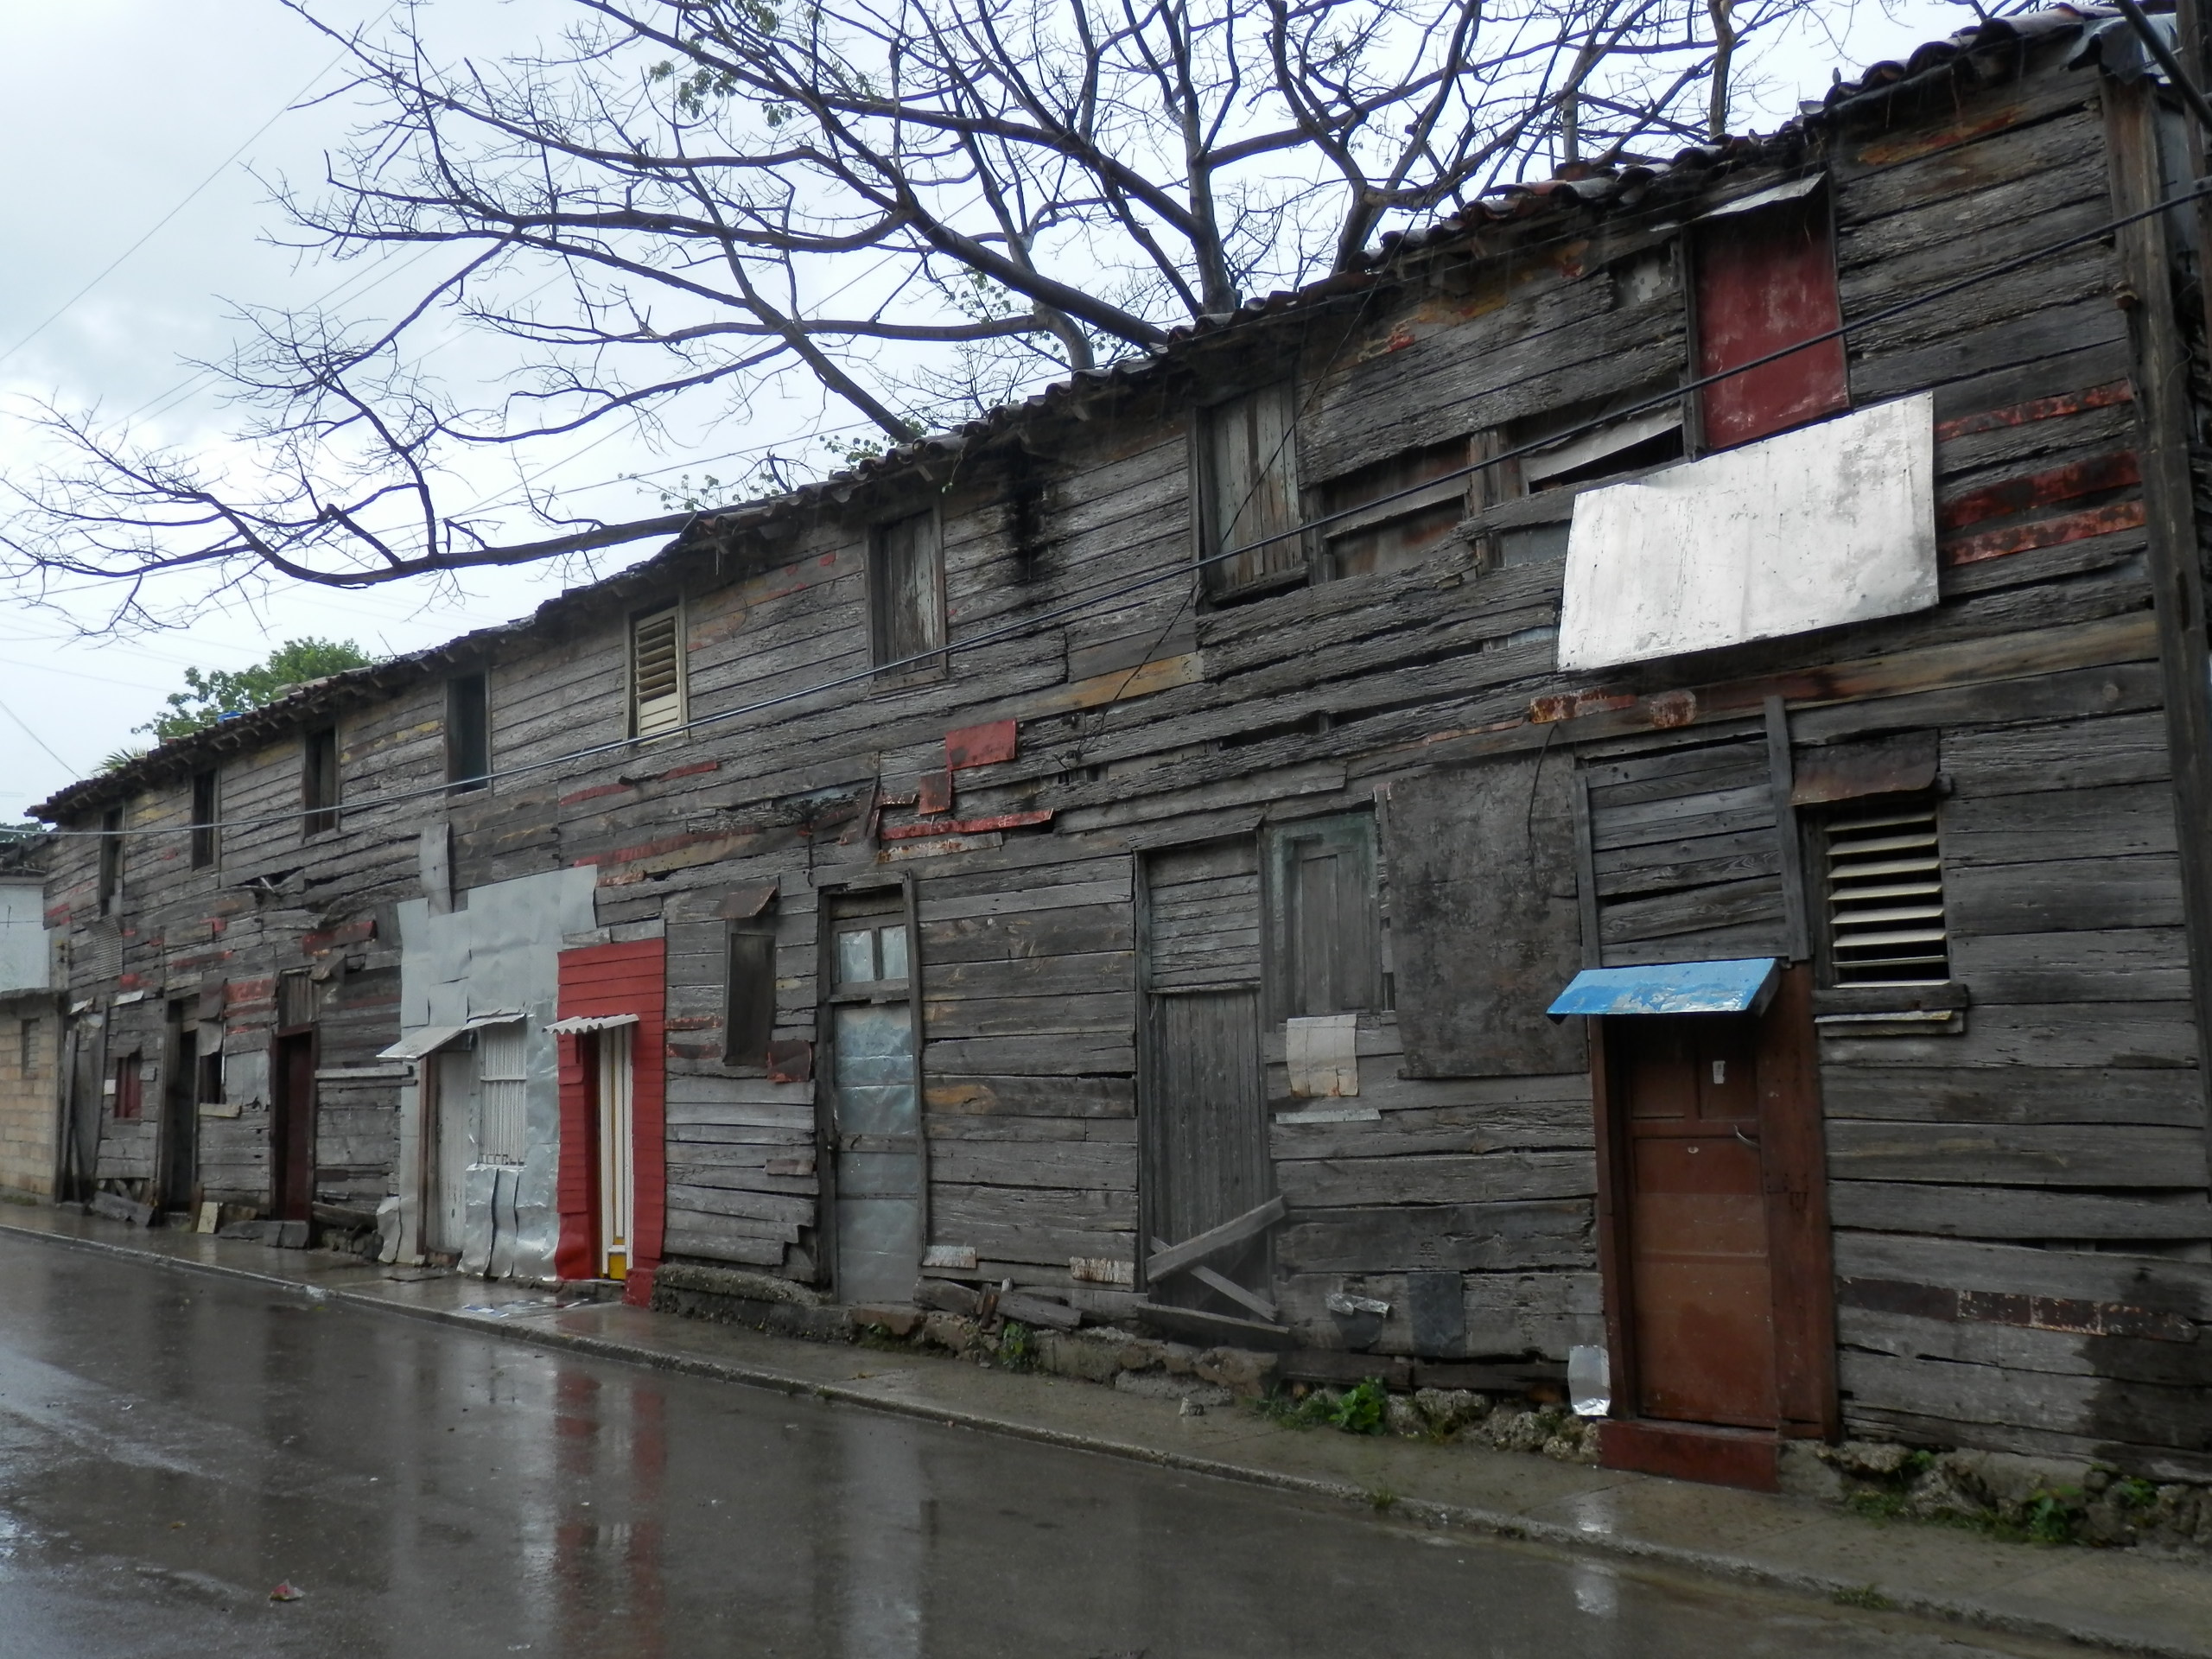
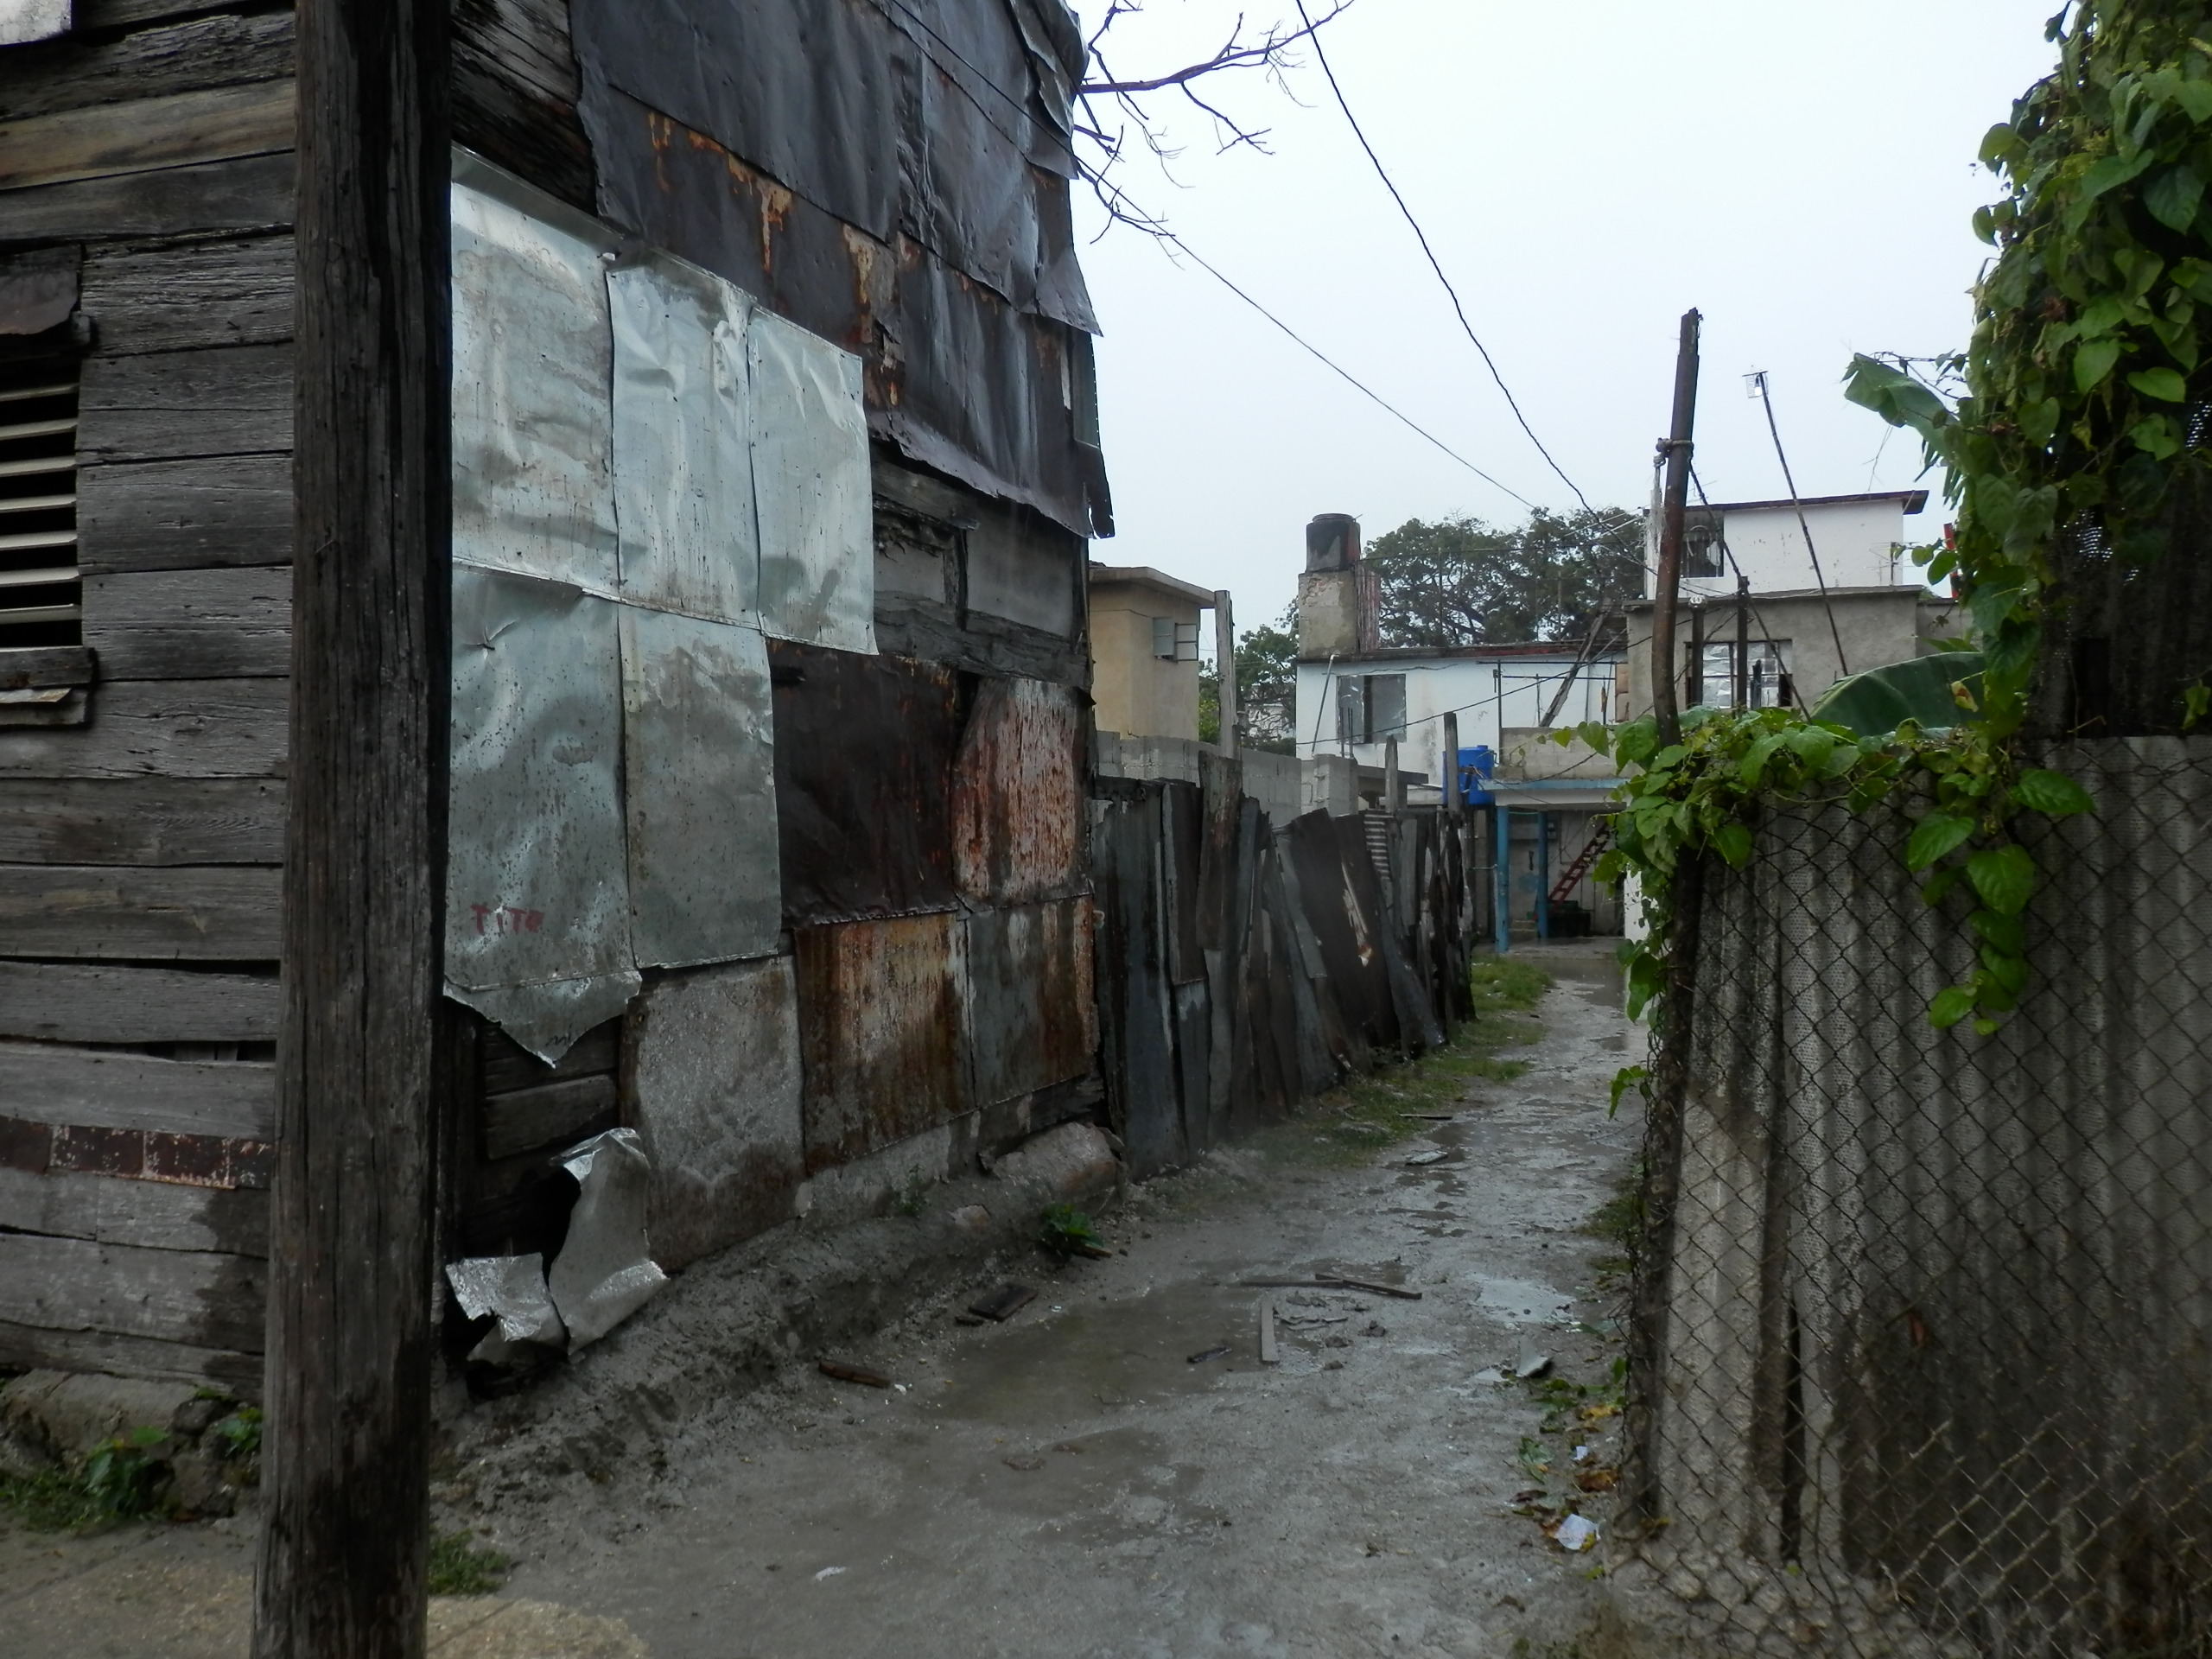
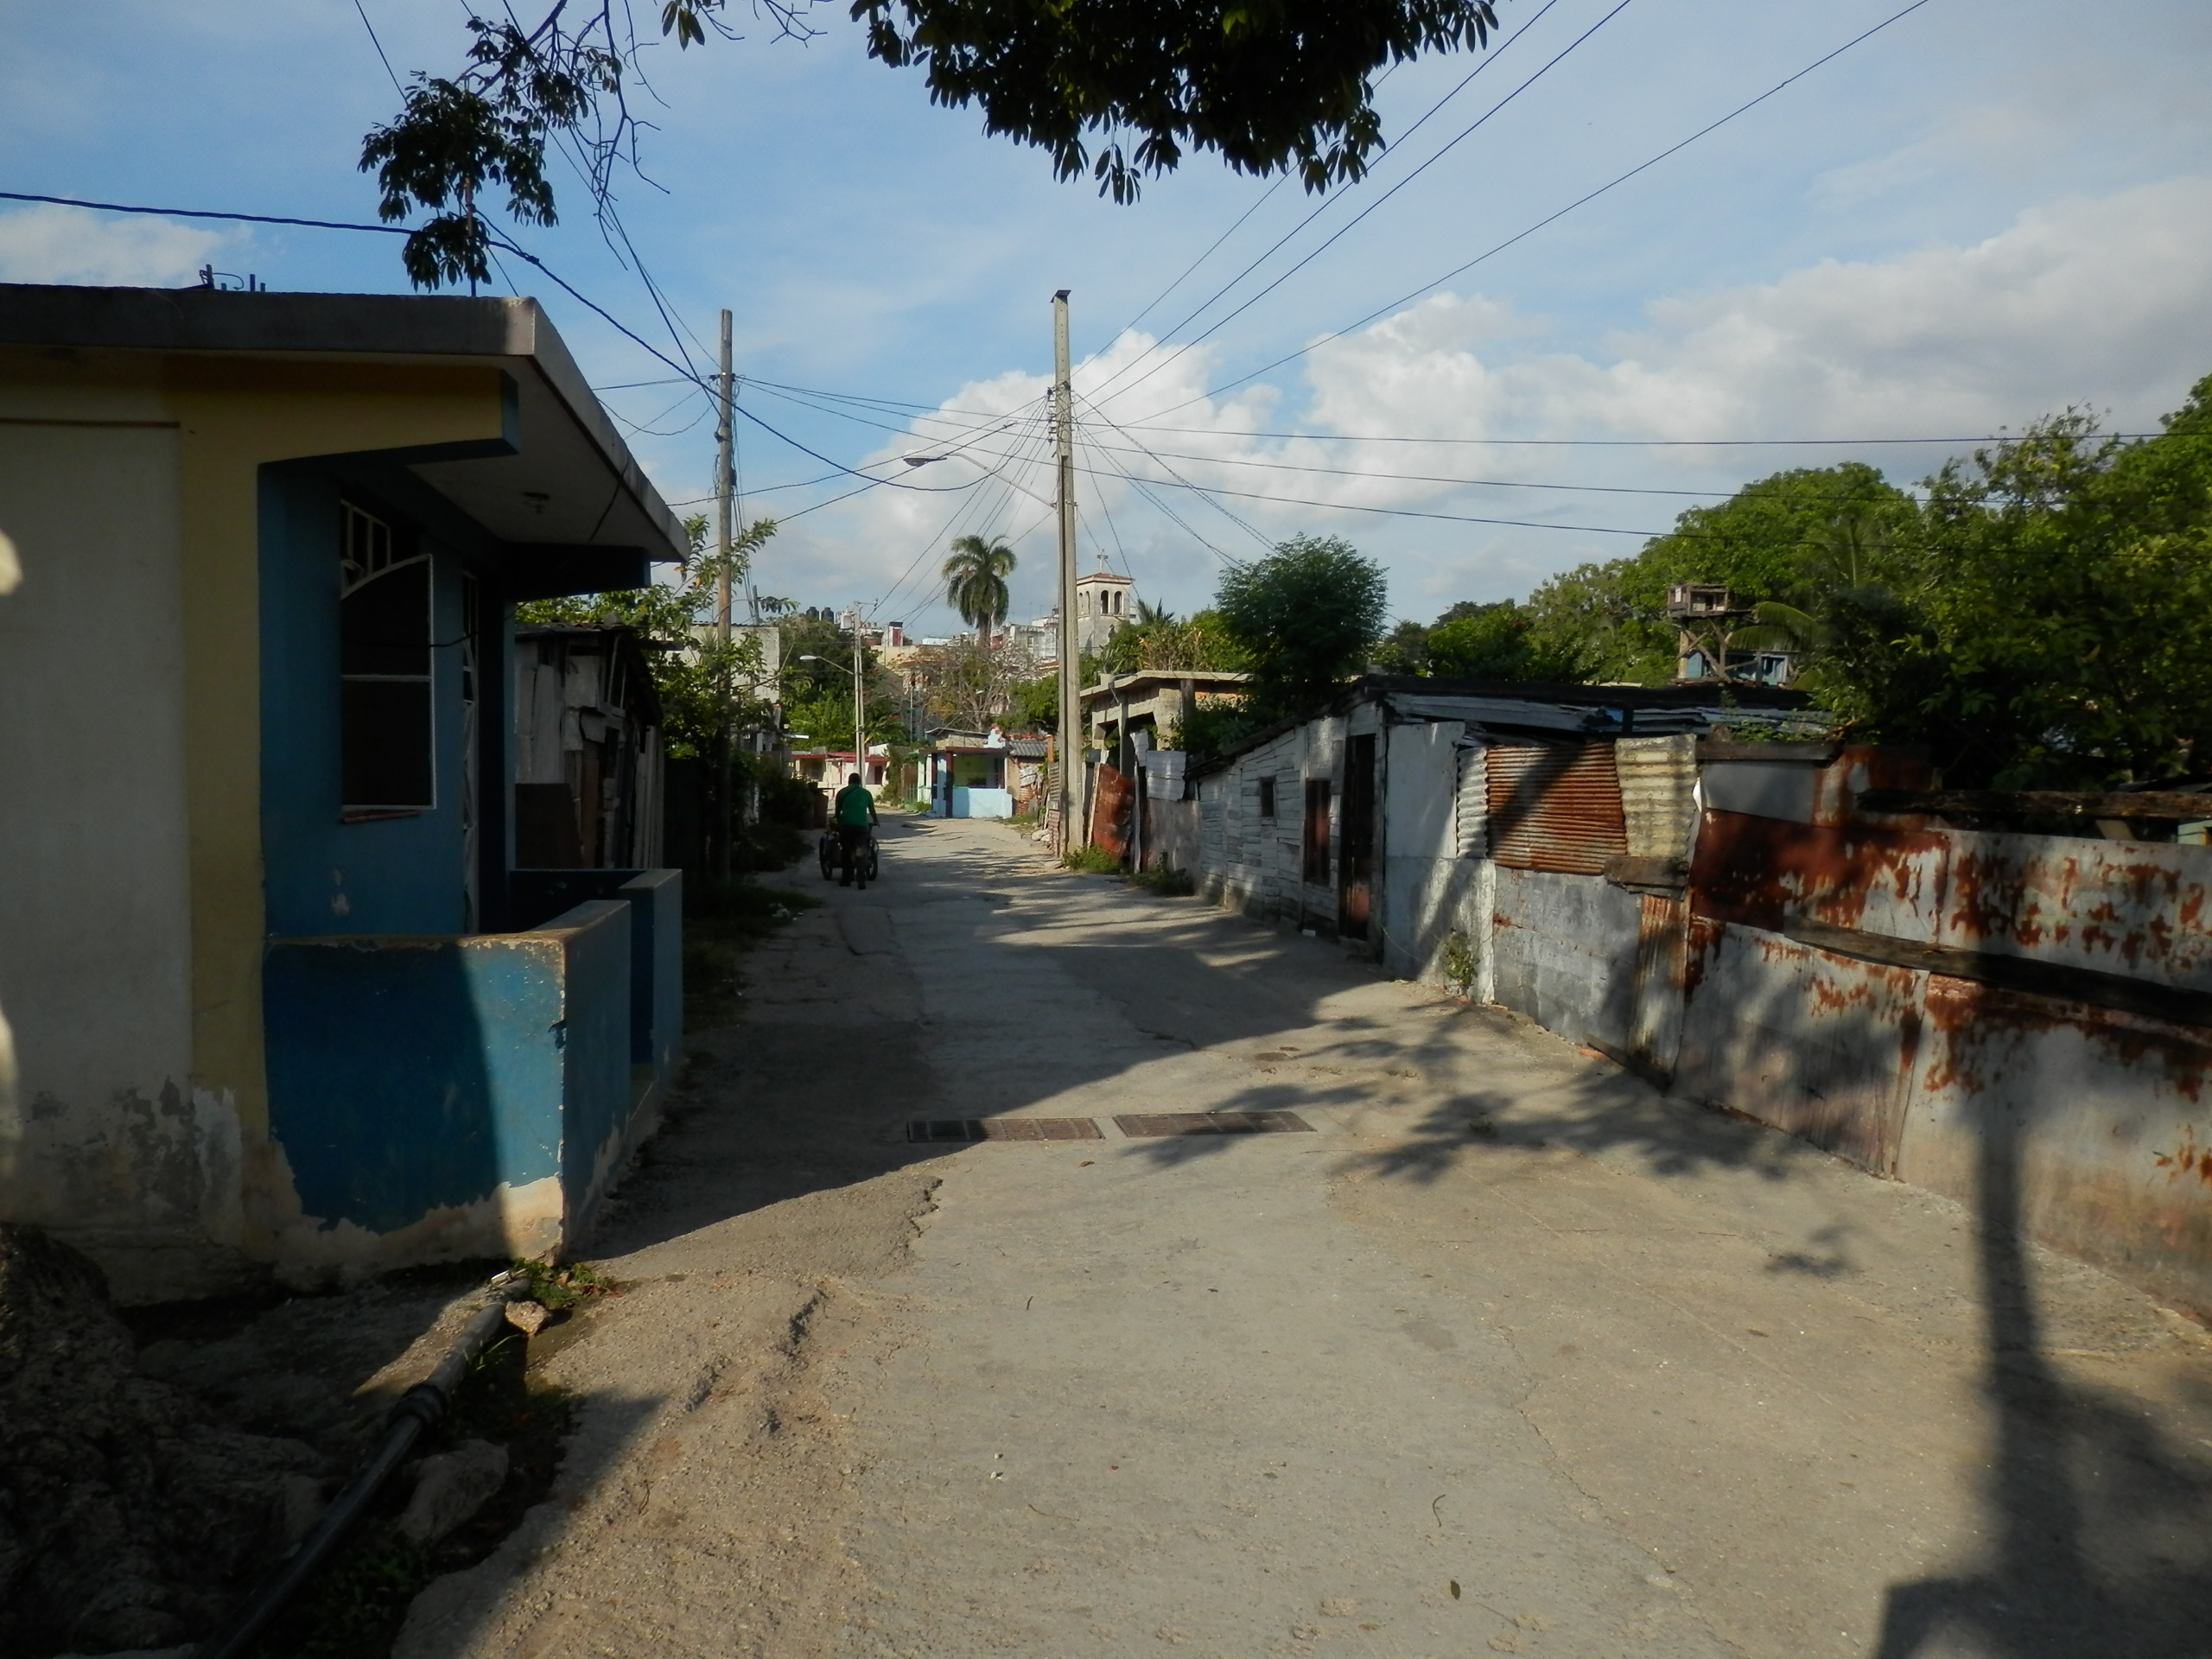
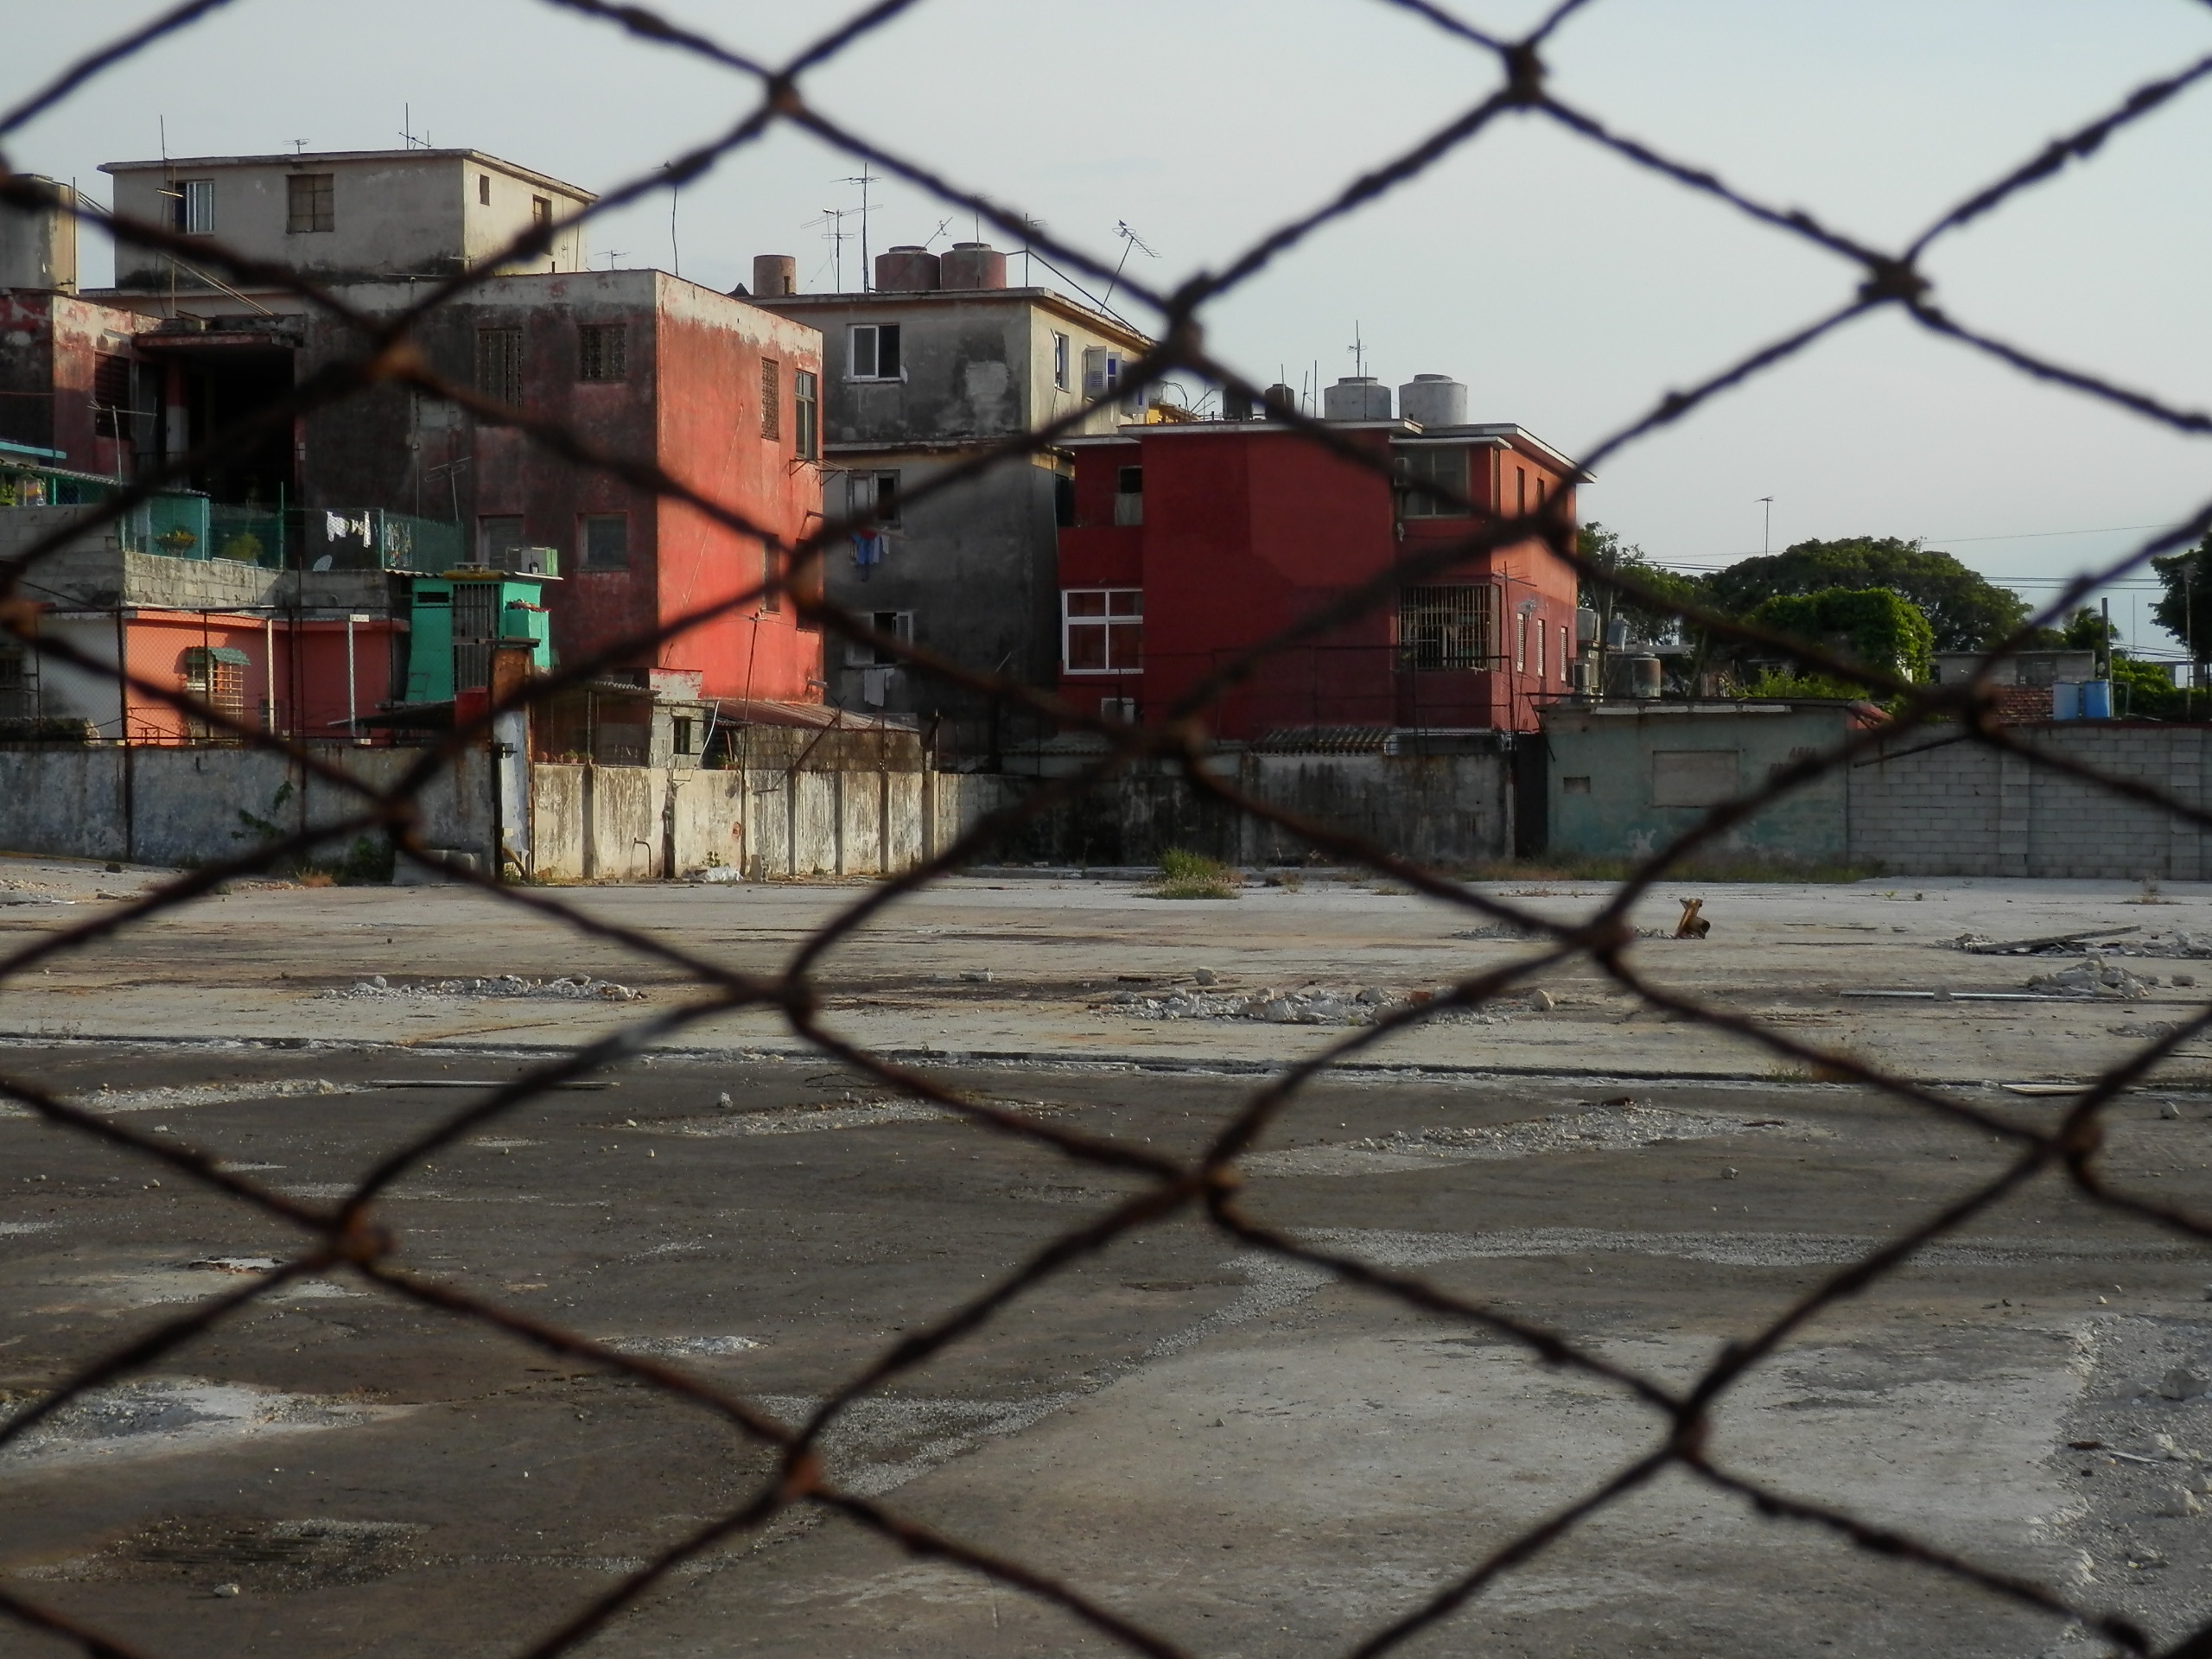
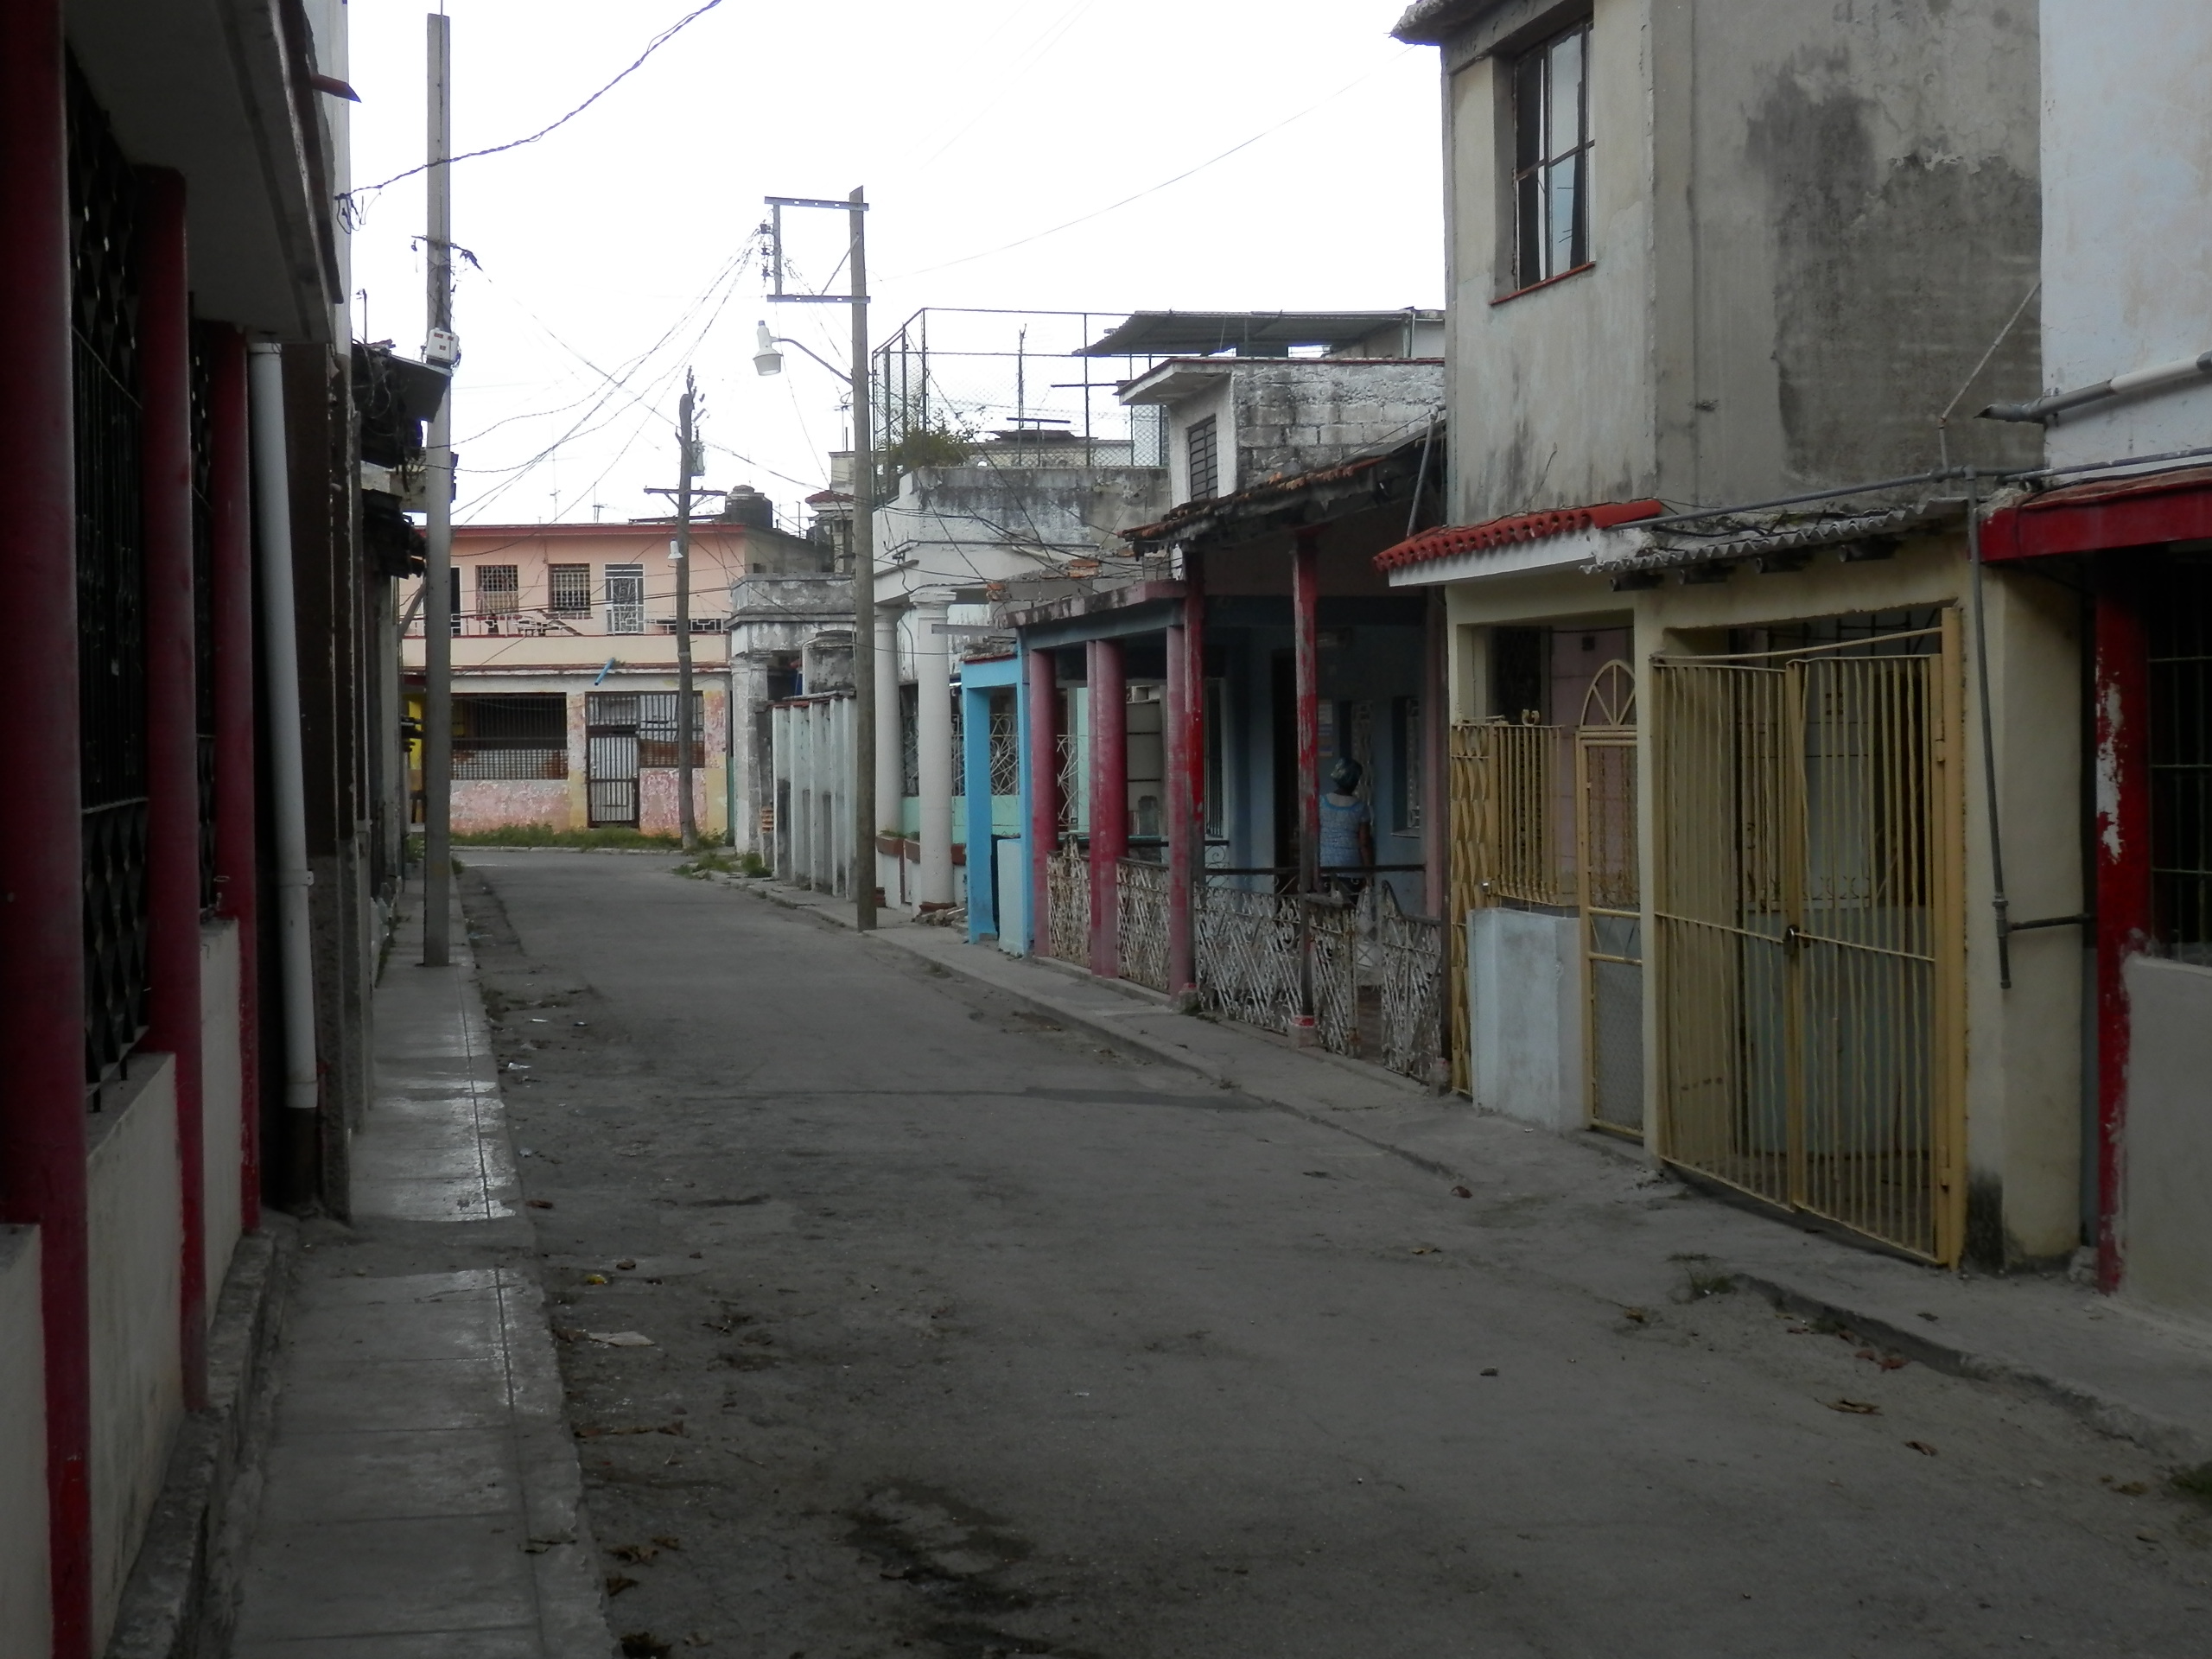
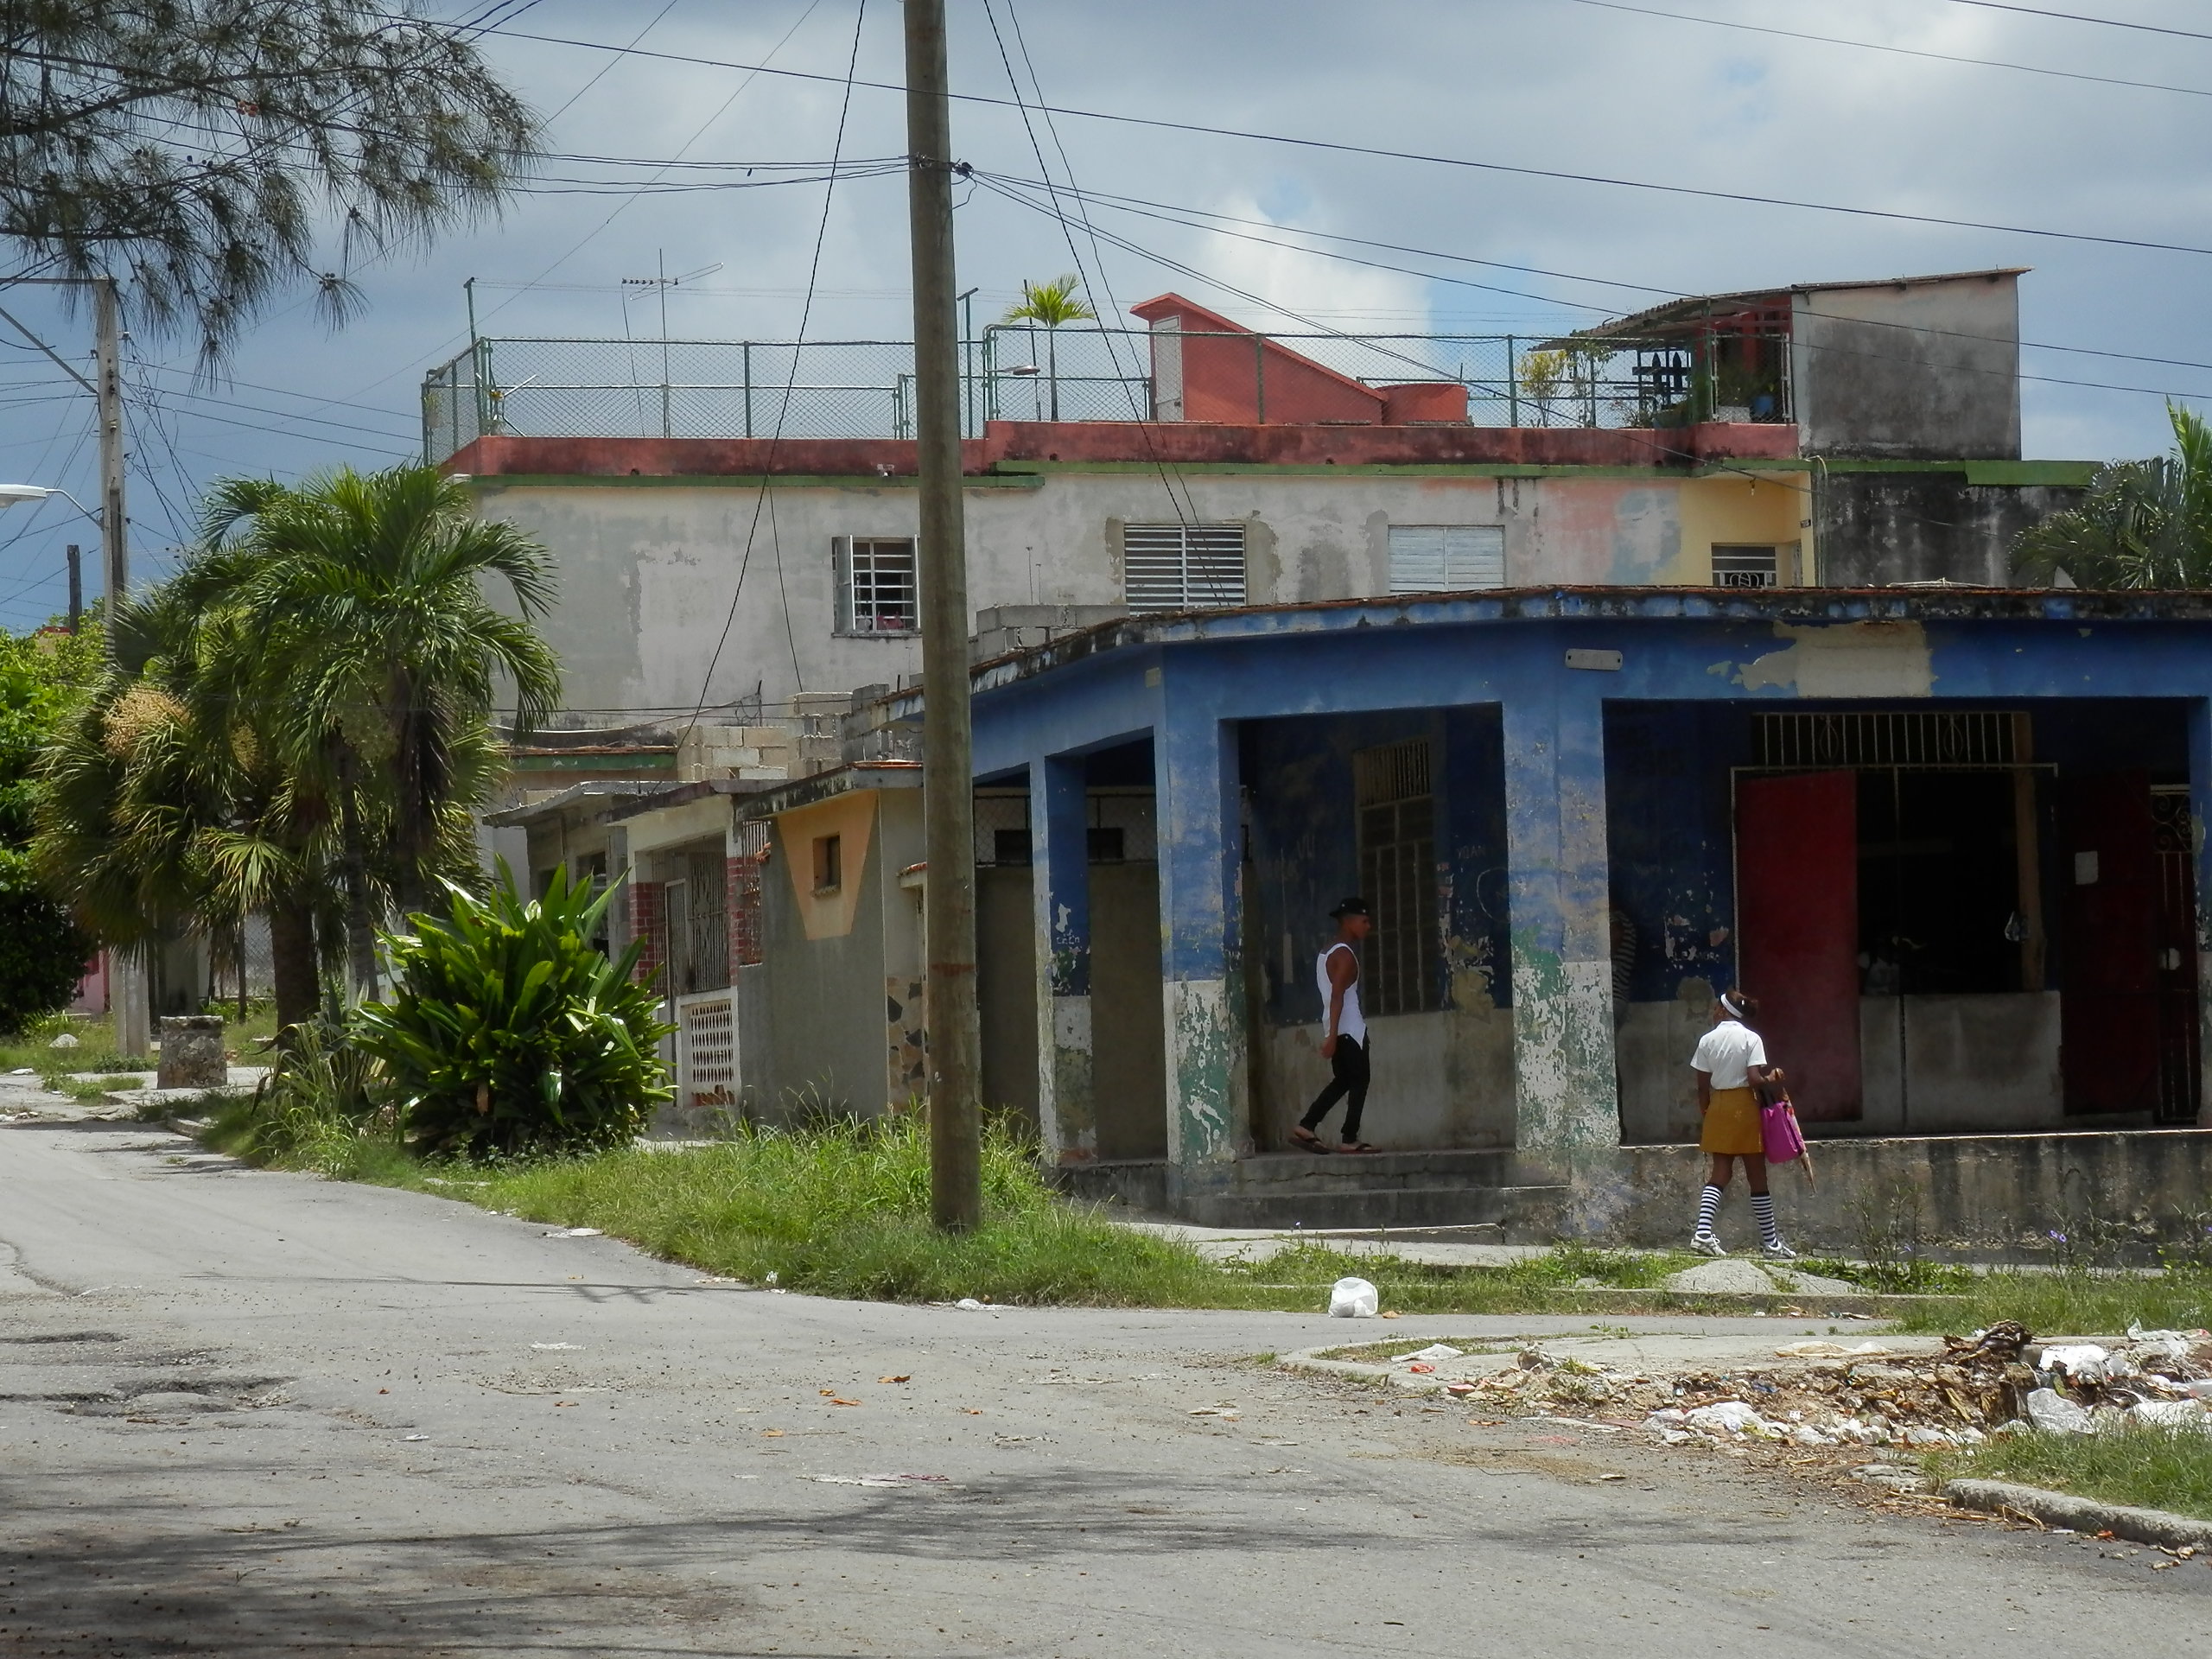
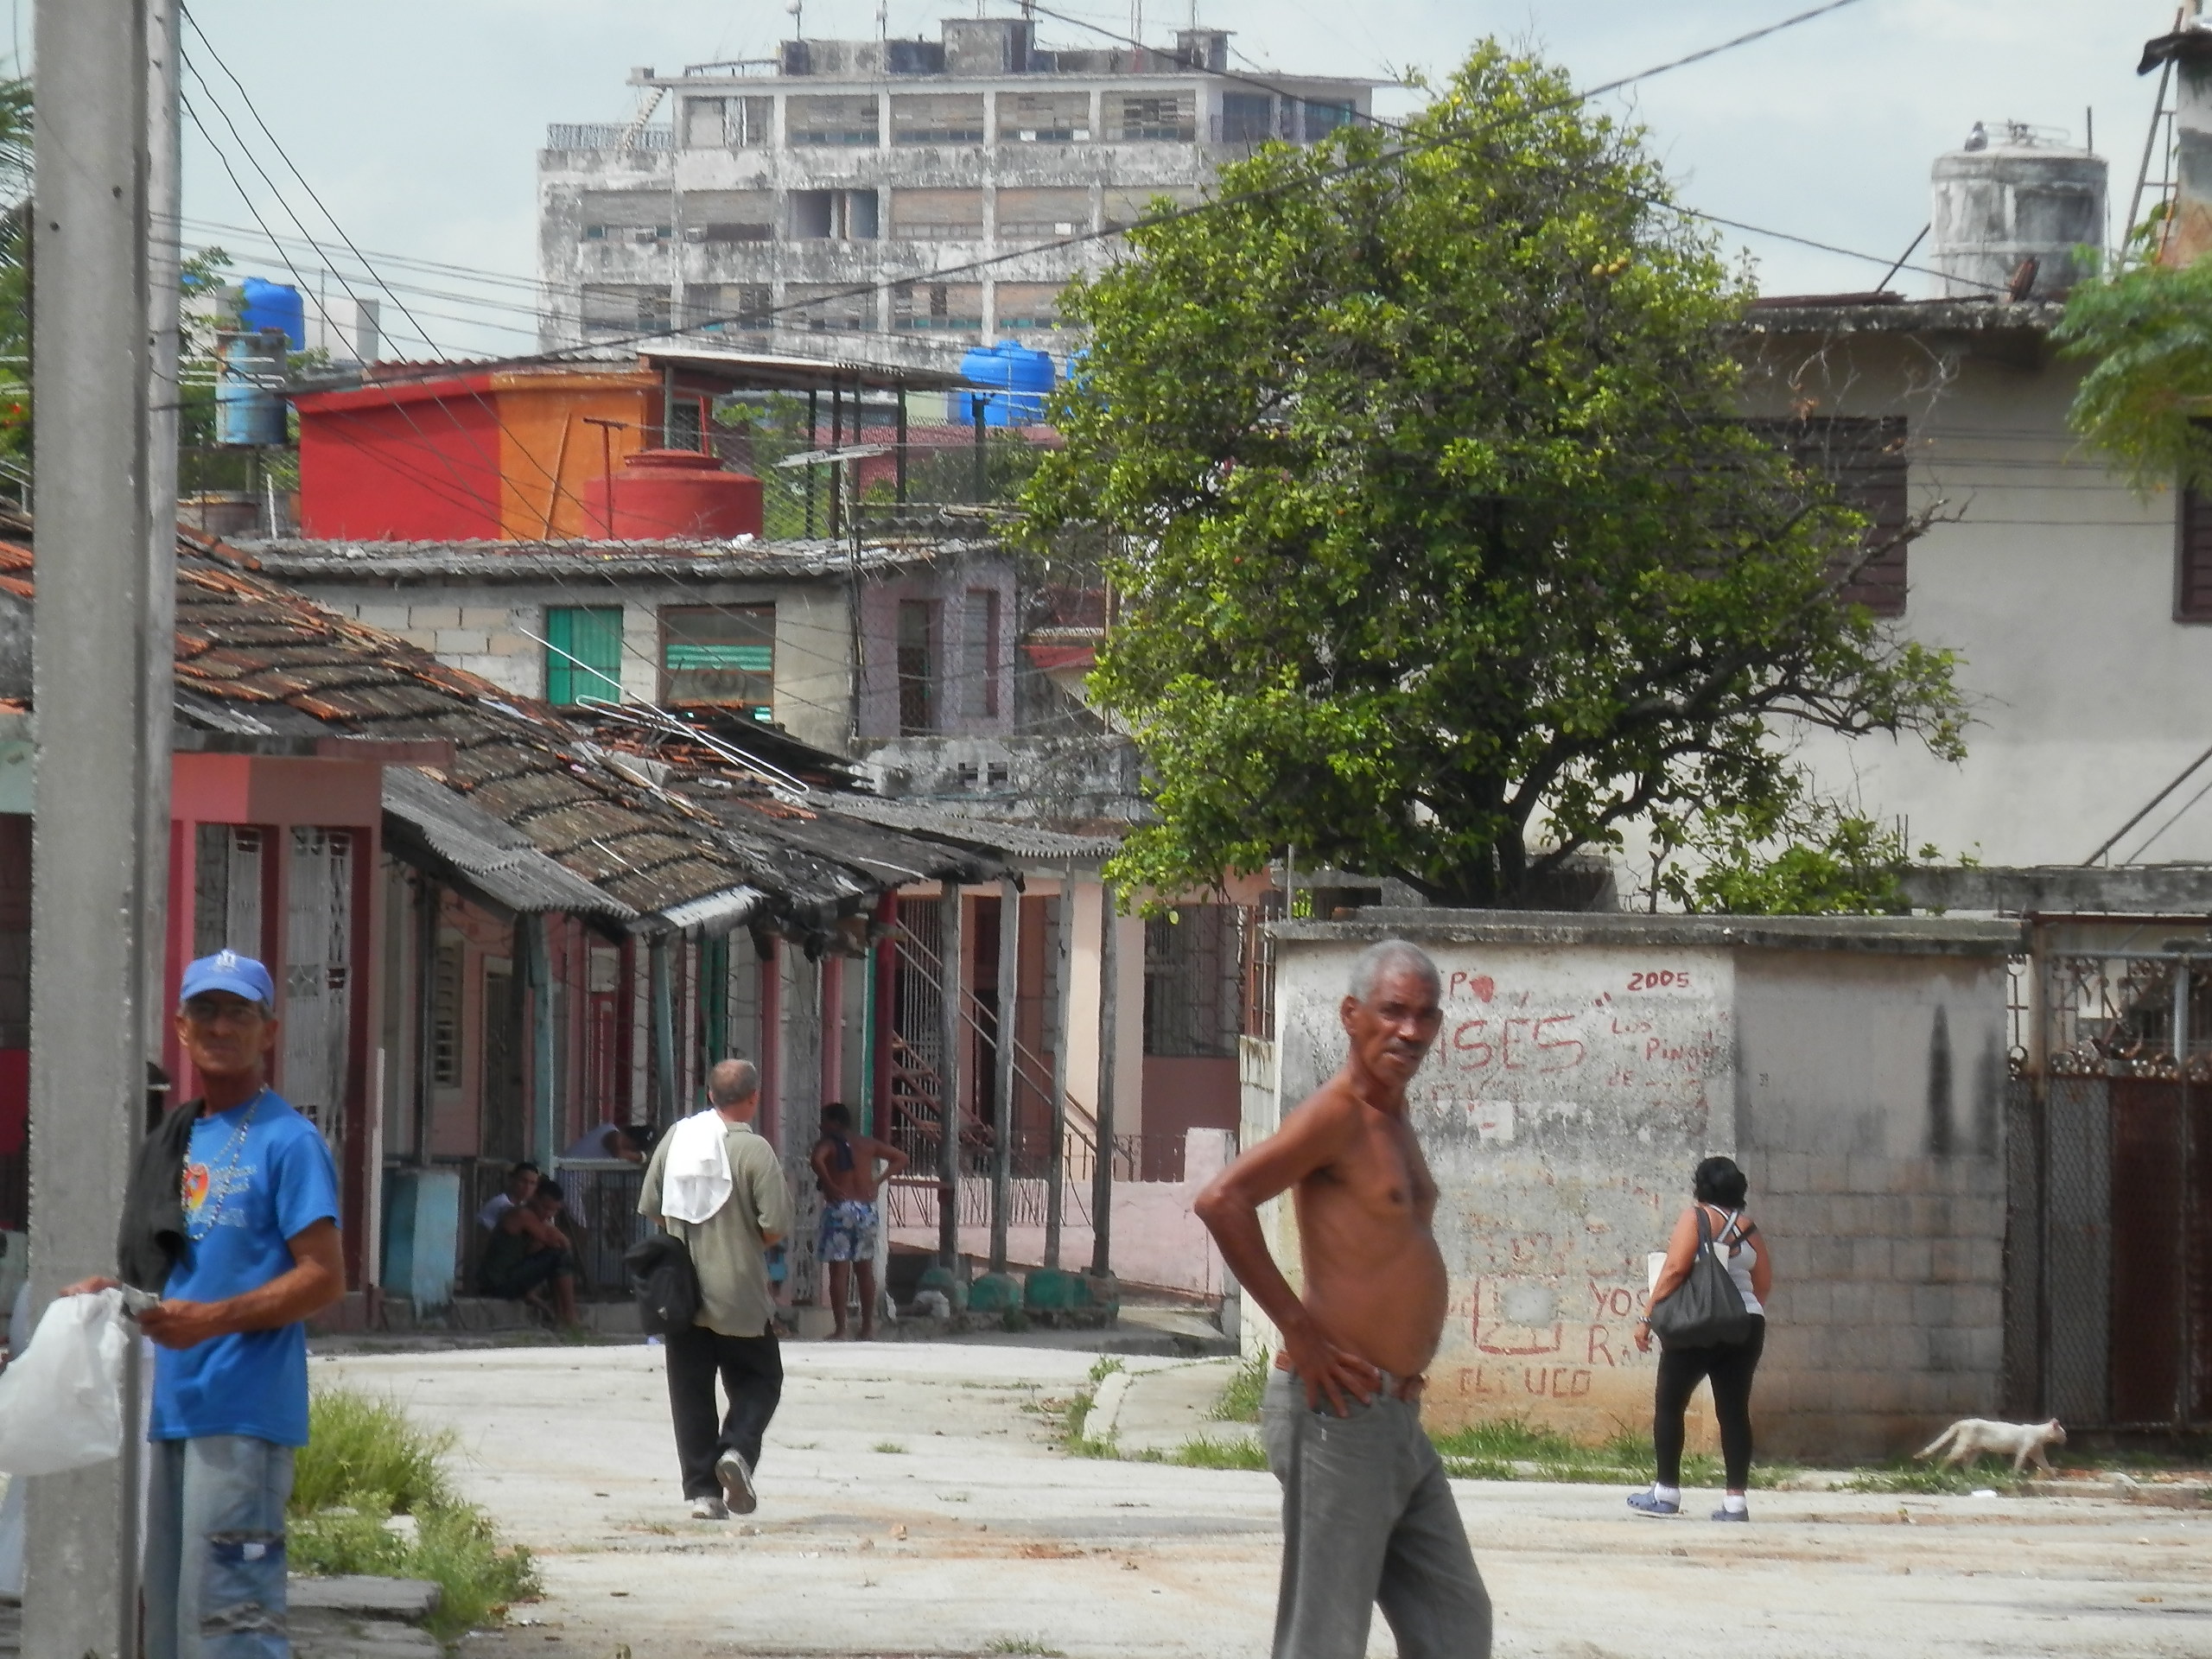
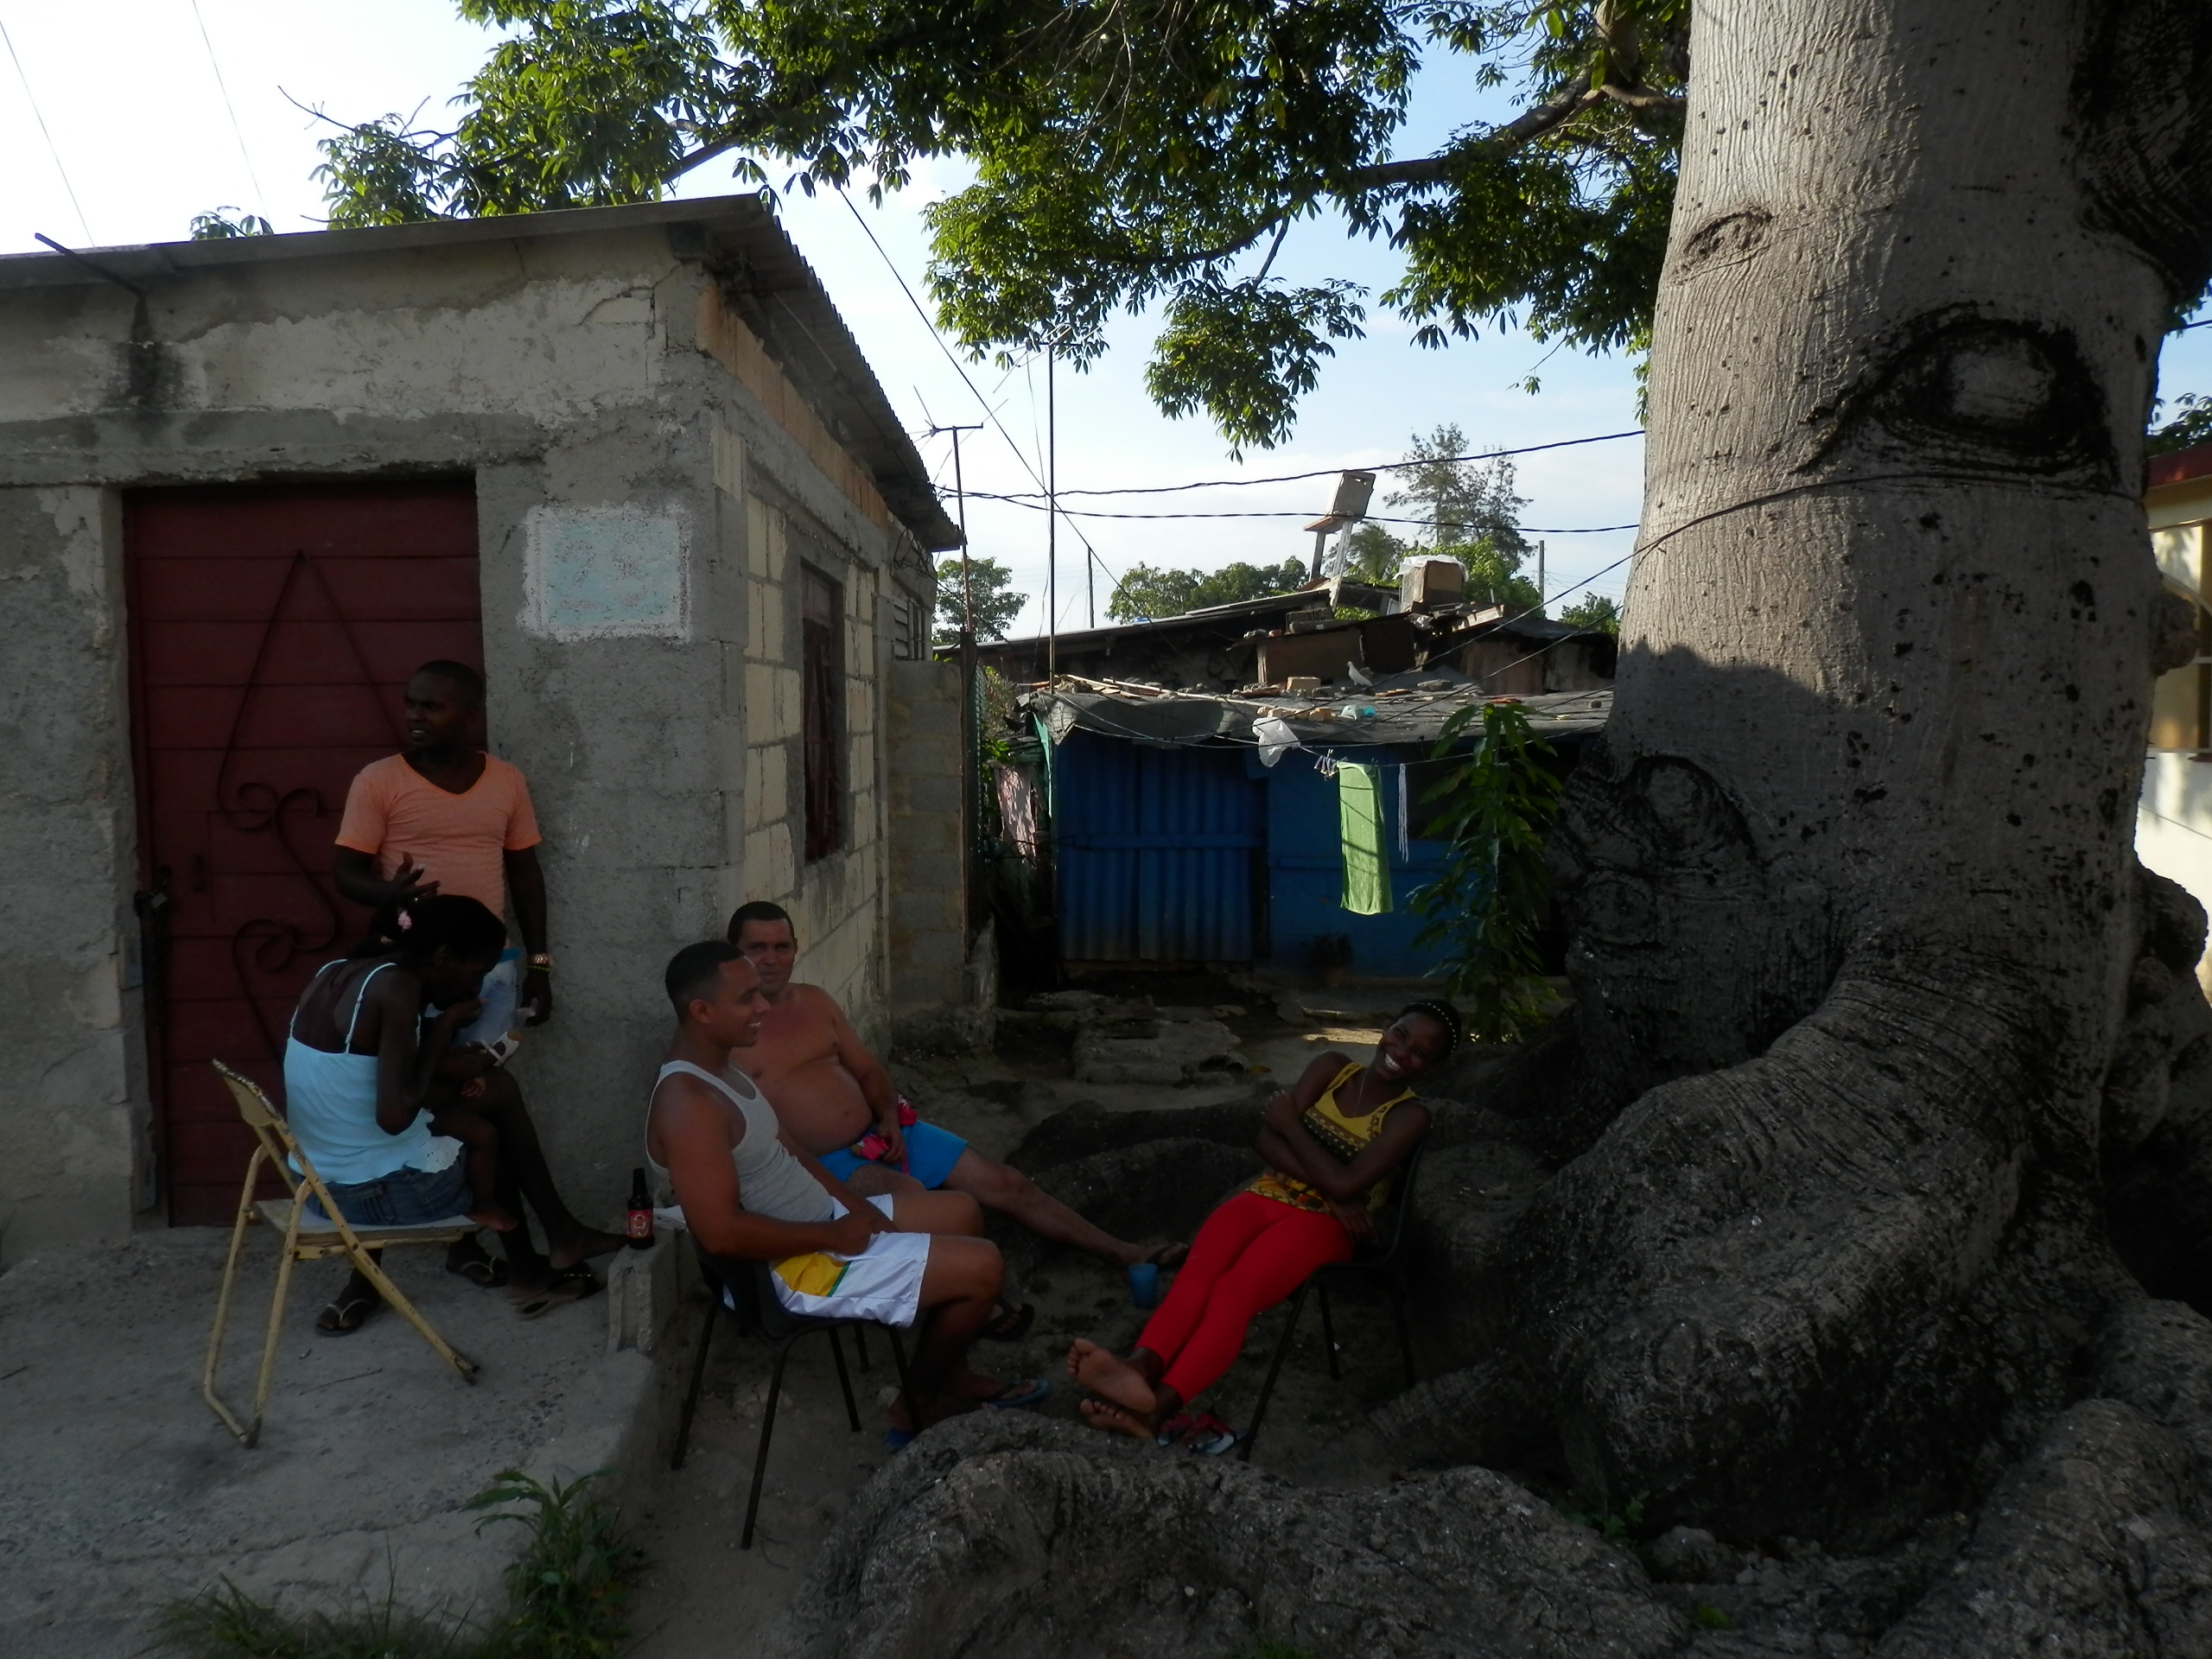
And this is for Havana’s nice parts. Once I began biking out of the central neighborhoods and into the slums, I found that symbols of past wealth disappeared altogether, and were replaced with what in the U.S. would be considered shacks. These structures were usually patched up with knotted wood, metal scraps, and thatching. One gentlemen who lived in the poor neighborhood of Cerro, and who I spoke with at length, described his area as akin to a Brazilian favela—which I found believable. The two pictures I took below were from his front porch, and mirrored the aesthetic of such areas.
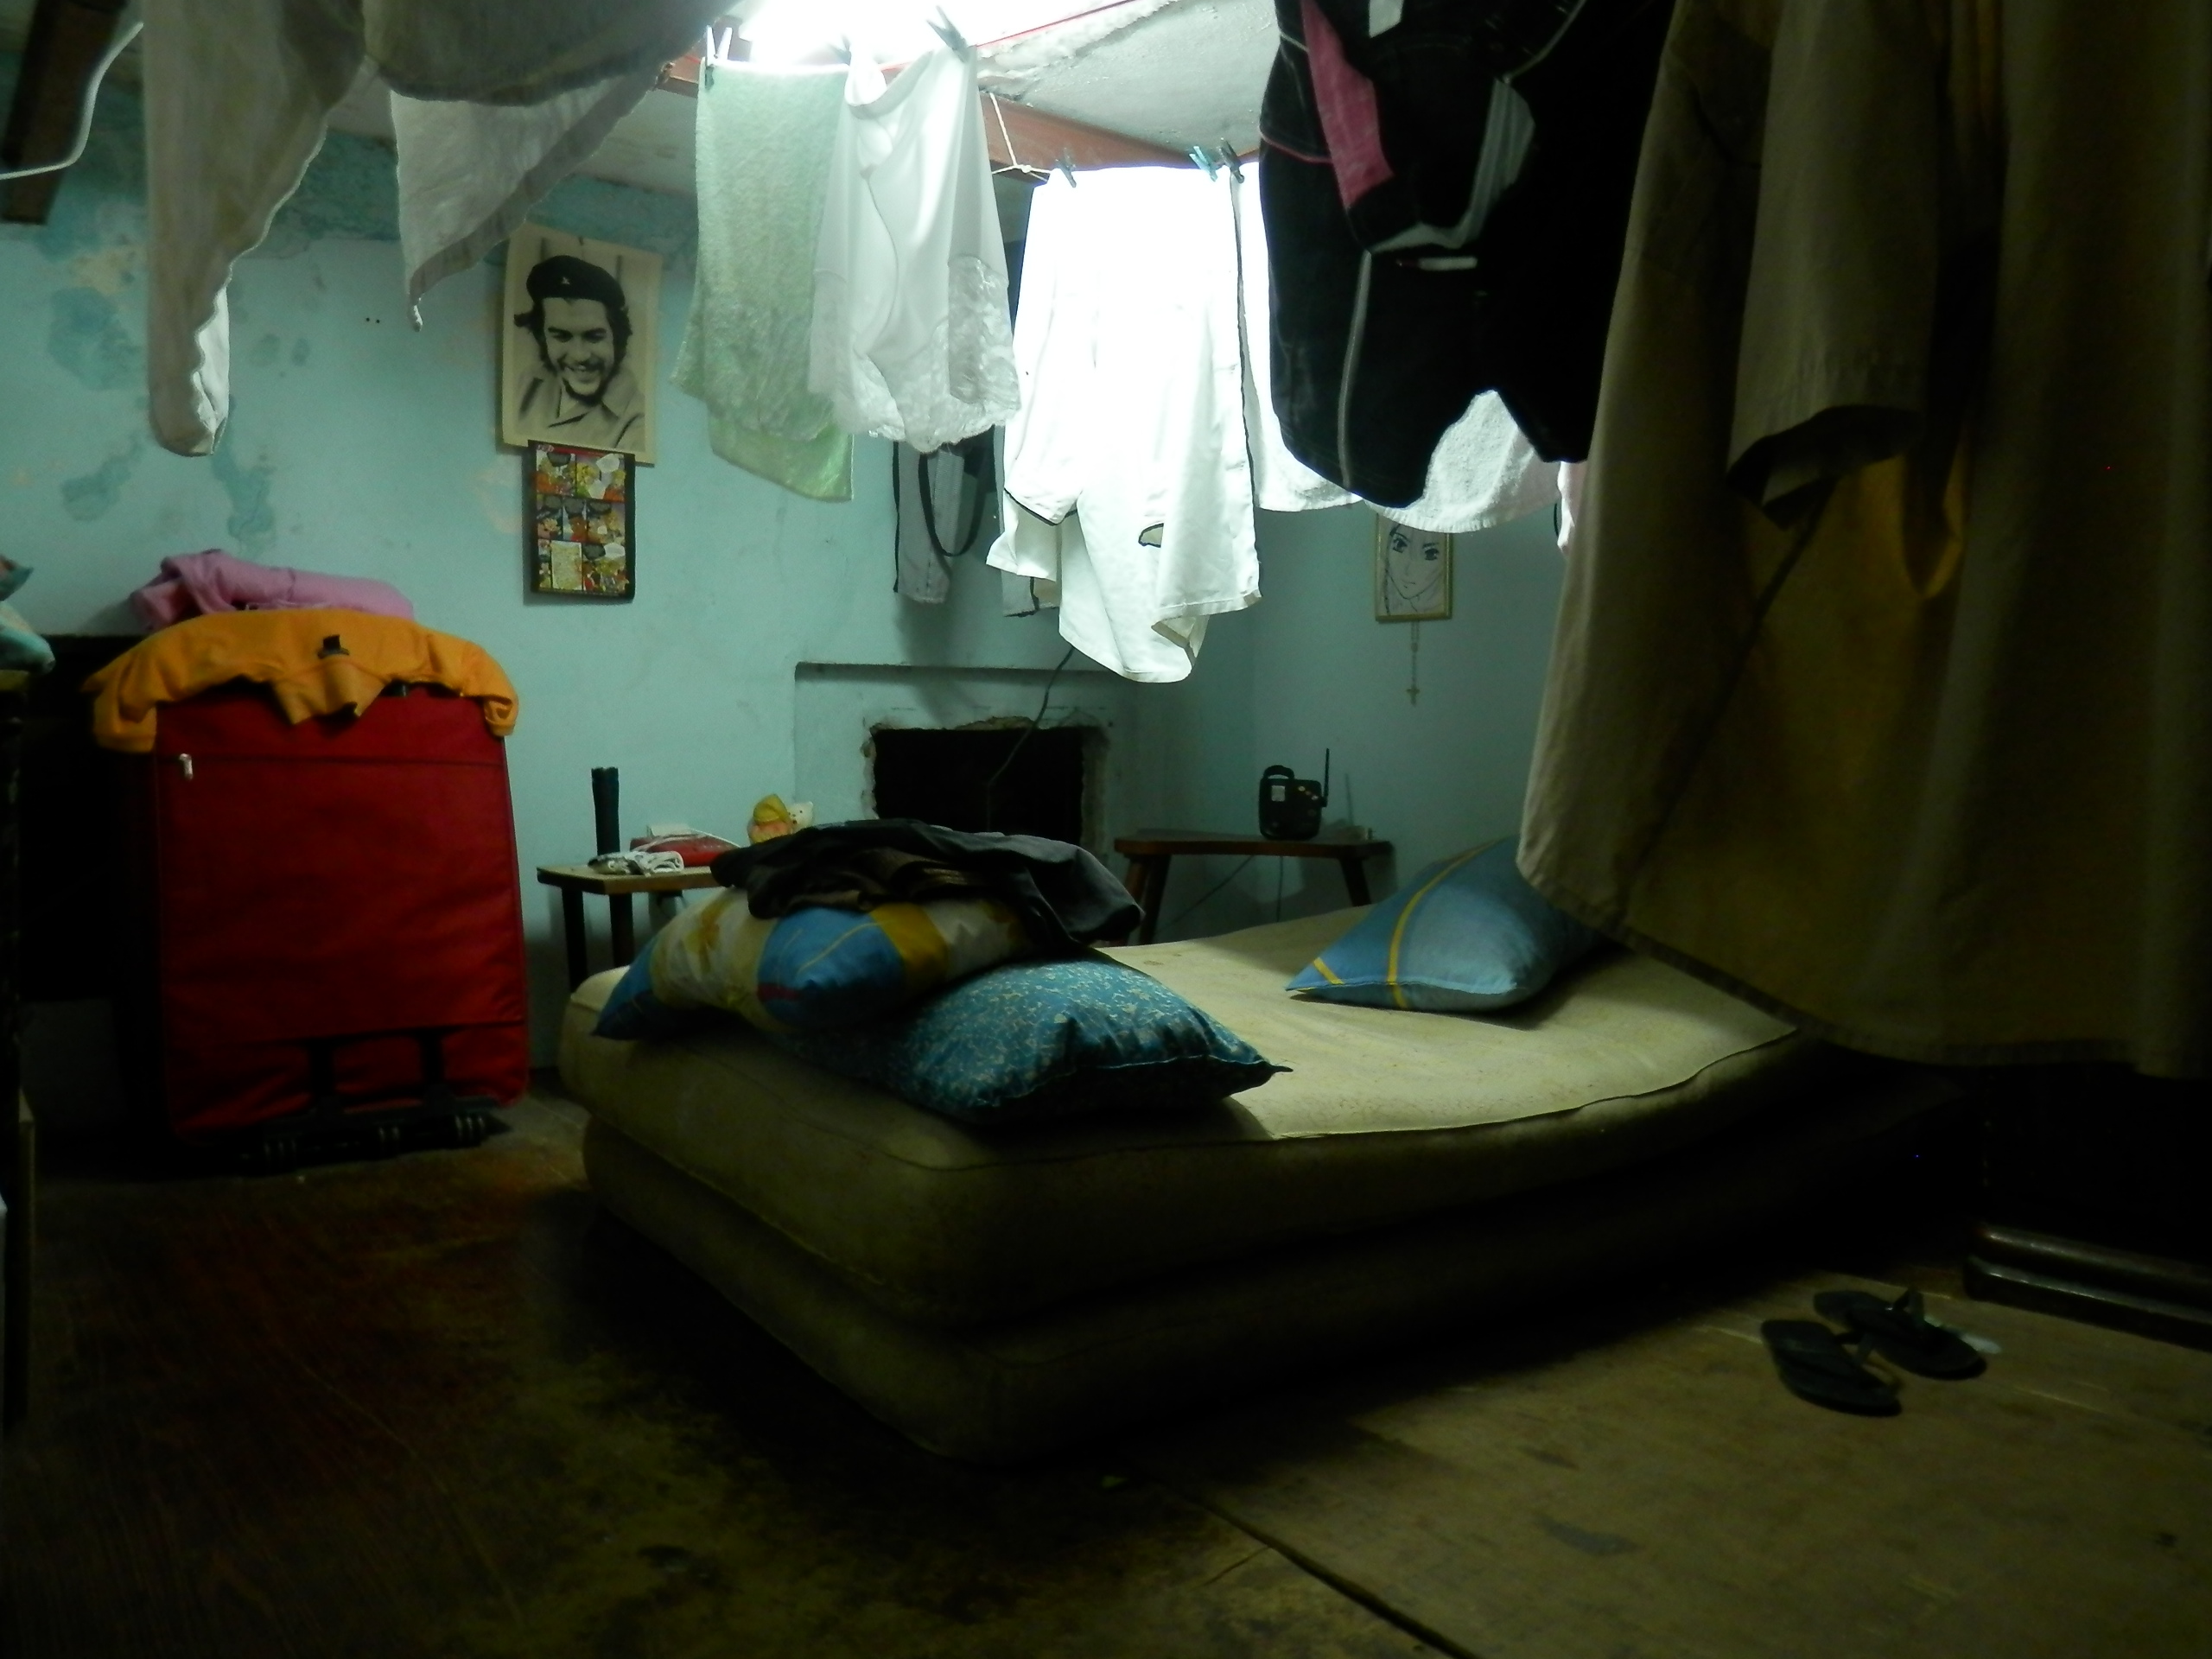
So what is it like to live and work in these buildings? As one might expect, the outside decay permeates to the inside. The best access I got was through a 24-year-old working-class woman named Indira. I met Indira on my first night in Havana when stopping to ask directions, and after noticing that she spoke good English, took her to dinner. We became friends, and she invited me into her downtown apartment, where she lived with her mother and father-in-law. The apartment was roughly 150 square feet—far smaller than a typical New York City micro-unit. Because it had a high ceiling, the family had built a horizontal wooden floorboard halfway up the wall that served as the second floor, and built a makeshift staircase leading up. This upstairs “room” was for the mother and father-in-law, while Indira lived in the main room below, sleeping crammed against the kitchen.
Even in such a small space, there were numerous malfunctions. There was no hot water, either for cooking or showering. In fact, the shower did not even work, meaning that the family instead took scrub baths. Because the toilet didn’t flush, they had to pour water into it each time after use to accelerate the draining. The built-in wooden floorboard was clearly sagging under the weight of the upstairs furniture, raising concerns that it would one day collapse. As for the actual roof—it had been crumbling for years, and was fixed recently by a neighborhood handyman. To pay for the work, the family had to spend over a year saving up $150.
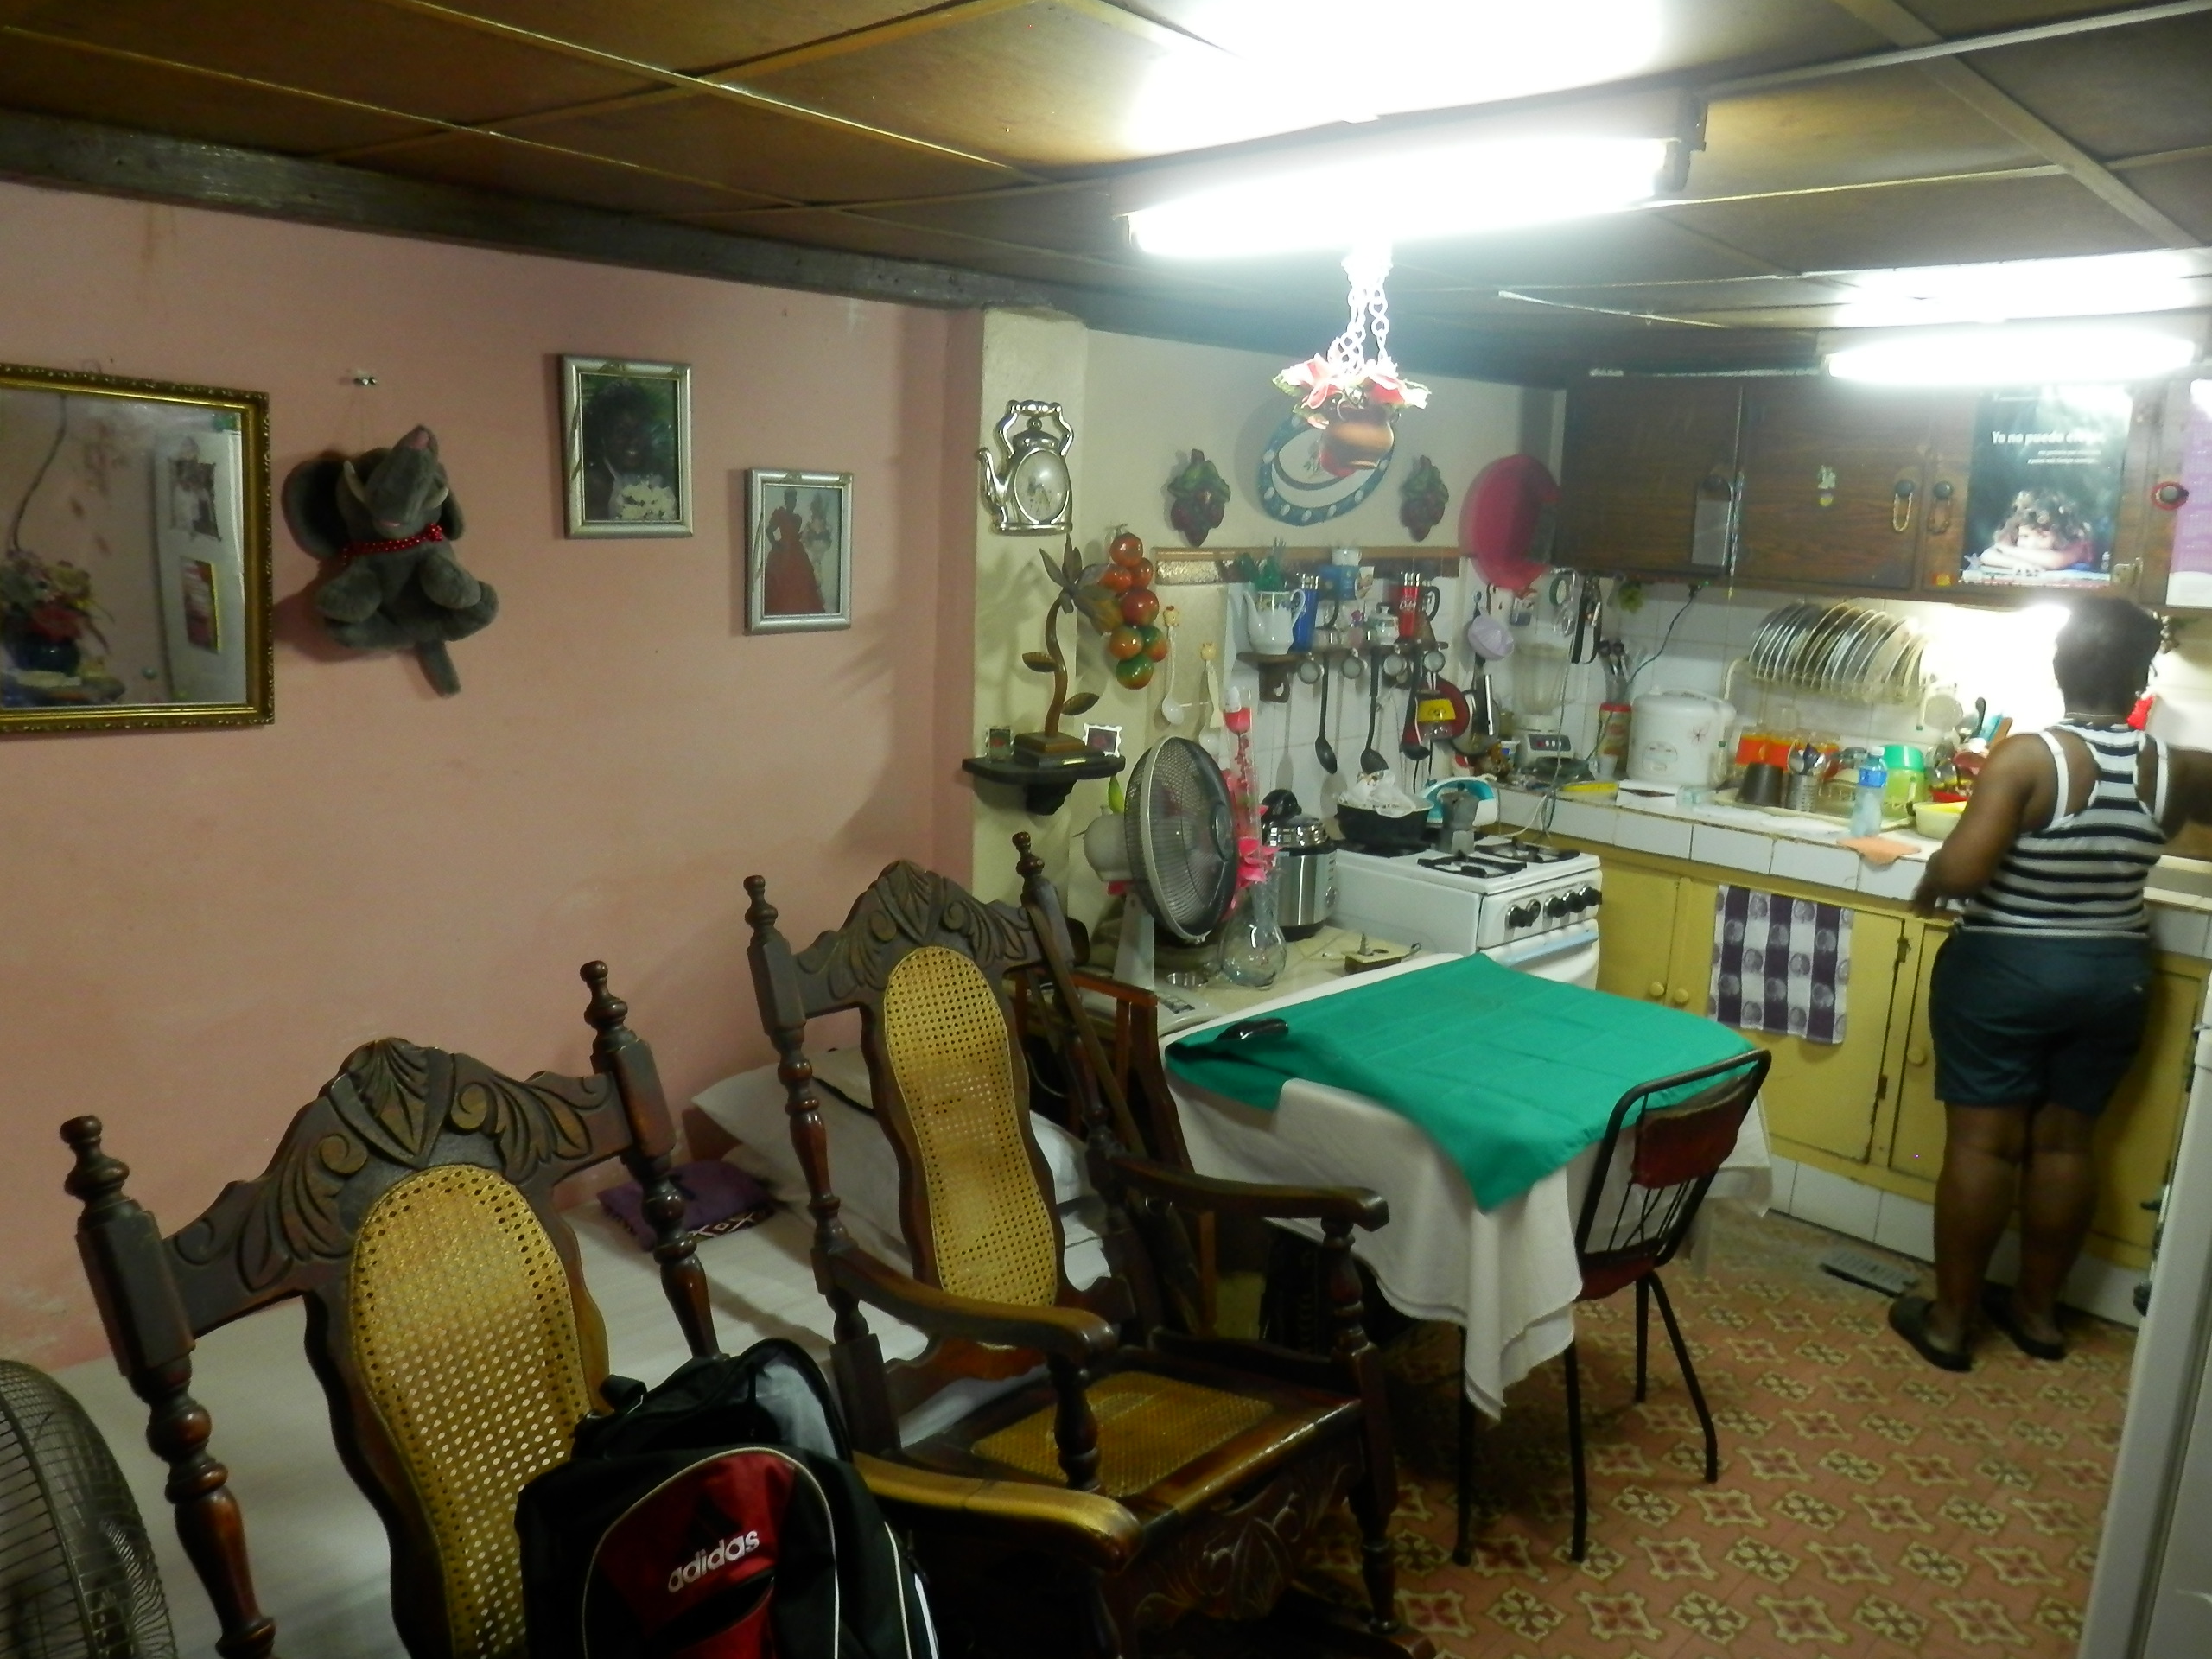
The main story of Indira’s apartment.
The second story, upheld by a wooden board
Public Infrastructure
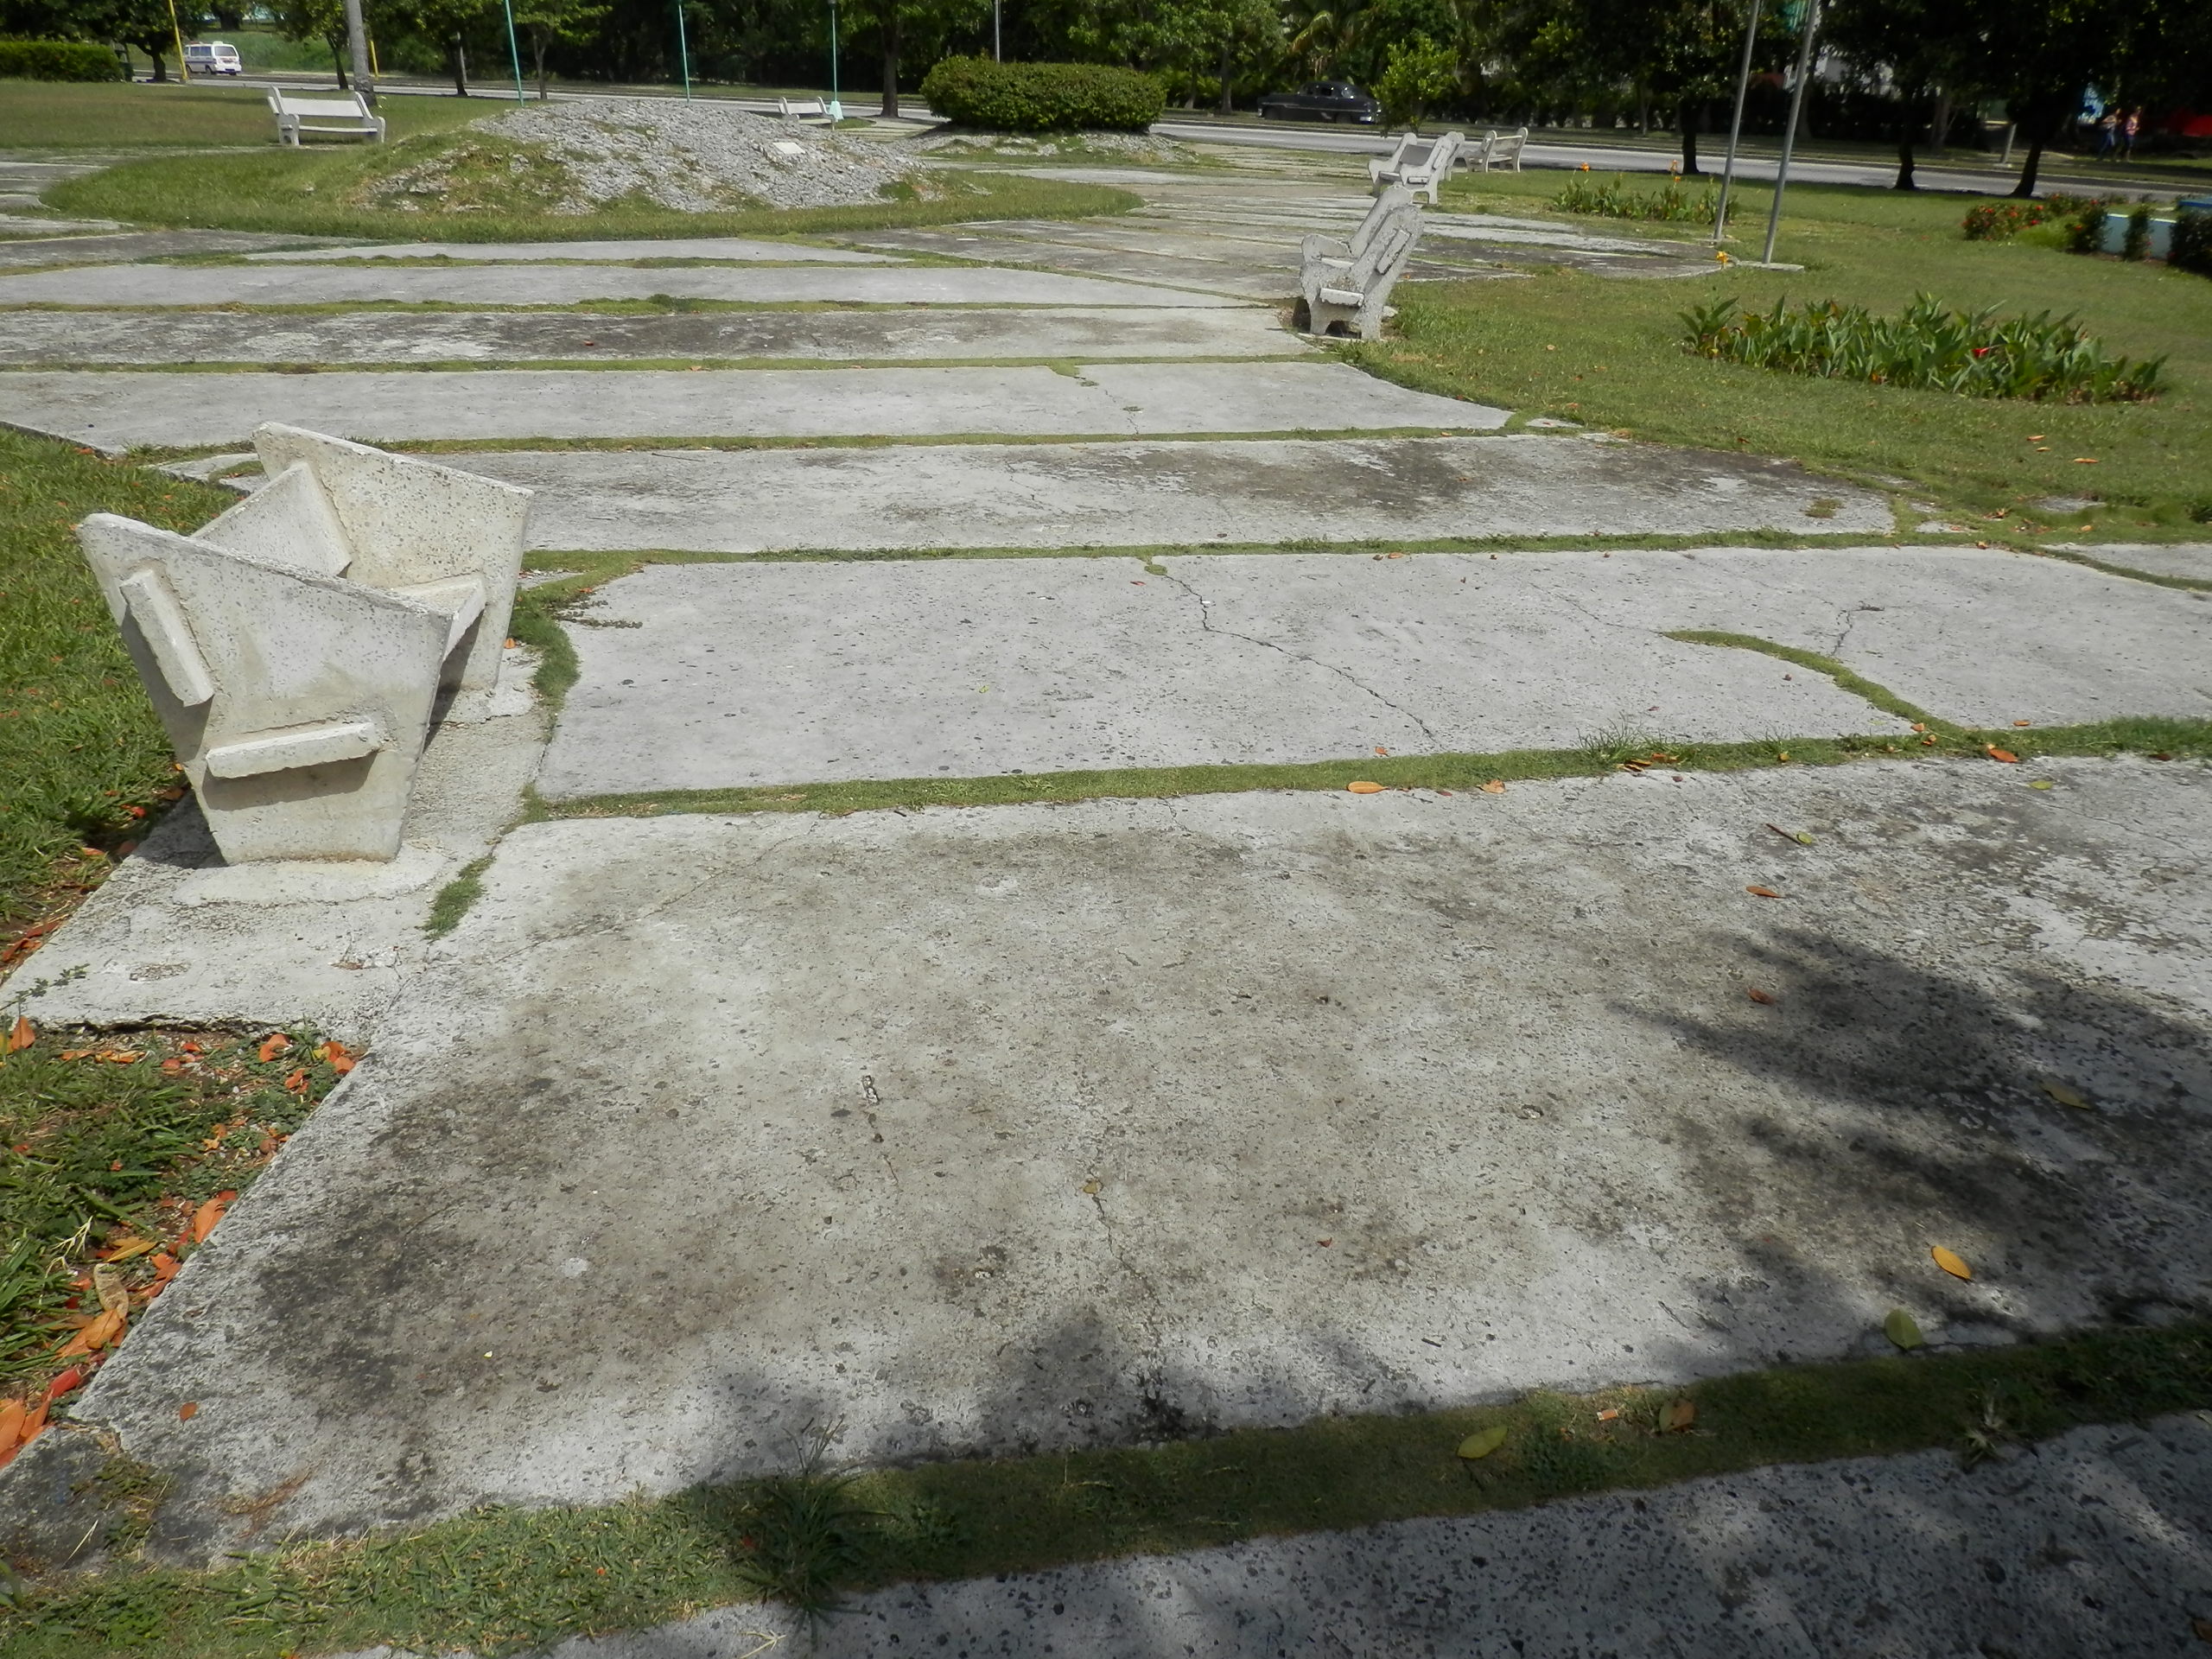
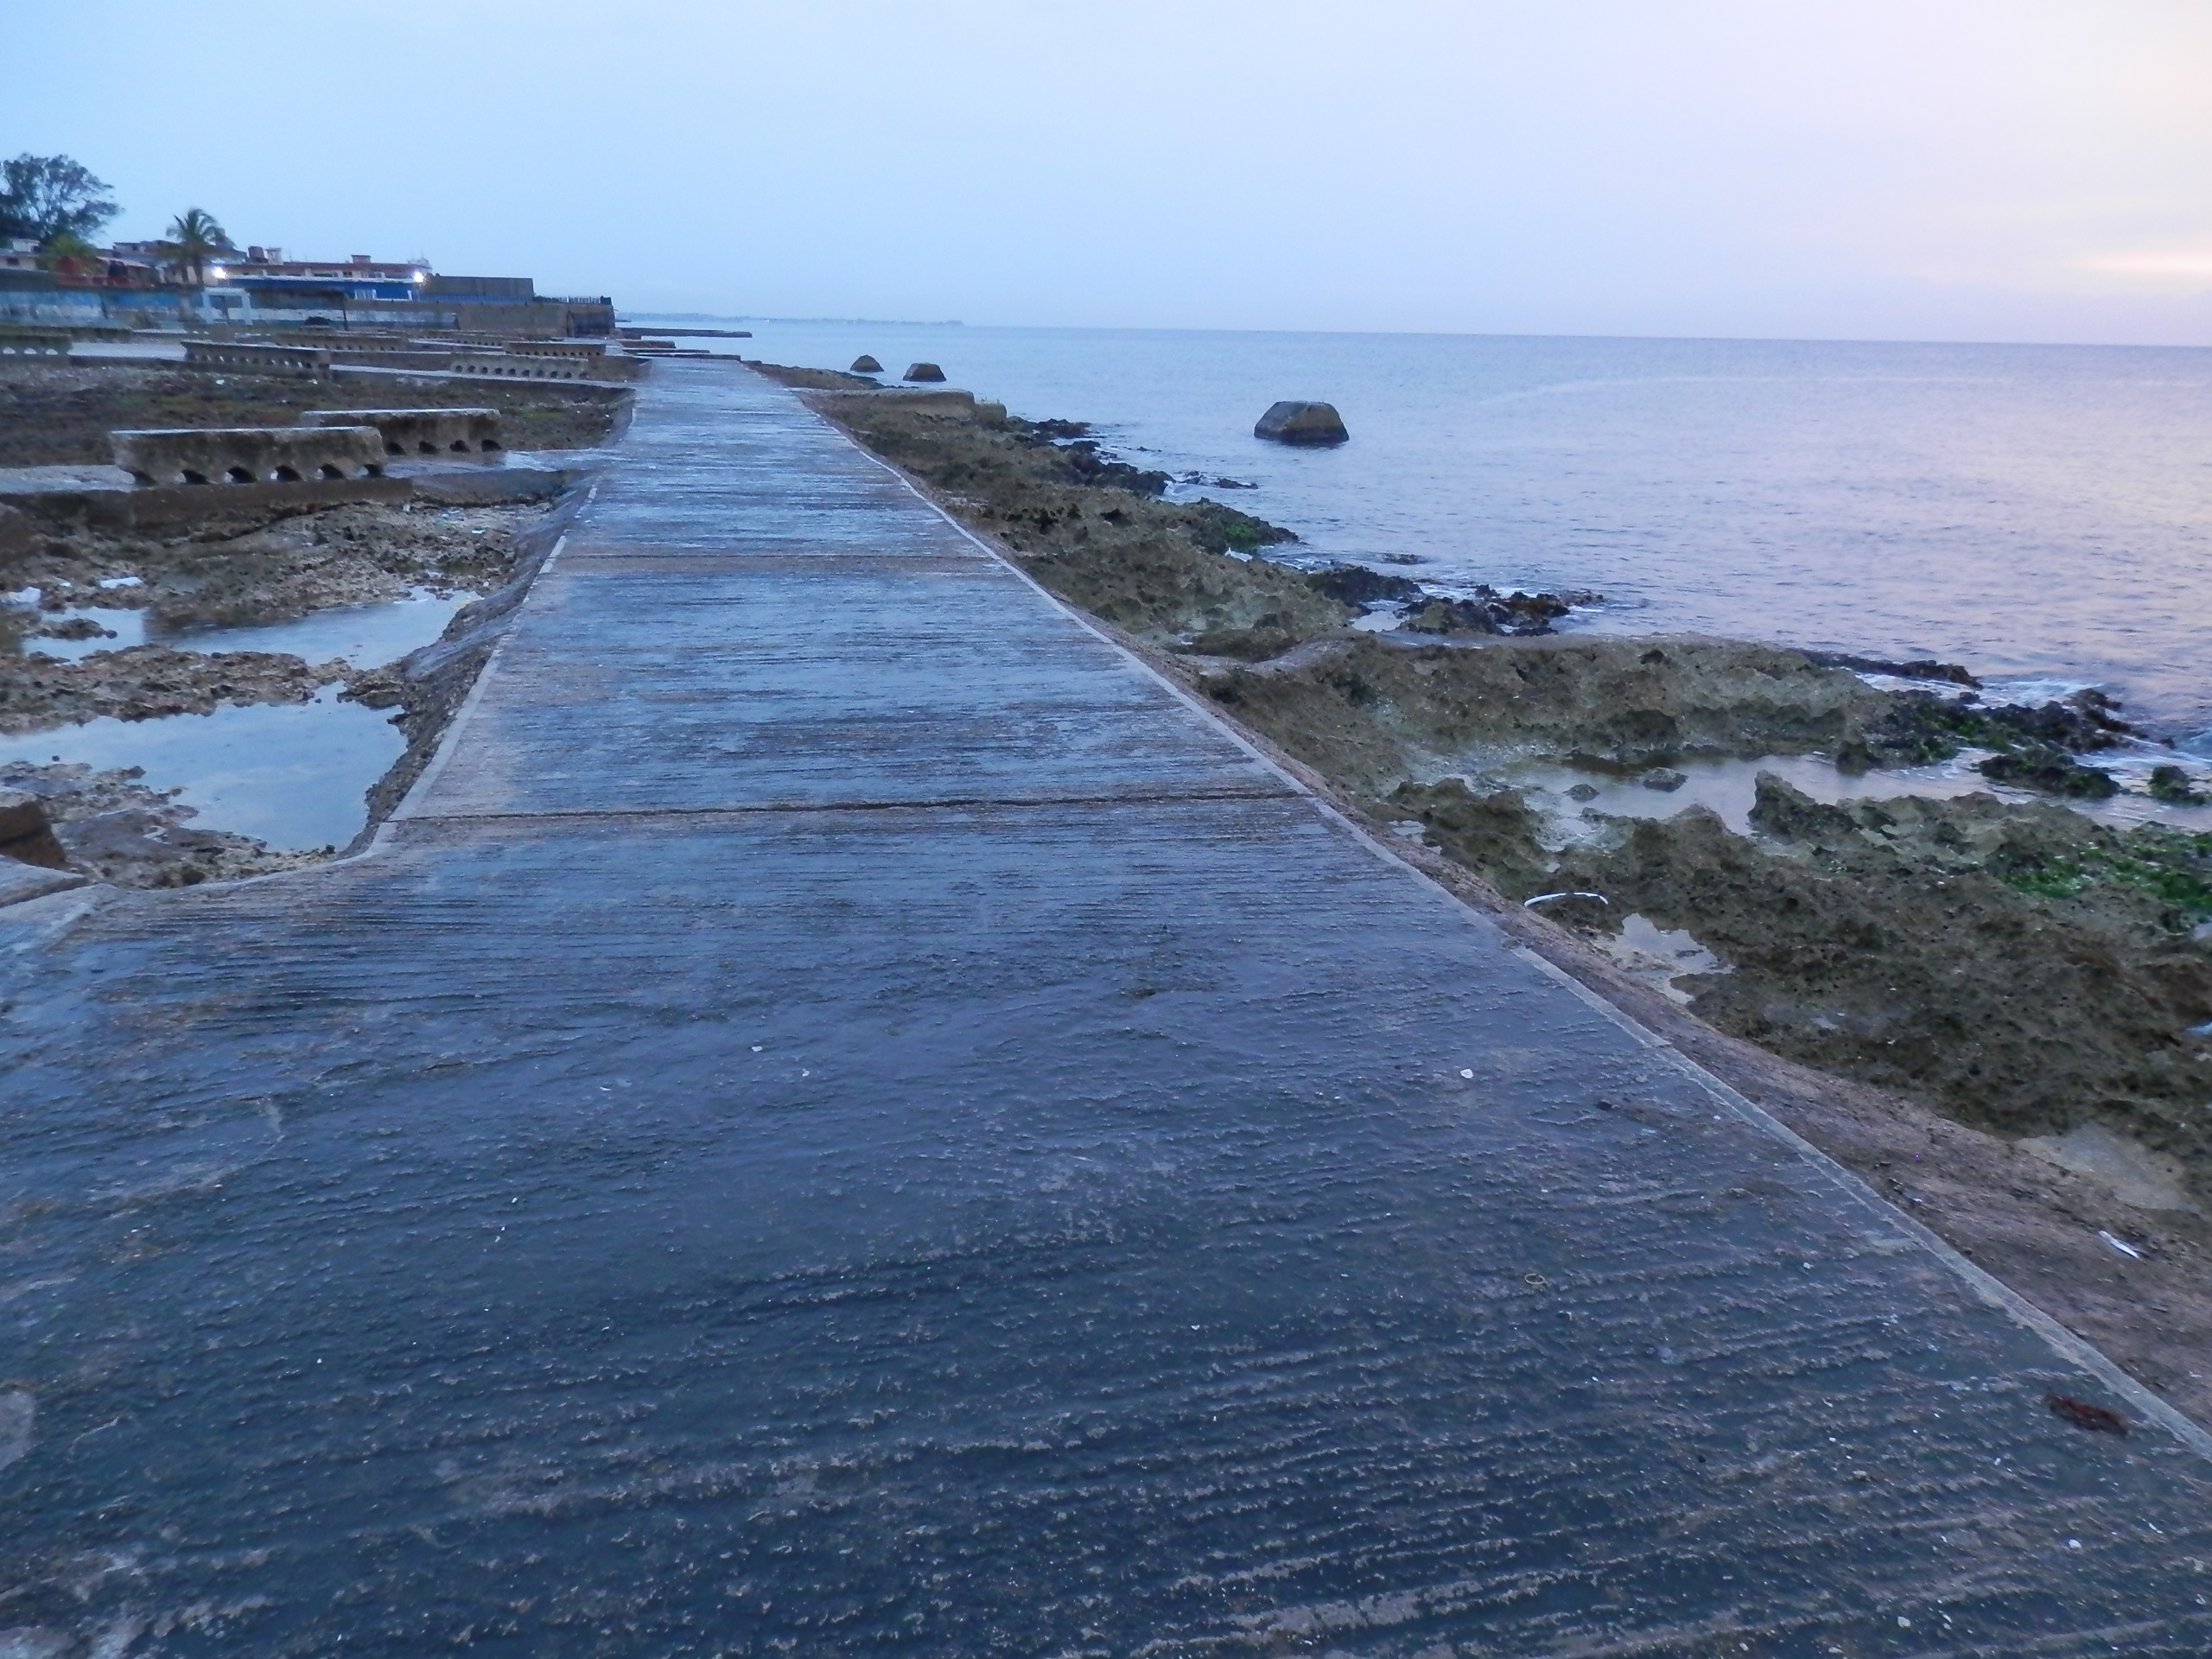
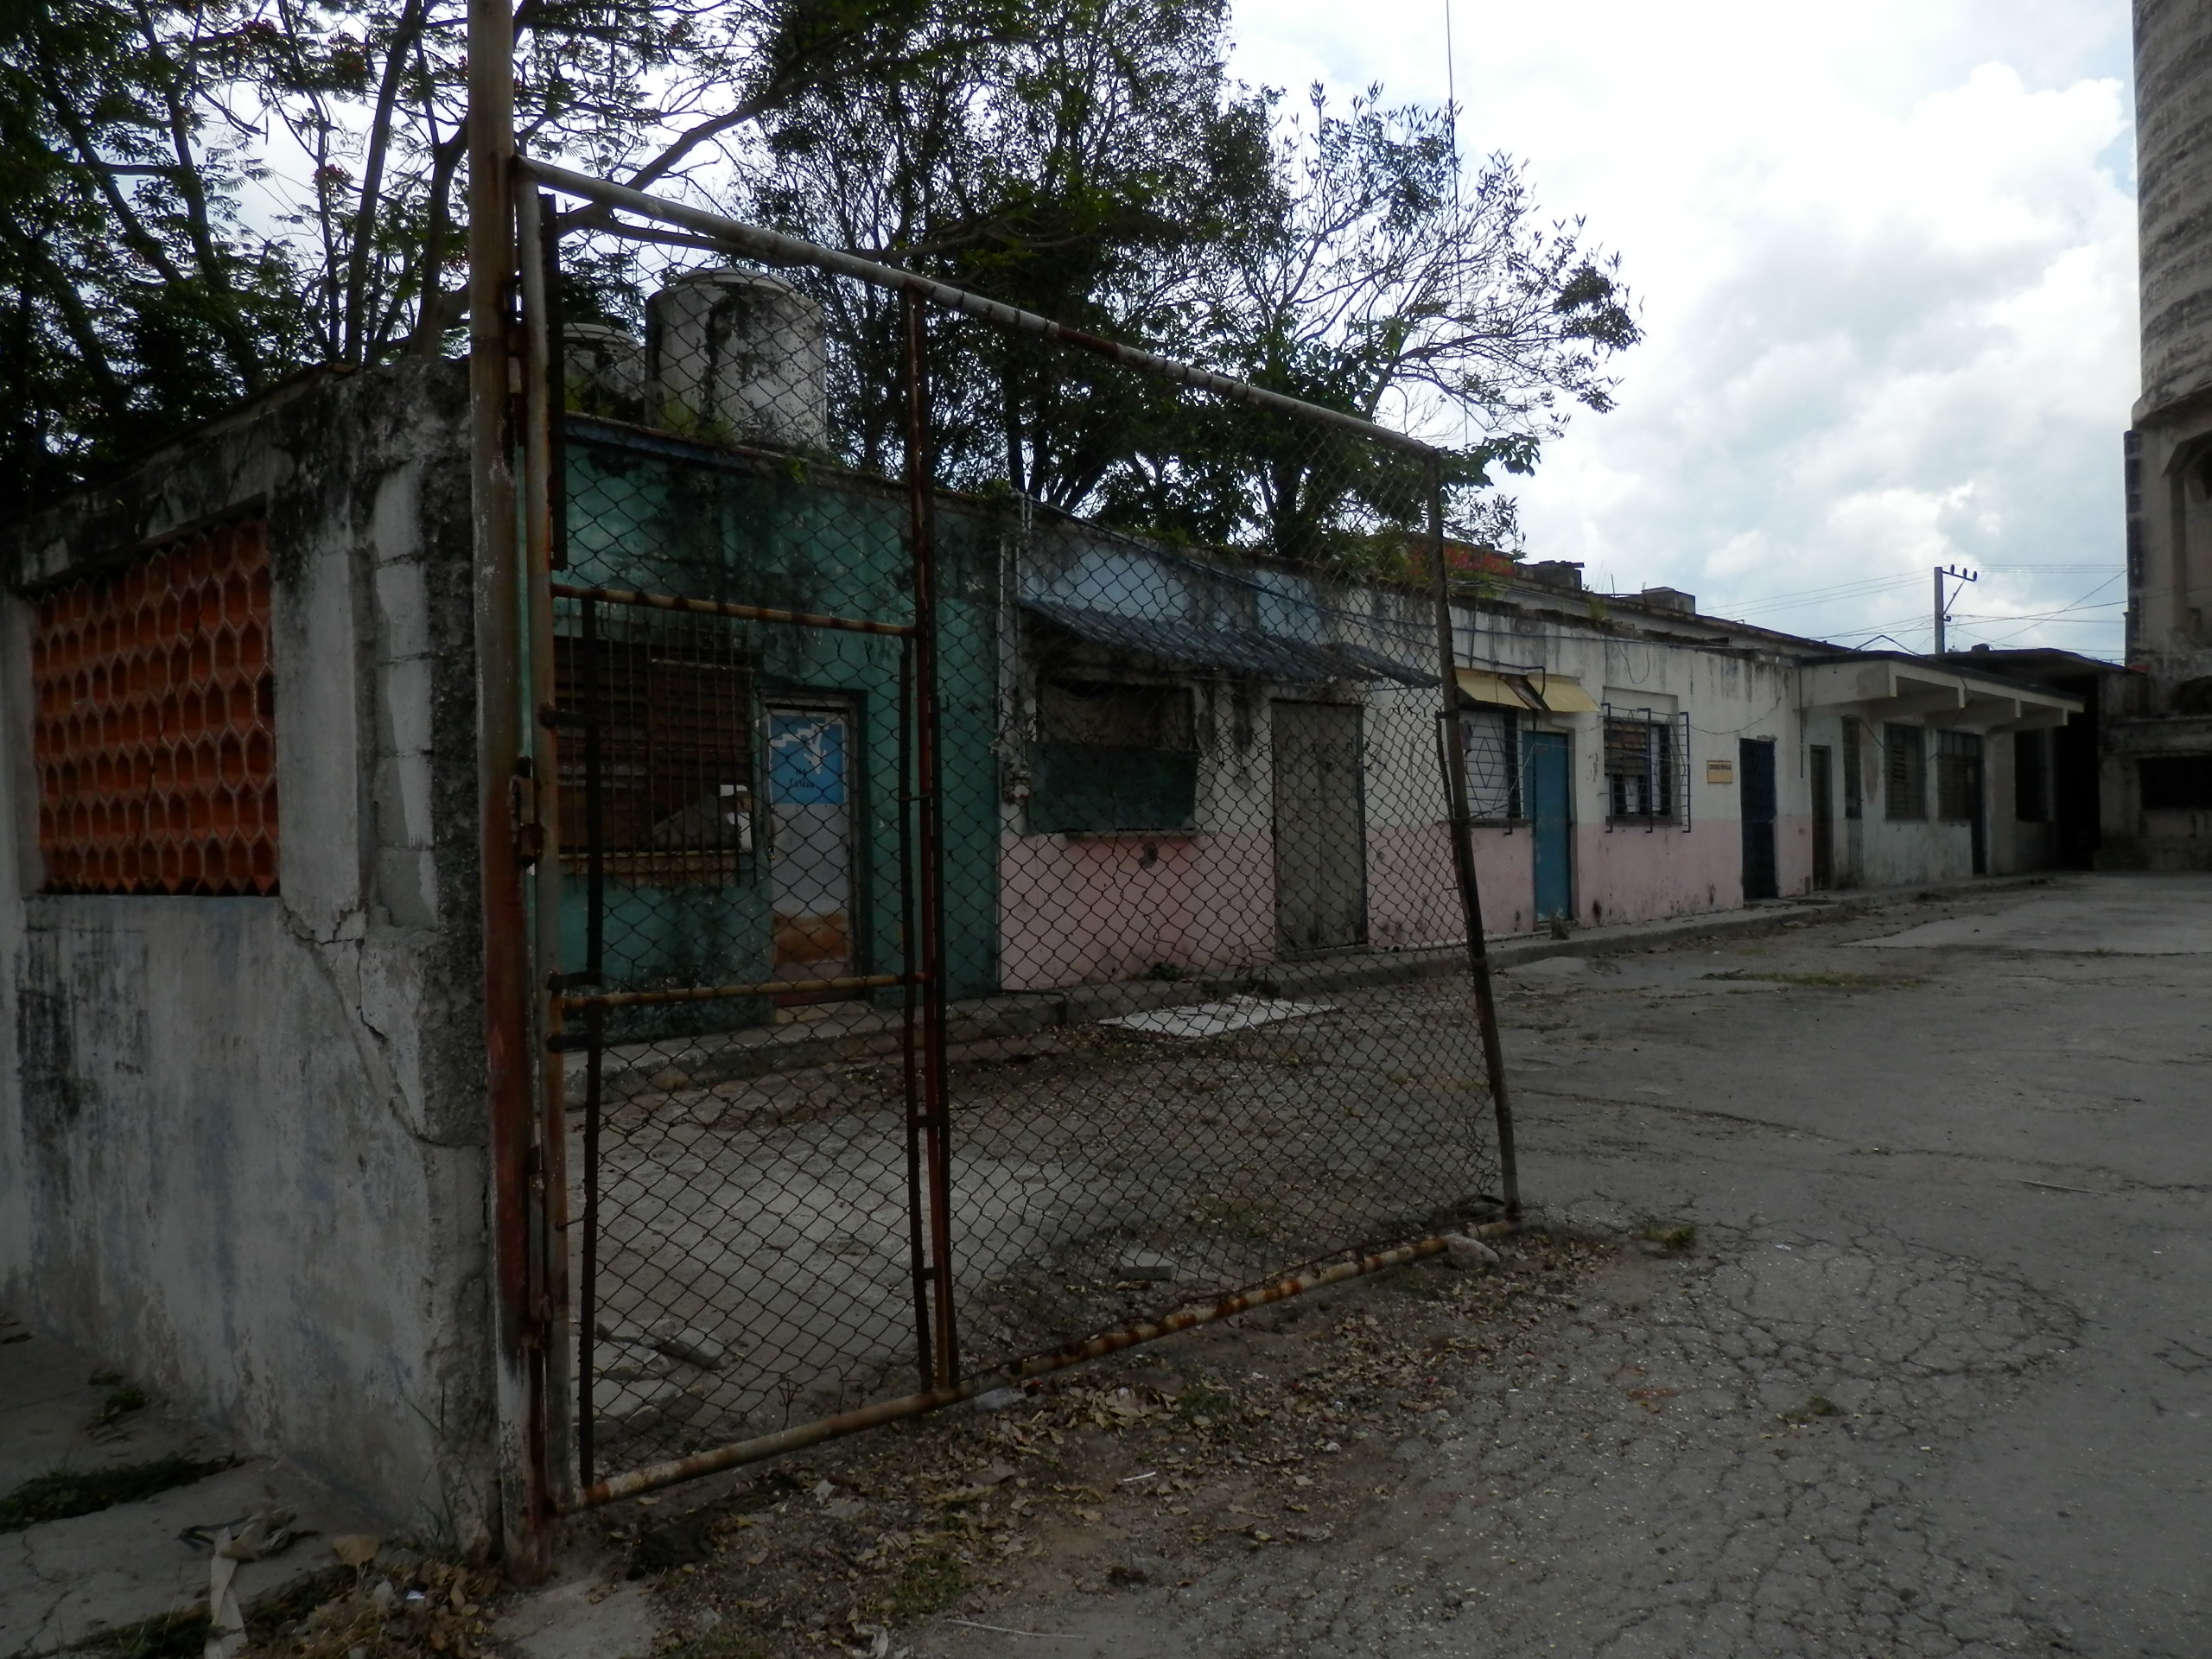
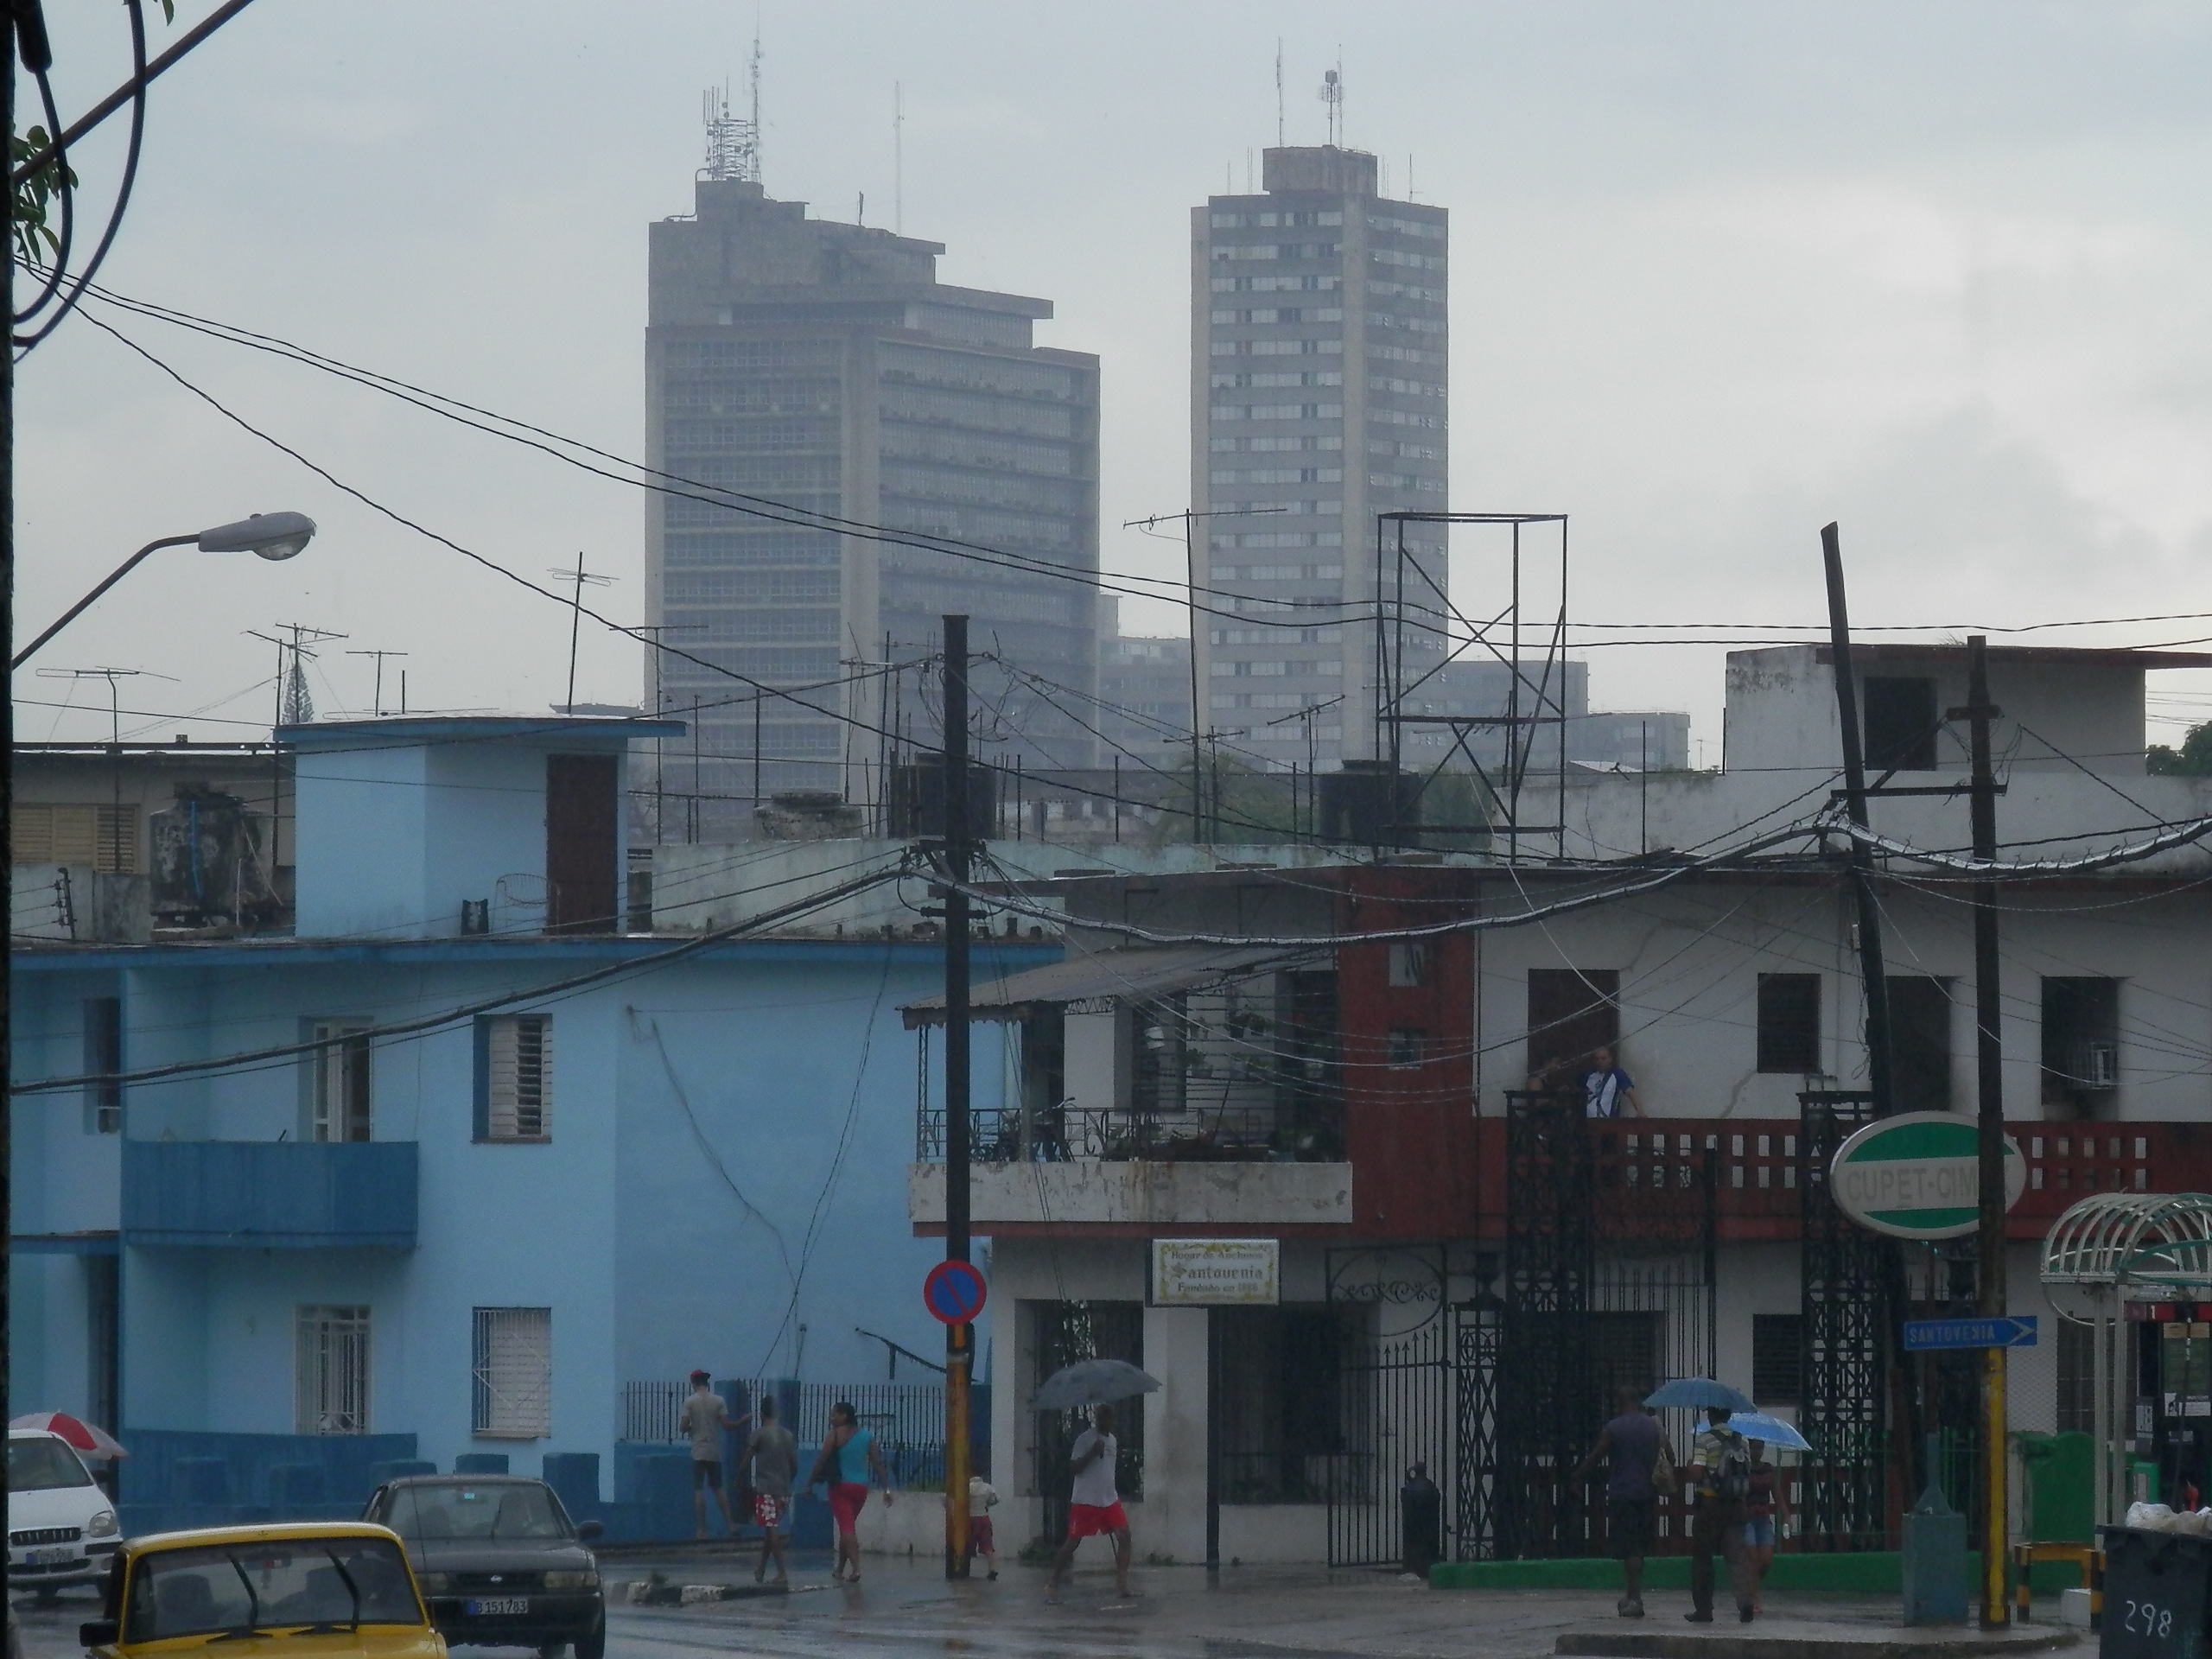
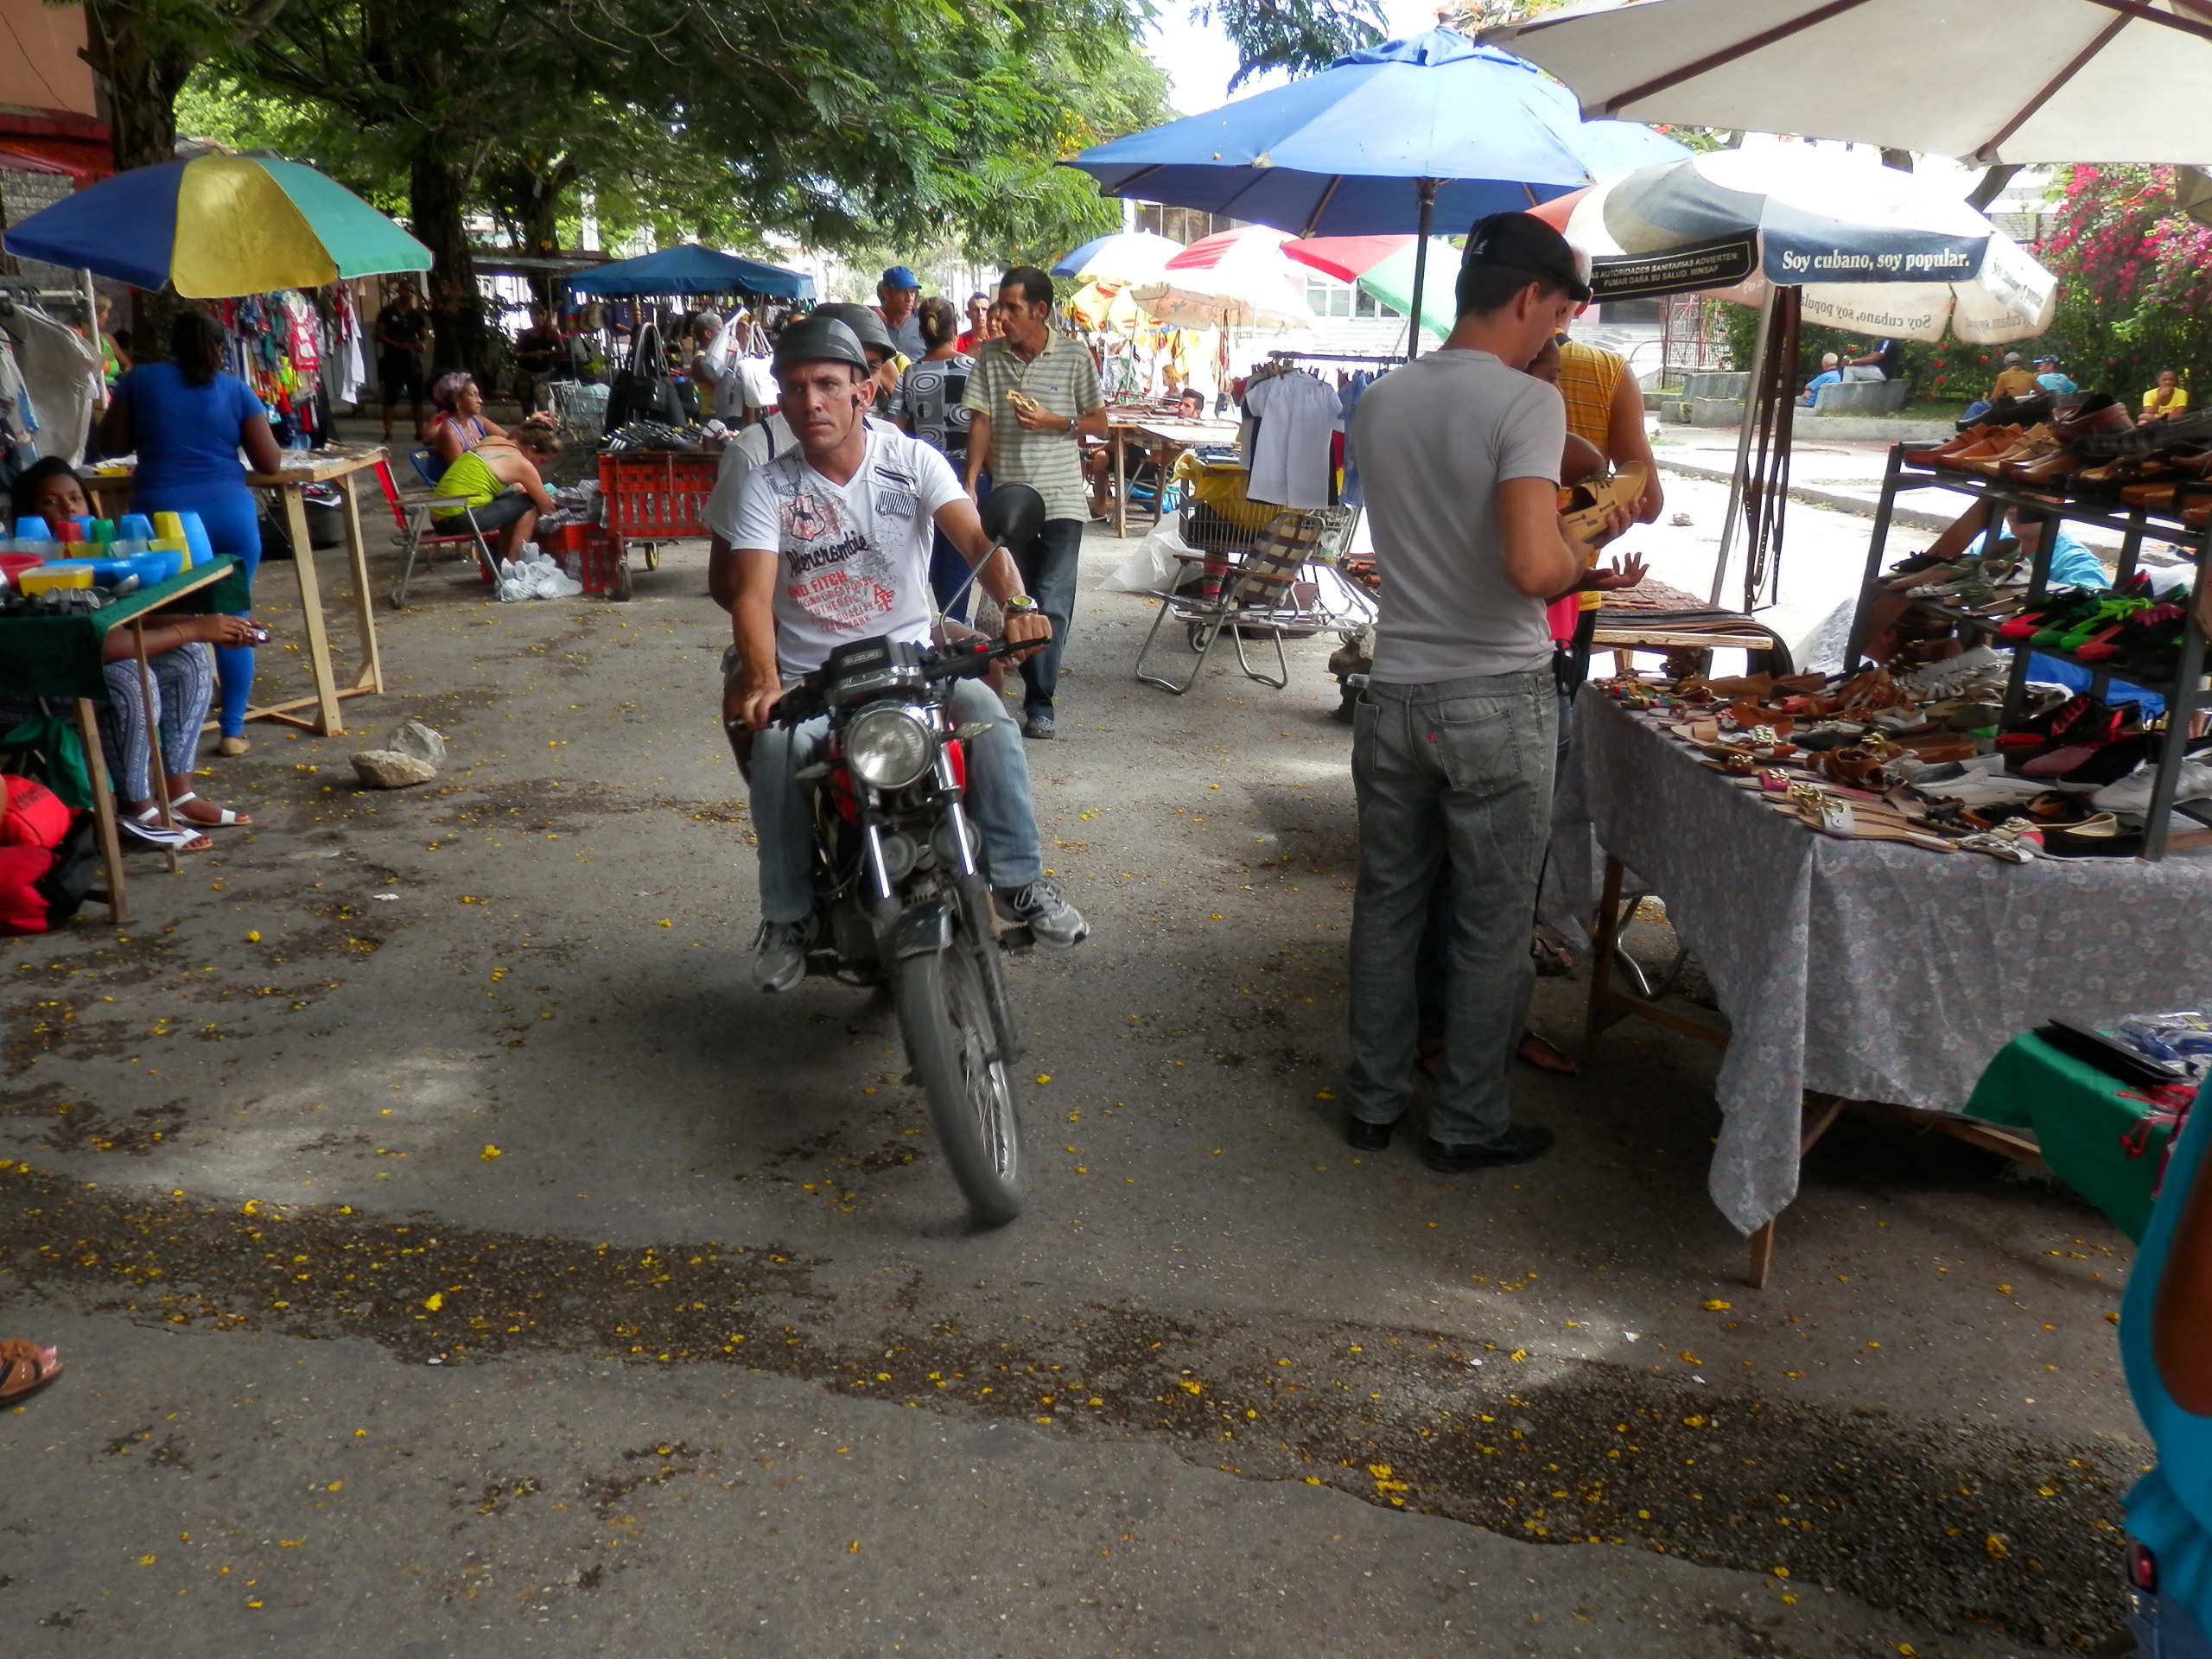
Just as peoples’ private houses were crumbling, so too was the public infrastructure—again, much like Detroit. The public spaces, while well-used, were typically full of trash, overgrown weeds, and broken objects. Many parks, for example, were defined more by concrete than grassland. Streets, if they were even completely paved, were filled with potholes and had such poor drainage that, after it rained, they would gather huge puddles.
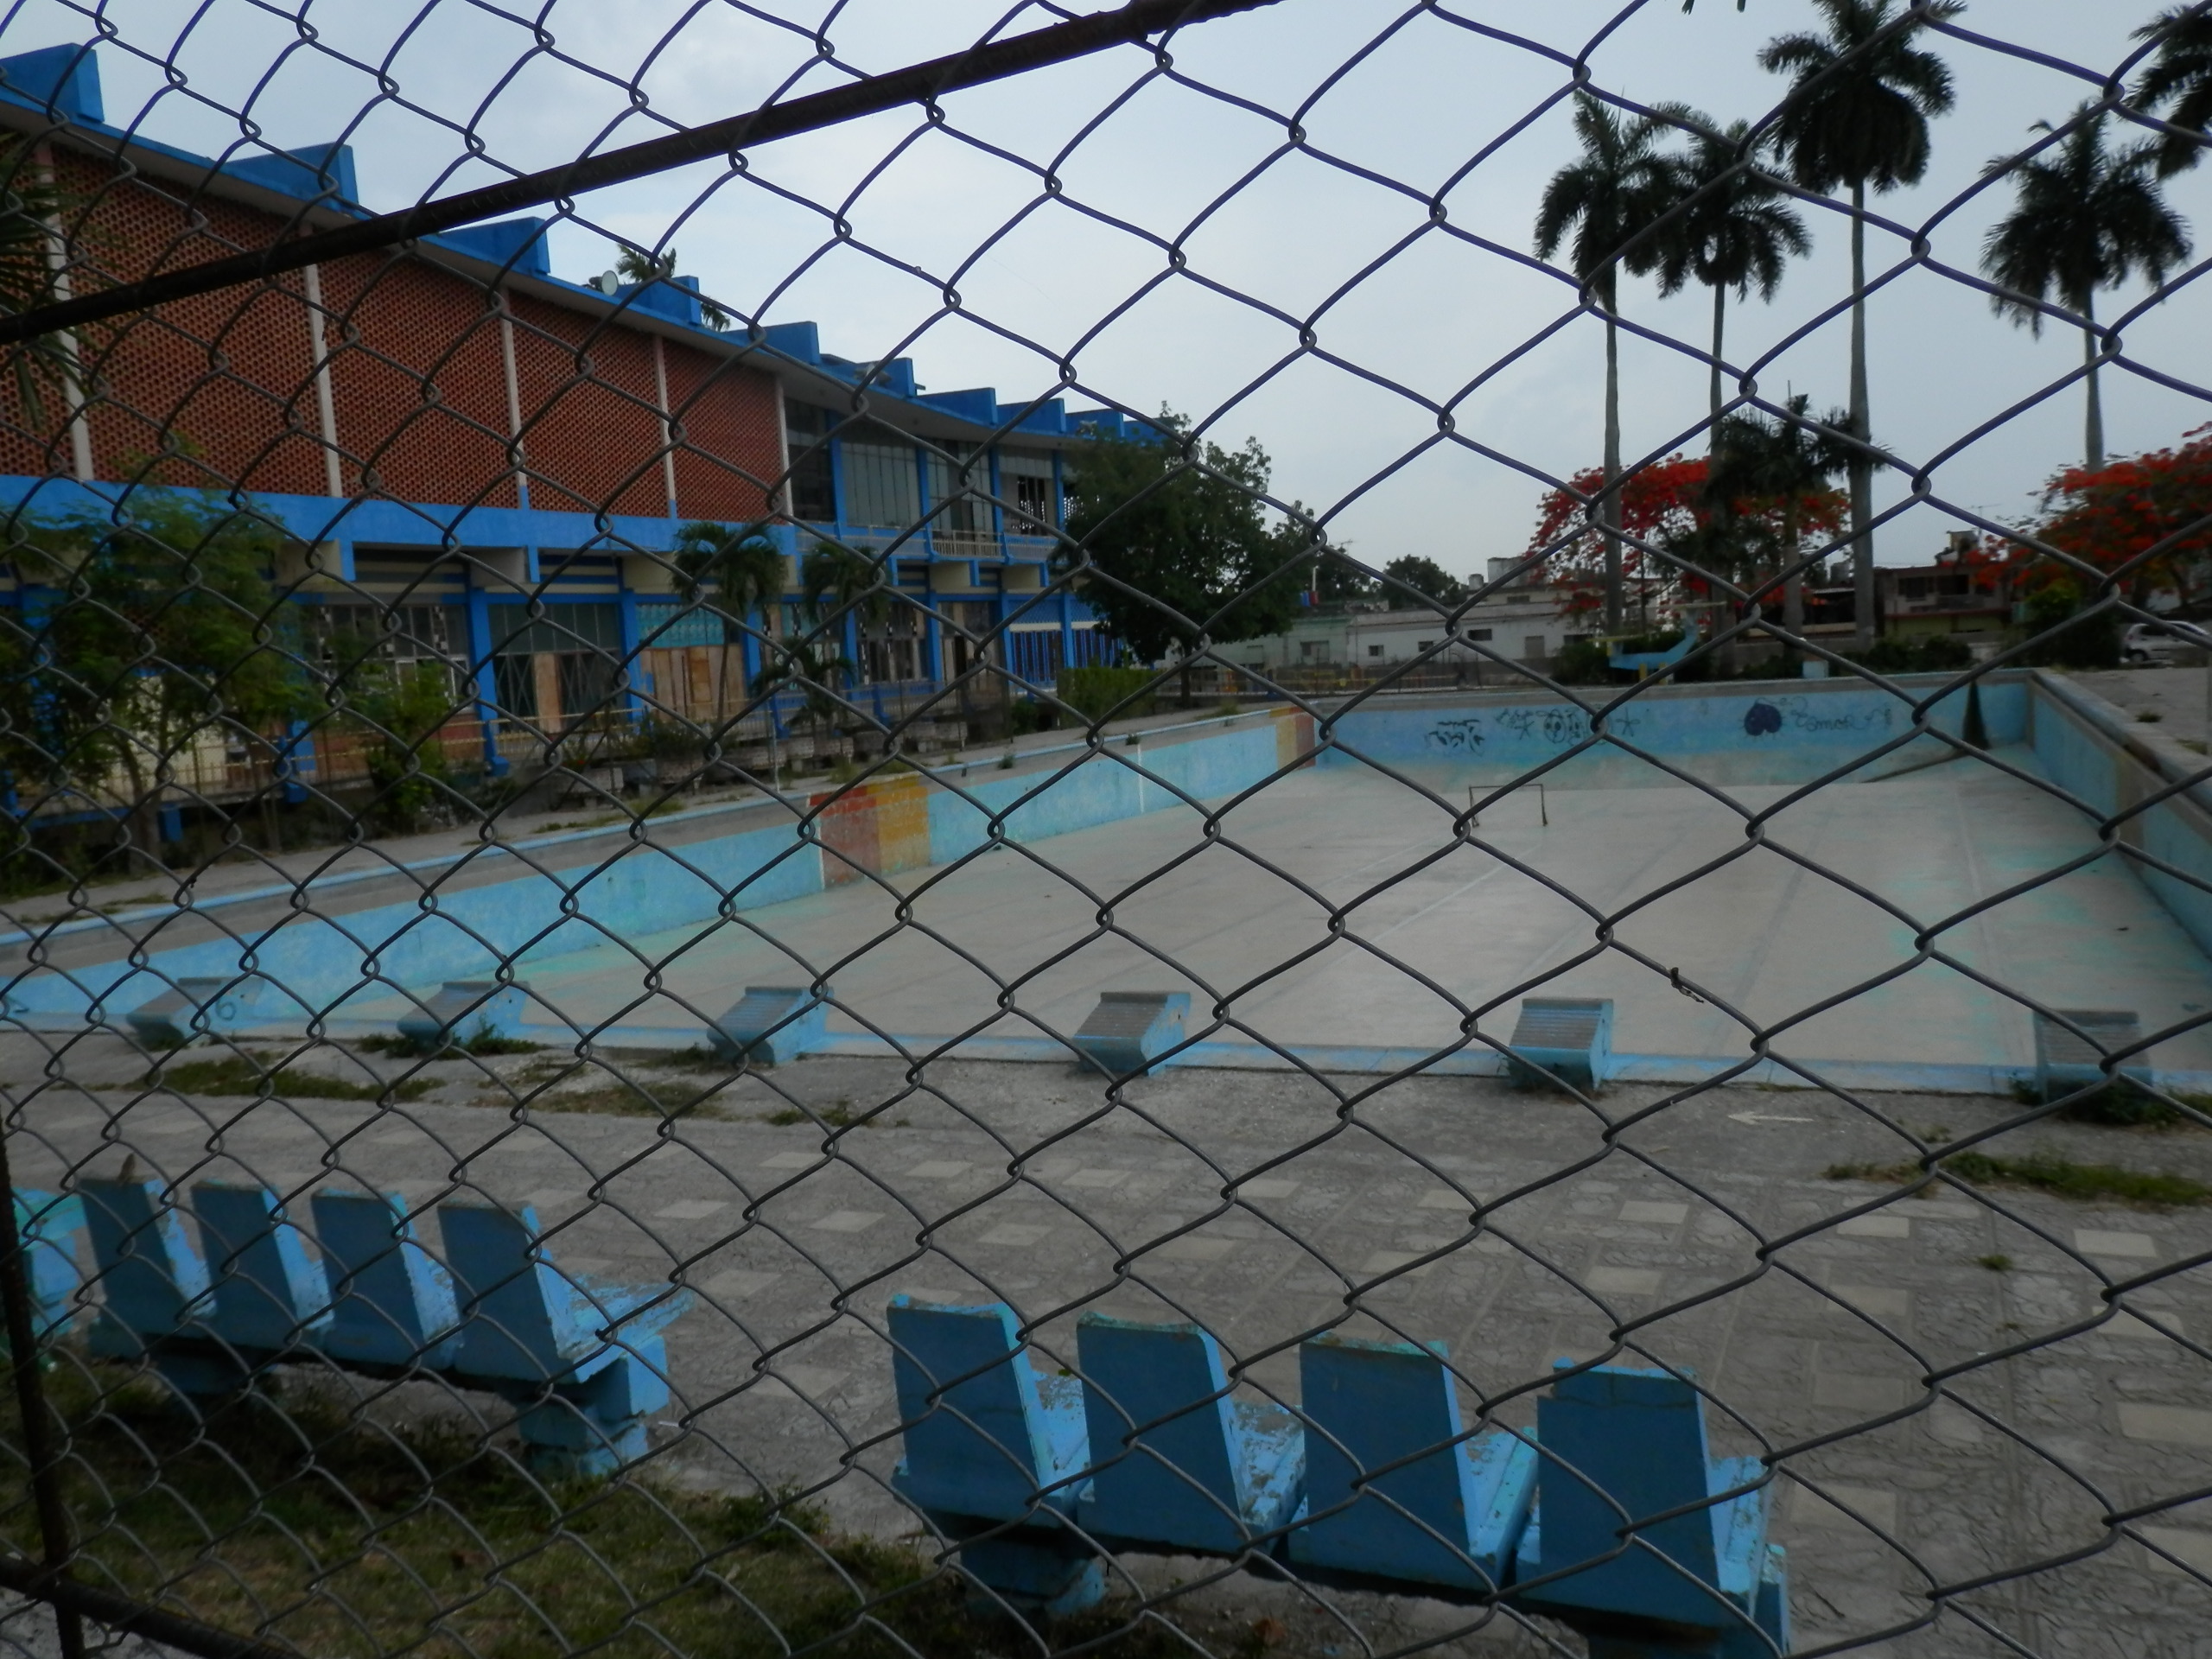
A water-less pool
I wasn’t able in my short time there to analyze the underground infrastructure. But if it is like everything else in Havana, I would assume that it, too, is crumbling. For example, contrary to what tourist brochures say, Havana’s tap water is considered undrinkable by locals, and I was routinely offered bottled water to avoid catching chlorida.
Indeed, the substandard nature of Havana’s built entities were so common that after awhile I stopped noticing. For example, when I attended a rainy futbol match at a renowned Havana stadium, I sat underneath a roof that leaked constantly, getting soaked alongside other fans. Can anyone imagine this being tolerated at a U.S. arena? When I used bathrooms even in nice establishments, I would find that there often weren’t toilet seats, door locks, or (you guessed it) toilet paper. Schoolyards had swimming pools without water and basketball hoops without rims. And on it went.
This is how life is in Havana. And I soon realized, given this, how buffoonish it would have been to go around looking for examples of “historic preservation.” Such preservation is an aesthetic notion from the First World, driven by those who are willing to pay more to retrofit attractive old housing. But in a city of extreme poverty, preservation is the pragmatic steps people take to prevent their roofs from caving in.
So How Does Havana Compare To…San Francisco?
Have you ever read an article that was so hilariously wrong that you wanted to pick your laptop up and chuck it across the room? This was my reaction to one article I read several days after returning from Havana, with the city’s horrific conditions still on my mind. On June 8, MarketWatch.com published an article by columnist Therese Poletti called “New Tech Money Is Destroying The Streets Of San Francisco.” Poletti explained that a flood of wealthy executives were moving into San Francisco, buying old homes, and altering the interiors.
It is now hard to find a Victorian home for sale that has not been gutted, its architectural details stripped and tossed. And owners or developers — looking to sell at a premium in the frenzied real estate market to “techies with cash” — hope to appeal to the tastes (or lack thereof) of current buyers, by turning once-charming homes with detailed woodwork, built-ins and art glass, into clones of Apple’s minimalist retail stores.
This trend has been developing for several years, but it seems far more prevalent today, with construction sites sprouting across the Bay Area and especially in San Francisco. And in addition to the remodeling frenzy, older buildings appear to be disappearing at a scary pace.
Before even addressing Poletti’s point, let me just set the record straight: San Francisco is not being “destroyed.” I can testify from having lived there in 2012, and visiting several times more, that the city is an architectural gem that has largely stayed in character since being rebuilt after the 1906 earthquake. Much of the city—including almost the entire northeast portion—is an oasis of historic Italianate, Queen Anne, Craftsman, and Art Deco construction. These buildings roll along the hills flanked by clean, well-paved streets, and small, impeccably-landscaped yards. From a purely aesthetic standpoint, San Francisco surpasses any other major U.S. city, and perhaps any European one.
The reason for this is two-fold. San Francisco has expansive historic preservation laws that make it difficult or illegal to alter thousands of structures. Compelling arguments have been made that the city takes this preservationist impulse too far, to the detriment of adding new housing supply–although such laws help maintain its unique character. But the other factor—to which Poletti seems oblivious—is that the city has a large professional class with the financial wherewithal to maintain these homes.
I would argue that this second factor, more than the first, has preserved San Francisco. You could put a historic overlay designation across Detroit, and it wouldn’t change much. The Motor City suffers from decay because it has undergone six decades of depopulation, and this has left no one around to preserve its own large historic stock. But the Bay Area has been flooded with capital during this period, and this has strengthened its culture of preservation. Maintaining a historic home, after all, can be an expensive endeavor that requires ripping out floorboards, replacing pipes, and other structural changes. It is usually done by educated, well-off households who have either the money to fund repairs, or the time to dedicate sweat equity. Perhaps not every family preserves their homes precisely to Poletti’s specifications, and I don’t blame them, since it is difficult to live in a floor plan that was laid out a century ago. But she should not miss the broader point, which is that San Francisco has remained as it is because of the demographics it attracts.
Instead, she claims that these groups are “destroying” the city. She is thus spouting the same myth that is advanced about historic preservation by urban progressives, who seem to think that wealth and gentrification works against preservation. But a fair-minded look at U.S. cities demonstrates the opposite. If one looks at America’s most notable historic neighborhoods–the Back Bay in Boston; Capitol Hill in DC; the French Quarter in New Orleans; much of northern San Francisco; much of Manhattan and northern Brooklyn; downtown Savannah; and downtown Charleston–a unifying feature is that they have great residential wealth. Meanwhile, there are numerous cities—Baltimore, Philadelphia, Detroit, St. Louis, Cleveland—that have a similar number of historic structures. But many of them sit hollowed-out because of decline.
The same could be said when comparing Havana with Poletti’s San Francisco. Both cities have similar architecture and planning, but their differing economic histories have led to opposite preservationist destinies. Wealthy and growing San Francisco is a city where thousands of structures remain in superb shape, and where people grieve over minor alterations. Havana’s system has produced a crumbling city where the desire for preservation gets lost in a sea of basic needs. If Poletti really wants to see a “destroyed” city, she should visit the latter.
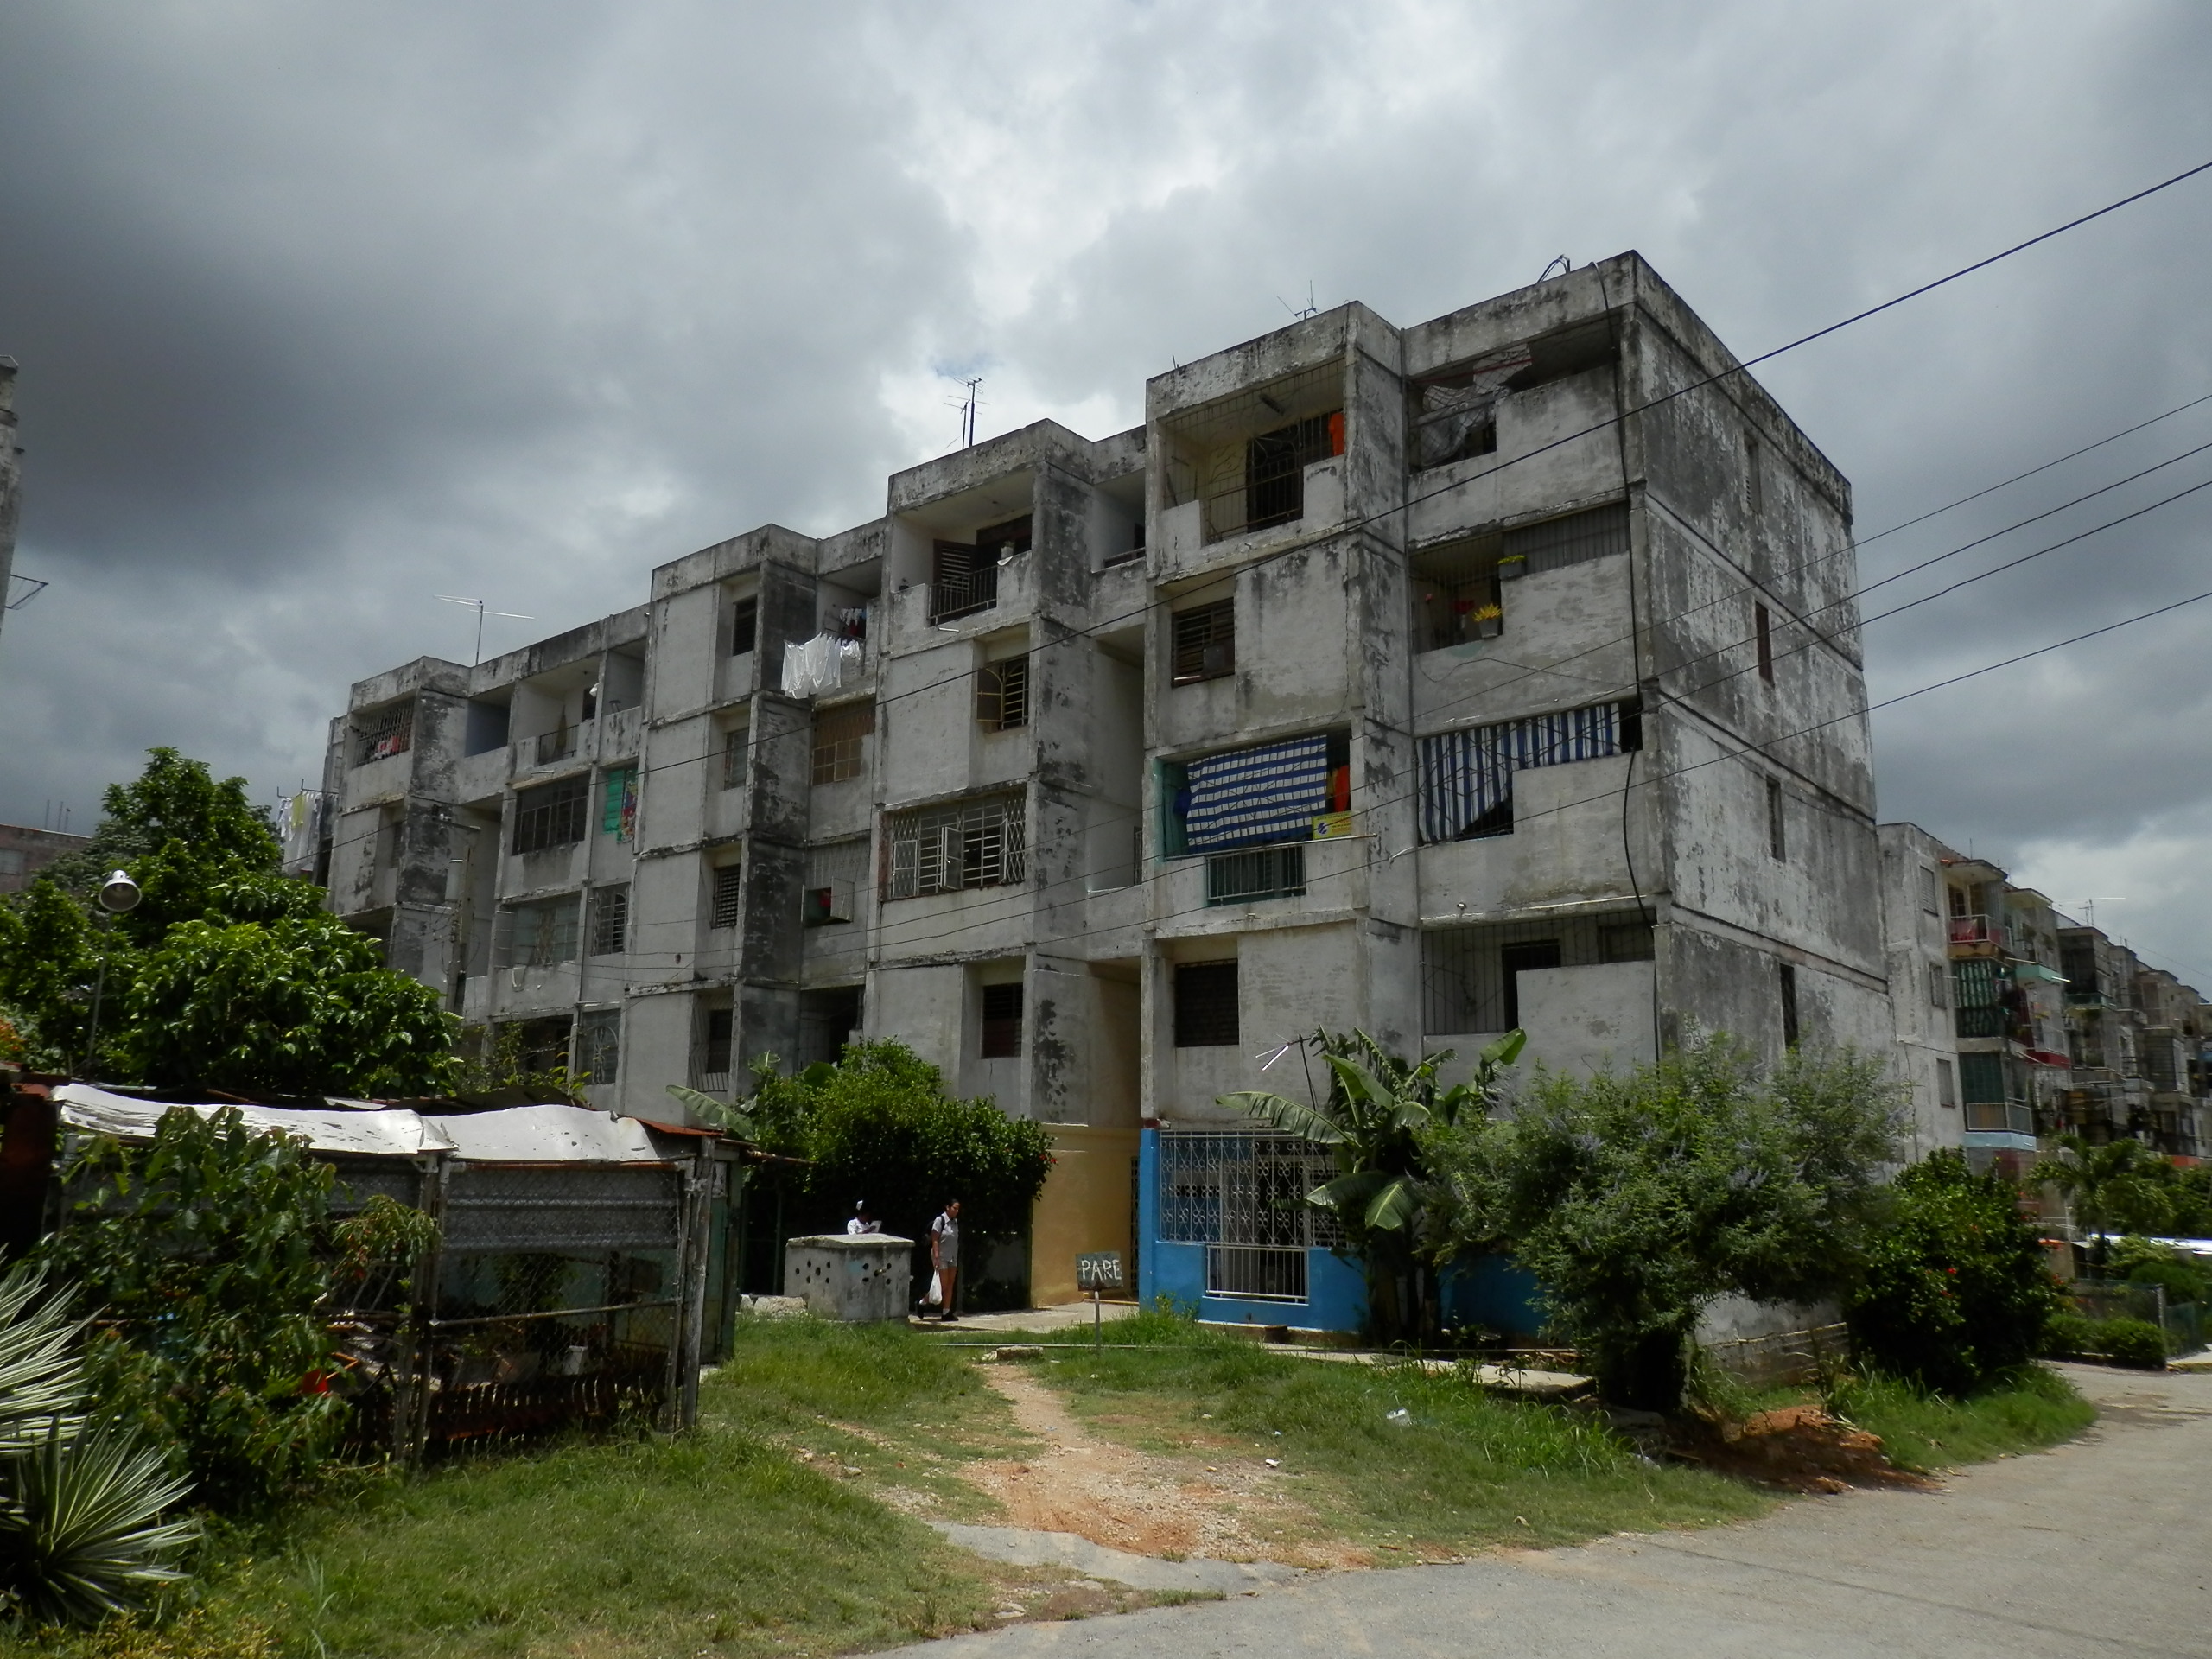
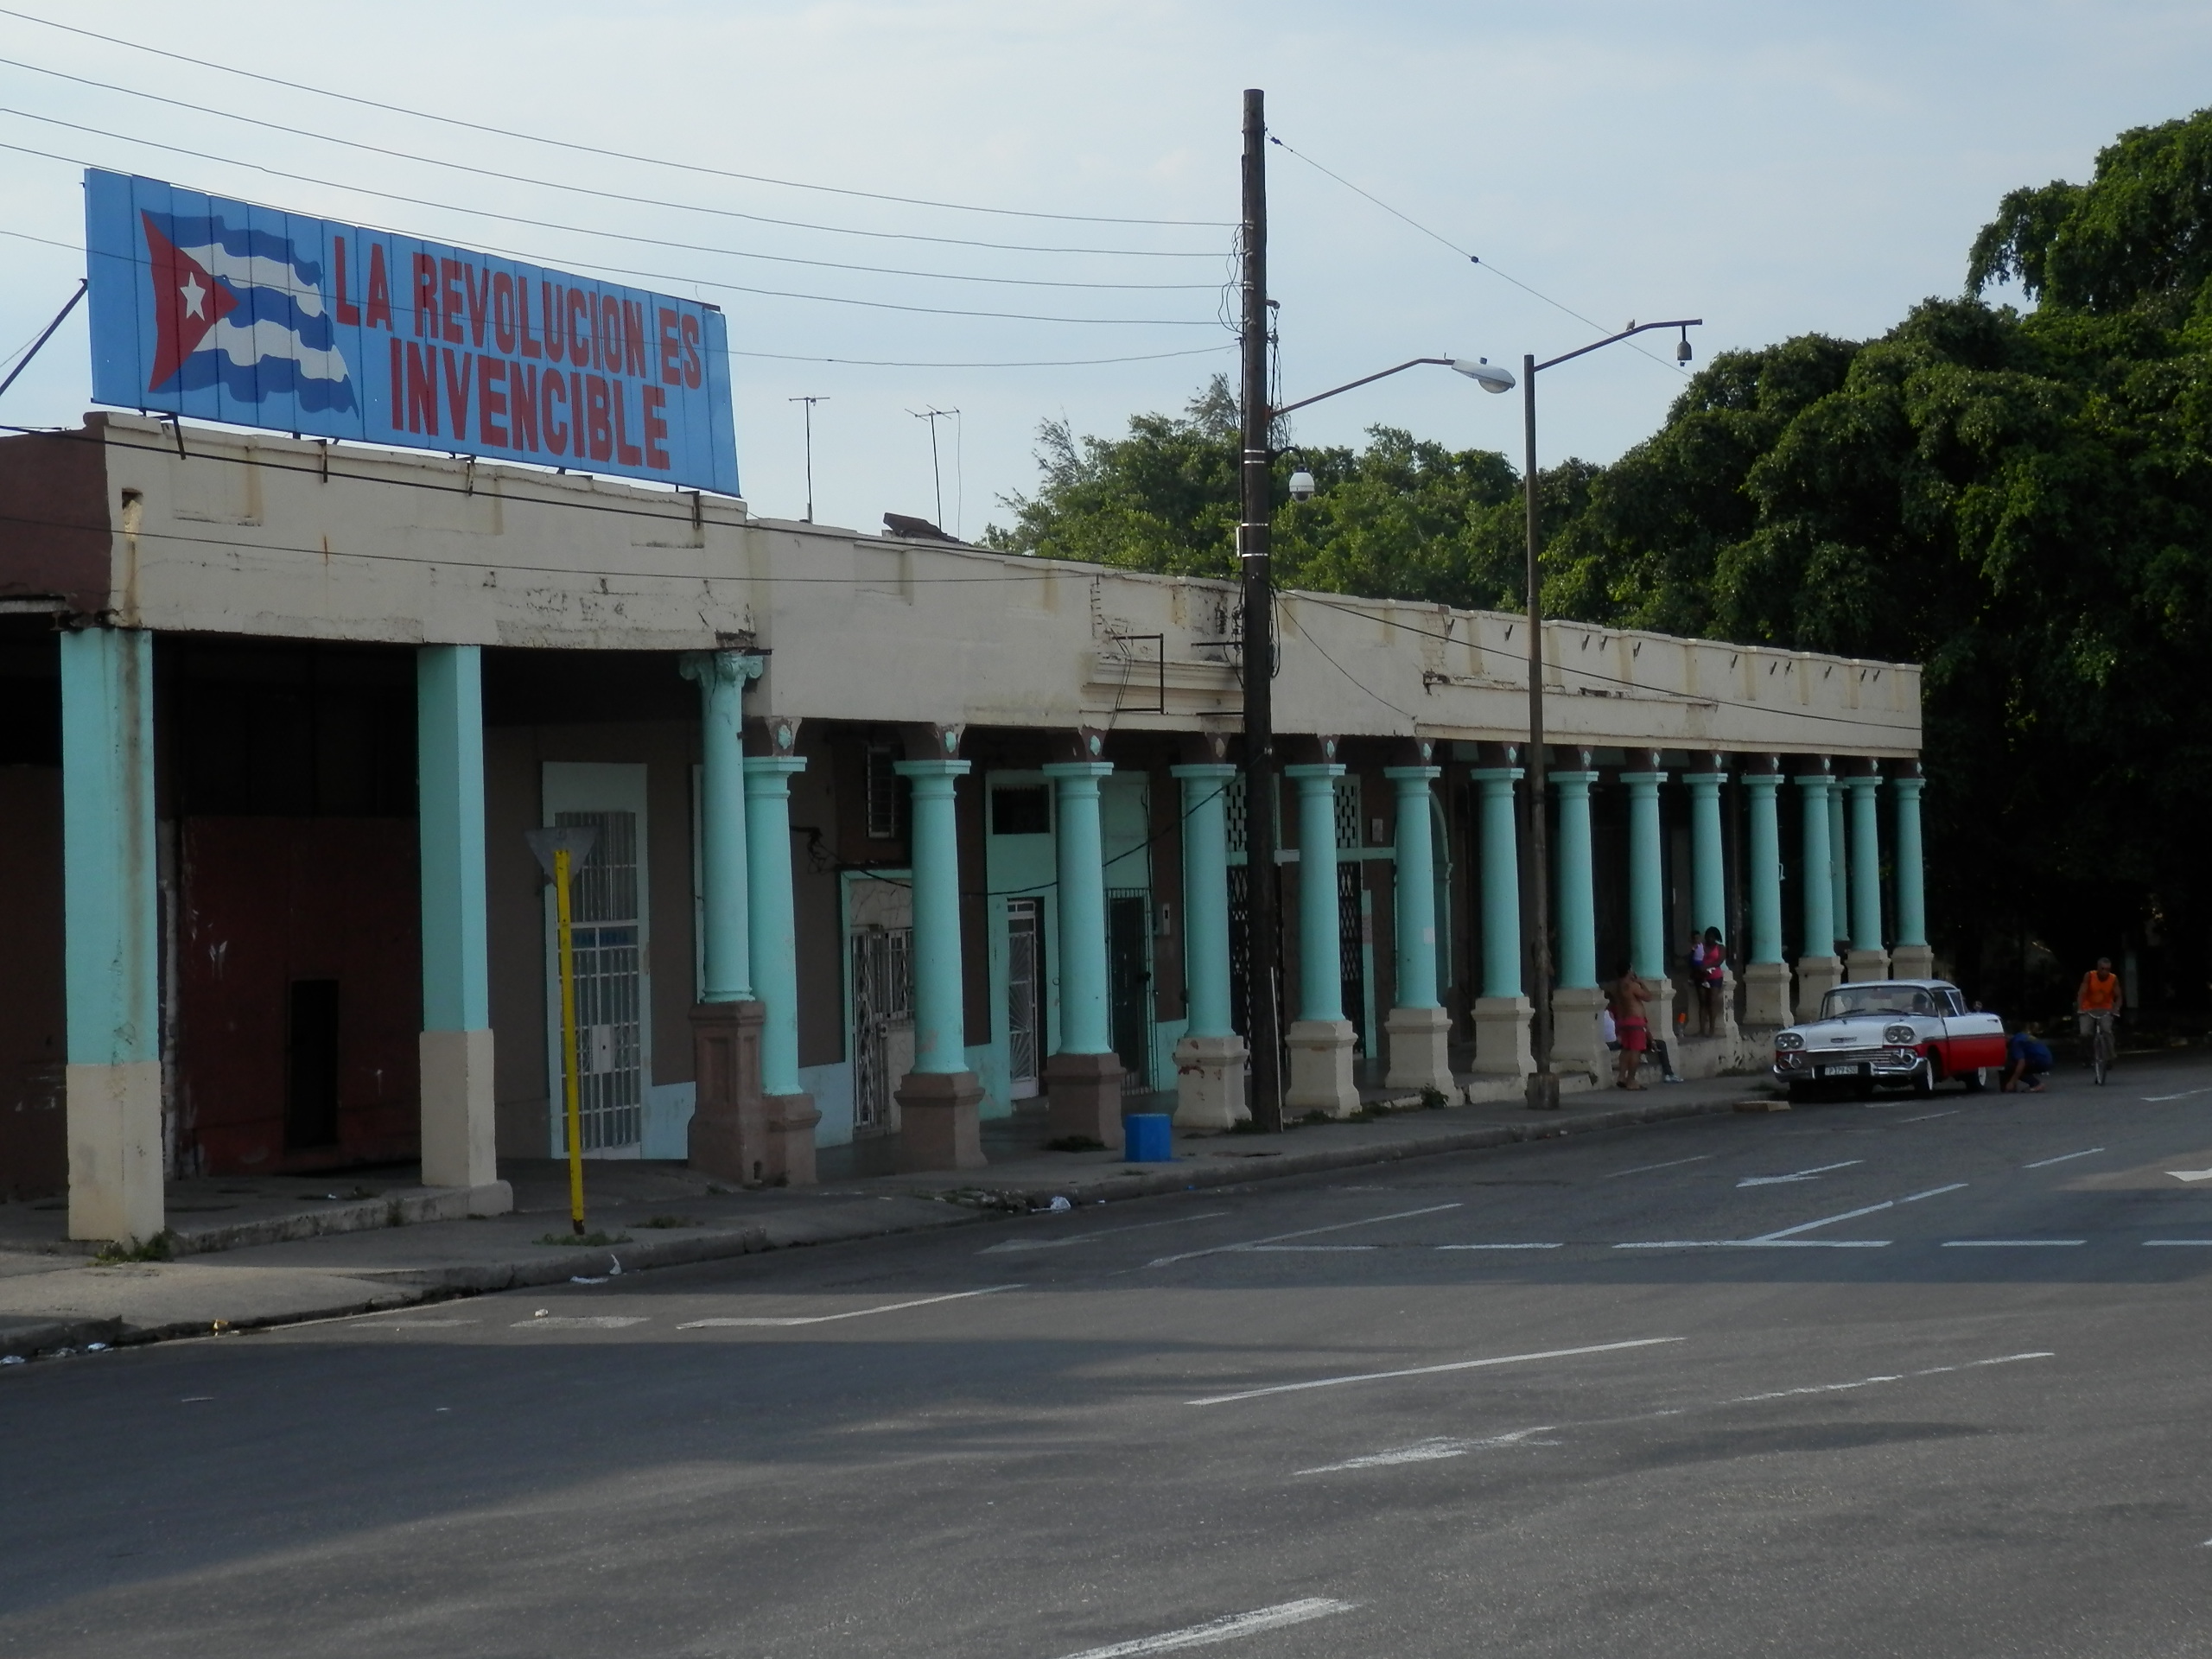
a public housing complex from the outside…
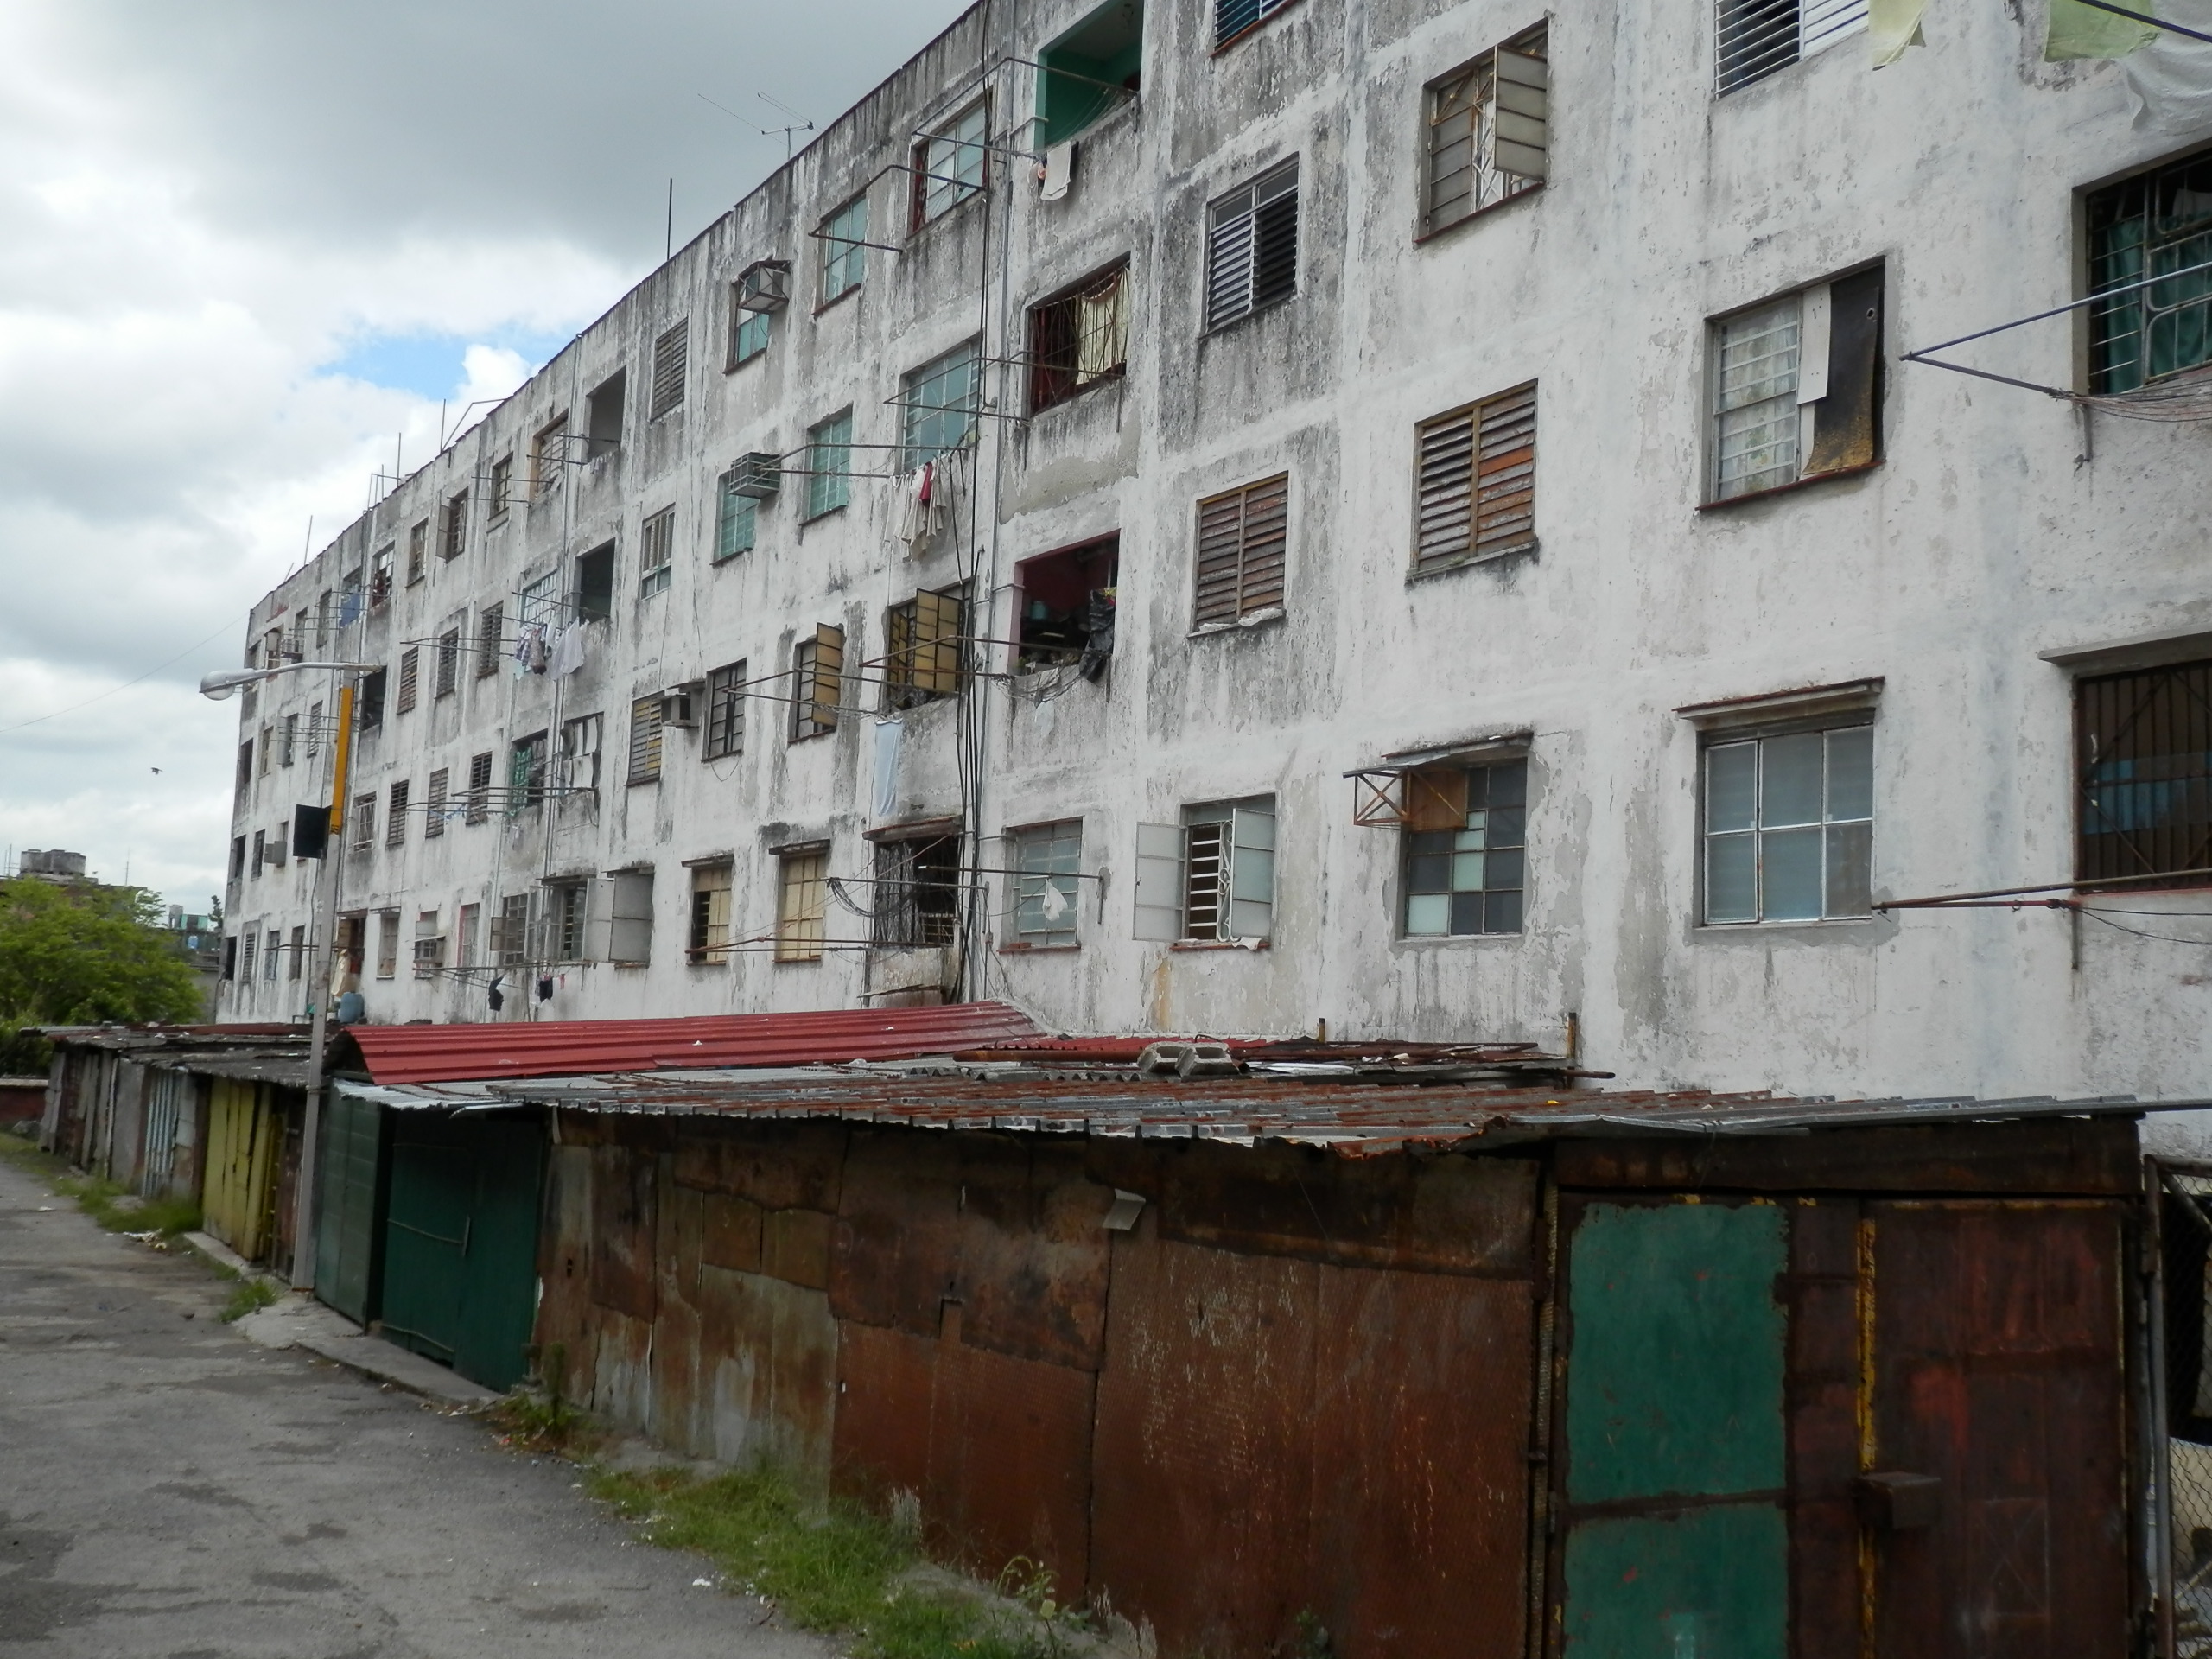
and from the inside.
This piece originially appeared at Market Urbanism.
Scott Beyer is traveling the nation to write a book about revitalizing U.S. cities. His blog, Big City Sparkplug, features the latest in urban news. Originally from Charlottesville, VA, he is now living in different cities month-to-month to write new chapters.


