Blog

  • Demography & Destiny: America’s Youngest Community

    The village of Kiryas Joel is a perfect illustration of how demographic differences can play out spatially. An enclave of ultra-orthodox Satmar Hasidic Jews tucked in the woods of Orange County, about 60 miles north of New York City, Kiryas Joel is an uncharacteristically high-density settlement filled with individuals whose high birth rate and dependence on federal aid often incurs the anger of the upper-middle class suburbs that surround it.

    Between a few hills in a picturesque but otherwise none-too-remarkable part of a mostly automobile-oriented suburban county of New York City, the settlement of Kiryas Joel has the distinction of being one of the fastest-growing communities in the entire country. In 1980, the Census recorded its population at around 2,080 people; by 2010, it had over 20,000. While such rates might not cause public officials in Nevada, Arizona or Idaho to bat an eyelash, in a slow-growth state like New York, this is unusual—all the more so because, prior to 1975, Kiryas Joel didn’t exist.

    The original founders were a group of Jews belonging to the Satmar Hasidic dynasty. Most lived in Brooklyn, and, like so many who fled to the suburbs at that time, the first arrivals in “KJ” were escaping what they perceived as the ills and crowds of the big city.

    The community has an Orthodox and Haredi population that surpasses virtually everywhere in the world outside of Israel. Its ethos is distinctive for its vocal opposition to Zionism: no Satmar Hasidim would ever culturally identify with Israel; the Hebrew lettering in its signs use Yiddish orthography. While the population in Williamsburg burgeoned, it was only a matter of time before the surrounding, secular neighborhoods of Brooklyn encroached on the enclave. After scouting several sites in New Jersey and Staten Island (rejected fiercely by locals), they discovered an area 60 miles north of their prior home, which at the time was still lightly populated, dirt-cheap and primarily exurban in character.

    Kiryas Joel grows largely through natural increase. It has among the highest birth rates of any municipality not just in the US, but in the developed world. In 2010, an astonishing 730 of 1000 women between ages 20 and 34 gave birth, a high figure even for many developing countries. Hasidic women marry young, usually shortly after completing the equivalent of high school. They do not practice birth control, so they then almost immediately begin to have children every year or two, resulting in a community with the nation’s lowest median age: thirteen years. It’s an extreme outlier, since no other place in the country has a median age under 20.

    The community can claim a number of distinctions, but among those for which it is the most notorious is that it is the poorest municipality with a population of over 10,000 in the entire country, with many estimates placing approximately 70 percent of the population at incomes that would qualify them as below the federal poverty line. About half of the residents receive food stamps, while one-third receive Medicaid benefits. This poverty correlates directly to the fact that virtually none of the women work full-time jobs, and a significant number of the men devote most of their lives to studying the Torah and Talmud; not even 40 percent of them have the equivalent of a high school degree, and the low levels of English proficiency make them further unemployable.

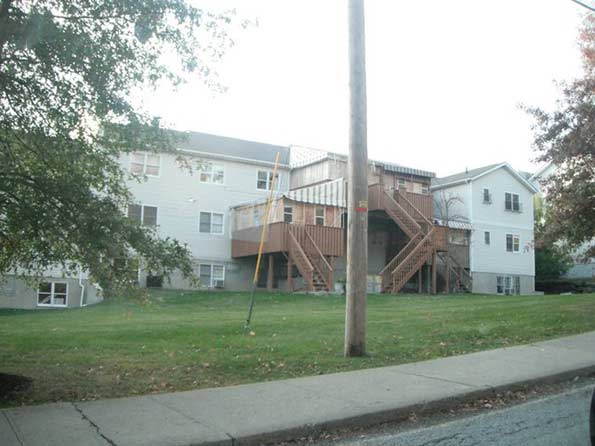
    Visually, its most prominent feature is its housing. It may not be architecturally distinctive, but the density is atypical for outer suburbs, even considering that these are outer suburbs to the nation’s largest and most densely populated city. Since the median household size is nearly six people, homes are both thickly clustered together and crowded within.


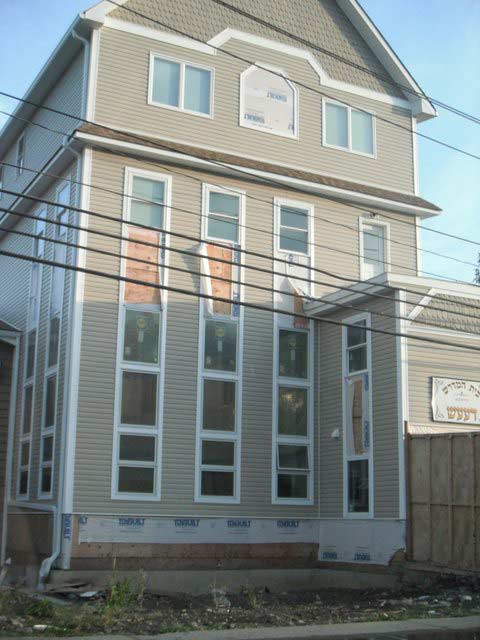
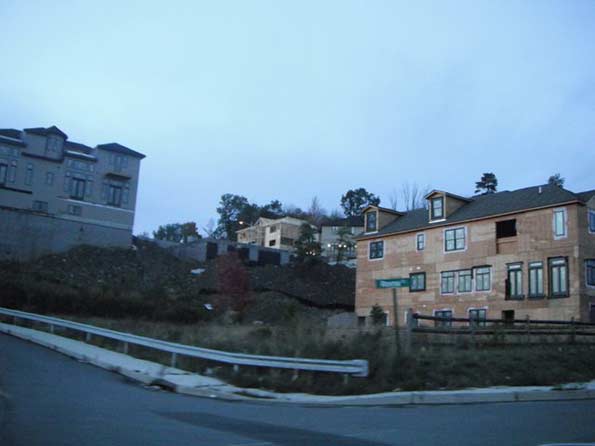
    And they’re expanding, often using construction standards that appear dubious.


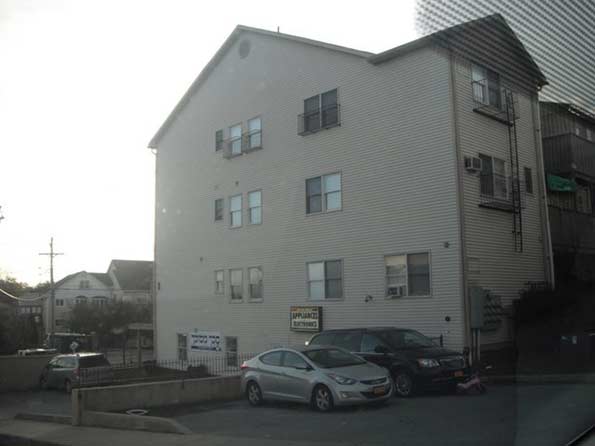
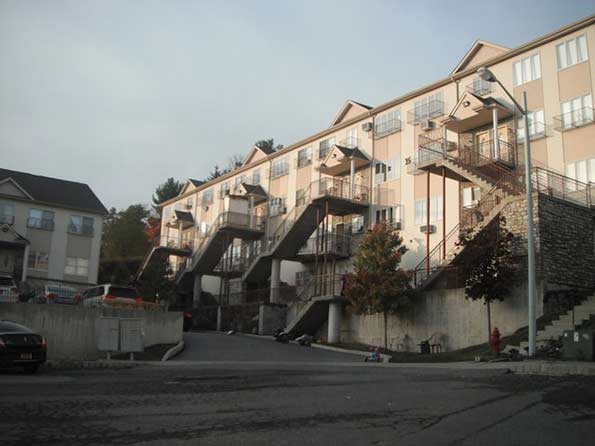
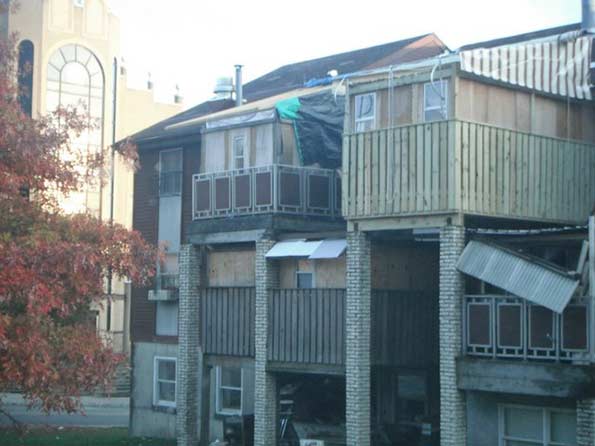
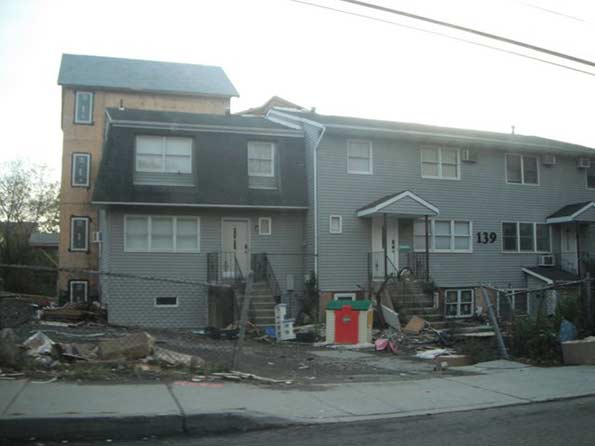
    Virtually none of the housing is single-family. Approximately 95 percent is attached, a higher rate than much of New York City, meaning yards are virtually unheard of, which explains why the streets become a play area so much of the time. And more multifamily goliaths are popping up along the forested fringe.

    In its earliest years, Kiryas Joel was almost exclusively residential. Those (mostly male) KJ residents who worked would often take buses for the lengthy trip back to the City. A Park-and-Ride service is still available on the village’s outskirts. But in more recent years, the community has become increasingly self-contained, with retail tucked in the street level of these large residential complexes, as well as basic services to meet other needs.

    With more than one synagogue, multiple commercial buildings, emergency response, and dedicated recreational space, it broadly occupies the goods-and-services domain one might expect of a smaller city of 20,000 inhabitants.

    Bearing in mind that Kiryas Joel is surrounded on all sides by mid-century homes on large, wooded lots, accessed only by undulating rural collector roads, it is really the most urban community around. It’s safe to say that KJ comprises the highest concentration of pedestrian activity in the entire area, at least on the Sabbath day, when its residents do not ride, and probably every other day of the week as well.

    The community bears more than a passing resemblance to other religiously inspired outliers in the United States, also characterized by fundamentalist interpretations of their sacred texts, atypically high birth rates, and an overt repudiation of certain contemporary mores. Certain Anabaptists (particularly the Amish) and the Fundamentalist Church of Jesus Christ of Latter-Day Saints come to mind. Perhaps the principles that shape the way of life of Satmar Hasidim are not as distinct as they may initially seem. Kiryas Joel isn’t the only exurban settlement of Hasidic or Haredi Jewry in metro New York. While Kiryas Joel is the largest, most of the others share its growth rate and are likely only to escalate in public visibility in the years ahead.

    Kiryas Joel embodies a collision of values written many times over. Apparently, the surrounding population in the Town of Monroe has vigorously protested its further growth because it represents suburban sprawl. The irony of such an accusation is obvious. Not only was the development pattern of the 1960s and 1970s a glorification of a decentralized, anti-urban ethos that many deride as sprawl, most recent development in Orange County comes far closer to the “sprawling” densities of Monroe than does Kiryas Joel.

    Even if Kiryas Joel is not unique, it’s still such an anomaly that it is impossible to ignore. It’s a greenfield development more tightly packed than the densest neighborhoods in many American cities. It required no market analyses to determine if a sufficient demand existed to support such high density; the demand was obvious to the rabbinical leadership. The Town of Monroe did not overtly incentivize the development of this concentrated settlement through density bonuses in order to bolster its tax base (quite the opposite). While KJ looks nothing like the Traditional Neighborhood Development (TND) planned communities that have popped up across exurbs throughout the country, it shares at least a few of their objectives: mixed uses and high densities promote the sort of walkability that an increasing number of suburbanites find appealing. And for the Satmar Hasidim, walkability is essential.

    The community remains antithetical to what most of its neighbors would define as the “American Dream” as it applies to housing—a catchphrase that by now is hackneyed, not just from overuse, but from the narrow cultural implications it evokes. Yet Kiryas Joel continues to boom in population The American Dream is diversifying exponentially, fueled by disparate, self-actualizing initiatives, and manifesting in ways that depend largely upon their location. Kiryas Joel is just one example of many that are only “bad” or “good” when compared to their counterparts, whose own goodness or badness depends just as much on subjective judgment. The escalating elasticity of the American Dream must therefore concede to another catchphrase: live and let live.

    Eric McAfee is an itinerant urban planner/emergency manager who fuses his cross county (and trans-national) travels and love of contemporary landscapes into his blog, American Dirt (http://dirtamericana.com/). A longer and slightly different version of this post originally appeared in American Dirt: Part I and Part II.

    Photos by the author.

  • Inside the Bubble

    I was recently asked by a neighbor to write a blog post about greed in the super heated economic bubble here in San Francisco. I told her I think the problems that vex her are more complicated than pure greed, but I’d give it a shot. Keep in mind, where a person stands on any of these issues depends a great deal on their particular circumstances. The point of this post isn’t to argue in favor of one thing or another, but to illustrate how some people experience the city at this moment in time.

    So… my friend has lived in the same spacious rent controlled flat in an old Victorian for many years. Her tenure predates the current tech culture by decades. Chatting over lunch in her kitchen and dining room is like visiting a bygone version of San Francisco where everything is more relaxed and comfortable and perhaps a bit less glossy. Over the last several years she’s seen half the buildings on her block transformed by the tsunami of money that has washed over the neighborhood. The elderly Chinese couple who own her building will eventually pass and when they do she knows their adult children will sell the place and she’ll be forced out. For her it’s not just a matter of leaving the building or even the neighborhood, but leaving the city altogether. There’s simply no possible financial scenario that will allow her to stay in the Bay Area on her income as a freelance graphic designer. That world is gone and she doesn’t have a Plan B.

     unnamed-4

    Her preoccupation with the new money culture in the city has been especially stirred up by the activities of the building directly next door. Back in 2010 the owner of the building had a structural engineer certify that the building was unstable and therefore uninhabitable. This could be seen as a landlord who was deeply concerned for the health and safety of his tenants, or a legal tactic to remove them. A series of challenges ensued, but at the end of the day the building was emptied, fully gutted, and renovated. The apartments were then sold off as condos. The average sale price in 2014 was just shy of a million dollars for each of the one bedroom apartments. Some of the people who purchased the units were investors who then rented them at the current market rate of $4,950 a month.

    Screen Shot 2015-02-27 at 12.57.29 AM Screen Shot 2015-02-27 at 12.57.00 AM Screen Shot 2015-02-27 at 12.55.48 AM

    One of those renovated condos was bought by a young Russian DJ. I’ve met him and he’s actually a perfectly nice guy. I’m listening to his audio stream right now – house trance techno electronica… Evidently he’s a big deal in international music circles. (I’m more of a Billy Holiday Ella Fitzgerald kind of guy, but I digress.) Shortly after he moved in he decided to take six months off and travel to Thailand. While he was gone he left the apartment in the hands of a popular home hosting service that arranges short term rentals to tourists and business travelers. In theory the service was completely turnkey with booking, cleaning and so on. But in reality the apartment needed a bit more care over such a long period of time than the company was able to provide. The Russian asked my friend next door if she could help out. “Could you” this and “Would you mind” that. Individually none of these favors was particularly onerous, but collectively it became a lot of work as the months dragged on. The Russian was having such a good time in Thailand he decided to extend his stay. At a certain point my friend let it be known that her services had gone beyond merely being a helpful neighbor and it was time she was paid for her work. An e-mail exchange ensued with a list of time that had been spent on various projects. The Russian felt that he had been misled. “That seems like a lot of money.” This was coming from someone who just spent nearly a million dollars on an apartment and can afford to spend half a year on vacation in Asia. You can see how this might rub my friend the wrong way. Hence her frustration with the freakish economic situation in the city.

    On the other hand, there are a fair number of people who are living in tiny run down apartments with multiple room mates paying outrageously high rents who feel that a massive rent controlled apartment is a seriously sweet deal. Sure, it will come to an end someday, but dude! Really? You’re bitching that it doesn’t come with a lifetime guarantee? Suck it up cupcake.  Like I said. Where you stand on these issues depends a lot on your particular situation.

    6 EasterDinner(12)2007 IMG_0120 (640x480) 

    For those of you who aren’t intimately familiar with the local dynamics I’ll give you some context. On most nights friends and family gather around our kitchen table for dinner and we discuss the events of the day. Over the last few years we’ve hardly had a month go by where someone hasn’t had to pack up and leave the city because of eviction, unreasonably high rents, or a lack of available housing at any price. Other folks who already owned property decided to cash out and took their substantial profits to more affordable towns.

    Screen Shot 2015-02-28 at 5.21.13 AM

    Last week we had a couple over who had rented a charming house with a back garden in Bernal Heights for nearly twenty years with the enormous benefit of rent control that kept their expenses well below the market rate all that time. The landlord sold the home a few months ago and the new owners evicted them in order to live in the house themselves.

    Screen Shot 2015-02-28 at 5.23.47 AM

    They reluctantly moved to an apartment in Oakland. They don’t hate the apartment or Oakland per se, but it’s definitely a transitional space for them. They’re looking to move as soon as they decide what exactly they want and can afford. There was a lot of talk about how San Francisco has become inhospitable to people with normal budgets. At a certain point I asked them why they hadn’t prepared for the eventuality of the big move. They knew what the real estate market was like. Their eviction couldn’t have come as a surprise. They’re both professionals with solid incomes. They could have pulled together a downpayment and bought property at any point during the last twenty years when prices were more reasonable. Instead they enjoyed the benefits of a great rent controlled place. It was a perfectly reasonable economic decision and it served them very well for two decades. But there were trade offs. Now it’s time to come up with a new plan. Let’s just say they didn’t appreciate my interpretation of their situation.

    Screen Shot 2015-02-28 at 5.40.17 AM

    A couple of months ago we noticed one of the longterm tenants of a nearby building packing up and loading his furniture into a moving van. We were shocked. He had lived in that apartment with rent control for forever. We all thought he’d eventually leave feet first. It turns out that the landlord paid him $30,000 to go voluntarily and he agreed to take the money. Once the landlord gets new tenants he’ll likely receive $3,800 or more per month for that unit so his $30,000 “investment” in freeing up the apartment will be repaid in eight months. $30,000 won’t buy you anything at all in San Francisco, but it’s pretty good seed money in many parts of the country. If this guy is smart he’ll use the cash to put a downpayment on a house in a less expensive town.

    Now, here’s something else to consider. San Francisco is in an enormous economic bubble. It won’t last. These things never do. And when the bubble pops there are going to be a whole lot of folks who paid top dollar for real estate that’s going to be worth infinitely less. Any number of things could puncture the balloon: another Wall Street crash, an earthquake, a shift in foreign investors, or the inevitable maturation of the tech sector and its associated stock options and super sized bonuses… When that day arrives everyone’s situation may change and the general perception of who’s a winner and who’s a loser may flip as well. And we’ll all have to suck it up. That’s life.

    John Sanphillippo lives in San Francisco and blogs about urbanism, adaptation, and resilience at granolashotgun.com. He’s a member of the Congress for New Urbanism, films videos for faircompanies.com, and is a regular contributor to Strongtowns.org. He earns his living by buying, renovating, and renting undervalued properties in places that have good long term prospects. He is a graduate of Rutgers University.

  • The Evolving Geography of Asian America: Suburbs Are New High-Tech Chinatowns

    In the coming decades, no ethnic group may have more of an economic impact on the local level in the U.S. than Asian-Americans. Asia is now the largest source of legal immigrants to the U.S., constituting 40% of new arrivals in 2013. They are the country’s highest-income, best-educated and fastest-growing racial group — their share of the U.S. population has increased from 4.2% in 2000 to 5.6% in 2010, and is expected to reach 8.6% by 2050.

    Some Asian immigrant groups tend to struggle, notably Hmong, Laotians and Bangladeshis,,but on average, Indians, Chinese and Koreans do at least as well as Anglos, and in some cases better. In the 52 major metropolitan areas, Asians’ median household income is $70,600, compared to $66,100 for White non-Hispanics.

    Widening the focus to smaller cities, for the most part, the most heavily Asian communities in America tend to be prosperous, and many are tech oriented. They also tend to be overwhelmingly suburban, often in places that have good public schools.

    Shift To The Suburbs

    In the past Asians, like other immigrants, tended to cluster in “gateway cities” and often in the densest urban neighborhoods, like New York’s Chinatown. Now the center of gravity has shifted to the suburbs. Between 2000 and 2012, the Asian population in suburban areas of the nation’s 52 biggest metro areas grew 66.2% while those in the core cities expanded by 34.9%. In 2000 three large cities ranked among the 20 most heavily Asian cities with populations over 50,000: Honolulu, San Francisco and San Jose. In 2012, only the Hawaiian capital made the grade (Hawaii is the only state with an Asian majority).

    As of 2012, 18 of the 20 most heavily Asian communities were suburban, all but one of them are in California. Not surprisingly quite a few are the smaller cities of Silicon Valley, where Asians constitute roughly half of all tech employees. Cupertino, a city of 59,700 that is home to Apple’s headquarters, takes the title of the most Asian city in the U.S., with a population that was 65% Asian as of 2012, up from 45.9% in 2000. Other suburban cities around the Bay that are majority Asian include No. 2 Milpitas (64.5% Asian), Daley City, Sunnyvale, Fremont , Santa Clara and Union City. Of them, only Daley City and Milpitas were majority Asian in 2000.

    Most of the other top California cities are clustered in the San Gabriel Valley east of Los Angeles, including No. 3 Rosemead (62% Asian), No. 4 Monterey Park (61.1%), Arcadia, Alhambra and Diamond Bar. Many, like once solidly middle class Arcadia, are being “mansionized” by new immigrants into what some suggest is an Asian version of Beverly Hills. The other hot spot is Orange County, long seen as more a place for right-wing politics and surfers, which now has several cities in the top 20 of our list of the cities of the most Asian-dominated cities, including Westminster, Irvine and Garden Grove.

    Shifts Beyond California

    California has long been is the natural place for Asian immigrants to land, with 4.8 million currently residing in the state, almost the population of Singapore. New York, with 1.4 million Asians, ranks  second while Texas, with 964,000, ranks third. But Asian populations are increasing quickly in the Sun Belt. Texas’ Asian population increased by 71.5% from 2000 through 2010, adding a net 402,277, second most in the country over that span behind California’s  1.1 million gain. Texas is home to the only city outside California and Hawaii in the top 20 of our list of the most heavily Asian U.S. cities: the Houston suburb of Sugar Land, where 37.1% of the 82,000 residents are Asian. The area, not known as an immigrant hub in the past, now boasts the second largest Hindu temple in the country. In Plano, a suburb of Dallas, the Asian population rose 123% between 2000 and 2012 to 50,160, the highest growth rate in the nation among cities over 50,000 in population. It’s now 18.5% Asian.

    A number of states in the Southeast posted fast growth from 2000-10. Florida’s Asian population increased 70.8% to 266,256, while Georgia’s rose 81.6% to 314,467.

    Positioning For The Asian Century

    One clear trend here is that Asian populations are growing in areas that are on the cutting edge of the economy — in tech centers like Silicon Valley, and near New York’s global service firms (across the river from Manhattan, Jersey City is now 25% Asian, and New Jersey’s Asian population expanded 51% in the first decade of the century to 480,270). Around the manufacturing and technology companies of the Detroit and Seattle areas, Asian communities are growing. Troy, Mich., the center of “automation alley,” has attracted a small but expanding Asian population, and in Washington, the Boeing-dominated town of Renton and Bellevue, near Microsoft, have taken on more of an Asian flavor in the past decade.The fact that many Asians are well-educated and ideally suited to these critical industries is likely to enhance this correlation over time, whether engineering cars or tech gear, or getting into the guts of the global transactional economy.

    Asian growth is slower in areas less integrated into the emerging global economy, notably in places like small town Florida, the rural south and parts of the still hard-hit Rust Belt. These are generally not the hot-spots for Asian investment today. What these communities may want to consider in the future is how to enhancetheir attractiveness to Asians and Asian investors, who likely will play an ever-expanding role in shaping the country’s economic future.

    No. 1: Cupertino, Calif.

    Overall Population, 2012: 59,701
    Percentage Asian: 65.1%
    Percentage Change In Asian Population Since 2000: +71.9%

    No. 2: Milpitas, Calif.

    Overall Population, 2012: 44,226
    Percentage Asian: 64.5%
    Percentage Change In Asian Population Since 2000: +34.9%

    No. 3: Rosemead, Calif.

    Overall Population, 2012: 33,686
    Percentage Asian: 62.0%
    Percentage Change In Asian Population Since 2000: +29.9%

    No. 4: Monterey Park, Calif.

    Overall Population, 2012: 37,192 
    Percentage Asian: 61.1%
    Percentage Change In Asian Population Since 2000: +1.4%

    No. 5: Arcadia, Calif.

    Overall Population, 2012: 34,158 
    Percentage Asian: 59.8%
    Percentage Change In Asian Population Since 2000: +42.3%

    No. 6: Daly City, Calif.

    Overall Population, 2012: 60,137
    Percentage Asian: 58.0%
    Percentage Change In Asian Population Since 2000: +15%

    No. 7: Honolulu, Hawaii

    Overall Population, 2012: 186,940
    Percentage Asian: 54.2%
    Percentage Change In Asian Population Since 2000: +10.1%

    No. 8: Diamond Bar, Calif.

    Overall Population, 2012: 29,883
    Percentage Asian: 53.2%
    Percentage Change In Asian Population Since 2000: +25.3%

    No. 9: Fremont, Calif.

    Overall Population, 2012: 115,948
    Percentage Asian: 52.4%
    Percentage Change In Asian Population Since 2000: +55.1%

    No. 10: Union City, Calif.

    Overall Population, 2012: 36,374
    Percentage Asian: 50.8%
    Percentage Change In Asian Population Since 2000: +23.5%

    This piece first appeared at Forbes.

    Joel Kotkin is executive editor of NewGeography.com and Roger Hobbs Distinguished Fellow in Urban Studies at Chapman University, and a member of the editorial board of the Orange County Register. He is also executive director of the Houston-based Center for Opportunity Urbanism. His newest book, The New Class Conflict is now available at Amazon and Telos Press. He is also author of The City: A Global History and The Next Hundred Million: America in 2050.  He lives in Los Angeles, CA.

    Wendell Cox is principal of Demographia, an international public policy and demographics firm. He is co-author of the “Demographia International Housing Affordability Survey” and author of “Demographia World Urban Areas” and “War on the Dream: How Anti-Sprawl Policy Threatens the Quality of Life.” He was appointed to three terms on the Los Angeles County Transportation Commission, where he served with the leading city and county leadership as the only non-elected member. He was appointed to the Amtrak Reform Council to fill the unexpired term of Governor Christine Todd Whitman and has served as a visiting professor at the Conservatoire National des Arts et Metiers, a national university in Paris.

    Photo “asian american” by flicker user centinel.

  • Behind the Driving Increase

    The Federal Highway Administration reported that driving increased 1.7 percent between 2013 and 2014 in the United States. This compares to virtually no increase over the period from 2004 to 2013. The 2014 increase will come as a disappointment to those who have perceived that the flat driving volumes of recent years signaled a shift in preferences away from driving. It had even been suggested that America had reached "peak car."

    Despite the congruity of such sentiments with urban planning orthodoxy, it’s somewhat risky to divine future economic trends from the perspective of a weak economy. It is rather like predicting future employment trends from realities of the late 1930s, when the world had still not climbed out of the Great Depression

    The problem for those who seek to replace the car is that the current form of cities, from Phoenix to Paris, requires cars to support the millions with middle-class standard of living. Of course, with a sufficient decline in the standard of living, cars could become less essential. After all, you don’t need a car to not go to work when you are unemployed.

    Nor is “peak oil” coming to rescue; we now live in something more like an oil glut. Even when prices were soaring, the amount of driving barely changed. People may have shifted to more efficient cars, they didn’t give up their cars, they just drove a little bit less.  

    The latest driving data may indicate that even the somewhat tepid recovery is speeding up in the United States. This combined with falling gasoline prices is likely to be why driving is increasing again.

    Employment Exceeds 2008 Level

    Employment is probably the most important factor in the recent recovery of car use

    According to data at the St. Louis Federal Reserve Bank "FRED" website, national employment peaked at 138.3 million in January 2008. By early 2010, employment had dropped to under 130 million. It took until April 2014 to restore the employment level that had been previously achieved more than six years earlier. This was the longest employment trough since before World War I, except for the period of 1929 to 1936, during the Great Depression.

    As more people return to employment and incomes rise, driving can be expected to increase. During 2014, the nation’s nonfarm employment rose to the highest level in history. As the year progressed and employment increased, so did driving (Figure 1).

    But there is still a long way to go for the economy. The civilian labor force participation rate continues depressed. If early 2008 levels of labor participation were restored, there would be at least 10 million additional jobs.

    Falling Gasoline Prices

    US Department of Energy data indicates that the average price per gallon of gasoline rose by more than one half between 2005 and 2011. Until the middle for 2014, gasoline prices fluctuated around this level until early summer of 2014. Then the gas price reductions began. By the end of 2014, gasoline prices had dropped to near 2005 levels, which they actually reached in early 2015. Much of the 2014 increase in driving was concentrated since the decline in gasoline prices started in the last half of the year (Figure 2).

    Driving and Transit

    Ridership and road travel data also shows that there has been little relationship between the annual changes in driving and transit use over the period of the gas price increases and the subsequent decrease. Advocates of greater transit funding have claimed for decades that transit can be effective in attracting drivers from their cars. This was transit’s time.

    However, the highly publicized transit ridership increases have been small in context and have shown virtually no relationship to the changes in automobile use in urban areas. This is illustrated in Figure 3. Driving volumes have risen and fallen, with little response in transit ridership. If there were a significant relationship between transit ridership and travel by car, the two lines on the chart would nearly follow one another. However, the lines show virtually no relationship. In relation to the actual changes in travel by car and light vehicle, the changes in transit are imperceivable. Transit ridership remains relatively small, at approximately two percent of all trips and five percent of work trips. An American Public Transportation Association (APTA) press release confirms the weak nexus between driving trends and transit for the most recent period. APTA notes that transit ridership late in the year increased despite the significant reduction in gasoline prices.

    Transit does not provide rapid mobility for most urban trips, which is why it has so little potential to attract people from cars. As higher prices force people to cut back on driving, they simply travel less, rather than getting on transit that cannot take them where they need to go in a reasonable time. That would be different if transit provided mobility competitive throughout the metropolitan area. Indeed, transit’s percentage of urban travel would be far above its current two percent. But to build out a system that reaches most jobs, of course, that would be financially prohibitive.

    Transit’s strength is downtown (the central business district, or CBD). The largest CBDs have employment densities are 100 times the urban average, and are well served by rapid, radial transit routes. In four of the nation’s largest CBDs — New York, Chicago, Boston and San Francisco — transit carries more than half of workers to their job, 77 percent in Manhattan alone. Americans use transit where it is competitive or superior to travel by car, which should dispel any notion that there is a national aversion to transit.

    But the city is much more than downtown. According to research by Lee and Gordon only eight percent of employment in the 48 largest metropolitan areas was in CBDs. This is despite the presence of impressive office towers that convey a sense of CBD dominance.

    Lee and Gordon also show that about 13 percent of jobs are in employment centers centers outside the CBDs, which are often called "edge cities." Because these centers do not have the radial networks of direct transit, even their high densities produce little in transit ridership.  My analysis of more than 80 post-World War II form suburban employment centers (mainly edge cities) indicated a transit work trip percentage of only 4.9 percent, which is approximately the national average for all areas. Transit’s share to the remaining nearly 80 percent of jobs dispersed throughout the metropolitan areas is just 4.6 percent.

    The basic problem is access. Outside of downtowns, few jobs can be conveniently reached by transit. This means transit takes about twice as long as driving alone and often is either not within walking distance of home or does not drop the passenger off within walking distance of work. This is illustrated by research at the University of Minnesota Accessibility Laboratory, which has shown that in 45 large metropolitan areas, only 10 percent of jobs can be reached by the average employee in 60 minutes by transit. By comparison, American Community Survey data indicates that nearly 65 percent of employees who drive alone in the same metropolitan areas actually reach work — and in half the time (30 minutes).

    Even low income workers, whose constrained budgets should make transit more attractive largely use cars to get to work.

    Driving and a Middle-Income Lifestyles

    I have referred before to the research that equates better economic performance with better mobility for people throughout the labor market (metropolitan area).

    Driving is not based on the shallow, arbitrary preference expressed in the threadbare cliché of a "love affair with the automobile." Cars are essential to realizing the aspirations of a majority of people, not only in the United States but in Europe and beyond.

    Wendell Cox is an international public policy consultant. He was appointed to three terms on the Los Angeles County Transportation Commission and chaired two American Public Transit Association (APTA) national committees (Policy & Planning and Governing Boards). Full biography is here.

  • Minneapolis-St. Paul: Capital of the New North?

    There’s been a lot of discussion in Minneapolis-St. Paul about whether they should try to dissociate themselves from the Midwest by rebranding themselves as the Capital of the North.

    This immediately raises three questions:

    1. Is “The North” really a distinct region?
    2. Are the Twin Cities the capital of it?
    3. Is branding the Twin Cities as “the Capital of the North” a good idea and likely to succeed?

    What Is “The North”?

    Is the North a distinct region from the Midwest? While popular maps of the nine (or eleven) nations of North American don’t include a cohesive North region, there are some reasons that suggest so. The areas of northern Wisconsin, the Upper Peninsula of Michigan, the Dakotas, etc. were more sparsely populated than the rest of the Midwest. They also had a different economic structure.

    This map highlights the area whose economy was driven by heavy industry and manufacturing.  Most of the North was outside of this zone. The economy of that area was more dependent on natural resources (mining, such as copper in Michigan’s Upper Peninsula), farming, and grain processing.  Fracking for oil in North Dakota is a continuation of this resource based economic heritage.

    The area is also demographically distinct. It was more heavily settled from northern Europe, notably Scandinavia, versus the Eastern European influence felt elsewhere. The Great Migration of blacks to the industrial north also had much less of an effect on this area, which was historically very white, and still is less diverse than the rest of the country.

    Climatically, the North, as the name implies, is the coldest region of the continental United States.

    So there are some attributes of this region that do set it apart from the rest of the Midwest.

    Are the Twin Cities that Capital of the North?

    Where the capital idea doesn’t hold up is in looking at contemporary migration.  The map below shades in blue any county that had people move to or from Minneapolis’ Hennepin County between 2001 and 2011, using IRS tax return data:

    Outside of Minnesota itself, the only place in the North of which the Twin Cities are the capital from a migration perspective is part of Wisconsin.

    Are there other areas where the Twin Cities look more like a capital? One of them would be sports fandom.  Here’s a map of football team spheres of influence based on the number of Facebook “likes.”

    Here the Minnesota Vikings get no love in Wisconsin, which is owned by the Packers.  But the Vikings do have strong followings in much of Iowa and the Dakotas, which fits well to a concept of the North.

    The area encompassed by the North is for the most part sparsely populated, with the Twin Cities being the only major urban area (more than a million people) for quite a distance.  The closest other city of that size is Milwaukee, about 300 miles away.  Minneapolis-St. Paul is about as far away from Chicago as Kansas City.  This by itself creates a sort of capital effect, as there is a pretty large swath of territory which logically looks to the Twin Cities for big city amenities and attributes. Pro sports would definitely fall into this category. So perhaps there is some level of “capital” attribute here.

    Should the Twin Cities Brand Themselves As the Capital of the North?

    If there is conceivably a North and the Twin Cities can potentially claim be or push to develop itself as the capital of this region, is that the best way to brand itself?

    There are two basic approaches cities are pursuing today. One is the regional capital approach of a Barcelona. (It would perhaps like to see itself as a national capital).  The other is the global city approach of Chicago in which the city seeks to brand itself as a stand alone entity directly in the marketplace while actively divorcing itself from the region.

    The global city model seems more popular at present. In Chicago’s case it’s easy to understand why; the Midwestern Rust Belt has struggled so why hitch yourself to that wagon?  This has had some good success and Chicago’s brand image is strong. The challenge for Chicago is that its wagon is economically hitched to the Midwest whether it wants it to be or not, at least to some extent. Chicago is the business services, tourism, etc. capital of the Midwest. The struggles of that region explain a chunk of that city’s now well-publicized travails.  Chicago’s fiscal weakness, inequality, etc. problems would likely be less if it were in the middle of a booming region.

    So if the Twin Cities are functionally a capital, this regional relationship will assert itself organically, however it seeks to brand itself.

    Where the branding idea falls flat is in two areas.  First, unlike Catalonia, the North isn’t an area with any sort of existing public resonance. Thus the Twin Cities would have to create a brand not just for itself – where they already feel they have weaker marketplace awareness – but also for the North itself, which is presently non-existent. This just makes things harder.

    The second is the cultural disconnect between the Twin Cities and the rest of the North. Yes, one can look to Madison, Wisconsin (which probably more connected to Chicago in any case) as sympatico. But the rest of the North seems quite different. Don’t forget, there are a lot of Republican voters in Minnesota. The state had a very conservative Republican governor in Tim Pawlenty until recently.  Can the Twin Cities embrace them?  Natural resources has always played a key role in the North – 3M is Minnesota Mining and Manufacturing, don’t forget. Can the Twin Cities embrace the North Dakota fracking boom as its own?

    Color me skeptical.  Given our politically polarized environment, the time does not seem ripe for a city to actively embrace its hinterland, and the politics and economic activity it contains. That’s not to say it shouldn’t.  America needs more bridge building than ever, not just politically, but between large urban and small urban and rural areas. But I don’t think it likely a region that prides itself on progressivism (e.g., environmentalism) and is already concerned about its standing in elite circles is ready to take that step.

    Aaron M. Renn is a senior fellow at the Manhattan Institute and a Contributing Editor at City Journal. He writes at The Urbanophile.

    Minneapolis on Mississippi River” by JdkoenigOwn work. Licensed under Public Domain via Wikimedia Commons.

  • As Nonwhites Grow Their Majority in Southern California, How Can they Find More Success?

    California teachers, politicians and media types like to extoll the benefits of ethnic diversity. Certainly, the state’s racial makeup has changed markedly since 1970, with the white non-Hispanic population now a minority. Some, like state Assemblyman Luis Alejo, D-Salinas, and some education activists now insist that multicultural studies be mandated for the public school curriculum. This is in addition to materials that, as most California parents with kids can tell you, already go out of their way to foster appreciation of different cultures and strongly focus on such issues as slavery, racism and discrimination.

    Yet, if we look at how minorities are faring in the state, and particularly in the Southland, we need a greater sense of reality about how this new demography is working out. Students in Salinas might soon learn more about ethnic history, but it’s not likely to help rescue their schools, which are rated poorly – even in comparison with the state’s overall mediocre standards.

    As California continues to become less white – largely because of both foreign immigration and outmigration of native-born – we have to understand that diversity alone does not assure a prosperous society; that takes greater attention to issues like education and broad-based economic growth than to the politically correct approach of ethnic pandering or curricula manipulations.

    Read the entire piece at The Orange County Register.

    Joel Kotkin is executive editor of NewGeography.com and Roger Hobbs Distinguished Fellow in Urban Studies at Chapman University, and a member of the editorial board of the Orange County Register. He is also executive director of the Houston-based Center for Opportunity Urbanism. His newest book, The New Class Conflict is now available at Amazon and Telos Press. He is also author of The City: A Global History and The Next Hundred Million: America in 2050.  He lives in Los Angeles, CA.

  • Two Sides of the Same Coin: Decline and Gentrification

    Recently I attended a presentation at Mission Dolores Church sponsored by the San Francisco Chronicle called “A Changing Mission”. The discussion was based on a newspaper article and associated short film about the neighborhood. It’s well worth a quick look here.

    Screen Shot 2015-02-25 at 5.35.26 PM Screen Shot 2015-02-25 at 5.34.23 PM   unnamed-3


    Lancaster, Palmdale 039 (800x600) Screen Shot 2014-11-29 at 2.58.26 AM Screen Shot 2014-11-29 at 2.58.59 AM Screen Shot 2015-02-25 at 6.24.53 PM

    A week later I was in Lancaster, California to attend a similar meeting sponsored by the local city planning authority and the Strong Towns organization here. Lancaster is also changing, but in a different way than the Mission.

    If I were to boil down the two situations into crude cartoon blurbs they might go something like this. “The Mission is being overrun with rich white people who are screwing up the place.” And “Lancaster is being overrun with poor brown people who are screwing up the place.” Like I said… crude. Obviously the reality is far more nuanced and complicated than that. But that’s pretty much the gist of things. Gentrification and economic decline are two sides of the same coin and a lot of folks don’t like any of it. The irony is both sides seem to want the same things even if they don’t know it.

    Screen Shot 2015-02-25 at 5.51.18 PM Screen Shot 2015-02-25 at 8.00.33 PM Screen Shot 2015-02-25 at 5.49.56 PM Screen Shot 2015-02-25 at 5.49.29 PM Screen Shot 2015-02-25 at 4.54.25 PM

    There’s a scene in Alfred Hitchcock’s classic 1958 film “Vertigo” where James Stewart mentions an appointment he has with a shady character in the Mission. Kim Novak looks concerned and comments, “That’s Skid Row”. That always gets a laugh from San Franciscans in the audience at the revival theaters. Many people who don’t know San Francisco well assume it’s all tourist spots, internet millionaires, and gay bars. If you walk around the Mission you’ll quickly discover a neighborhood full of families with young children, elderly pensioners, and lots of small mom and pop shops. Until the 1950’s the Mission was a working class neighborhood dominated by German, Irish, Italian, and Greek stock. After World War II white flight to the suburbs left behind a great deal of inexpensive real estate that was eventually filled by Central American and Asian immigrants, as well as various bohemian types. The neighborhood and its low wage workers were quietly ignored by city authorities as well as the more prosperous residents in more fashionable neighborhoods. This was a part of the city no one ever saw on a postcard.

    Screen Shot 2015-02-25 at 5.52.02 PM Screen Shot 2015-02-20 at 12.51.35 AM Screen Shot 2015-02-26 at 1.14.57 AM

    The Mission deteriorated and served as a repository for the low rent light industrial activities that every city needs but are generally kept out of pricier neighborhoods: auto body shops, carpentry shops, iron and steel fabricators, glass cutting shops, upholsters, discount fabric warehouses, plumbing and electrical supply companies… But it was also the perfect place for nightclubs and after hours establishments since there were no hostile neighbors to complain. The Mission was noisy and ugly, but it was that unseemly quality along with the cheap rent that made it possible for a lot of people to scrape by while pursuing other activities that didn’t necessarily pay well. It’s no coincidence the Burning Man and other such movements emerged from the Mission rather than exclusive Pacific Heights or Sea Cliff. You might have to tolerate the occasional drug dealer or prostitute, but there was no HOA regulating your every move. The Mission was all about slack and that’s what made it interesting and vibrant, if a bit rough around the edges.

    unnamed-3 Google Bus 002 Screen Shot 2015-02-25 at 9.30.23 PM  Screen Shot 2014-11-03 at 10.52.50 AM Screen Shot 2014-11-05 at 11.57.26 PM

    As the tech economy out in the distant suburbs heated up over the last twenty years more and more of the smart young IT professionals chose not to live in the dull suburban cul-de-sacs of Silicon Valley. They were looking for a grittier more dynamic environment and found it in the Mission. Tech workers endured a lengthy reverse commute in order to achieve a higher quality of life in their off hours at home in the city. In order to attract talent tech companies in the suburbs created the private so-called “Google Bus” system to shuttle workers from the Mission to corporate campuses an hour and a half outside the city. Tech workers had unlimited budgets compared to the existing Guatemalans, Vietnamese, and artists. Rents and property values rose considerably year after year. Today a one bedroom apartment in the Mission typically rents for $3,800 a month – if you can find a vacancy. If you want to buy that same place it will set you back well north of $850,000 and there is precious little on the market to satisfy the endless demand. If you want a single family home with a little patch of back yard you can buy the ruined shell of an old Victorian for a couple of million dollars and then spend at least as much to renovate it. Evictions and property conversions have skyrocketed. Bodegas and pho noodle shops are being replaced by boutiques and fine dining establishments. Hence all the fuss about gentrification driving out the working class. For the city’s coffers it’s a nice problem to have. The city is flush and is on a prolonged capital improvement spree that is transforming the local infrastructure and public spaces from parks, to school buildings, to libraries, to fire and police stations. Everything is getting a massive face lift and city workers have all been given substantial raises. But for the displaced residents it often means leaving the city altogether.

    Screen Shot 2015-02-25 at 8.25.25 PM Screen Shot 2015-02-25 at 8.27.11 PM Screen Shot 2015-02-25 at 6.25.16 PM Screen Shot 2015-02-25 at 8.23.43 PM Screen Shot 2015-02-25 at 8.23.11 PM

    Now let’s get back to Lancaster which is in the Antelope Valley of far eastern Los Angeles County in southern California. Lancaster was a small agricultural community until in was discovered by the aerospace industry in the 1950’s. The high desert location not too far from Los Angeles made it the perfect place to develop and test rockets, fighter jets, and ultimately the Space Shuttle and Stealth Bomber. Along the way it attracted people from the city who were looking for a more relaxed environment at a lower price point. The area sprouted endless white middle class subdivisions and accompanying shopping centers. For most residents work and culture remained “Down Below” in Los Angeles proper. That became increasingly true as the aerospace industry ramped down and was phased out. What remained of the local economy was based primarily in building and servicing more suburban development.

    Palmdale, Lancaster 056 (800x600)unnamed-5 Lancaster, Palmdale B roll 038 (800x600) unnamed-8 unnamed-6 IMG_0005

    The entire Antelope Valley, including Lancaster, was hit especially hard by the crash of 2008. Homes lost half their value overnight. Foreclosure and unemployment rates shot way up just as tax revenues plummeted and city services were cut. What was once a solidly middle class community became economically insecure and especially sensitive to further downward mobility – real or perceived. Both private developers and the City of Lancaster worked hard to deliver a better more up-to-date “product” incorporating the latest bells and whistles to jump start the resumption of growth after the crash. New homes boasted renewable energy packages and gray water recycling systems. The city began installing bicycle lanes. LEED certified office parks were promoted. And Lancaster’s economic development plan included inducements to battery and electric bus manufacturers for the growing market for clean energy and transportation. So far these measures have been too little too late. The solar and wind farms are great for generating clean power, but they don’t employ very many locals. New homes aren’t selling well and profit margins are down to a couple of thousand dollars per home which just isn’t enough to keep developers interested in building any more. The market for far flung exurban living has simply dried up. The bike paths that are all the rage in reviving city centers are effectively useless out in the distant sprawl. It isn’t the paths that are attracting prosperous new residents – it’s the urbanism the paths encounter along the way. Putting green lipstick on a sick pig hasn’t helped.

    Lancaster, Palmdale 513 (800x600) Screen Shot 2014-11-29 at 1.24.25 AM Lancaster, Palmdale 526 (800x600) Lancaster, Palmdale 533 (800x600) Screen Shot 2014-11-29 at 2.30.56 AM 

    While Lancaster has concentrated most of its efforts on inducing new construction it has ignored its older building stock. Each new home and commercial complex built out on the edge of town only cheapens the older existing suburban fabric. There’s no economic justification for buying, maintaining, or improving a fifty year old home or thirty year old strip mall when brand new homes and shops sit unsold and half vacant. Unfortunately for old timers in Lancaster all that cheap property has proven very appealing to many of the lower income residents from down below in Los Angeles who are rapidly being displaced. Like the Mission in San Francisco many previously impoverished neighborhoods in central Los Angeles are experiencing serious gentrification and all those poor folks who are getting squeezed out have to move and live somewhere else. The last several years have been a perfect storm delivering a massive wave of new arrivals to Lancaster who are not only poorer than the existing population, but overwhelmingly black and brown. This has set off alarm bells with the already stressed locals with vocal demands for government policies to prevent “Them” from moving in. (I’ll refrain from commenting on the whole race thing here. It is what it is.) In the end these are powerful market forces that the city has very little control over. For those people who are financially able their first choice is to sell and move. For those who are trapped in a home that is worth less than they owe the choice is to tough it out and hope for a market rebound or to walk away and take a big loss.

    So there you have it. Gentrification in one community and economic decline in another. These are two sides of the same coin. In the end I suspect the freakish bubble in places like San Francisco will eventually cool while the decline in outer suburbs like Lancaster will level off and stabilize. In the meantime it’s all pretty bumpy for the folks caught in the middle.

    John Sanphillippo lives in San Francisco and blogs about urbanism, adaptation, and resilience at granolashotgun.com. He’s a member of the Congress for New Urbanism, films videos for faircompanies.com, and is a regular contributor to Strongtowns.org. He earns his living by buying, renovating, and renting undervalued properties in places that have good long term prospects. He is a graduate of Rutgers University.

  • Life is Good in St. Louis

    The headline line in the Sunday St. Louis Post-Dispatch asked "Are St. Louis Area’s Home Prices too Low?” This is could not possibly have appeared describing any major metropolitan area of Australia, New Zealand, or the United Kingdom. Nor will newspapers in Vancouver, Toronto, Calgary, Portland, Seattle, Boston, New York or in any of the overpriced markets of California decry low prices any time soon.

    The March 8, 2015 article by Jim Gallagher rightly noted that house prices tended to be higher in cities outside St. Louis, there are "restrictions on building, either geographical or political." Gallagher quotes William Rogers, an economist at the University of Missouri- St. Louis says that "Developers have really serious problems putting up houses in Los Angeles or San Francisco."

    The 11th Annual Demographia International Housing Affordability Survey, produced with Hugh Pavletich of Performance Urban Planning in Christchurch New Zealand,  confirms the low house prices in St. Louis. In 2014, the median multiple, a price to income ratio calculated by dividing the median house price by the median household income, was 2.7 in the St. Louis metropolitan area. St. Louis is tied for fifth most affordable middle-income housing market among the 86 major metropolitan area markets (over 1,000,000 population) in nine nations.

    No one should imagine that the low prices of St. Louis are the result of a depressed economy. Yes, St. Louis is on the periphery of the rustbelt. And yes, the city (core municipality) of St. Louis has lost a larger share of its population than any other large municipality in modern history. Since 1950, the city of St. Louis – a mere 11 percent of the metropolitan area – has lost 63.2 percent of its population, slightly more than the city of Detroit, at 61.4 percent.

    Yet, somehow the city of St. Louis has avoided the financial train wreck of Detroit, nor do planners suggest the next industry should be urban agriculture. At a minimum, the difference suggests that St. Louis, even as it has lost population, has been much better led than the Motor City. Further, the much larger St. Louis metropolitan area (which is the area described in the Gallagher article and rated in the Demographia Survey) is anything but depressed.

    Gallagher indicates that "lots of people here could pay more for houses, but they don’t have to." That is correct. However, households in St. Louis pay approximately the same percentage of their income to buy houses today that most people have since World War II. That is also the same amount that Angelos and San Franciscans paid until the coming of excessive regulation (see Fischel) in the 1970s; since then  house prices there have increased between 2.5 and 3 times.

    On the surface, St. Louis appears about average in income. St. Louis ranks 25th, slightly above the middle of the 52 major metropolitan areas in per capita income. But that’s just the beginning of the story. As anyone looking for employment in other metropolitan areas quickly finds out, housing cost differences can be huge and make up most, if not all the difference in cost of living. When the cost of living is considered, real personal incomes in St. Louis rank ninth among the 52 major metropolitan areas. It may be surprising, but St. Louis ranks above number 10 Seattle. While nominal incomes in Seattle are nearly 20% above that of St. Louis, when the cost of living is considered, St. Louisans had nearly 1% more income than Seattleites in 2012 (Figure).

    The metropolitan areas ranked above St. Louis are the usual suspects of nominal affluence. No one would be surprised that San Francisco has the highest incomes, both nominal and adjusted for cost-of-living. San Francisco’s nearly 50% advantage in nominal personal income over St. Louis drops to less than 10% when the cost of living is considered. Given the graduated nature of the federal income tax, the difference could be less. The other most affluent cities are Boston, San Jose, Hartford, and Washington. The cost of living conversion factor (regional price parity) is more than 25% in San Francisco, San Jose and Washington and 18% in Boston. Only in Hartford, among the leaders, has anything similar to a normal cost of living (6% above the national average)

    There are other surprises in the top 10. Both Pittsburgh and Cleveland have higher cost of living adjusted incomes than St. Louis. Less surprising is that Houston is in the top 10, given its robust economy, at least before oil prices dropped.

    There are some interesting omissions from the top 10. Global city New York ranks 17th, just behind "Music City" Nashville. Portland, America’s incubator of house price increasing planning policies, finds itself ranked 39th. Even in Jackson, Mississippi, not large enough to make the over 1,000,000 list, has higher real per capita income than Portland.. Perhaps the biggest surprise is Los Angeles. Like New York, often considered a Global City, the city of my birth is anything but Global City real per capita incomes. Even depressed Detroit (though the suburbs of Detroit are anything but depressed) is ranked 10 positions above Los Angeles and has real per capita income 10% higher.

    All of this should be regarded as good news for St. Louis. Once, to be sure, St. Louis was far more important. As late as 1910, St. Louis was the fourth largest municipality in the United States, trailing only New York, Chicago and Philadelphia. While St. Louis is not depressed, it has grown much more slowly than most metropolitan areas. But the decline has been more in the urban core city than the surrounding areas. Over the past the past 60 years the city of St. Louis lost more than 500,000 residents, while between 1950 and 2010, while the suburbs added 1,400,000.

    Gallagher indicates that construction prices are reasonable in St. Louis. In fact they are not much less than in the stratospheric housing markets of San Francisco and Los Angeles. For example, a 2,500 square foot starter house in the East Bay of San Francisco would cost less than 10 percent more to build than in St. Louis, according to data at building-cost.net.The difference between housing costs in St. Louis and high-cost market is in the land, which is where the cost of excess regulation shows up

    As a metropolitan area, St. Louis has competitive difficulties (see: Shrinking City, Flourishing Region: St. Louis Region). The weather is not as nice as in California. The winters are tougher than in Texas or Florida. But the one great advantage St. Louis possesses is reasonable middle income housing affordability. This is an important competitive advantage that led to only modest domestic migration losses during the 2000, when high priced Los Angeles and New York were bleeding more than 1.3 million net domestic out migrants.

    Also, with the money they don’t have to pay for over-priced housing, St. Louisans can buy more "stuff" or take longer vacations. Nor do St. Louisans get less for their less money. The median sized detached house is the same in St. Louis (1,800 square feet) as in  San Francisco and slightly larger than in Los Angeles (1,744 square feet), according to the American Housing Survey in 2012, yet St. Louisans pay much less.

    The bottom line is that for all of the competitive difficulties, life is good in St. Louis. And, one big reason is housing prices middle-income households can afford.

    Wendell Cox is principal of Demographia, an international public policy and demographics firm. He is co-author of the “Demographia International Housing Affordability Survey” and author of “Demographia World Urban Areas” and “War on the Dream: How Anti-Sprawl Policy Threatens the Quality of Life.” He was appointed to three terms on the Los Angeles County Transportation Commission, where he served with the leading city and county leadership as the only non-elected member. He was appointed to the Amtrak Reform Council to fill the unexpired term of Governor Christine Todd Whitman and has served as a visiting professor at the Conservatoire National des Arts et Metiers, a national university in Paris.

    Photo: St. Louis Skyline (by author)

  • The New, Improved? Rust Belt

    There is no longer a Rust Belt. It melted into air. The decline of manufacturing, the vacancy of the immense, industrial structures that once defined the productive capacities and vibrant lives of so many pockmarked towns, the dwindling of social capital—all the prognosticators writing the obituaries for these dead geographies were right.

    How long were rust belt cities going to be able to, as author Robert Putnam would phrase it, “bowl alone?” It turns out not very long.

    Rust Belt cities don’t exist because the narrative surrounding them over the past few years has slowly changed. No longer are they identified as places of decay; now the story is that they’re places of opportunity and renewal. This conviction is emerging against the backdrop of a general sort of reintroduction of the American city as a great, good place; a crucible of talent, energy, youth and creativity. (As if that hasn’t always been the case.)

    Now, for every Detroit horror story, there’s a shiny Shinola. Buffalo is a nascent hipster haven.

    Levon Helm has risen from the dead and is singing, “Look out, Cleveland, some craft brew is comin’ through…”

    With its well-defined physical landscapes and deep cultural histories, the Rust Belt aesthetic has long been subject to the same forces that have turned places like Williamsburg, Brooklyn and Chicago’s Wicker Park into moneyed enclaves of those seeking a repurposed past for modern means. As the global city shatters into a million pieces, Rust Belt cities are poised to piggyback on their own organic growth, becoming ever more attractive with their lower barriers to achieve a sense of urban authenticity.

    Yet, as pockets of Rust Belt cities are successfully redeveloped, is there reason for concern that they may be losing some of what sets them apart?

    In Chicago, where the Rust Belt exists under the glittering shadow of its Global City sheen, the steady march of hipsterdom through Wicker Park and Logan Square is nearly complete. On the Far South Side of the city, on the fallow 700-acre grounds of the former US Steel South Works mill, a massive, master-planned mixed-use development is envisioned and (very) slowly taking shape.

    In the Corktown section of Detroit, the long-abandoned and derelict Michigan Central Station has morphed into an asset for a bevy of bars, shops and nightlife stops, which have deservedly garnered travel nods from Martha Stewart. Working through the Bedrock Financial-led-revitalizing downtown and past the hip enclave of Midtown, a new steward is currently cleaning up the infamous Packard Motor Plant and entertaining plans of perhaps an “autonomous community.”

    In Pittsburgh, a city always a little ahead into the future, Lawrenceville has been dubbed one of the “top 26 most hipster neighborhoods in the world” by Business Insider magazine, while in the South Side neighborhood, the old J&L Steel mill on the banks of the Monongahela River is currently home to SouthSide Works, a “shop/dine/play/live” mixed-use lifestyle center of offices, residences, movie theaters and outlets of H&M, American Eagle and The Cheesecake Factory.

    These movements through the cityscape may seem disconnected, but they represent a waning of the cultural affect that is specific to a sense of place and defines it. Whether it is a sort of hipster-variation-on-a-theme or a top-down, master planned repurposing of formerly industrial sites, there is an emerging urban typology that is seen and felt in cities everywhere. In this way, these commoditized developments echo their suburban forbearers in standardizing a formula for successful sameness.

    When the French anthropologist Marc Auge coined the term ‘non–place’ to describe the interstitial spaces in which so much of modern life unfolds, he focused in on the transitory nodes of transit and commerce such as airports, highways, and supermarkets to describe a condition wherein the individual “becomes no more than what he does or experiences in the role of passenger, customer, or driver”— namely, a consumer. Many critical urban theorists have adopted Auge’s theory to describe the monotony, placelessness, and anywhere-ness of sprawling suburbs.

    One could argue, though, that as cities proper increasingly mirror one another in their (re)development, Auge’s theory now threatens to apply itself to the fabric of cities themselves. It begs the question of whether there are perhaps other ways to engage and activate ‘non-place’ into meaningful, active space.

    Managing needed investment while maintaining distinctiveness — which is, of course, what makes any city worth its while to begin with — is a delicate dance. Like everywhere else, the Rust Belt is inspiration for a form of American magic realism, wrestles with this.

    Cities change. To assume the city hasn’t always been a speculative spectacle is ludicrous, as silly as it is to perpetuate dead geographies onto the living. But the refashioning of Rust Belt cities’ physical and cultural landscapes should at least give us pause to wonder if we’re losing realism and magic in manufacturing a sense of place.

    Ben Schulman is the Communications Director for the American Institute of Architects Chicago (AIA Chicago) and the co-creator of the Contraphonic Sound Series, a project that documents cities through sound.Follow @skyscrapinknees (https://twitter.com/skyscrapinknees)

    Flickr photo by Russ: Detroit Bike City Shinola

  • California’s Social Priorities, A New Report

    This is the introduction to a new report, California’s Social Priorties, from Chapman University’s Center for Demographics and Policy. The report is authored by David Friedman and Jennifer Hernandez. Read the full report (pdf).

    California has achieved a great deal since 1970, including much cleaner air, water and more effective resource stewardship notwithstanding a population increase from approximately 19.9 million in 1970 to over 38 million by 2014. 2 Nevertheless, the state continues to face significant, and in many cases increasingly adverse educational and social equity challenges. As summarized in more detail below:

    • California’s grade 9-12 dropout rates remain high and, contrary to national trends, the state’s population of adults with less than a high school education significantly increased from 1970 and currently accounts for nearly 20% of the state’s adults, second highest in the nation. The number of Americans with less than a high school education fell by over 23 million during 1970-2012, and rose in only four states: California, Nevada, Arizona and New Mexico. California’s net increase—over 515,000 adults—was greater than the increase in the other three states combined (409,000).
    • The state’s population of high school and community college graduates grew much slower than in the rest of the country, and the population of 4-year or more college educated adults barely kept pace with average national growth rates. In contrast, Texas, also a large, high-immigration state, has added high school and community college-level educated adults more rapidly than the national average since 1970, while the number of adults with less than a high school education declined.
    • Inequality has dramatically increased since 1970, when California’s rate of inequality was 25th in the nation. By 2000, the state had the second worst in – come inequality in the country, trailing only New York. The state’s inequality remained fourth worst in the nation (behind only New York, Connecticut and Louisiana) in 2013.
    • Income growth for all but the richest 20% of all California households was below the national average from the mid-1970s to the mid-2000s. Incomes for the richest 20% and 5% of all house – holds rose much faster than in the rest of the country.
    • Between 1970 and 2013, California’s official poverty rate (which ignores cost of living differences in the U.S.) rose from less than 10% to over 16% of the population. In 2012, the U.S. Census Bureau developed a supplemental poverty measure that accounted for higher living costs in coastal locations such as California. The supplemental measure indicated that, during 2010-2012, nearly 9 million Californians, or about 24% of the state’s population, was impoverished, by far the largest poverty rate in the country. Although California accounts for 12% of the U.S. population, the state has over 18% of the nation’s poor.
    • California’s capacity to generate new jobs has severely diminished over time. During 1970-1990, the state generated nearly 5.6 million new jobs and 14.5% of the total employment growth in the country although it accounted for less than 10% of the nation’s population in 1970. From 1991-2013, the state produced 2.6 million new jobs, just 9.7% of the net U.S. employment growth, and well below the state’s 12% share of the nation’s population in 1990. Although the state’s population rose by roughly similar amounts in 1970-1990 (9.8 million) and 1991-2013 (8.6 million), California was unable to generate even half the number of jobs during 1991- 2013 than were created in 1970-1990.
    • Annual nonfarm employment growth averaged 3% in 1970-1990, well above the national average, but just 0.8% in 1991-2013, well below the national average. In contrast Texas, with 70% of California’s population, produced over 4 million new jobs during 1991-2013, and Florida, with half of California’s population, generated nearly the same number of new jobs as California (2.2 million). During 1991-2013, California more closely resembled historically slow growing northeastern and Midwest states than faster-growing regions of the U.S., especially in the southeast.

    These data show that California needs to address significant, and growing social priorities, including significant improvement in adult educational rates at the high school and post-secondary level, increasing employment opportunities at a rate sufficient to serve past and forecast population growth, and reducing the state’s inequality and very high poverty rates.

    California continues to lead the country, and by some measures even the world, in environmental quality and climate change initiatives. But public policy must evolve to leverage these environmental achievements into corresponding improvements in educational attainment and middle class job creation. With more than 18% of the nation’s poor, and less than 1%3 of global greenhouse gas emissions, California should also embrace the challenge of leading the world in the creation of middle class manufacturing jobs for the rapidly evolving clean and green technology that California’s laws mandate, California’s educational and technology sectors invent, and California’s venture capital investors bring to the global market.

    Instead, California’s policies, and regulatory and legal costs and uncertainties, tend to divert thousands of middle class jobs even in emerging green industries (including those not requiring high school diplomas) to other locations, including the Tesla battery manufacturing facility, which moved to Nevada. The loss of projects that help achieve important environmental objectives, create high quality jobs, and comply with California’s strict environmental and public health protection mandates, continues to occur in part because well-funded special interest groups ranging from business competitors to labor unions file "environmental" lawsuits as leverage for achieving narrow political or pecuniary objectives rather than to protect the environment and public health. This study suggests that the state must work much harder to ensure that California’s landmark environmental laws are not misused or pursued in a manner that adversely affects other, equally important policy priorities for California’s large undereducated and underemployed population.

    Read the full report (pdf).