Blog

  • Postcards From the Zombie Apocalypse

    I’m regularly accused of being a doomer whenever I point out the obvious – that many aspects of how we’ve organized our affairs over the last several decades aren’t meant to last. So they won’t. The end of Jiffy Lube and Lean Cuisine isn’t The End. Civilization will carry on without them, I assure you. But when it’s suggested that our current set of arrangements won’t last forever people immediately imagine Mad Max, as if no other alternative exists. Things are going to change. They always have and they always will. The future will just be different. That’s absolutely not the same as saying the world is coming to an end. Clear eyed individuals who are paying attention can start to get a feel for who the new winners and losers are likely to be and place themselves in the best possible situation ahead of the curve. That’s a pragmatist’s view – not a doomer’s.

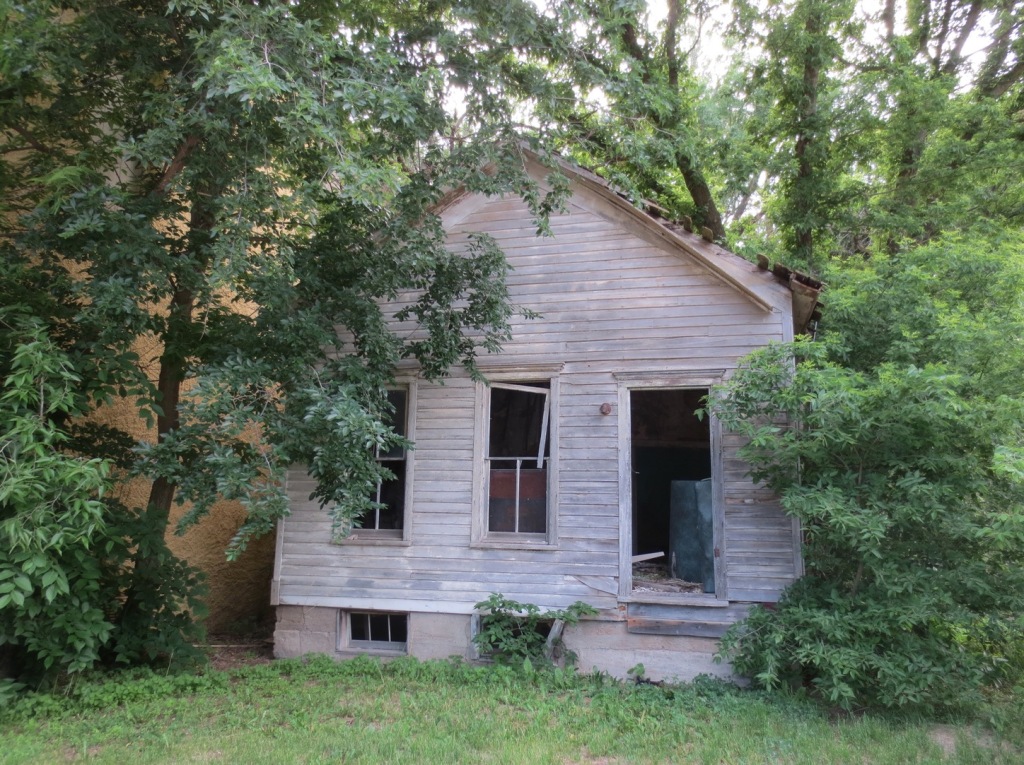
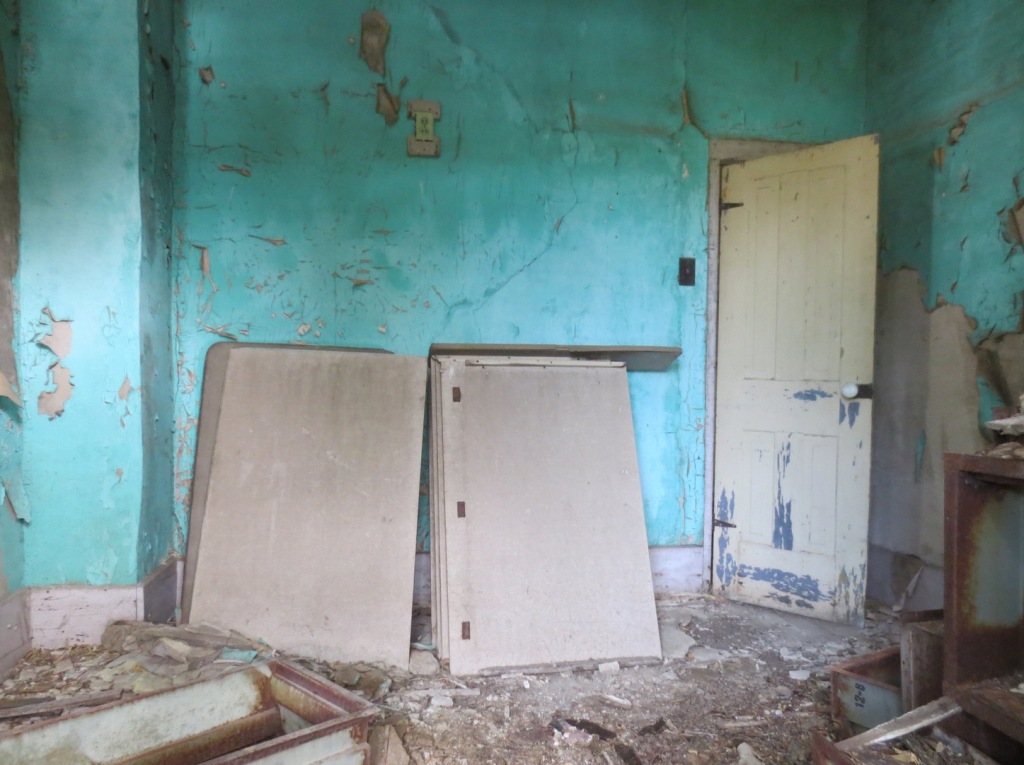
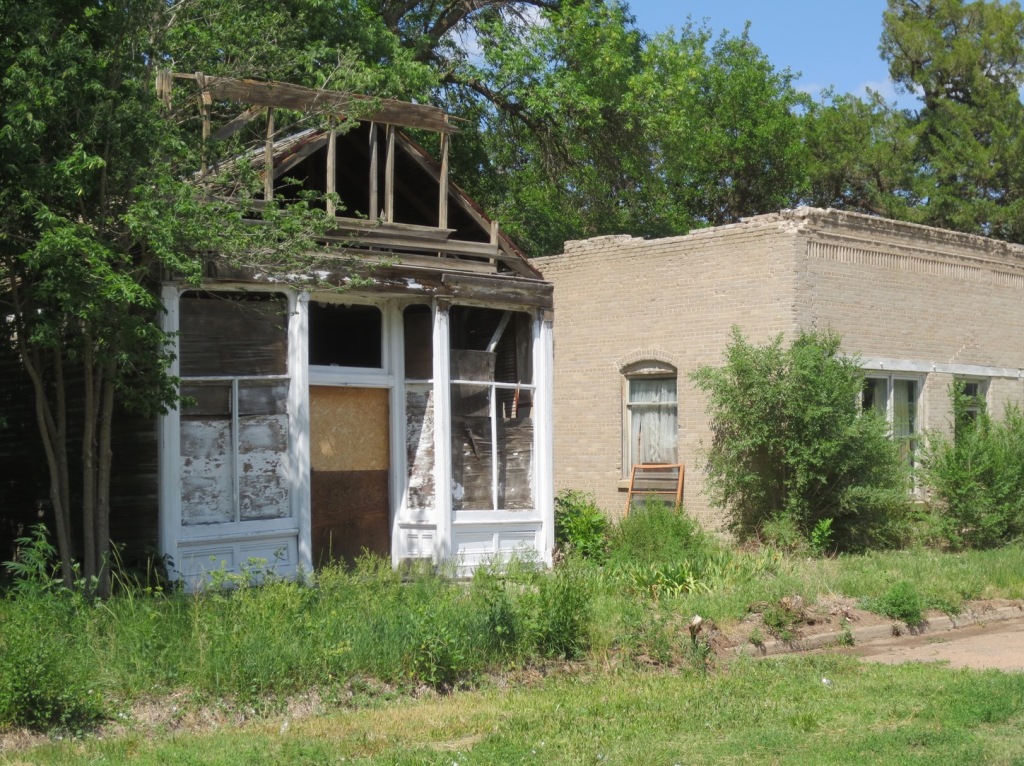
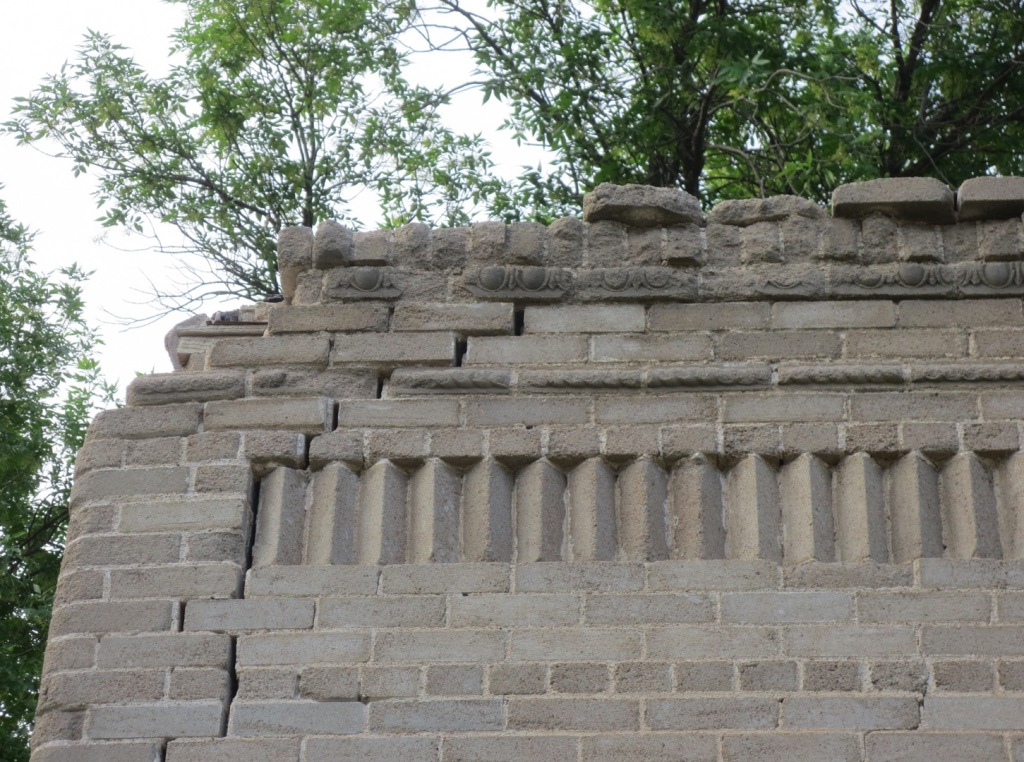
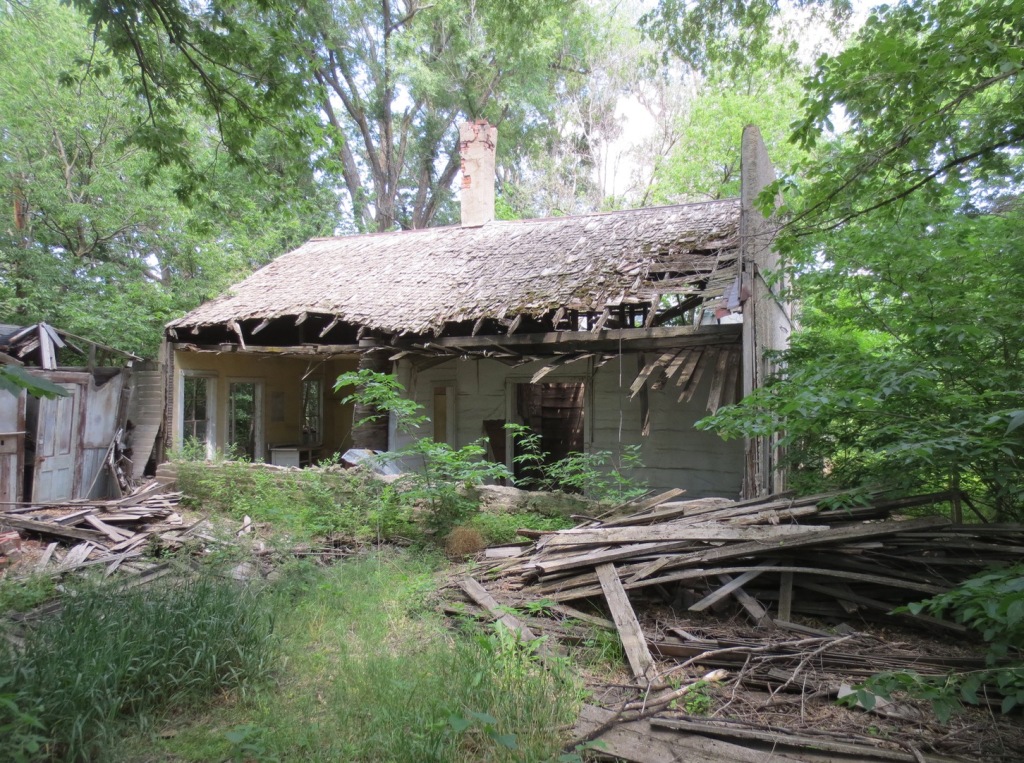
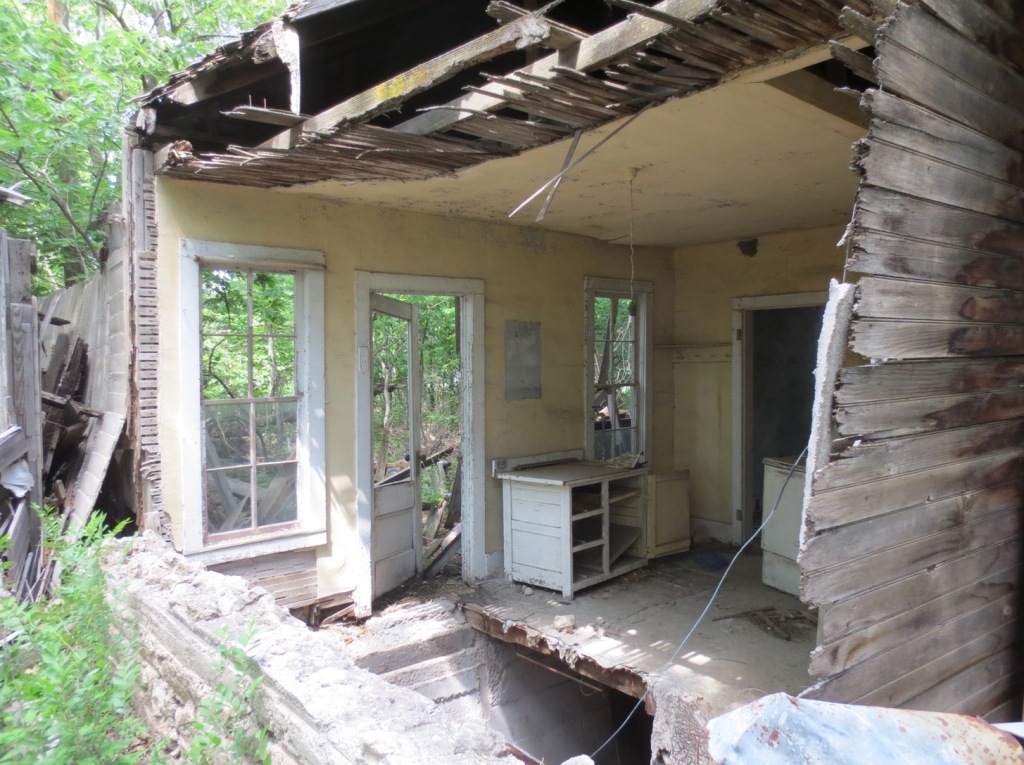
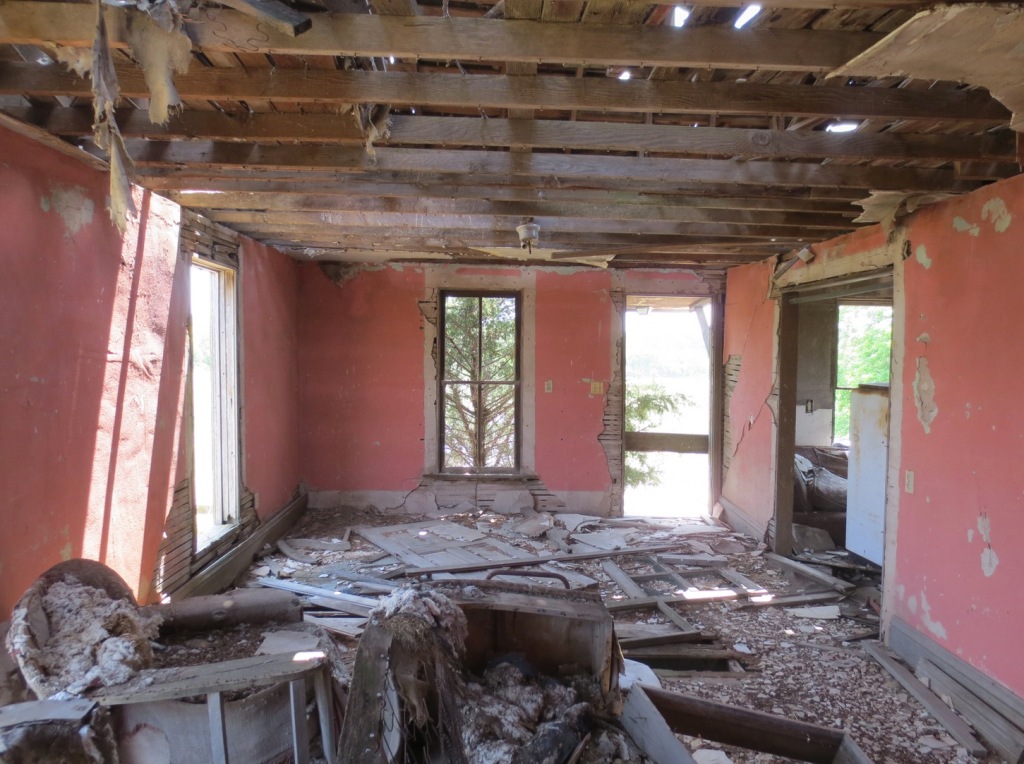
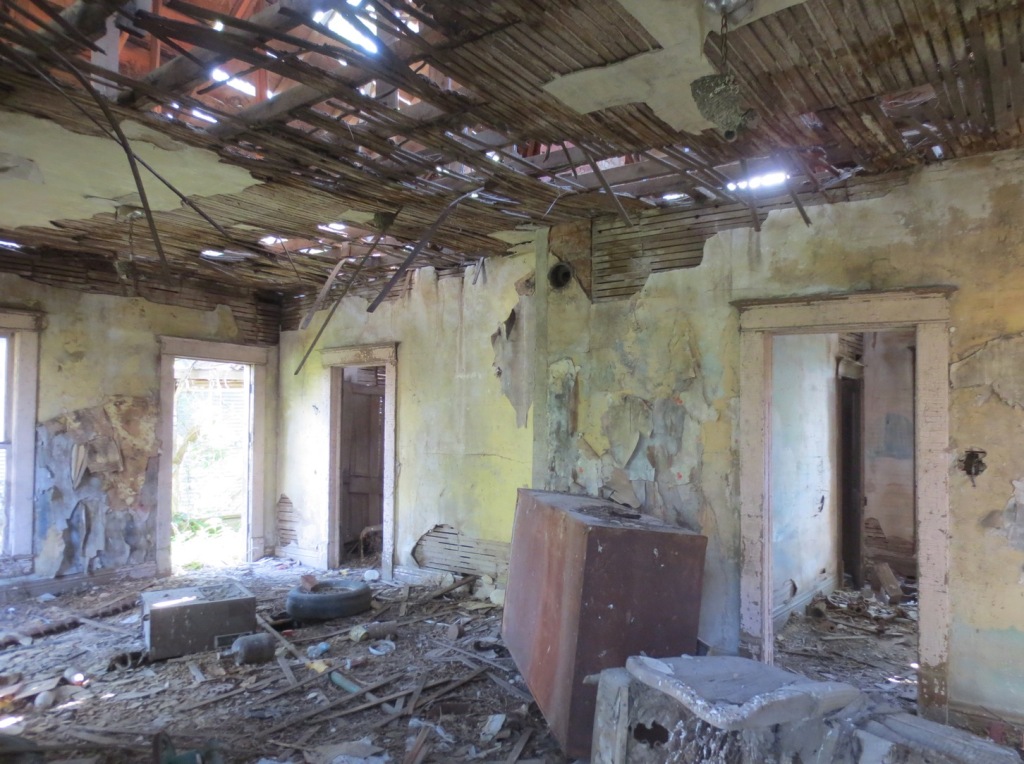
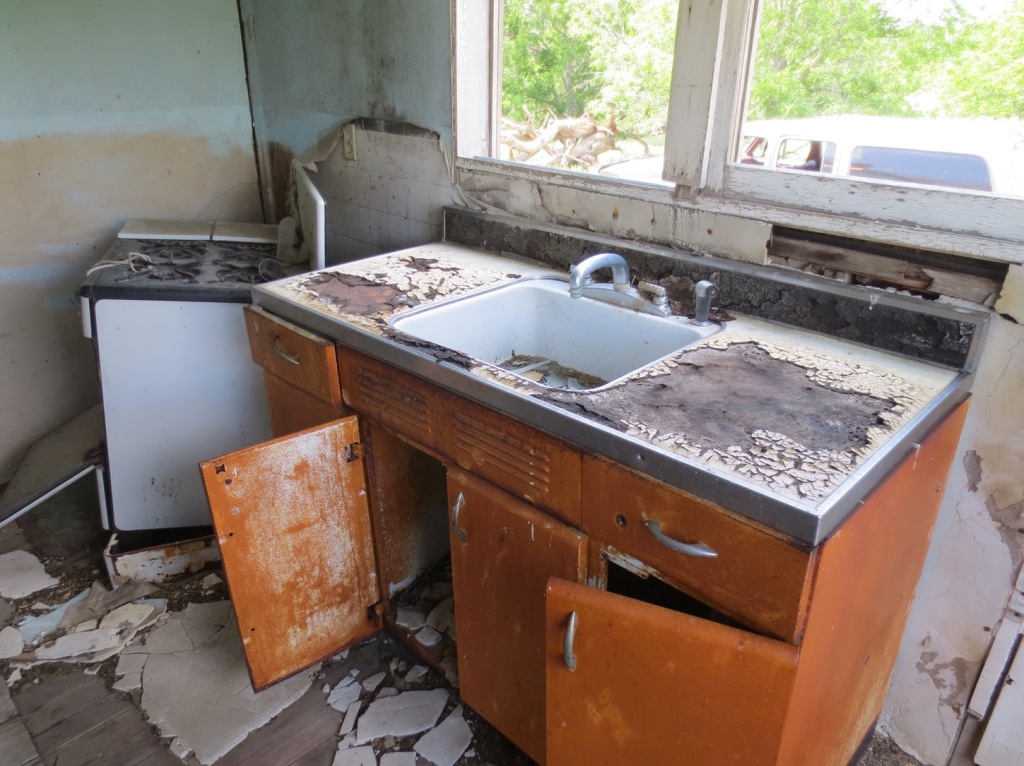
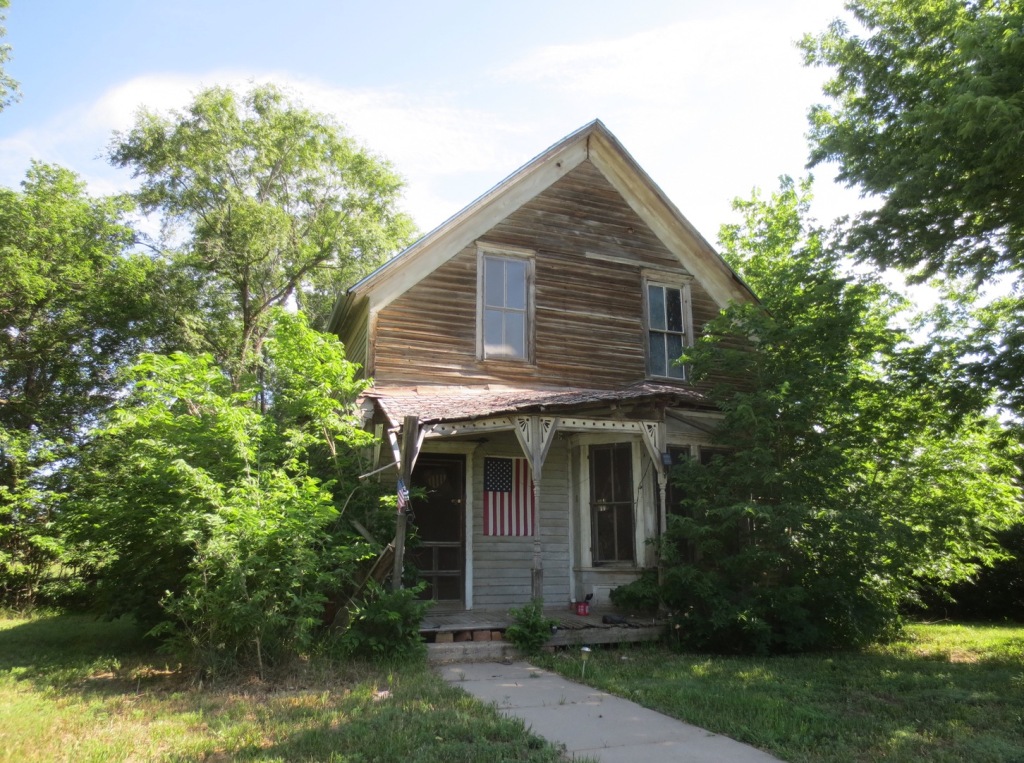
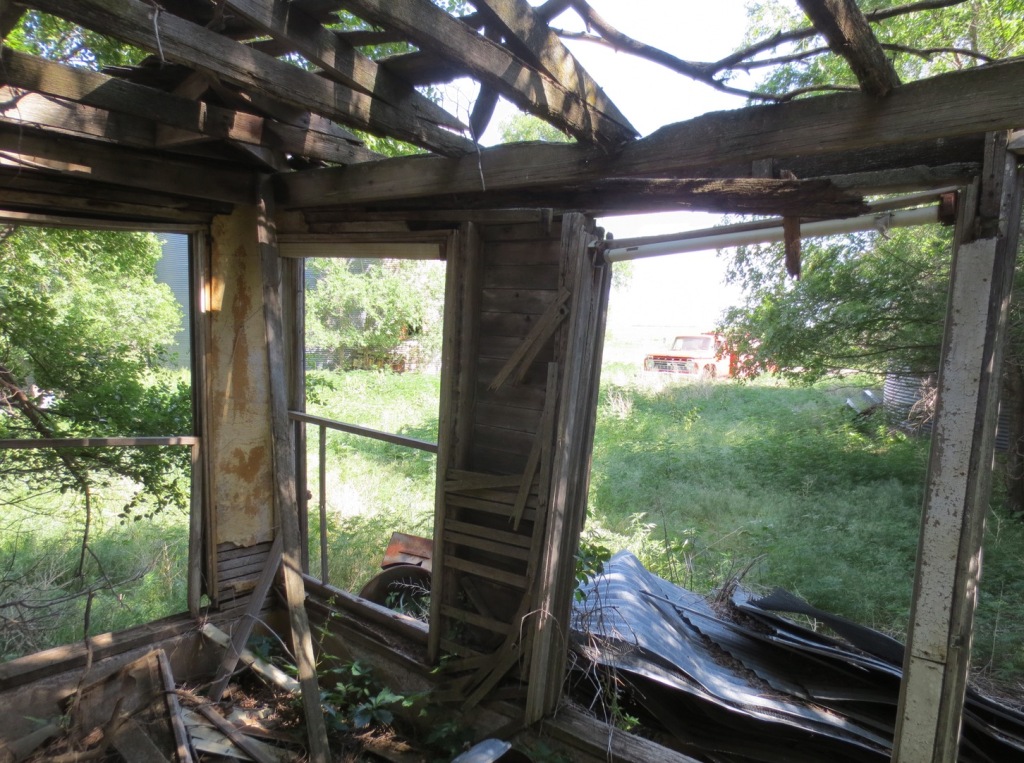
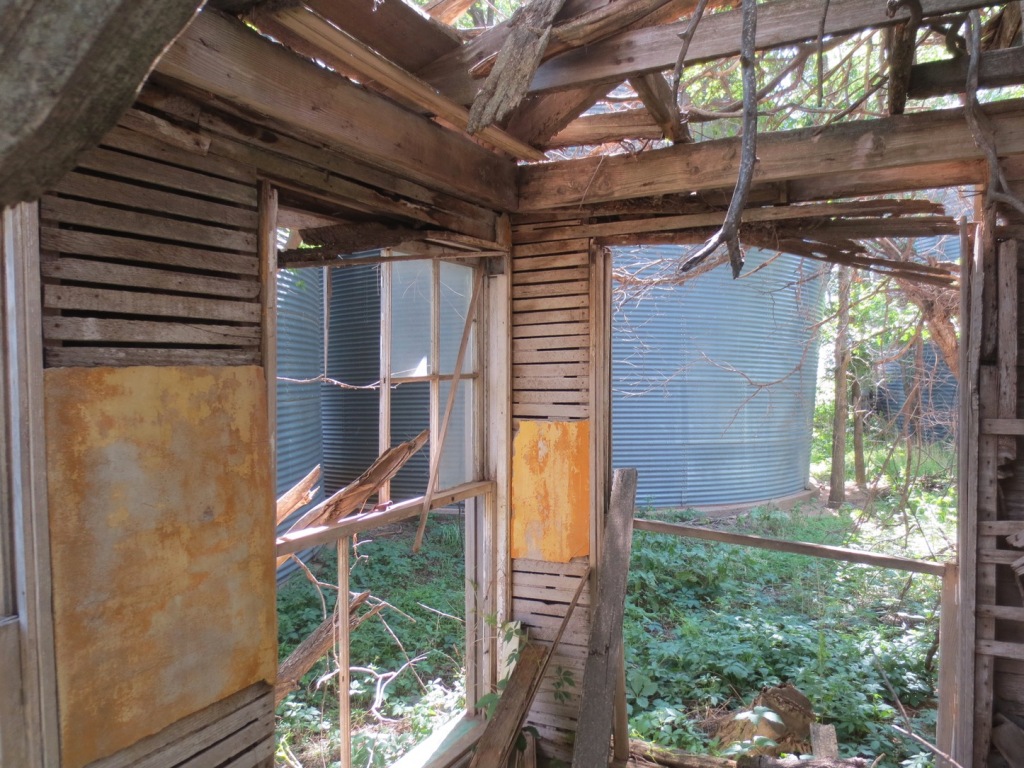
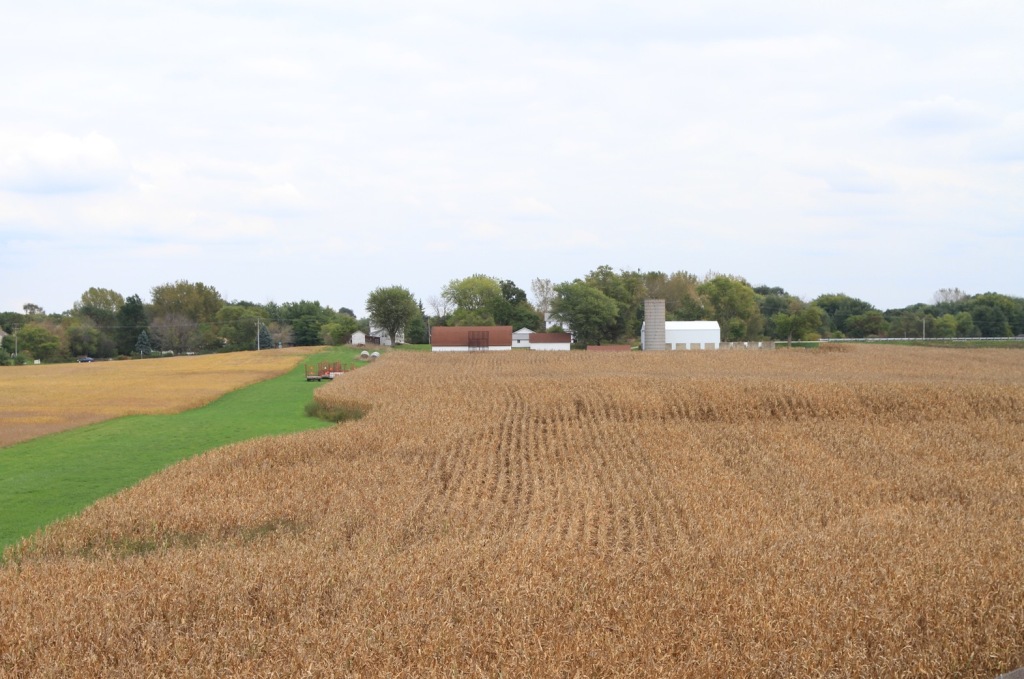
    It helps to explore previous versions of these regularly occurring historical shifts. Think of them as postcards from the last few rounds of the Zombie Apocalypse. Here’s a small farm town in rural Nebraska. Its population peaked in the 1920s. The period between World War I and the Great Depression was an especially prosperous time for such towns as commodity prices were high and technological innovation (the telephone, radio, automobiles, tractors, etc.) created an enormous amount of new wealth and opportunity. The 1920s was also an era of rampant unsustainable practices of all kinds that lead to the ruined soils and draughts of the Dustbowl and the collapse of speculative credit based financial institutions. The population of this town began to decline in the 1930s and is currently down to a few dozen souls.

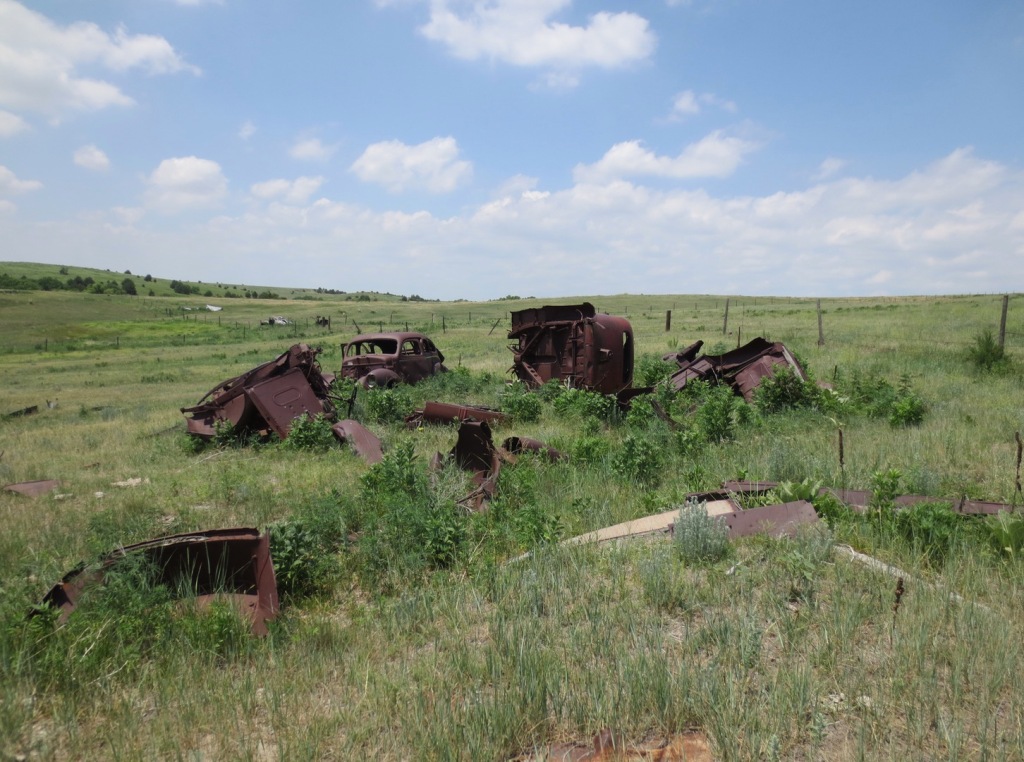
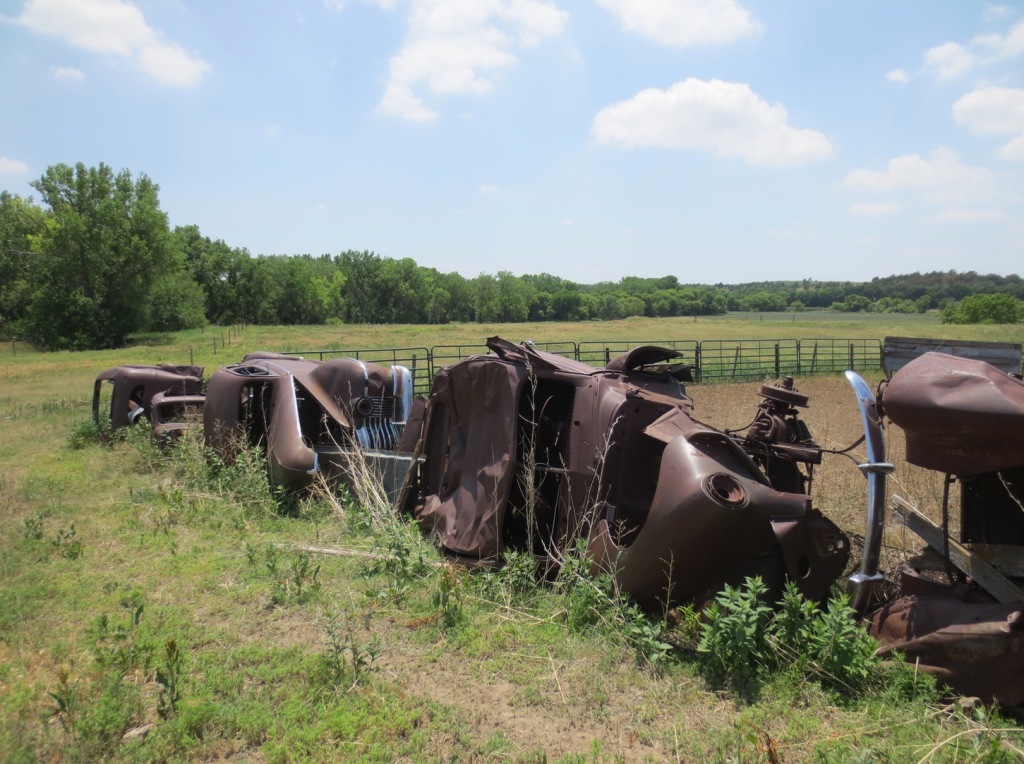
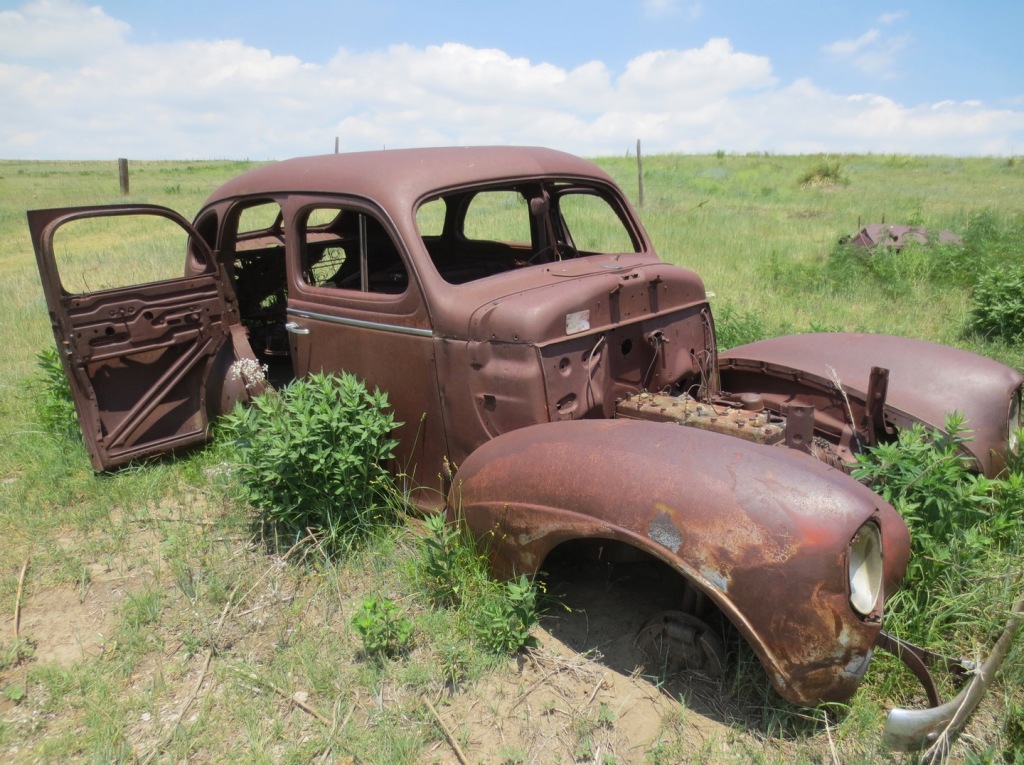
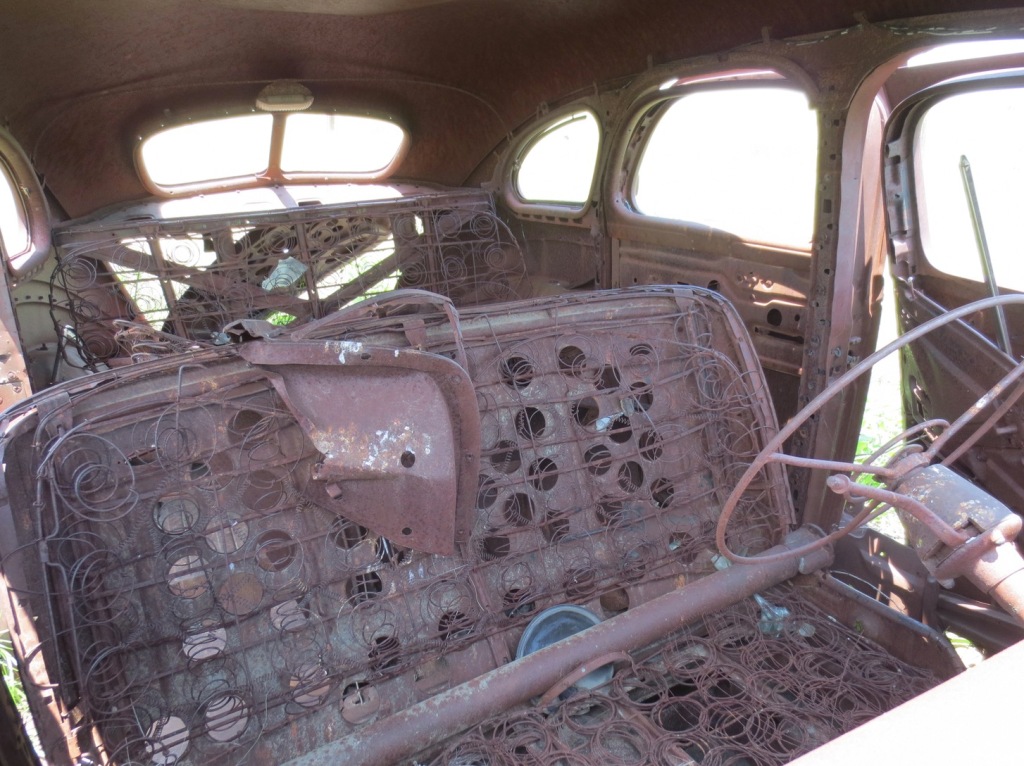
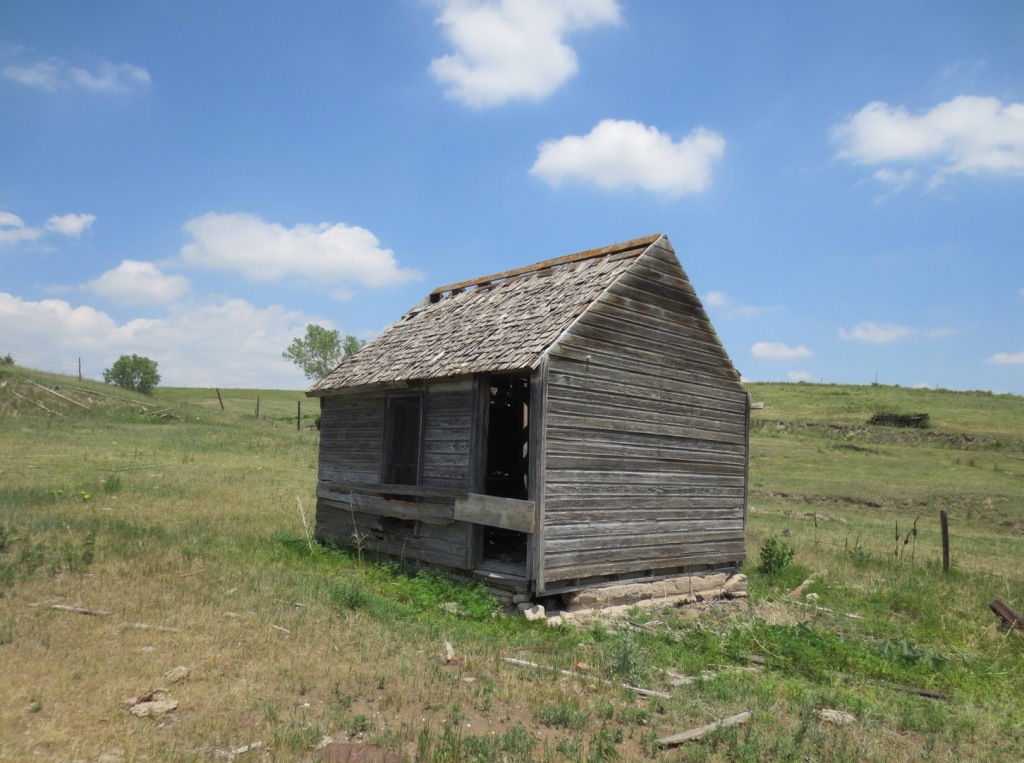
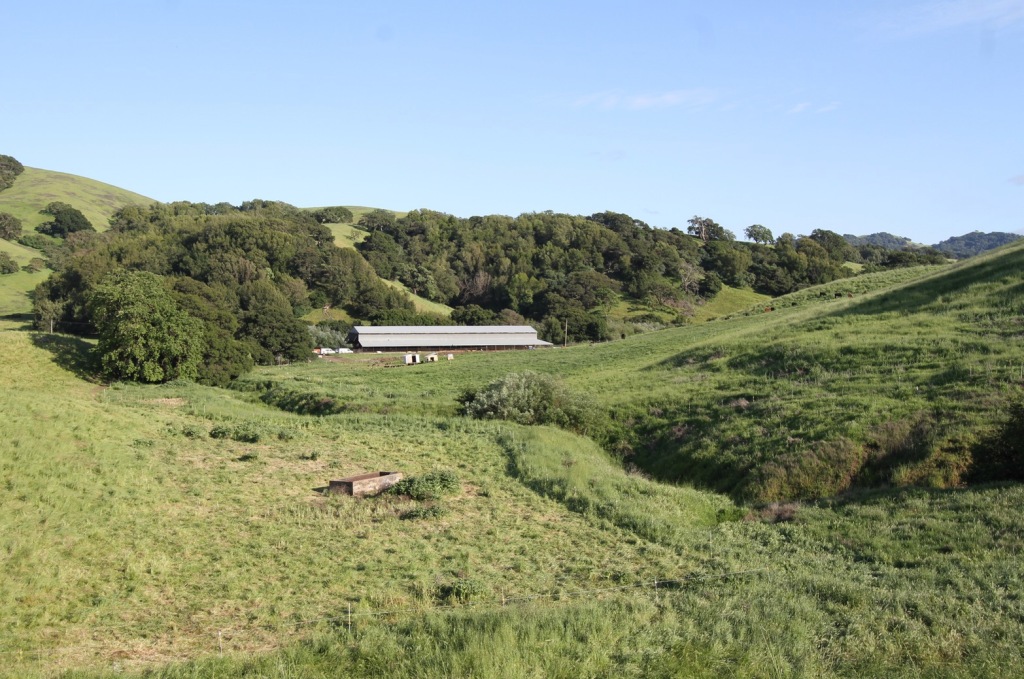
    Remnants of some of that early twentieth century technology still litter pastures on the edge of town. One resourceful farmer organized these old car carcasses into a makeshift corral for his livestock.

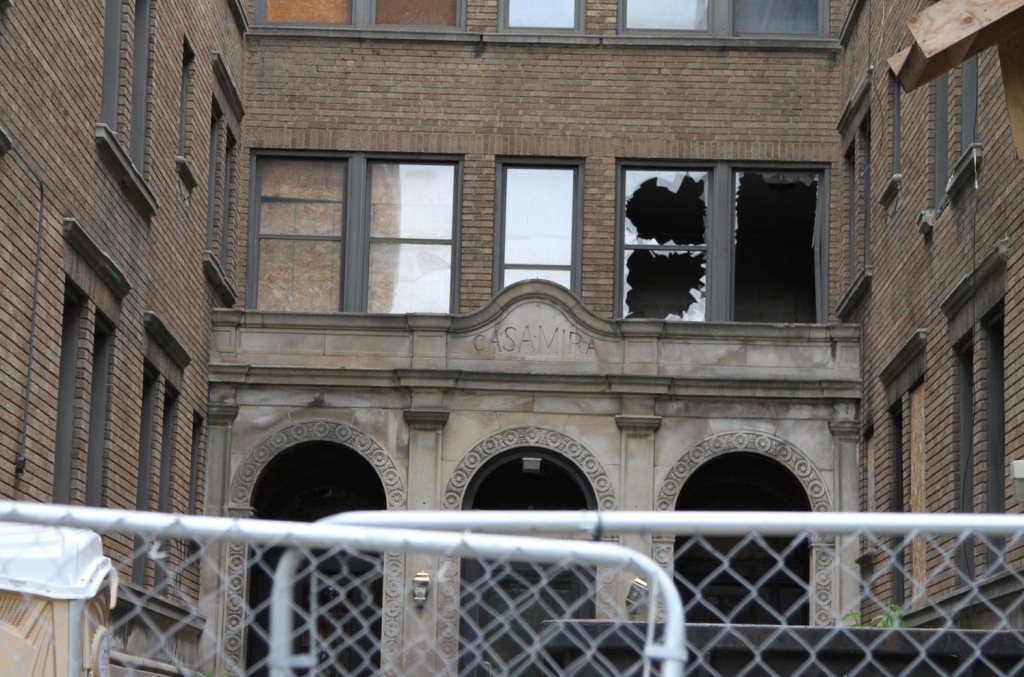
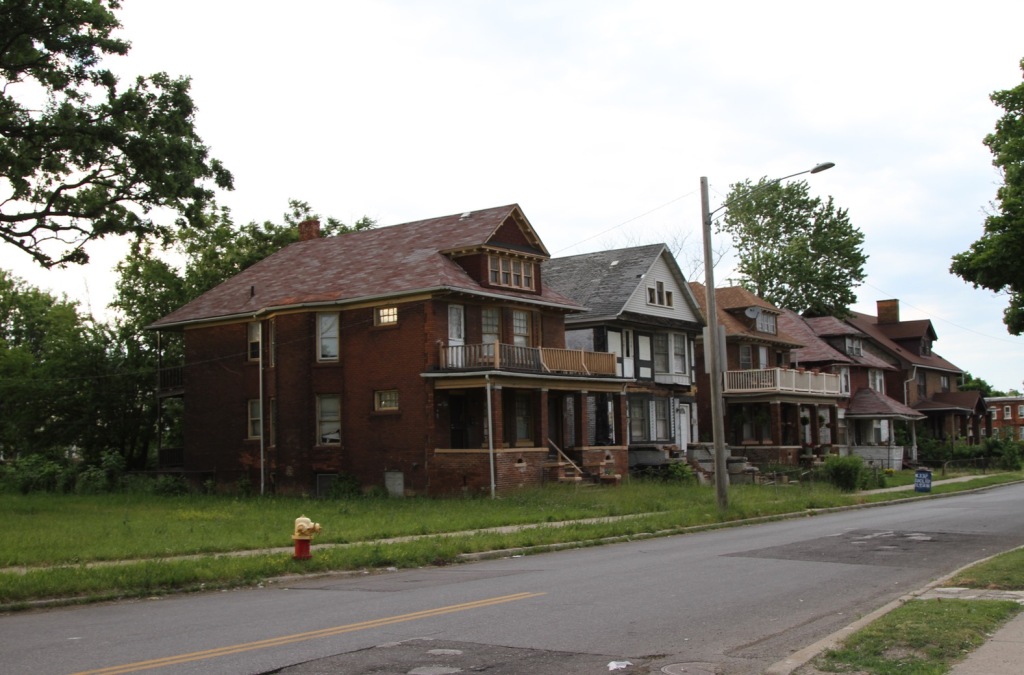
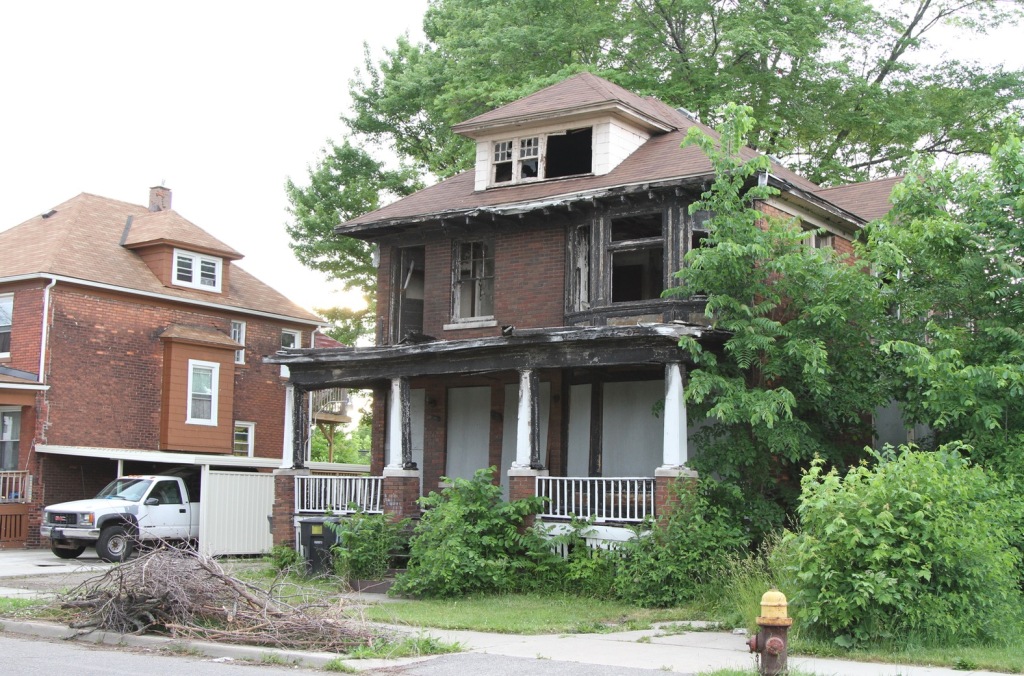
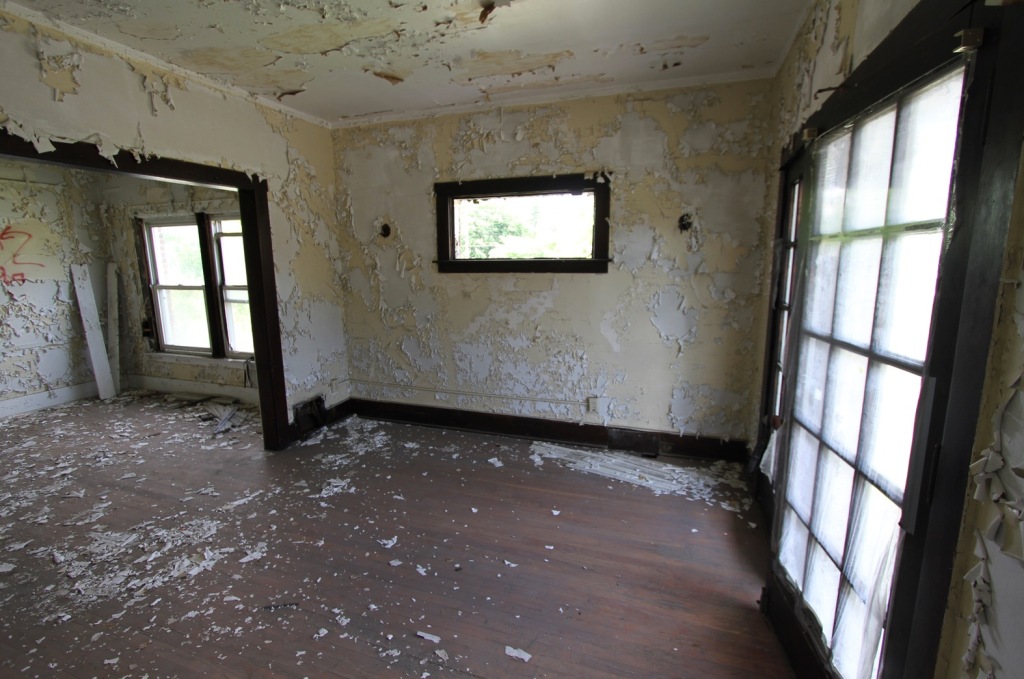
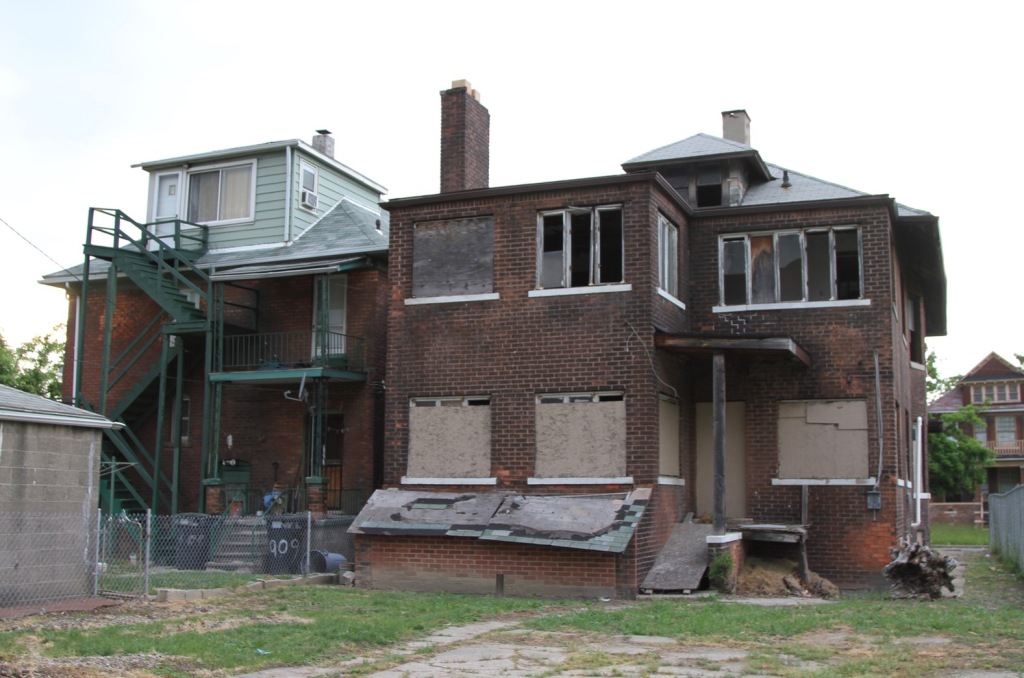
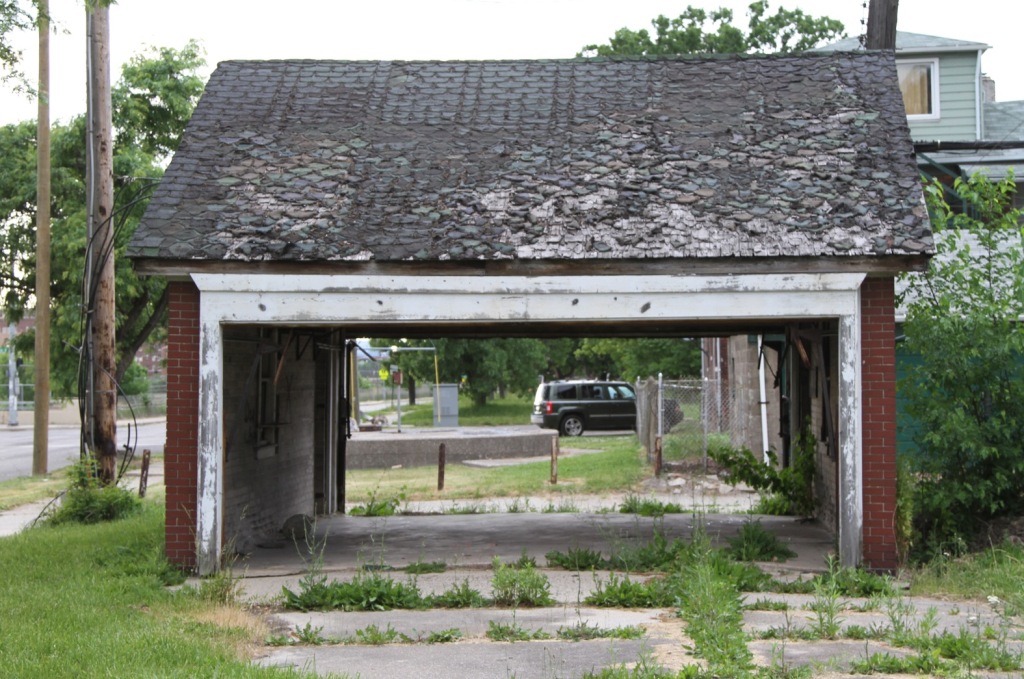
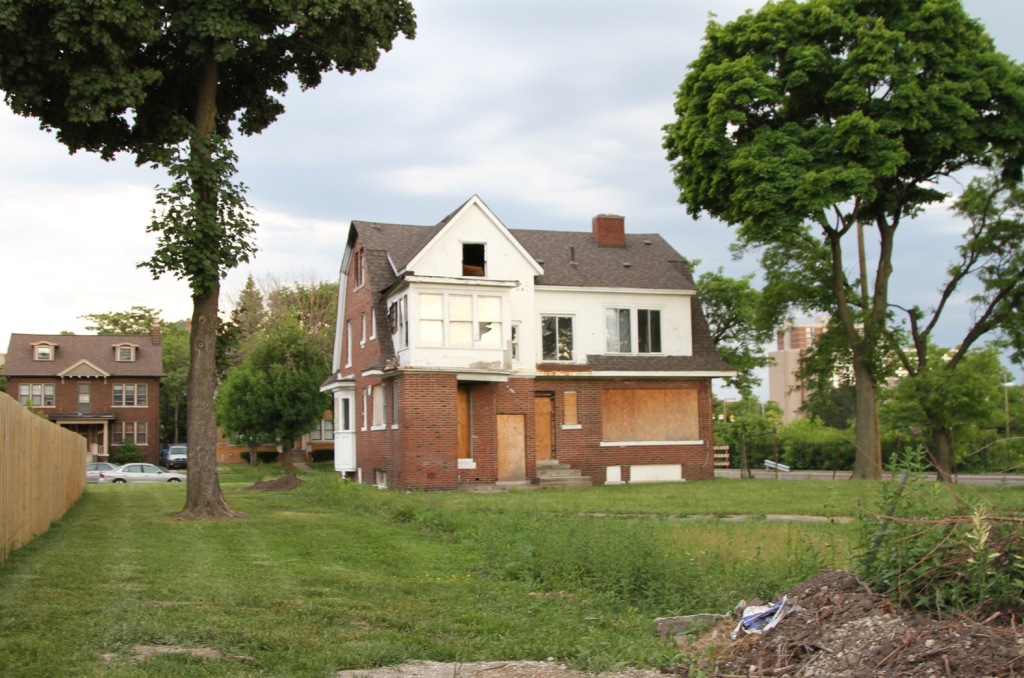
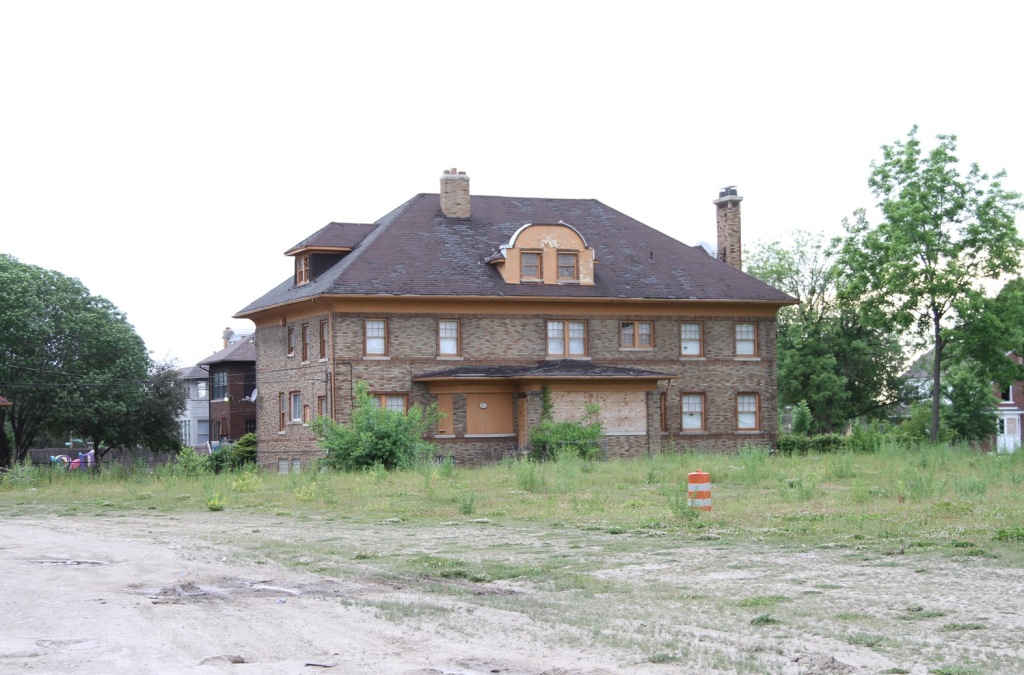
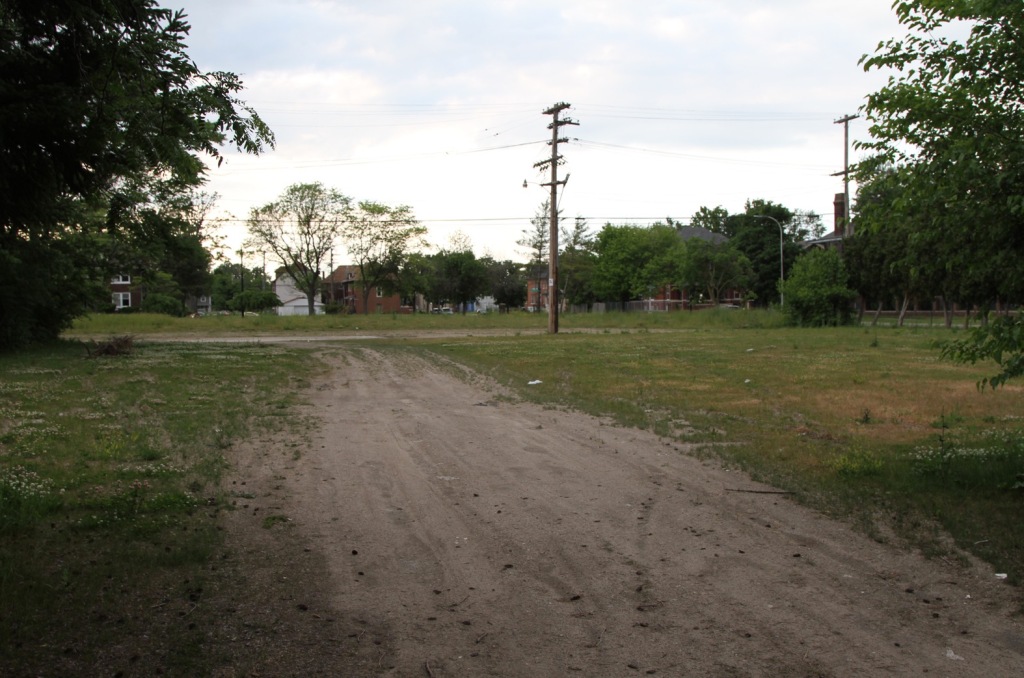
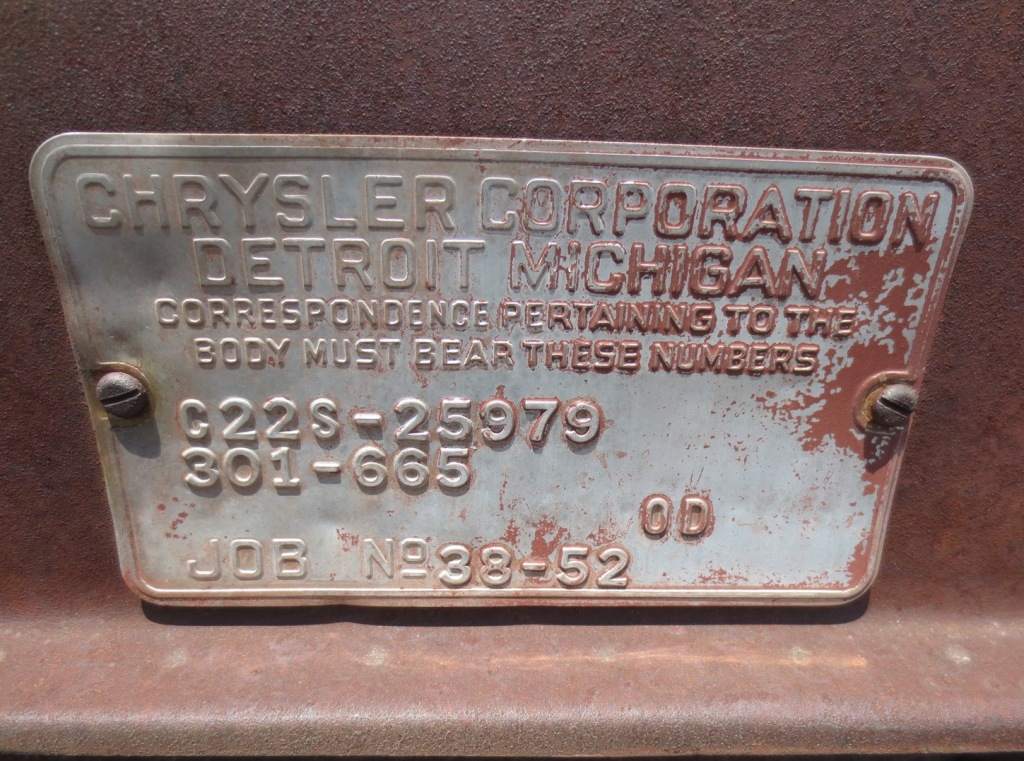
    It’s possible to connect the dots from rural Nebraska to Detroit where those very same vintage vehicles were manufactured all those decades ago. Detroit peaked in population, economic power, and political influence in 1950. Today huge swaths of Motown look remarkably similar to the abandoned farms and small towns of the prairie. Entire city blocks are now cleared of people and buildings. The Zombie Apocalypse arrived there too. If small scale agriculture was made redundant by mechanization and industrial scale production, then industry itself was hammered by other equally powerful forces. Everything has a beginning, middle, and end.

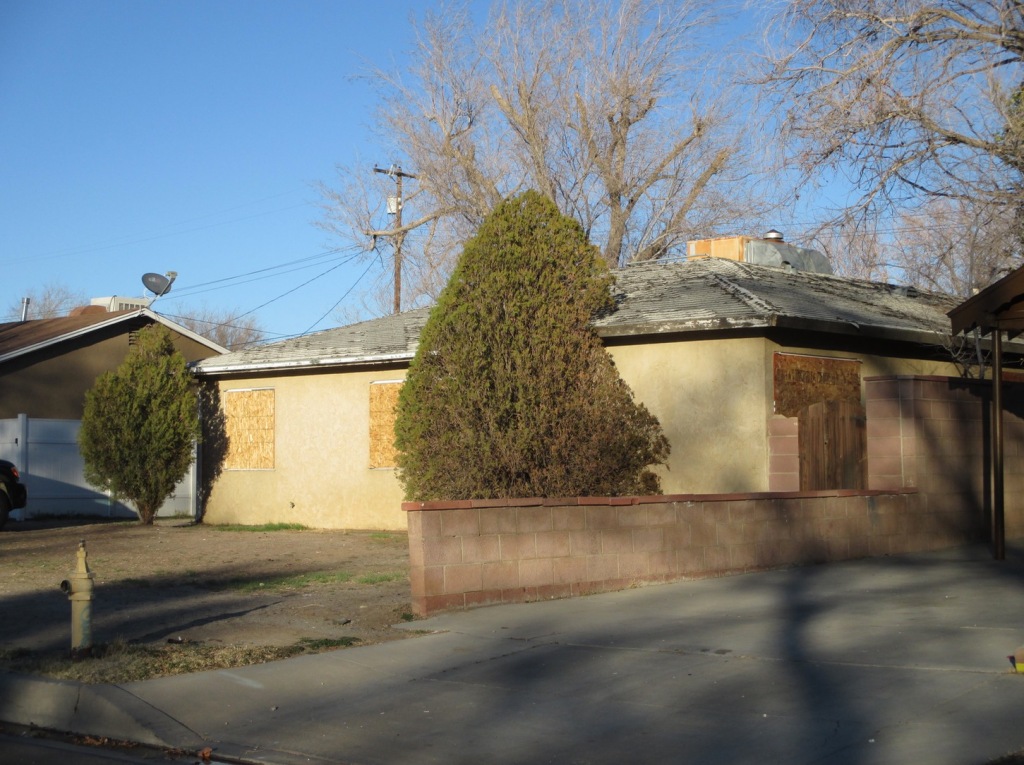
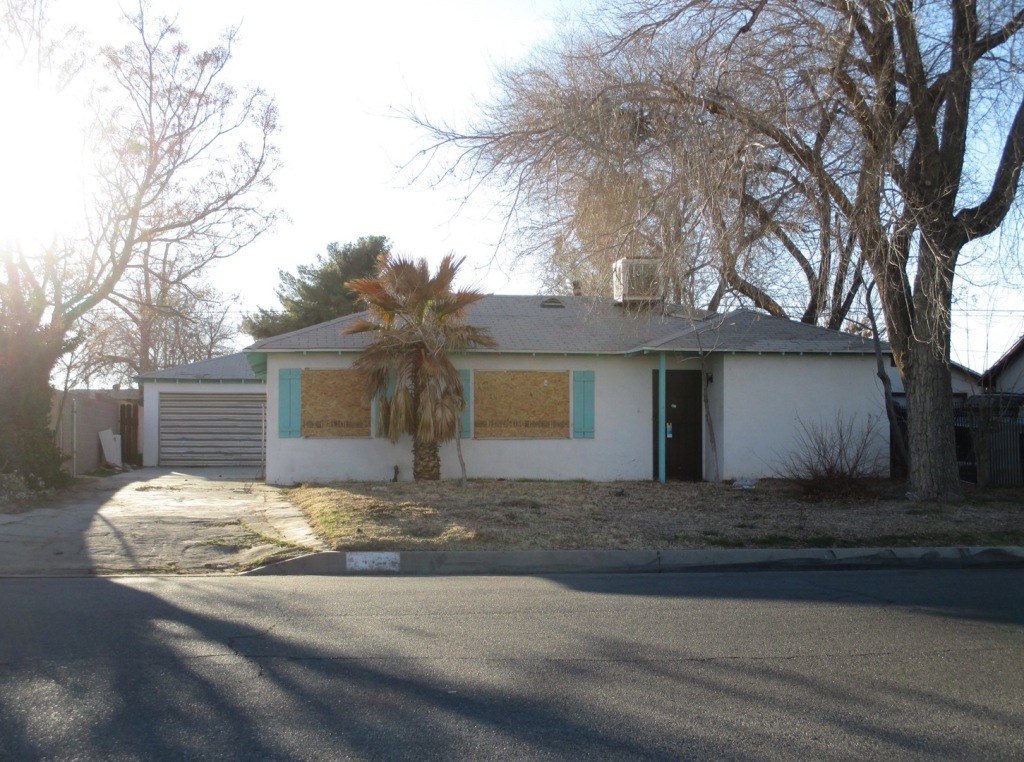
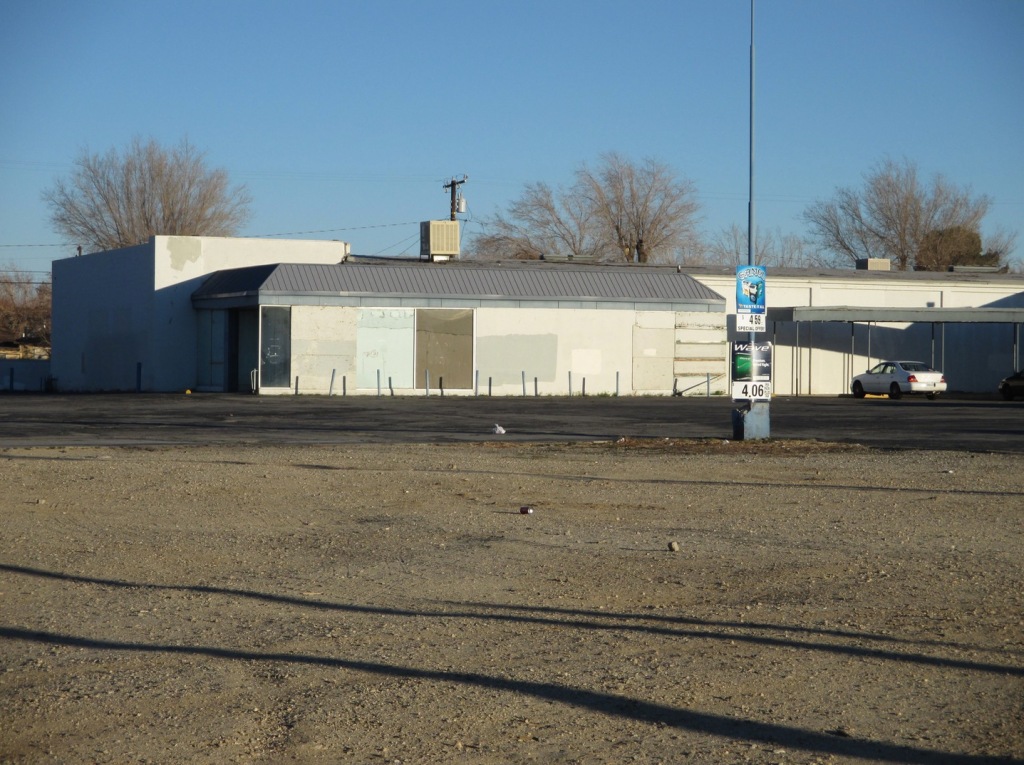
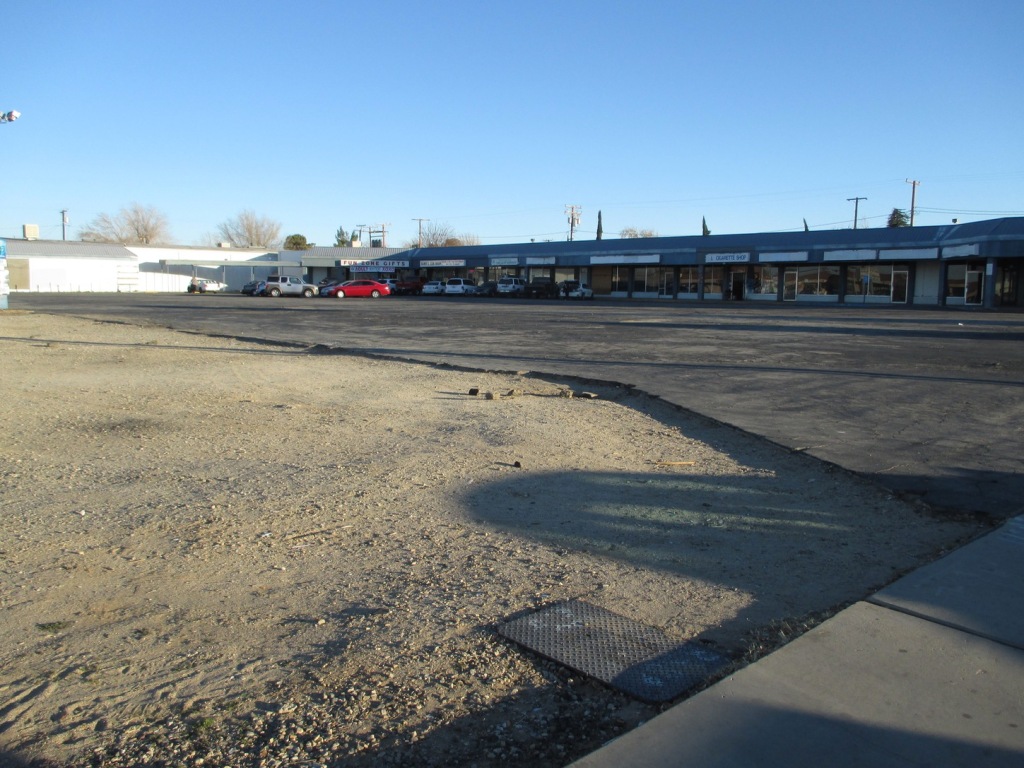
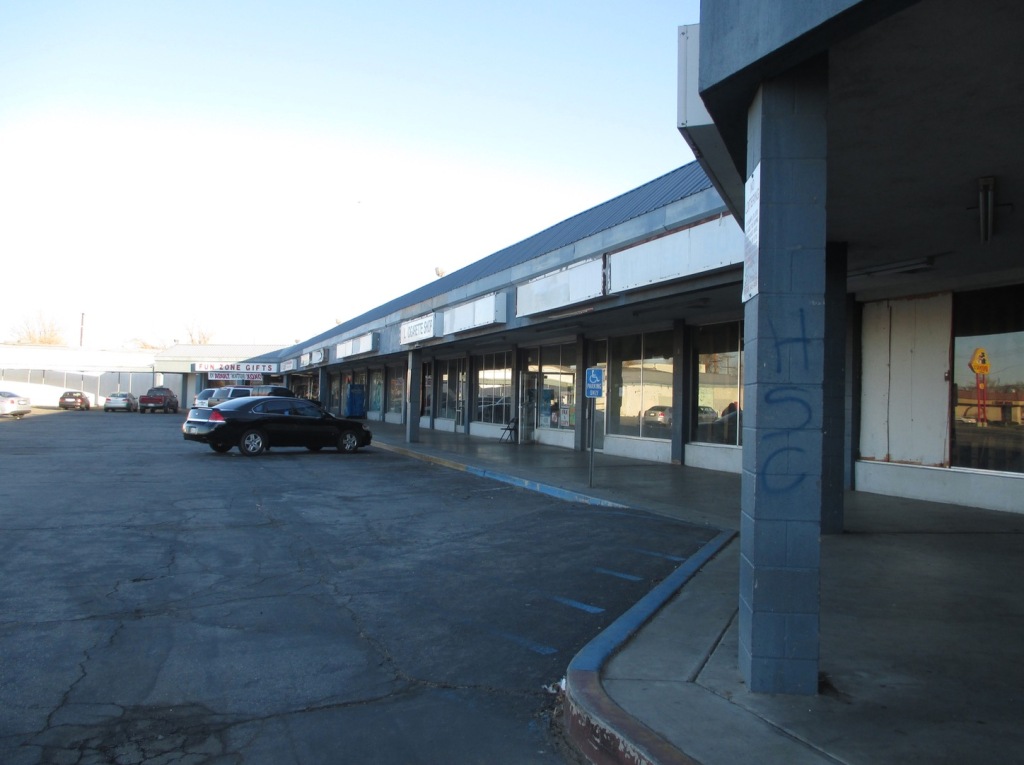
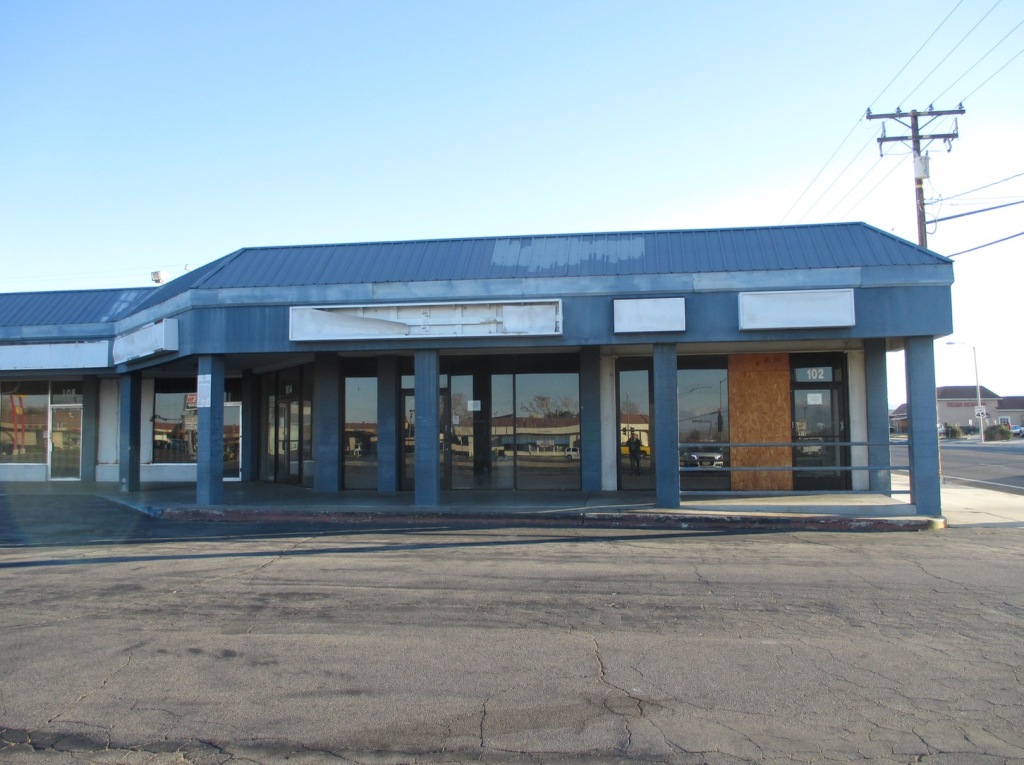
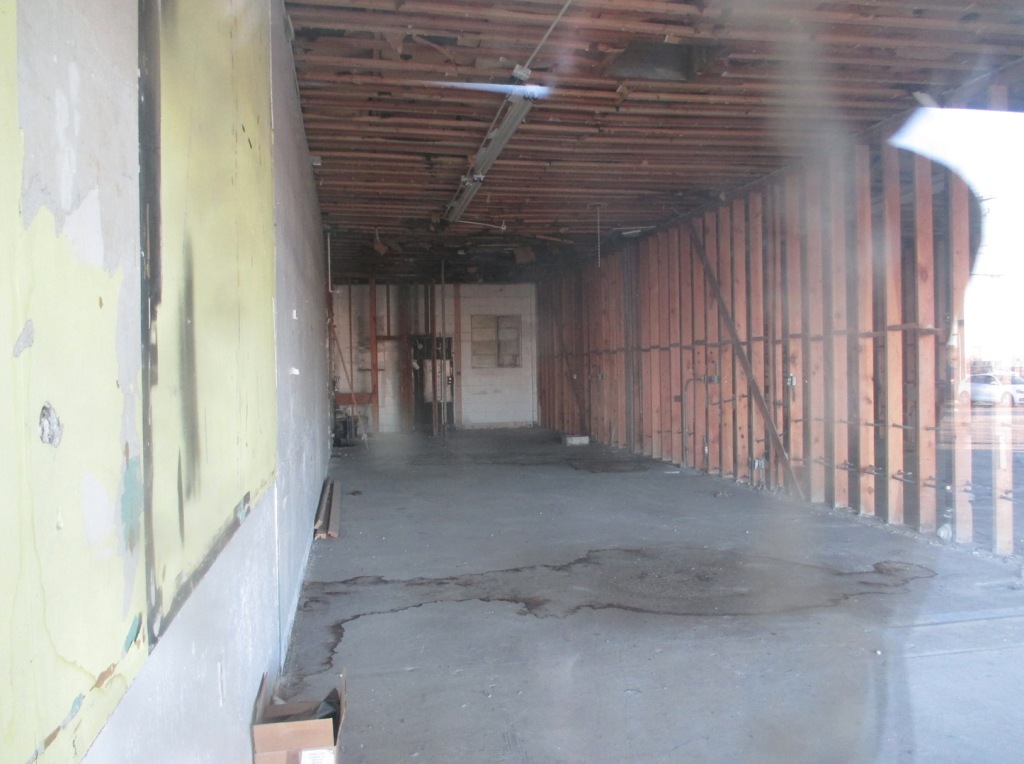
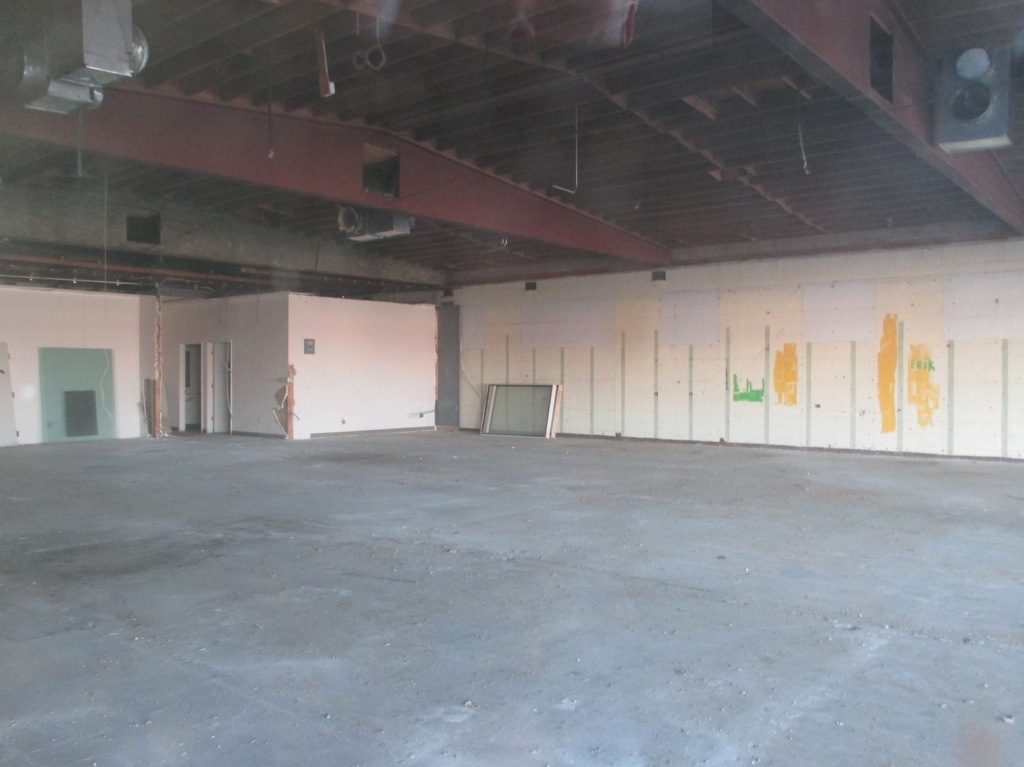
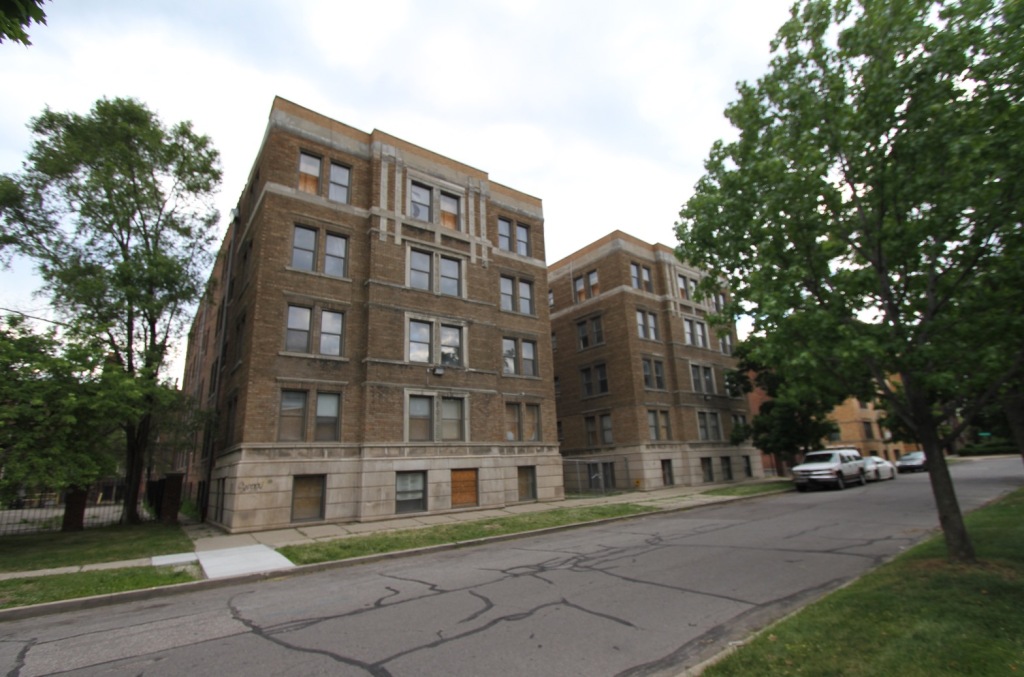
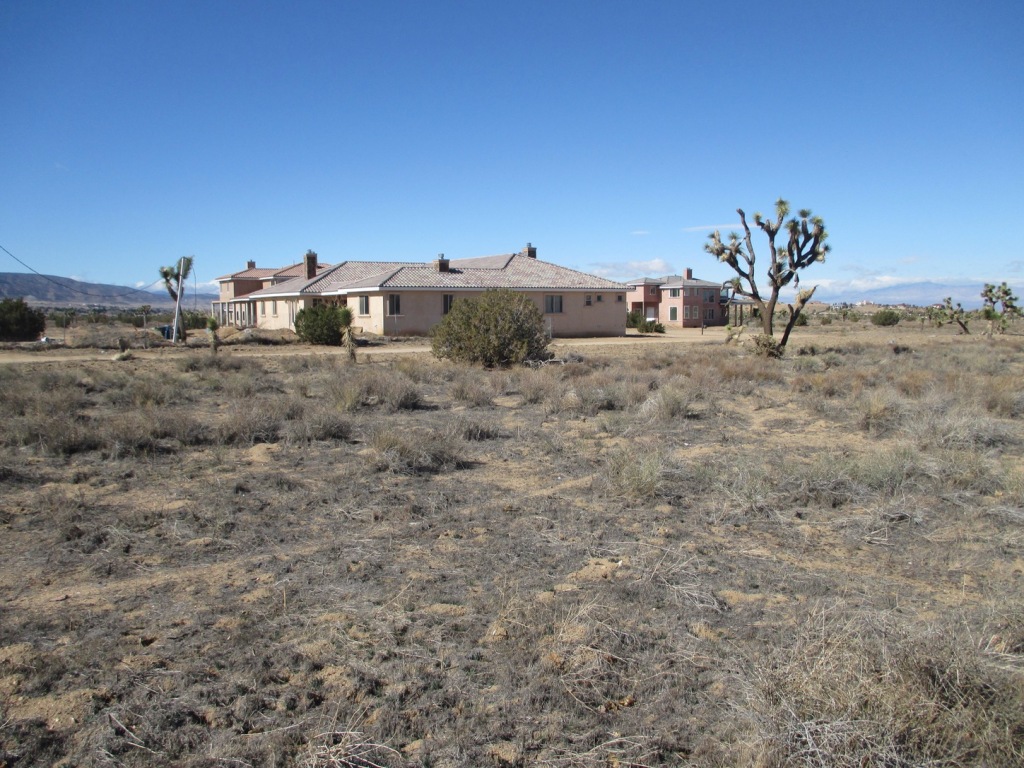
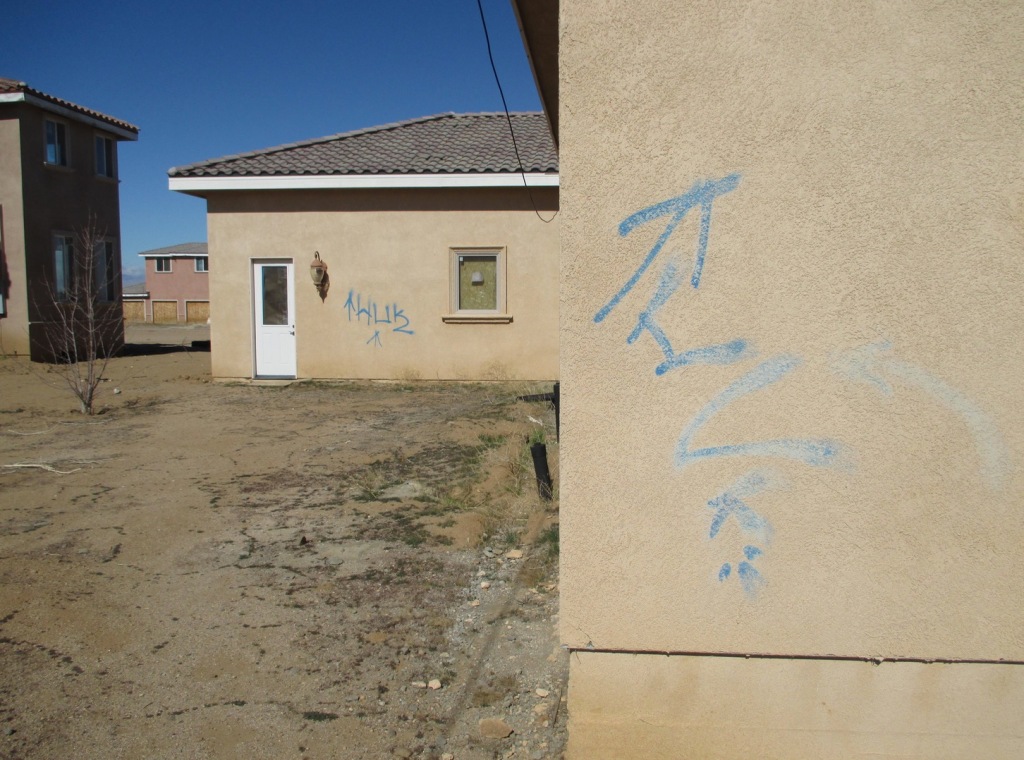
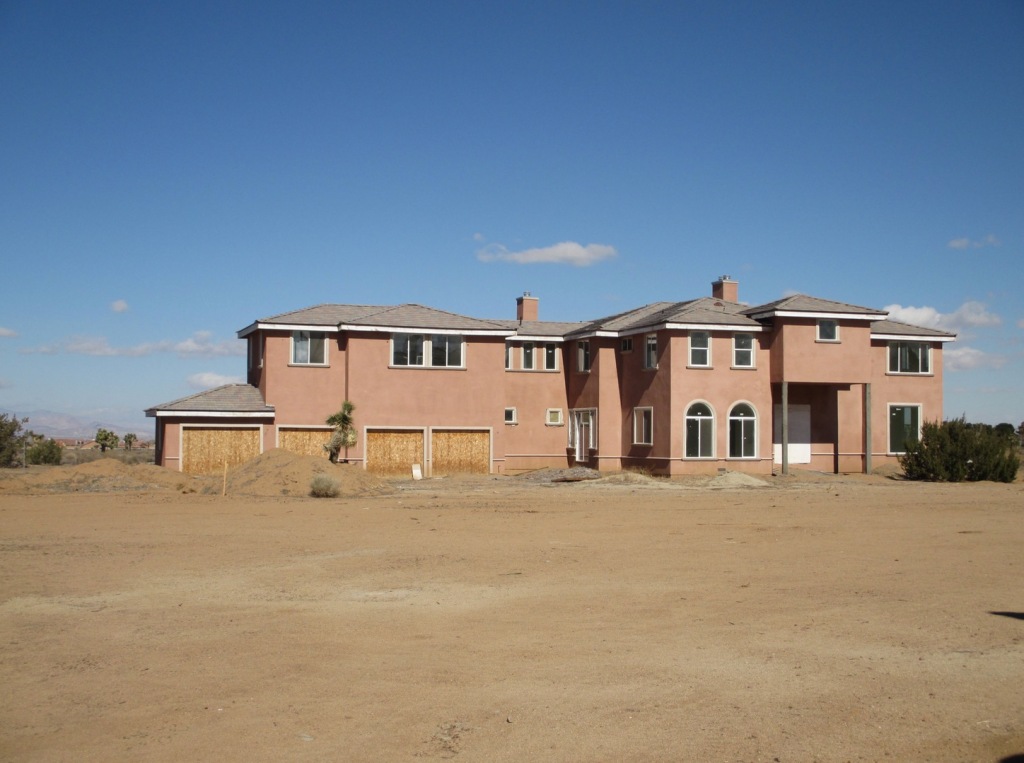
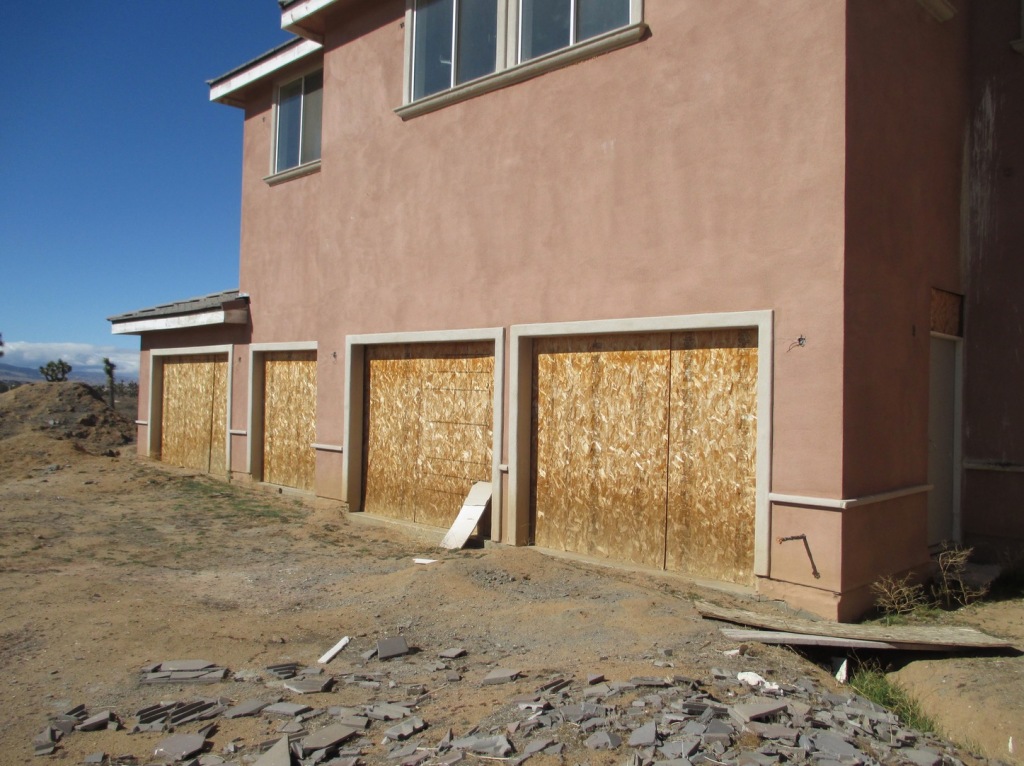
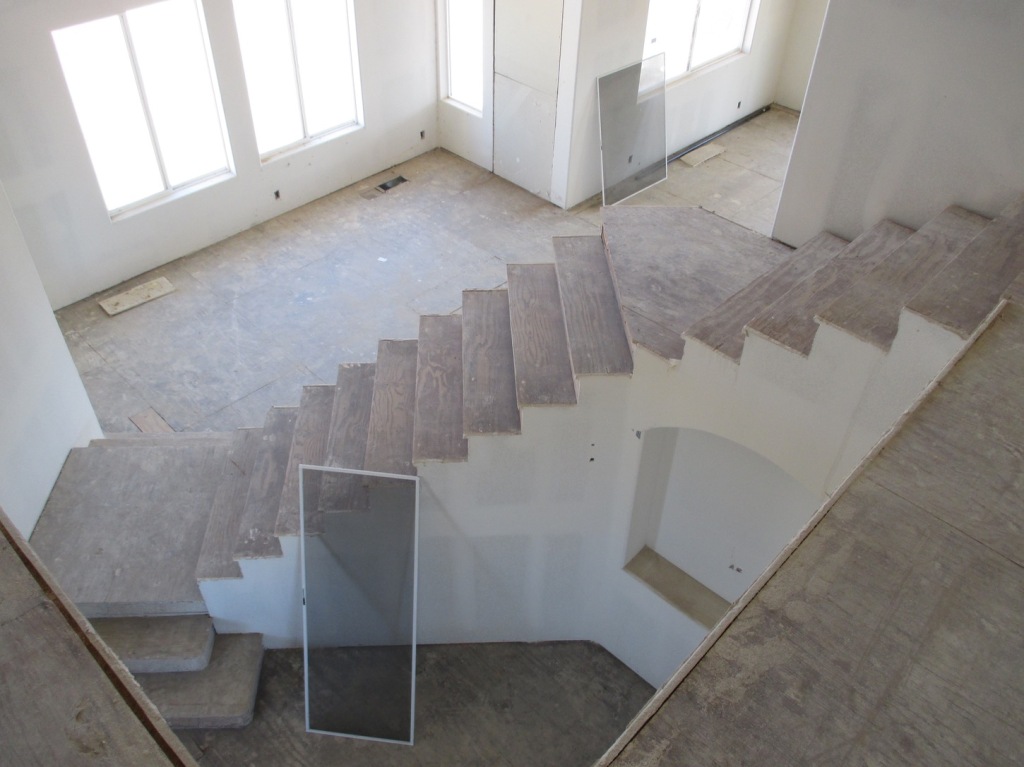
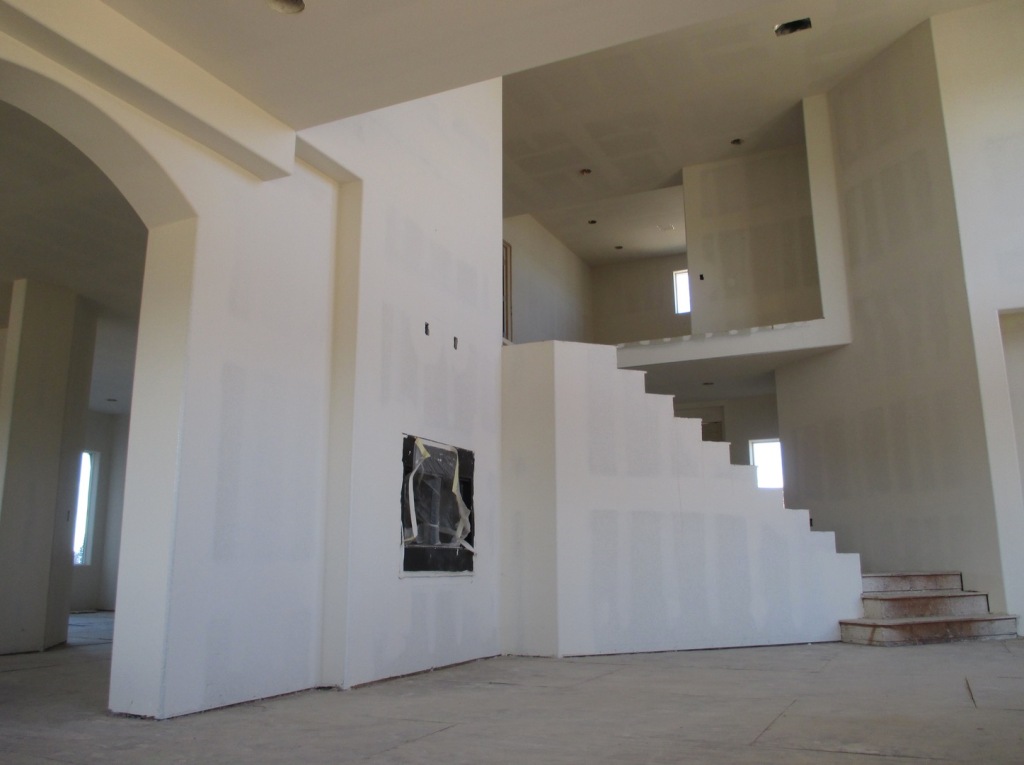
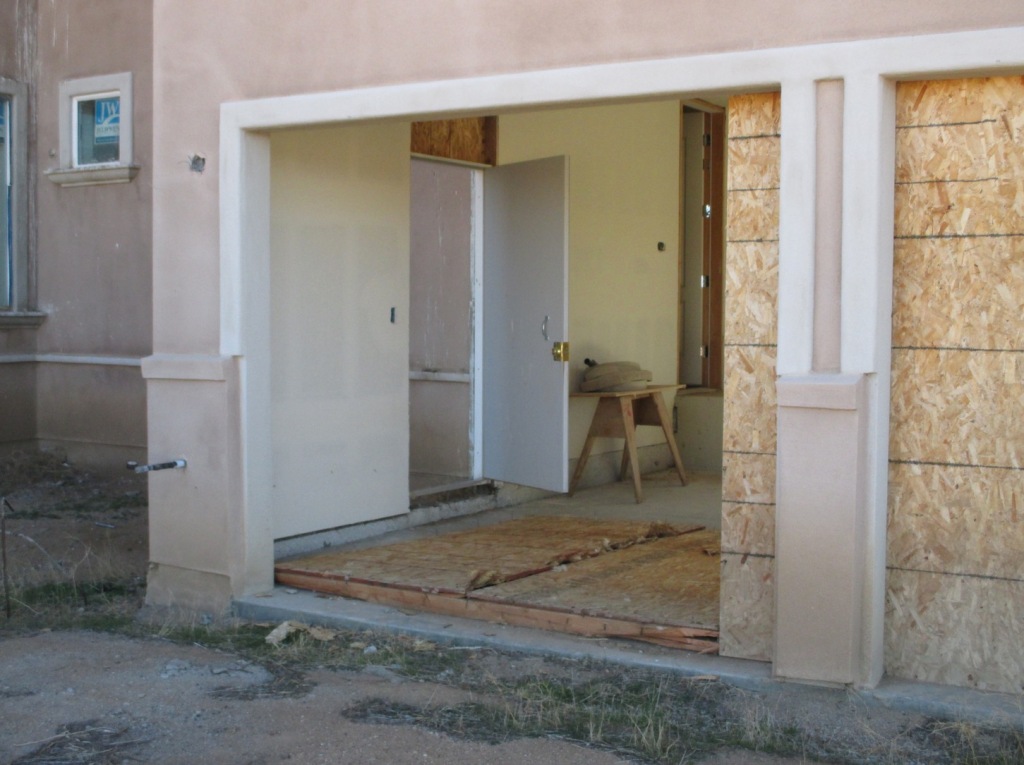
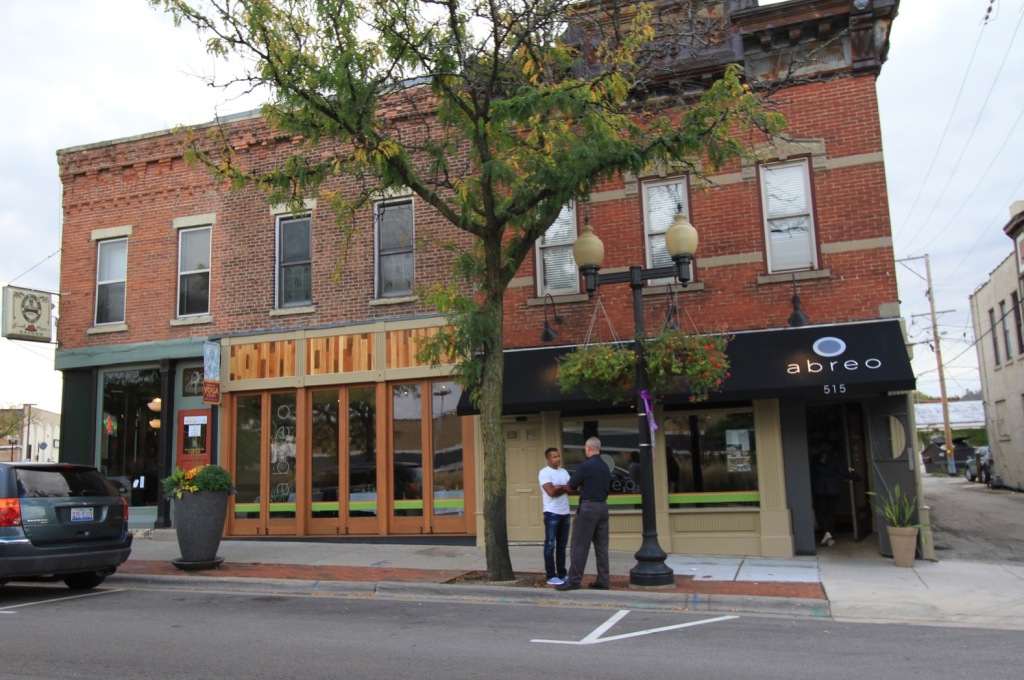
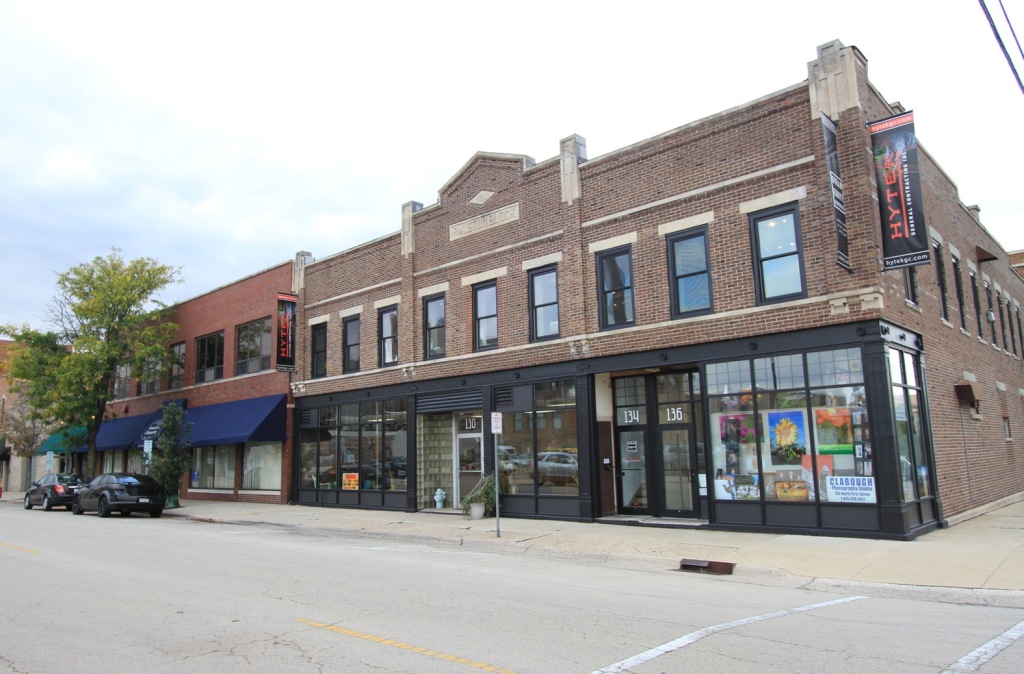
    The most recent iteration of the Zombie Apocalypse has already begun to unfold in some places. Suburbia was exactly the right thing for a particular period of time. But that era is winding down. The modest tract homes and strip malls built after World War II  are not holding up well in an increasing number of marginal landscapes. I have been accused of cherry picking my photo ops, particularly by people who engage in their own cherry picking when discussing the enduring value of prosperous suburbs. But there’s too much decay in far too many places to ignore the larger trend. The best pockets of suburbia will carry on just fine. But the majority of fair-to-middling stuff on the periphery is going down hard.

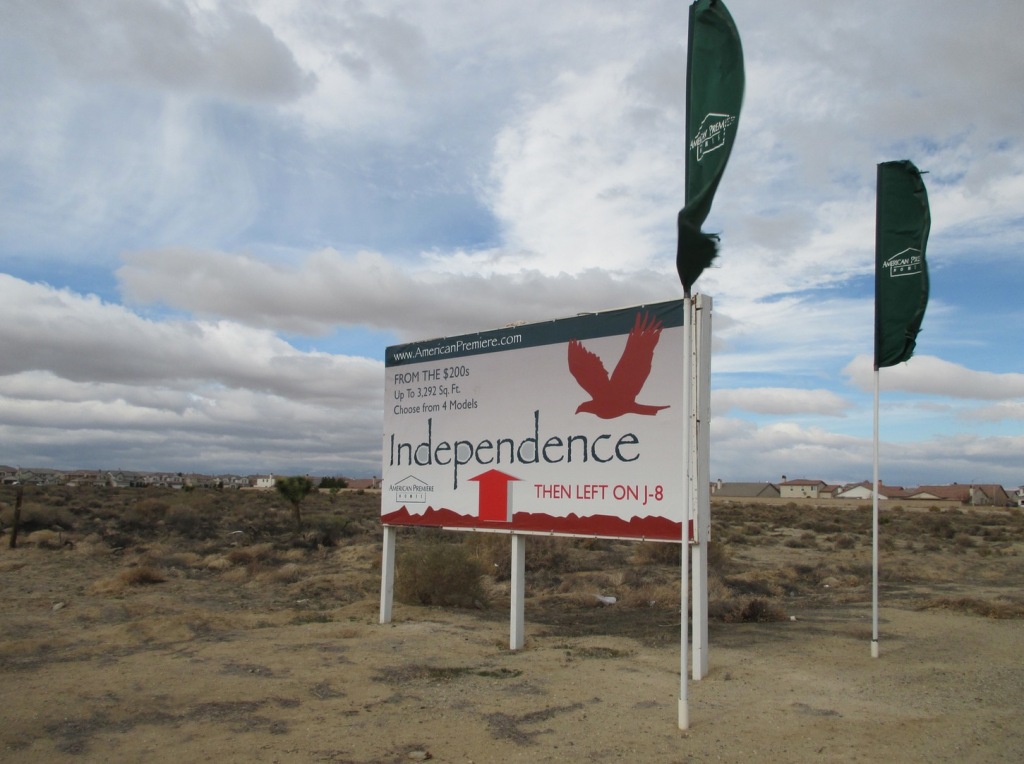
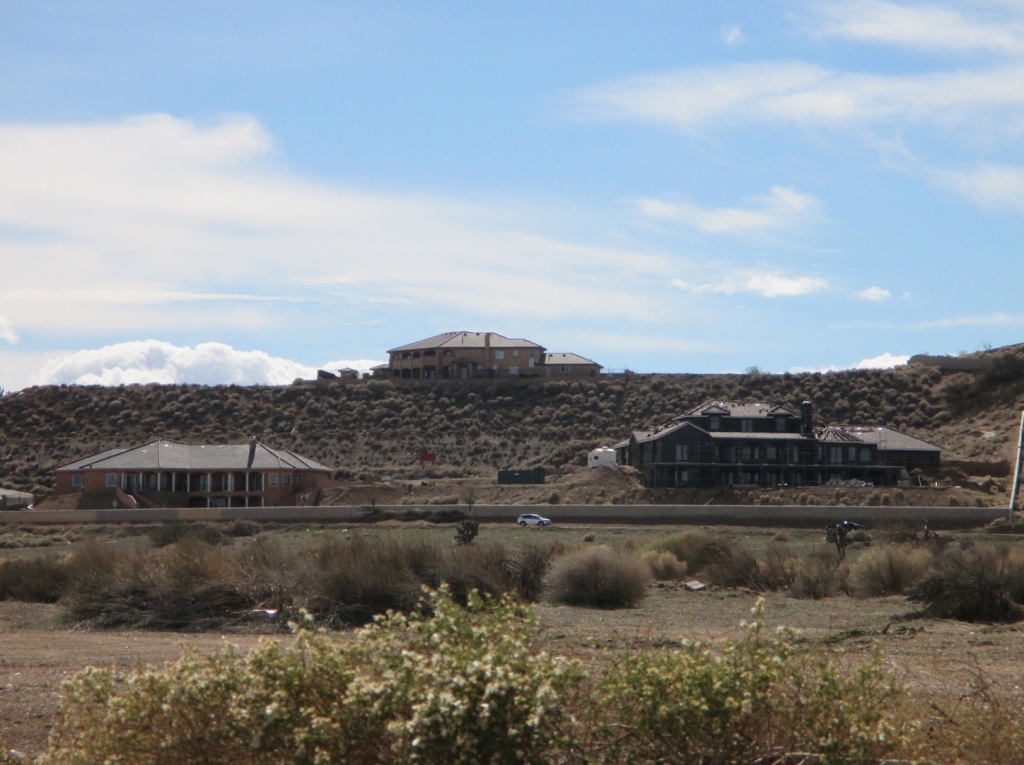
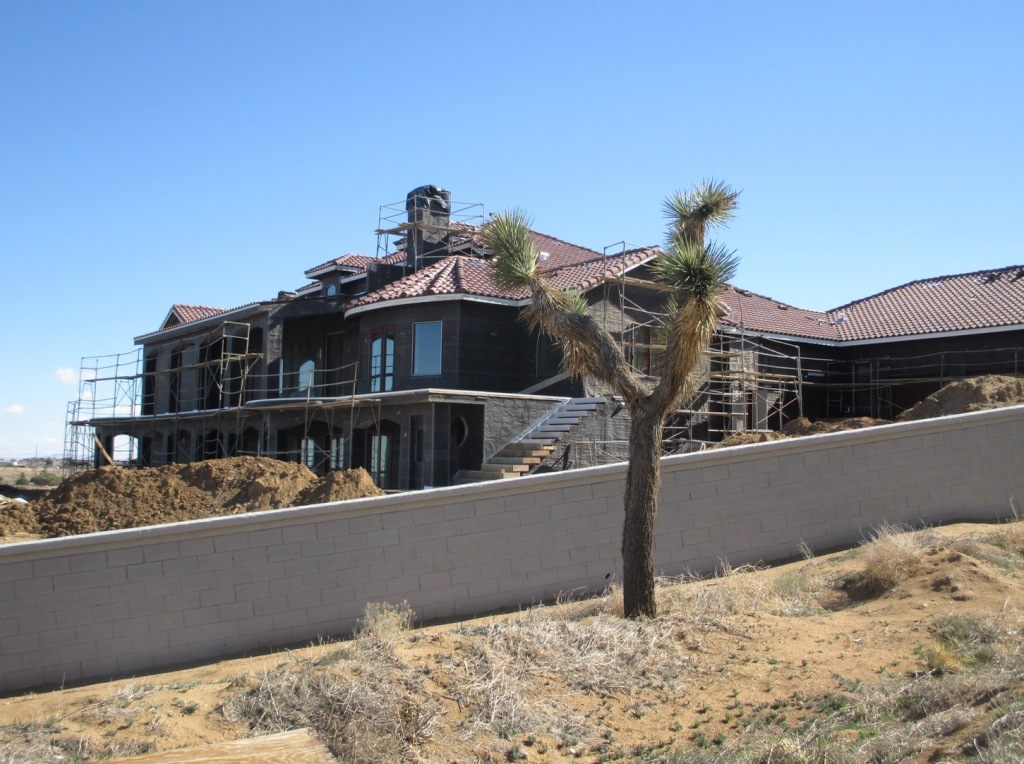
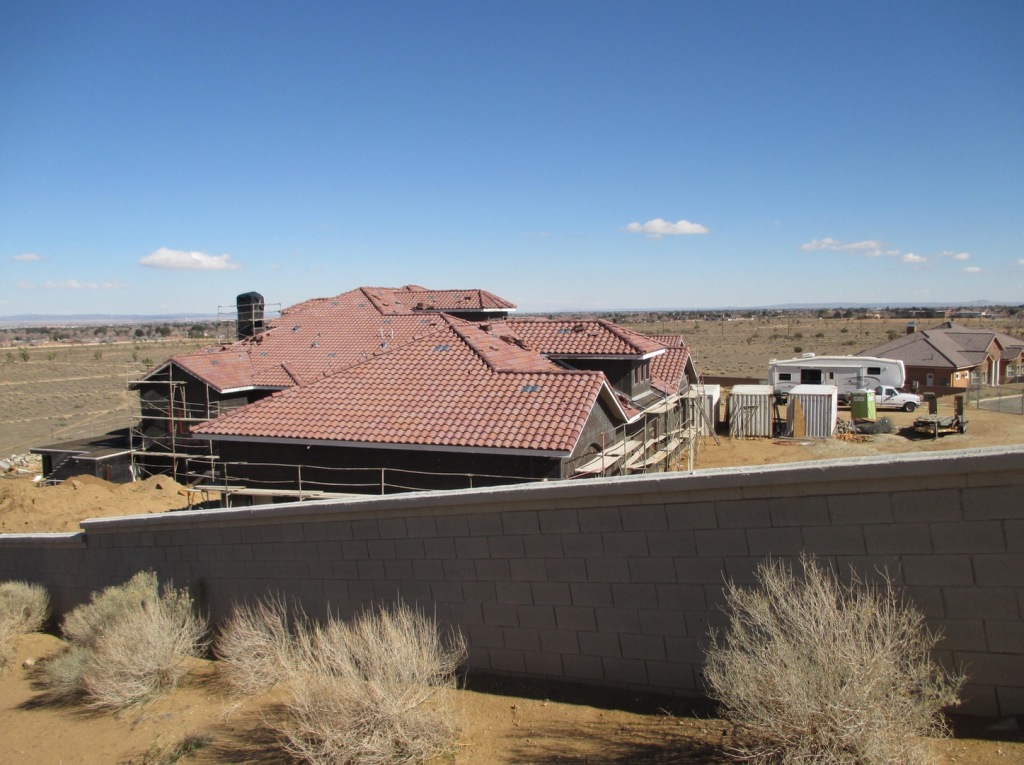
    The desire to push farther out and build ever more upscale suburban developments in increasingly remote locations is palpable. That’s what a significant proportion of the population desires on some level. But in the same spots – often next to each other – is ample evidence that there’s something profoundly wrong.

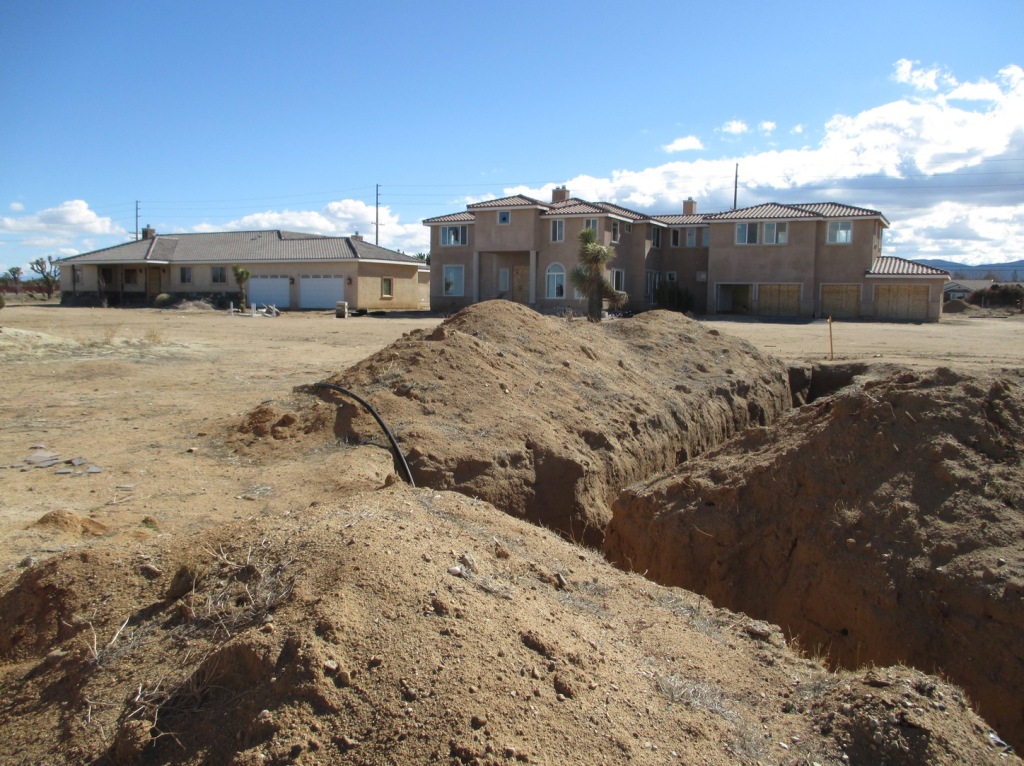
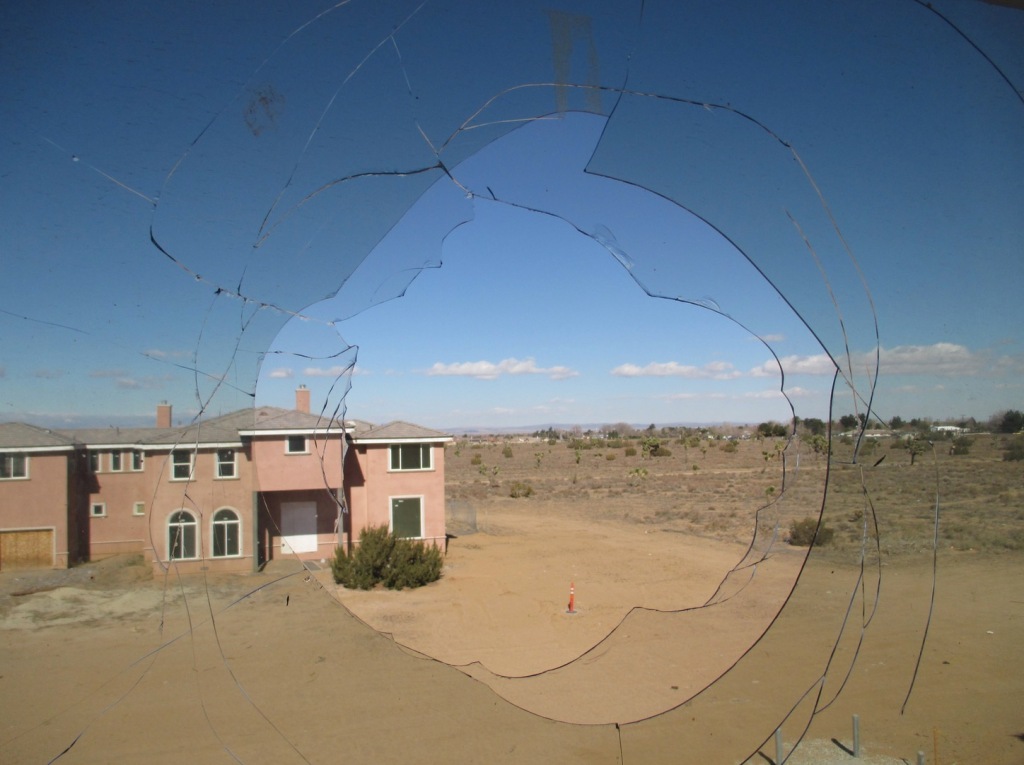
    Not all farm towns died. Not all industrial cities collapsed into ruin. Not all suburbs will fail… But the external forces at work are going to favor some places much more than others moving forward. The trick is to understand what those forces are before everyone else does and position yourself to benefit instead of getting whacked by the shifts. Would you have rather sold your house in Detroit in 1958 when things were still pretty good, or wait until 1967 when the panicked herd began to stampede? Would it have been better to buy property in the desert in 1970 and take advantage of a wave of growth for a few decades, or buy now at the top of that cycle and slide down from here on out?

    The future drivers of change will be the same as the previous century – only in reverse. The great industrial cities of the early twentieth century as well as the massive suburban megaplexes that came after them were only possible because of an underlaying high tide of cheap abundant resources, easy financing, complex national infrastructure, and highly organized and cohesive organizational structures. Those are the elements of expansion.

    But once the peak has been reached there’s a relentless contraction. The marginal return on investment goes negative as the cost of maintaining all the aging structures and wildly inefficient attenuated systems becomes overwhelming. The places that do best in a prolonged retreat from complexity are the ones with the greatest underlying local resource base and most cohesive social structures relative to their populations. The most complex places with the most critical dependencies will fail first as the tide recedes.

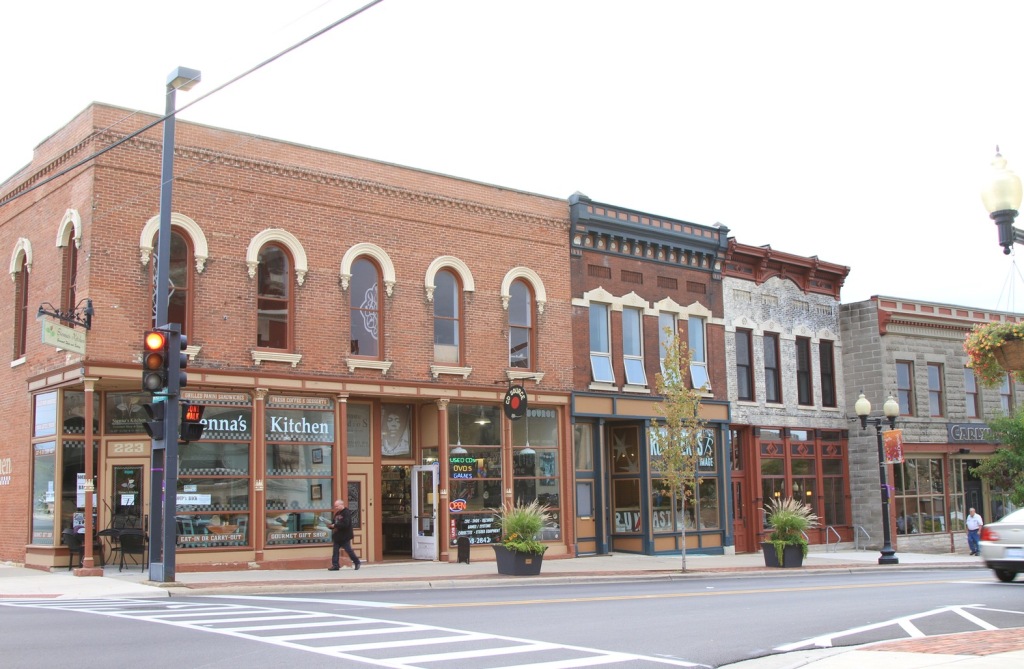
    The next Zombie Apocalypse will relentlessly dismantle superficial decorative landscapes and highly leveraged economies of scale. Take away the twelve thousand mile just-in-time supply chains, heavy debt loads, and limitless cheap resources and you get a very different world. Over the long haul Main Street has a pretty good chance of coming back along with the family farm. But the shorter term in-between period of adjustment to contraction is going to be rough as existing institutions attempt to maintain themselves at all costs.

    This piece first appeared on Granola Shotgun.

    John Sanphillippo lives in San Francisco and blogs about urbanism, adaptation, and resilience at granolashotgun.com. He’s a member of the Congress for New Urbanism, films videos for faircompanies.com, and is a regular contributor to Strongtowns.org. He earns his living by buying, renovating, and renting undervalued properties in places that have good long term prospects. He is a graduate of Rutgers University.

  • Ontario’s Labor & Housing Policies: US Midwest Opportunities?

    The Globe and Mail, a Canadian national newspaper, reports concerns raised by Magna International, Inc. that proposed provincial labor legislation (the “Fair Workplaces Better Jobs Act”) could result in seriously reduced economic competitiveness for Ontario, Canada’s most populous province (“Magna says new Ontario labour bill threatens jobs, investment”). Ontario accounts for about 40 percent of the Canadian economy and has approximately twice the gross domestic product of second ranking Québec. Magna is Canada’s largest employer in the automotive sector, which The Globe and Mail characterizes as “one of a handful of homegrown Canadian companies that have risen to the status of global giants.”

    Magna told the provincial parliamentary standing committee on finance that “For the first time in our 60 year history, we find ourselves in the very untenable position questioning whether we will be able to operate at historical levels in this province.” Stressing the need to remain competitive, the company added: “This is especially important when our main competitor to the south is working harder than ever to reduce costs, regulatory burdens and promote business efficiency and productivity. From our perspective, the province of Ontario seems to be moving in the opposite direction.”

    The proposed legislation would increase mandatory annual vacation and personal leave requirements and increase the minimum wage. The legislation would also reduce work scheduling flexibility. This would, according to Magna, make the “just in time” production “impossible,” in a North American industry that has used the practice to compete more effectively. According to Automotive News, Magna noted the difficulty of manufacturing where it calls the cost of electricity, payroll and pension costs and the provincial “cap and trade” policy are among the highest in the G-7. Magna said that the “Fair Workplaces Fair Jobs Act” is “extremely one-sided.

    At the same time that Ontario seems poised to make business investment more difficult, some key nearby US states are doing the opposite. Michigan, Indiana and Kentucky, all on the NAFTA Highway (Interstate 69) have enacted voluntary unionism laws (called “right to work”). Ohio has reduced taxes among the most of any state over the past five years. None of these states seems inclined to follow Ontario’s example. Another nearby regulation liberalizing state, Wisconsin (where voluntary unionism was also enacted), has just won the $10 billion first US plant to be built by China’s large electronics contractor Foxconn, edging out Ohio.

    Becoming Less Competitive: Ontario’s Housing Regulation

    Ontario’s competition threatening actions are not limited to business and labor policy. Land-use and housing policies are also making Ontario less competitive, first in the Toronto metropolitan area and now spreading across the province. About a decade ago, the province imposed its “Places to Grow” program that not one, but two urban containment boundaries. The highly publicized Greenbelt designates a huge swath of land on which development is not permitted.

    Then there is the second urban containment boundary, the “settlement boundary,” which largely ensures that new development is limited to a far smaller area around the urbanization, further intensifying the price-escalating impact of the Greenbelt. In this crazy quilt of regulation, land owners operate in a sellers’ market, able to drive prices up for their scarce holdings, to the detriment of home buyers. This environment is particularly welcome to speculators. Consistent with the fundamentals of economics, urban containment boundaries lead to higher land prices where new housing is permitted, and higher house prices.

    The procedures for supplying sufficient new greenfield development land require amendments of official community plans, a slow and cumbersome bureaucratic process. It is not surprising that Mattamy Homes Founder and CEO Peter Gilgin told Bloomberg that despite his largest homebuilding firm in the Toronto area having plenty of land for new houses, the necessary approvals are very difficult to obtain.

    The effects on house prices have been dramatic. In 2004, Toronto’s median house price was 3.9 times its median household income (median multiple). At that point, it had actually been reduced from 4.3 in 1971 and had hovered around 3.5 in the intervening years. According to the 13th Annual Demographia International Housing Affordability Survey, by 2016 house prices virtually doubled relative to incomes, with a median multiple of 7.7. This means a lower standard of living and greater relative poverty.

    Meanwhile, the house price increases are spreading from Toronto to nearby metropolitan areas. For example, house prices in Kitchener – Waterloo, Canada’s “Silicon Valley” rose 40 percent in the single year ended April 2017. This is nearly double the rate of Toronto that over the same period.

    The most recent domestic migration data indicates that people are moving out of the Toronto metropolitan area in droves. Since the 2011 census, more than 125,000 more people have left the Toronto area for other parts of Ontario that have moved in. This is the same dynamic apparent in the United States, where differentials in housing affordability have been cited as a principal reason for domestic migration gains and losses, as households flee from higher cost to lower-cost areas.

    A recently imposed foreign buyers tax led to somewhat lower prices in the Toronto area last year, but they are still 6.3 percent above a year ago and rising at a rate three times that of average earnings. Without restoring the competitive market for land on the periphery, it is likely that house prices will continue rising relative to incomes, to the detriment, in particular, of younger households.

    Meanwhile, house prices are substantially lower in US states nearby Ontario. As late as the mid-2000’s, there was little difference between the housing affordability across Ontario, including Toronto, and the Michigan, Ohio, Indiana and Kentucky. That is no longer the case.

    Immigration laws, however, do not permit the free movement of labor across the Canadian-US border, so there is no likelihood that Ontarians will move to the United States for lower cost housing. But capital is far more mobile. Companies that develop new business locations, especially manufacturing, often locate where they can maximize returns for their shareholders. Moreover, companies establishing new facilities are also interested in their employees being able to live close enough to commute to the plant.

    Figure 1 shows the metropolitan area housing affordability, measured by the median multiple, for Toronto, as well as major metropolitan areas in the four nearby states. Residents of Cleveland and Cincinnati pay nearly two-thirds less of their income for their houses than do residents of Toronto. In Indianapolis, Detroit, Grand Rapids, Columbus and Louisville, residents pay approximately 60 percent less for their houses than in Toronto. Meanwhile, no one should confuse the sometimes characterized as decrepit city of Detroit, reeling from decades of misgovernance, with its leafy suburbs, where 85 percent of the metropolitan area’s people live.

    Figure 2 indicates that things are a bit better among other Greater Golden Horseshoe metropolitan areas. Residents pay from 4.7 to 5.0 times their incomes in Brantford, Barrie and Peterborough. This is still up to double the 2.5 times incomes that residents pay in Toledo (Ohio) and Fort Wayne (Indiana). House prices are slightly higher in Dayton and Kalamazoo, but still at least than 40 percent below the three Ontario metropolitan areas.

    The Need for Competitive Policies

    Maintaining economic growth and the standard of living is important to Ontario’s 14 million people. At the same time, the world is becoming more competitive. Ontario needs to be careful, or economic development departments from across the increasingly competitive states of the Midwest could reap a harvest in business investment and jobs.

    Wendell Cox is principal of Demographia, an international public policy and demographics firm. He is a Senior Fellow of the Center for Opportunity Urbanism (US), Senior Fellow for Housing Affordability and Municipal Policy for the Frontier Centre for Public Policy (Canada), and a member of the Board of Advisors of the Center for Demographics and Policy at Chapman University (California). He is co-author of the “Demographia International Housing Affordability Survey” and author of “Demographia World Urban Areas” and “War on the Dream: How Anti-Sprawl Policy Threatens the Quality of Life.” He was appointed to three terms on the Los Angeles County Transportation Commission, where he served with the leading city and county leadership as the only non-elected member. He served as a visiting professor at the Conservatoire National des Arts et Metiers, a national university in Paris.

    Photograph: Pearson International Airport (Mississauga, Brampton and Toronto), Canada’s Largest employment centre (by author)

  • What’s the Future of Beleaguered Fossil Fuels Industry?

    Perhaps no economic issue — even trade — is as divisive as the energy industry. Once a standard driver of economic progress, the conventional energy industry has become increasingly vilified by the national media, sued by blue state attorneys general and denounced throughout academia. Some suggest that the industry should be demonized and hounded much as occurred in the case of tobacco.

    Yet, is this attack entirely justified? Unlike tobacco, energy is a huge economic driver, and conventional fossil fuel industries employ roughly 2 million people nationally, while hosts of industries — notably agriculture, manufacturing and warehousing — depend on reasonable energy prices and consistent delivery. Overall, fossil fuels last year accounted for 81 percent of all U.S. energy consumption.

    The one great exception is California, long a major oil-producing state, where fossil fuels are about as popular as herpes. In order to enhance its obsession with promoting climate “leadership” — likely to reduce emissions globally by a mere 0.4 percent by 2030 — the state has declared war on this industry, even though most Californians still depend on the gooey stuff, particularly for transportation. Once, we produced a lot of fossil fuel, but now we import a majority of it from abroad, taking an economic asset and turning it into a permanent deficit.

    Doom or future boom?

    In the past, advocates for “green energy” tied their agenda to concerns over “peak oil,” suggesting that renewables will save us from dependence on an increasingly scarce resource. More recently, given the huge increase in U.S. energy production, the argument has shifted to the notion that there’s too much oil, and that prices will not support the industry.

    Others suggest that the industry be undermined for environmental reasons. Yet, the reality is that most advanced countries — and developing countries even more so — depend heavily on coal, oil and gas. Some of these countries, like China, talk a good game, but continue to construct ever more coal plants, seek to buy more oil, including from the United States, and nurture an expanding automobile sector.

    Seeing the demand, frackers and offshore drillers have reason to stay in the game. Indeed, according to some projections, an improving global economy and a decline in production from the energy bust will drive prices up, perhaps to well over $100 a barrel, within the next three years.

    Prospects for energy-related development have been improved by the ascendency of the Trump administration, which has a strong fossil fuel constituency. Energy Secretary and former Texas Gov. Rick Perry wants to make the U.S. “dominant” in the global energy market. Increasing U.S. energy production also plays an important geopolitical role in challenging the power of global menaces such as Russia, Saudi Arabia, Iran and Venezuela.

    Read the entire piece at The Orange County Register.

    Joel Kotkin is executive editor of NewGeography.com. He is the Roger Hobbs Distinguished Fellow in Urban Studies at Chapman University and executive director of the Houston-based Center for Opportunity Urbanism. His newest book is The Human City: Urbanism for the rest of us. He is also author of The New Class ConflictThe City: A Global History, and The Next Hundred Million: America in 2050. He lives in Orange County, CA.

    Photo by Downtowngal (Own work) [CC BY-SA 3.0], via Wikimedia Commons

  • On the Outside, Looking In

    The urban political base that was the foundation of African-American politics since the Civil Rights Movement is slowly eroding. Because of large-scale demographic trends at work in our metro areas, black political influence is in decline. Unless blacks become more inclusive (or intersectional) in our political approach, or better at building coalitions, we risk having our political concerns relegated to the margins, by virtue of where we live.

    I said as much nearly three years ago (“How ‘Black = Urban’ Ends”) and in subsequent posts I wrote nearly two years ago about urban and suburban demographic trends and how that’s reflected in our metro areas. I haven’t updated the data, but think the trends are more evident now than ever.

    How can I make this claim? One measure is the number of elected African-American mayors in our nation’s largest cities.

    Let’s look at how thing have changed over the last 25 years. In 1992 four of the ten largest cities in the nation were led by black mayors (New York, Los Angeles, Philadelphia and Detroit). Some cities, like Chicago and Cleveland, had already elected black mayors but no longer had them; others, like Seattle, Denver, Kansas City, Memphis, Minneapolis and San Francisco, would elect their first black mayors before the end of the decade. In all, by 2000, 13 of the 25 largest U.S. cities at the time, and 19 of the 50 largest, either had or would have a black mayor in office.

    But the election of black mayors in large cities would slow greatly after 2000. Today, only six of the 50 largest cities (Houston, Denver, Washington, DC, Baltimore, Kansas City and Atlanta) currently have black mayors. Five more cities in the top 50 — San Antonio, Jacksonville, Columbus, Sacramento and Wichita — had black mayors whose terms started in 2000 or later, but have since been replaced (most recently former San Antonio Mayor Ivy Taylor, just last month).

    Let’s be clear about a couple things, however. While the numbers of black mayors of large cities has declined over the last 25 years, the leadership of our cities is far more diverse — and representative — than it was then. There are more Latino, Asian and women mayors leading our large cities than ever before, and that’s a positive. But that doesn’t change the fact that there are fewer blacks in those positions.

    And while the election of big city mayors is relatively easy to track, identifying trends among other local officials is far more difficult. My guess is that city councils, county boards, special service districts and the like are also more diverse and representative, and may even have more African-Americans in those positions — even as the number of black mayors has declined. That also can be viewed as a positive.

    The Explanation

    How can this be explained? Two years ago I pulled some Census Bureau ACS data for the twenty largest U.S. urbanized areas (the contiguous portions of metro areas with more than 1,000 people per square mile) that offered some interesting findings:

    • Nationally, principal cities and their suburbs both grew at 4.4% between 2010 and 2014.

    • Metro area population growth is driven by strong growth among Hispanics, Asians and other groups.

    • Within urbanized areas, however, whites and blacks are growing at much slower rates – blacks at 4.0%, whites at just 0.3% nationwide.

    • Within the twenty largest urbanized areas, the number of white residents is growing in principal cities and decreasing in suburbs.

    • Similarly, the number of black residents in growing in suburbs, and essentially flat in principal cities.

    • At the metro level, 12 of the top 20 metro areas have principal cities where the white population is increasing while the black population is decreasing, or where the growth rate of whites exceeds that of blacks.

    • Similarly, 19 of the top 20 metro areas have suburbs where the black population is increasing while the white population is decreasing, or where the growth rate of whites exceeds that of whites.

    • Here’s how that information looks graphically. First, for whites, blacks, Hispanics, Asians and others, at the national level by city and suburban geography:

    And then, a focus in on whites and blacks nationally, by city and suburban geography:

    Now, let’s look at percentage changes of whites and blacks within the principal cities of the twenty largest urbanized areas:


    And lastly, at percentage changes of whites and blacks in suburban areas of the top 20:


    This data is in need of updating, and there is the question of whether trends evident within the top 20 urban areas are applicable to smaller ones. I’ll try to answer both when I can. In the meantime, simply put, Latino and Asian populations are growing in the largest cities and suburbs. Whites are growing more numerous in cities while declining in suburbs, while blacks are declining in cities and growing in suburbs.

    This is the first part of understanding the change in African-American political influence.

    Much of this seems to slip under the radar of urbanists, because of the second part of trying to understand this — your level of analysis impacts your ability to perceive, and evaluate, the trend. At the metro level, we see that suburbs are becoming more diverse as they add more people of color and cities see a return of white residents to core cities. After generations of practices put in place to exclude people of color from suburbs, this is applauded. But at the neighborhood level, it could be viewed quite differently — an influx of minorities where none previously existed in the suburbs, or an influx of whites in minority-dominated neighborhoods. Only one of these trends at the neighborhood level has truly been considered by most urbanists.

    Speaking of which — I want to dispel any notion that displacement related to gentrification plays a dominant role in this. That’s the narrative that’s fueled gentrification debates for years. But rarely does this narrative consider the aspirational appeal of moving to the suburbs that still resonates with many people of color, just as it did with earlier generations of whites in the 20th century. Lance Freeman, a professor of urban planning at Columbia University, has conducted considerable research that counters this assumption:

    “What distinguishes gentrification is not who moves out; it’s who moves in. In a gentrifying neighborhood, new residents are more likely to be well-off . As a result, the neighborhood’s poverty makeup can shift, even if no one leaves. In 2004, I found that a neighborhood’s poverty rate could drop from 30 percent to 12 percent in a decade with minimal displacement. That’s because gentrification often leads to new construction or to investment in once-vacant properties.”

    Thinking that gentrifiers are forcing this dynamic magnifies their importance, and diminishes the decision-making process of people of color.

    The Impact

    Back to politics. What will this mean going forward, given what we know about how cities are changing the political landscape? We know that cities are pushing forward to develop an urban political agenda; in the aftermath of the election of Donald Trump to the presidency, a key recommendation of Richard Florida’s book The New Urban Crisis was that cities should become more autonomous so they can more effectively address the challenges that impact them. But with increasing numbers of minorities in suburbia, and a growing number of urbanists who have “been there, done that” when it comes to the suburbs, does autonomy come at a price?

    Here’s how I see things playing out over the next decade or two. People of color will continue to move to suburbia in increasing numbers. They will do so for the same reasons people before them did — affordability, good schools, lower crime. They are doing so in part because suburbia is something that eluded them for so long, and is now within their grasp. As they move in, they will begin to wield more influence on suburban politics — suburban mayors, County Board representatives, more representation in state legislatures. We will see more minority representation in the suburbs — just as suburban political influence wanes.

    Why? Because cities are ascendant. It’s not just people flowing back into cities. It’s jobs, and it’s money. More and more people in residential and commercial real estate are finding out that the real money to be made is now in cities. Banks will change lending patterns to favor cities, and not suburbs. The case will be made — and rightly so — that urban density is the right response to lowering carbon emissions in a climate change world, and those who choose density will be rewarded. At the same time, those who choose sprawl will be punished. Banks won’t finance new development or renovations. Property values will decline. Tax dollars for infrastructure improvements will be harder to come by.

    I hardly see this happening to all suburban areas across the country. There are suburbs in some metro areas that are closely aligned with the core city (either by adjacency or transit) and will adapt accordingly. There are pockets of affluence in many suburbs that will not change, no matter what broader trends portend. There are other metro areas whose entire makeup is largely suburban in orientation, and any change they have will more likely be region-wide. As for metro areas with a bigger city-suburban divide, over time I see wealth being pulled from suburbia and back into cities in quite the same way it happened in the middle of the 20th century, in reverse. Minority political representation will continue to decline in cities and increase in suburbs — and they’ll find they own a landscape few people want.

    In other words, even as people of color are making decisions that work in their interests now, we may need to get accustomed to a future of being on the outside, looking in.

    This piece originally appeared on The Corner Side Yard.

    Pete Saunders is a Detroit native who has worked as a public and private sector urban planner in the Chicago area for more than twenty years.  He is also the author of “The Corner Side Yard,” an urban planning blog that focuses on the redevelopment and revitalization of Rust Belt cities.

    Photo: huffingtonpost.com

  • Still Set to Depopulate, Japan Raises Long Term Population Projection

    Japan is well known for its huge expected population loss, likely to be the greatest in the world for a major nation by the end of the century. However, things do not look as bleak as they did just five years ago. The National Institute of Population and Social Security Research (Japan) just released its 100 year population national projections based upon the results of the 2015 census, which is an update of the 2012 projections based on the 2010 census. The projections are virtually identical until 2040, when Japan’s population is expected to be approximately 107 million, down from the 2015 level of 127 million. After that time, however, the population loss is expected to moderate. By 2110, the population under the medium fertility/medium mortality scenario is projected to be 53.4 million, down more than 70 million from the 2010 peak of 128 million (Figure 1). This is more than 10 million higher than projections released in 2012, which anticipated 42.9 million residents in 2110, approximately equal to the population of the Nagoya metropolitan area (prefecture based).

    The Largest Cities

    Projections are not available beyond 2040 below the national level. However, the latest 2040 prefectural population projections, based on the 2010 census, give an idea of how the loss is likely to be distributed in the early years.

    Japan has four cities (metropolitan areas) with more than 5 million residents that can be roughly delineated by prefectural boundaries, Tokyo – Yokohama, Osaka – Kobe – Kyoto, Nagoya and Fukuoka –Kitakyushu. These areas are expected to do much better in future population trends than the rest of the nation.

    Figure 2 provides a comparison of the actual populations from 1980 to 2010 for these cities, along with projections to 2040. Tokyo – Yokohama retains the largest share of its population, falling 11.0 percent from its peak. This includes the prefectures of Tokyo, Kanagawa, Saitama, Chiba, Ibaraki, Toshigi, Gunma and Yamanishi. In 1980, Tokyo – Yokohama had a population of 36.7 million, which rose to 43.5 million in 2010 and is expected to fall to 38.7 million by 2040.

    With strong growth continuing in places like Jakarta, Delhi and Manila, it seems unlikely that Tokyo – Yokohama will retain its “largest city in the world” status. Guanghou – Foshan – Shenzhen – Dongguan and the rest of the Pearl River Delta may also emerge as a larger metropolitan area should high levels of commuting develop (metropolitan areas are normally delineated by commuting patterns).

    The second largest city, Osaka – Kobe – Kyoto is expected to do more poorly, with the loss of 16.5 percent. Osaka – Kobe – Kyoto includes the prefectures of Osaka, Hyogo, Kyoto and Nara. In 1980, Osaka – Kobe – Kyoto had a population of 17.4 million, which rose to 18.5 million in 2010 and is expected to fall to 15.4 million by 2040.

    Nagoya, the third largest city, does nearly as well as Tokyo – Yokohama, losing 11.7 percent of its population. This includes the prefectures of Aichi, Gifu and Mie. In 1980, Nagoya had a population of 9.8 million, which rose to 11.3 million in 2010 and is expected to fall to 10.0 million by 2040.

    Fukuoka – Kitakyushu (Fukuoka prefecture) is expected to lose 13.7 percent of its population between 2010 and 2040. In 1980, Fukuoka – Kitakyushu had a population of 4.6 million, which rose to 5.1 million in 2010 and is expected to fall to 4.4 million by 2040.

    The population losses in the rest of the nation are expected to be more severe, at 21.2 percent. Outside the four largest cities, there was a 1980 population of 54.1 million, which rose to 54.8 million in 2010 and is expected to fall to 43.1 million by 2040.

    2040 Prefecture Projections

    Among the country’s 47 prefectures, only two are outside the four largest cities. Okinawa would lose the least population, 2.9 percent (Table). Shiga, which is sandwiched between Osaka – Kobe – Kyoto and Nagoya would have the second lowest population loss at 7.8 percent, just above that of Tokyo Prefecture, which is at the core of Tokyo-Yokohama. Fourth ranked Aichi is the core prefecture of Nagoya. Kanagawa and Saitama are in Tokyo – Yokohama, and Fukuoka includes Fukuoka – Kitakyushu. Chiba is in Tokyo – Yokohama, ninth-ranked Myagi includes the large city of Sendai, with 10th-ranked Kyoto being a part of the Osaka – Kobe – Kyoto metropolitan area. Osaka, the core prefecture of Osaka – Kobe – Kyoto ranks 12th. Generally, the core areas are expected to retain their population better than the more outlying areas.

    The prefectures with the largest losses tend to be more rural. The greatest losses are projected to be in on the northern part of Honshu (the main island), in Akita (31.6 percent), Amore (28.6 percent) and Iwate (25.9 percent). Kochi, on the island of Shikoku would have the third greatest loss, at 26.5 percent (See Japan Prefecture map – Figure 3).

    Conjectural Projections

    A “what if” analysis was performed to conjecture about what Japan might look like below the national level by 2110, when its 53 million population is projected to be nearly 60 percent below the 2010 peak. A population change factor was computed averaging the share of population losses for each prefecture from 2020 to 2040 and the overall share of the population expected to be in each prefecture in 2040.

    The “what if” scenario suggests that population losses in each of the largest cities will be more than 50 percent from 2010, the population losses in Tokyo-Yokohama and Nagoya would be just under 50 percent. Fukuoka – Kitakyushu would lose 54 percent, while Osaka – Kobe – Kyoto would drop nearly 60 percent (Figure 4). Each of these, however, would be far better than the rest of the nation, with a decline of nearly 70 percent.

    However, at the prefectural level, prefectures without larger cities would drop even more (Table). Only Okinawa, Shiga, Tokyo, Aichi and Kanagawa would lose less than half their population. At the other end of the scale, Akita, Amore, Kochi and Iwate would lose 80 to 90 percent of their population.

    However, the population loss is distributed. The Japan of 2110 is likely to be radically different than today. At the same time, population projections are no more than projections and no one can know the future for sure. But Japan seems likely to face serious challenges from population losses in the decades to come, perhaps a harbinger of what can happen in an increasingly post-familial world.

    By Tokyoship (Own work) [Public domain], via Wikimedia Commons

    Japan: Population by Prefecture 2010 to 2040 Projection and 2110
    Rank Prefecture 2010 Census 2040 Projection Change from 2010 2110 Comectural Change from 2010
    1 Okinawa 1.393 1.369 -2.9% 0.950 -31.8%
    2 Shiga 1.411 1.309 -7.8% 0.813 -42.4%
    3 Tokyo 13.159 12.308 -7.8% 7.606 -42.2%
    4 Aichi 7.411 6.856 -8.2% 4.199 -43.3%
    5 Kanagawa 9.048 8.343 -8.8% 5.004 -44.7%
    6 Saitama 7.195 6.305 -12.5% 3.397 -52.8%
    7 Fukuoka 5.072 4.379 -13.2% 2.339 -53.9%
    8 Chiba 6.216 5.358 -13.5% 2.790 -55.1%
    9 Miyagi 2.348 1.973 -14.4% 1.003 -57.3%
    10 Kyoto 2.636 2.224 -15.0% 1.116 -57.7%
    11 Hiroshima 2.861 2.391 -15.4% 1.191 -58.4%
    12 Osaka 8.865 7.454 -15.4% 3.670 -58.6%
    13 Ishikawa 1.170 0.974 -15.5% 0.484 -58.6%
    14 Hyogo 5.588 4.674 -15.5% 2.303 -58.8%
    15 Okayama 1.945 1.611 -15.8% 0.796 -59.1%
    16 Tochigi 2.008 1.643 -16.7% 0.778 -61.2%
    17 Ibaraki 2.970 2.423 -17.1% 1.127 -62.1%
    18 Mie 1.855 1.508 -17.2% 0.704 -62.0%
    19 Gunma 2.008 1.630 -17.3% 0.756 -62.4%
    20 Kumamoto 1.817 1.467 -17.4% 0.687 -62.2%
    21 Saga 0.850 0.680 -17.8% 0.313 -63.1%
    22 Shizuoka 3.765 3.035 -17.9% 1.368 -63.7%
    23 Oita 1.197 0.955 -18.3% 0.429 -64.1%
    24 Gifu 2.081 1.660 -18.5% 0.733 -64.8%
    25 Miyazaki 1.135 0.901 -18.7% 0.398 -64.9%
    26 Fukui 0.806 0.633 -19.3% 0.272 -66.3%
    27 Nara 1.401 1.096 -20.0% 0.447 -68.1%
    28 Nagano 2.152 1.668 -20.2% 0.689 -68.0%
    29 Kagawa 0.996 0.773 -20.2% 0.317 -68.2%
    30 Kagoshima 1.706 1.314 -20.3% 0.546 -68.0%
    31 Yamanashi 0.863 0.666 -20.5% 0.271 -68.6%
    32 Toyama 1.093 0.841 -20.9% 0.331 -69.7%
    33 Hokkaido 5.506 4.190 -21.8% 1.558 -71.7%
    34 Niigata 2.374 1.791 -22.0% 0.671 -71.7%
    35 Tottori 0.589 0.441 -22.2% 0.165 -72.0%
    36 Ehime 1.431 1.075 -22.3% 0.397 -72.3%
    37 Fukushima 2.029 1.485 -22.3% 0.491 -75.8%
    38 Nagasaki 1.427 1.049 -23.5% 0.363 -74.6%
    39 Yamaguchi 1.451 1.070 -23.5% 0.369 -74.6%
    40 Shimane 0.717 0.521 -24.2% 0.174 -75.7%
    41 Tokushima 0.785 0.571 -24.4% 0.185 -76.4%
    42 Yamagata 1.169 0.836 -25.1% 0.263 -77.5%
    43 Wakayama 1.002 0.719 -25.2% 0.222 -77.8%
    44 Iwate 1.330 0.938 -25.9% 0.273 -79.5%
    45 Kochi 0.764 0.537 -26.5% 0.151 -80.3%
    46 Aomori 1.373 0.932 -28.6% 0.211 -84.6%
    47 Akita 1.086 0.700 -31.6% 0.109 -90.0%
    2010 and 2040 data from the National Institute for Population & Social Security Research
    2110 dsta from Demographia. See text.

    Wendell Cox is principal of Demographia, an international public policy and demographics firm. He is a Senior Fellow of the Center for Opportunity Urbanism (US), Senior Fellow for Housing Affordability and Municipal Policy for the Frontier Centre for Public Policy (Canada), and a member of the Board of Advisors of the Center for Demographics and Policy at Chapman University (California). He is co-author of the “Demographia International Housing Affordability Survey” and author of “Demographia World Urban Areas” and “War on the Dream: How Anti-Sprawl Policy Threatens the Quality of Life.” He was appointed to three terms on the Los Angeles County Transportation Commission, where he served with the leading city and county leadership as the only non-elected member. He served as a visiting professor at the Conservatoire National des Arts et Metiers, a national university in Paris.

    Photo: Fukuoka (by author)

  • Why the Greens Lost, and Trump Won

    When President Trump pulled out of the Paris climate accords, embraced coal, and stacked his administration from people from fossil-fuel producing states, the environmental movement reacted with near-apocalyptic fear and fury. They would have been better off beginning to understand precisely why the country has become so indifferent to their cause, as evidenced by the victory not only of Trump but of unsympathetic Republicans at every level of government.

    Yet there’s been little soul-searching among green activists and donors, or in the generally pliant media since November about how decades of exaggerated concerns—about peak oil, the “population bomb,” and even, a few decades back, global cooling—and demands for economic, social, and political sacrifices from the masses have damaged their movement.

    The New Religion and the Next Autocracy

    Not long ago, many greens still embraced pragmatic solutions—for example substituting abundant natural gas for coal—that have generated large reductions in greenhouse gas emissions. Rather than celebrate those demonstrable successes, many environmentalists began pushing for a total ban on the development of fossil fuels, including natural gas, irrespective of the costs or the impact on ordinary people.

    James Lovelock, who coined the term “Gaia,” notes that the green movement has morphed into “a religion” sometimes marginally tethered to reality. Rather than engage in vigorous debate, they insist that the “science is settled” meaning not only what the challenges are but also the only acceptable solutions to them. There’s about as much openness about goals and methods within the green lobby today as there was questioning the existence of God in Medieval Europe. With the Judeo-Christian and Asian belief systems in decline, particularly among the young, environmentalism offers “science” as the basis of a new theology.

    The believers at times seem more concerned in demonstrating their faith than in passing laws, winning elections or demonstrating results. So with Republicans controlling the federal government, greens are cheering Democratic state attorney generals’ long-shot legal cases against oil companies. The New York TimesThomas Friedman has talked about dismissing the disorder of democracy as not suited to meeting the environmental challenges we face, and replacing it with rulers like the “reasonably enlightened group of people” who run the Chinese dictatorship.

    After Trump pulled the U.S. out of the Paris climate accord, China was praised, bizarrely, as the great green hope. The Middle Kingdom, though, is the world’s biggest and fastest grower emitter, generating coal energy at record levels. It won’t, under Paris, need to cut its emissions till 2030. Largely ignored is the fact that America, due largely to natural gas replacing coal, has been leading the world in GHG reductions.

    Among many greens, and their supports, performance seems to mean less than proper genuflecting; the Paris accords, so beloved by the green establishment, will make little impact on the actual climate, as both rational skeptics like Bjorn Lomborg and true believers like NASA’s James Hanson agree. In this context, support for Paris represents the ultimate in “virtue signaling.” Ave Maria, Gaia.

    The California Model

    The cutting edge for green soft authoritarianism, and likely model after the inevitable collapse of the Trump regime, lies in California. On his recent trip with China, Brown fervently kowtowed to President Xi Jinping. Brown’s environmental obsessions also seems to have let loose his own inner authoritarian, as when he recently touted “the coercive power of the state.”

    Coercion has its consequences. California has imposed, largely in the name of climate change, severe land use controls that have helped make the state among the most unaffordable in the nation, driving homeownership rates to the lowest levels since the 1940s, and leaving the Golden State with the nation’s highest poverty rate.

    The biggest losers from Brown’s policies have been traditional blue collar, energy-intensive industries such as home building, manufacturing, and energy. Brown’s climate policies have boosted energy prices and made gas in oil-rich California about the most expensive in the nation. That doesn’t mean much to the affluent Tesla-driving living in the state’s more temperate coast, but it’s forced many poor and middle-class people in the state’s less temperate interior into “energy poverty,” according to one recent study.

    That, too, fits the climatista’s agenda, which revolves around social engineering designed to shift people from predominately suburban environments to dense, urban and transit dependent ones. The state’s crowded freeway are not be expanded due to a mandated “road diet,” while local officials repeatedly seek to reduce lanes and “calm traffic” on what are already agonizing congested streets. In this shift, market forces and consumer preferences are rarely considered, one reason these policies have stimulated much local opposition—and not only from the state’s few remaining conservatives.

    California’s greens ambitions even extend to eating habits. Brown has already assaulted the beef producers for their cattle’s flatulence. Regulators in the Bay Area and local environmental activists are proposing people shift to meatless meals. Green lobbyists have already convinced some Oakland school districts to take meat off the menu. OK with me, if I get the hamburger or taco-truck franchise next to school when the kids get out.

    Sadly, many of these often socially harmful policies may do very little to address the problem associated with climate change. California’s draconian policies fail to actually do anything for the actual climate, given the state’s already low carbon footprint and the impact of people and firms moving to places where generally they expand their carbon footprint. Much of this has taken on the character of a passion play that shows how California is leading us to the green millennium.

    Goodbye to the Family

    An even bigger ambition of the green movement—reflecting concerns from its earliest days—has been to reduce the number of children, particularly in developed countries. Grist’s Lisa Hymas has suggested that it’s better to have babies in Bangladesh than America because they don’t end up creating as many emissions as their more fortunate counterparts. Hymas’ ideal is to have people become GINKs—green inclinations, no kids.

    Many green activists argue that birth rates need to be driven down so warming will not “fry” the planet. Genial Bill Nye, science guy, has raised the idea of enforced limits on producing children in high-income countries. This seems odd since the U.S. already is experiencing record-low fertility rates, a phenomenon in almost all advanced economies, with some falling to as little as half the “replacement rate” needed to maintain the current population. In these countries, aging populations and shrinking workforces may mean government defaults over the coming decades.

    The demographic shift, hailed and promoted by greens, is also creating a kind of post-familial politics. Like Jerry Brown himself, many European leaders—in France, Germany, Sweden, the United Kingdom, and the Netherlands—are themselves childless. Their attitude, enshrined in a EU document as “no kids, no problem” represents a breathtaking shift in human affairs; it’s one thing to talk a good game about protecting the “next generation” in the collective abstract, another to experience being personally responsible for the future of another, initially helpless, human being.

    Do As We Say, Not How We Live

    The pressing need to change people’s lives seems intrinsic now to green theology. Without penance and penalties, after all, there is no redemption from original sin. In the process, it seems to matter little if we undermine the great achievements of our bourgeois economy—expanded homeownership, greater personal mobility, the ability to rise to a higher class—if it signals our commitment to achieve a more earth-friendly existence.

    The left-wing theorist Jedidiah Purdy has noted that “mainstream environmentalism overemphasizes elite advocacy” at the expense of issues of economic equity, a weakness that both Trump and the GOP have exploited successfully, particularly in the Midwest, the South, and Intermountain West. Some greens object even to the idea of GDP growth at a time when most Americans are seeing their standard of living drop. No surprise then that the green agenda has yet to emerge from the basement of public priorities, which remain focused on such mundanities as better jobs, public safety, and decent housing.

    To further alienate voters, many green scolds live far more lavishly than the people they are urging to cut back. Greens have won over a good portion of the corporate elite, many of whom see profit in the transformation as they reap subsidies for “green” energy, expensive and often ineffective transit and exorbitant high-density housing. Most notable are the tech oligarchs, clustered in ultra-green Seattle and the Bay Area, who depend on massive amounts of electricity to run their devices, but have reaped huge subsidies for green energy.

    The tech oligarchs have little interest in family friendly suburbs, preferring the model of prolonged adolescence in largely childless places like college campuses and San Francisco. Oligarchs such as Mark Zuckerberg live in spacious and numerous houses, even while pressing policies that would push everyone without such a fortune to downsize. Richard Branson, another prominent green supporter, may not like working people’s SUVs, but he’s more than willing to sponsor climate change events on a remote Caribbean island reachable only by private plane. One does not even need to plumb the hypocrisy of Al Gore’s jet-setting luxurious lifestyle.

    In the manner of Medieval indulgences these mega emissions-generators claim to pay for their carbon sins by activism, buying rain forests and other noble gestures. Hollywood, as usual, is particularly absurd, with people like Leonardo di Caprio flying in his private jet across country on a weekly basis. Living in Malibu, Avatar director James Cameron sees skeptics as “boneheads” who will have “to be answerable” for their dissidence, suggesting perhaps a shootout at high noon.

    In the end, the greens and their wealthy bankrollers may find it difficult to prevail as long as their agenda makes people poorer, more subservient, and more miserable; this disconnect is, in part, why the awful Donald Trump is now in the White House. Making progress on climate change, and other environmental concerns, remains a critical priority, but it needs to explore ways humans, through ingenuity and innovation, can meet these challenges without undermining what’s left of our middle class and faded democratic virtue.

    This piece originally appeared on the Daily Beast.

    Joel Kotkin is executive editor of NewGeography.com. He is the Roger Hobbs Distinguished Fellow in Urban Studies at Chapman University and executive director of the Houston-based Center for Opportunity Urbanism. His newest book is The Human City: Urbanism for the rest of us. He is also author of The New Class ConflictThe City: A Global History, and The Next Hundred Million: America in 2050. He lives in Orange County, CA.

    Photo by Joe Flood, via Flickr, using CC License.

  • Transit’s Precipitous Decline

    Transit ridership in the first quarter of 2017 was 3.1 percent less than the same quarter in 2016, according the American Public Transportation Association’s latest ridership report. The association released the report without a press release, instead issuing a release complaining about the House Appropriations bill reducing funding for transit.

    The ridership report is devastating news for anyone who believes transit deserves more subsidies. Every heavy-rail system lost riders except the PATH trains between Newark and Manhattan and the Patco line between Camden and Philadelphia. Commuter rail did a little better, mainly because of the opening of Denver’s A line and trend-countering growth of riders on the Long Island Railroad. Most light-rail lines lost riders, though surprisingly many streetcar lines gained riders.

    In most cases where light-rail ridership grew, it did so at the expense of bus ridership. Los Angeles Metro gained 1.66 million light-rail riders but lost 8.73 million bus riders, or more than five for every new light-rail rider. Between the two modes, Phoenix’s Valley Metro lost 23,100 riders; Charlotte 20,200 lost riders; and Dallas Area Rapid Transit lost 193,100 riders. Similarly, Orlando’s commuter trains gained 22,700 riders but buses lost 98,500.

    Houston and Minneapolis-St. Paul lost bus riders but not quite as many as they gained in light-rail riders. Houston gained 192,100 light-rail riders but lost 154,200 bus riders. Minneapolis gained 337,000 light-rail riders but lost 270,000 bus riders. Only Seattle scored a large increase in light-rail riders (thanks to an expensive new line that opened March 16, 2016) without an offsetting decline in bus ridership.

    Many individual transit agencies suffered particularly catastrophic declines. Broward County (Fort Lauderdale), which wants to build a $200 million streetcar line, lost 12.8 percent of its transit riders. San Jose’s VTA, the agency I’ve sometimes called the worst-managed transit agency in the country, lost 11.9 percent. Birminghan lost 9.8 percent; Cleveland lost 7.9 percent; and San Diego lost 6.2 percent. In San Francisco, Muni lost 6.4 percent, BART lost 5.6 percent, SamTrans lost 8.9 percent, AC Transit (Oakland) lost 0.8 percent, and Central and Eastern Contra Costa County lost more than 7.0 percent.

    One factor contributing to the losses might be that 2016 was leap year, so its first quarter had 1.1 percent more days than 2017. But both quarters had exactly the same number of work days (62 or 64 depending on whether you count King’s Birthday and President’s Day as holidays or work days), so leap day counted for less than it might have.

    Many of these losses are just a continuation of trends that began in 2009 or earlier. As the Antiplanner noted last month, several major transit agencies lost 25 to 35 percent of their riders between 2009 and 2016, and most of these continued to lose in 2017. Moreover, none of the factors that led to these declines–low fuel prices, high auto ownership rates, rising costs, increasing competition from ride-hailing services–are going away, and some are only going to get worse.

    Since 1970s, the transit industry has received well over a trillion dollars in subsidies while seeing a 20 percent drop in the average number of rides urban resident take each year. All this should lead Congress and state legislatures to question why taxpayers ought to continue subsidizing this fast declining industry.

    This piece first appeared on The Antiplanner.

    Randal O’Toole is a senior fellow with the Cato Institute specializing in land use and transportation policy. He has written several books demonstrating the futility of government planning. Prior to working for Cato, he taught environmental economics at Yale, UC Berkeley, and Utah State University.

    Photo by METRO96 [CC BY-SA 3.0], via Wikimedia Commons

  • Capitalism Did Not Win the Cold War

    When the Soviet Union collapsed 26 years ago, it was generally agreed that the West had won the Cold War. This was affirmed by the prosperity and possibilities awaiting citizens of Western countries, as opposed to the political and economic stagnation experienced by those in Communist states. A natural conclusion, much repeated at the time, was that capitalism had finally defeated communism.

    This sweeping statement was only partially true. If one took capitalism and communism as the only two protagonists in the post–World War II struggle, it was easy to see that the latter had suffered a mortal blow. But there was a third, stealthier protagonist situated between them. This was a system best identified today as cronyism. For if capitalism did win over the other two contenders in 1991, its victory was short-lived. And in the years that have followed, it is cronyism that has captured an ever-increasing share of economic activity. A survey of the distribution of power and money around the world makes it clear: cronyism, not capitalism, has ultimately prevailed.

    Defining Cronyism

    What is cronyism? In a previous article, I objected to the term “crony capitalism” on the grounds that cronyism is itself antithetical to the principles of capitalism and ought not be viewed as a derivative of it. Cronyism is, rather, a separate system that fallsbetween capitalism and state-controlled socialism. When a country drifts from capitalism toward socialism, the transitional period is one in which cronies rule the land.

    Transitional cronyism claims to be capitalistic, whereas socialism claims to be egalitarian. But they are very similar, except for the size of the group of cronies at the top. In cronyistic societies, a larger group extracts a growing share of society’s wealth for themselves and their associates. In socialistic systems, a smaller group vies savagely for wealth and power: because putatively egalitarian economies are usually less efficient at generating wealth, there may be less to go around, making the infighting among socialist leaders that much more bitter.

    Read the entire piece at Foreign Policy.

    Sami Karam is the founder and editor of populyst.net and the creator of the populyst index™. populyst is about innovation, demography and society. Before populyst, he was the founder and manager of the Seven Global funds and a fund manager at leading asset managers in Boston and New York. In addition to a finance MBA from the Wharton School, he holds a Master’s in Civil Engineering from Cornell and a Bachelor of Architecture from UT Austin.

    Photo: Agência Brasil Fotografias [CC BY 2.0], via Wikimedia Commons

  • Texas Way of Urbanism

    Texas cities may well be the cutting edge of American urban life. Here are two videos by Amanda Horvath that reflect the reporting done in the recent Texas Way of Urbanism report from the Center for Opportunity Urbanism.

    One of these videos deals with San Antonio, the other Austin.

  • Deep Ellum

    I recently wrote about the need to embrace reality when it comes to land use regulation, culture, politics, and economics. My interpretation can seem a bit… dark. It’s not my intention to discourage people looking to make a positive difference in their communities. I’ve just seen how things tend to play out and the process doesn’t exactly favor mom and pop operations that are juggling day jobs, raising kids, and working on limited budgets. Telling motivated individuals to go out into the world and build great new small scale walkable mixed use urbanism of the kind once found on every Main Street in North America is disingenuous. Yes, it’s “possible.” But it’s also incredibly unlikely in most places. Building from scratch or even modifying existing properties isn’t the answer for these folks. We need to be honest about that.

    I’ll use the Deep Ellum neighborhood in Dallas as an example. A few years ago I was in Dallas to attend a series of overlapping city planning conferences. Deep Ellum was a recurring theme and a number of events were held there as demonstration projects. Back in 1973 city officials bulldozed most of the neighborhood to make way for a massive elevated highway. Urban removal killed two birds with one stone. State and federal money provided commuter infrastructure that supported the ever growing new middle class suburbs on the edge of town while simultaneously wiping away blight near downtown. What’s not to love? (Anyone want to guess who lived in Deep Ellum before it was razed?)

    Dallas locals like Jason Roberts of Build a Better Block as well as fellow participants from out of state like Street Plans Collaborative advocate fast, cheap, temporary, and iterative programming for neglected neighborhoods. Potted plants, inexpensive outdoor furniture, food trucks, street vendors, bicycle accommodations, string lights, outdoor movie nights, and live music can reactivate otherwise dead streets, vacant lots, and disused storefronts. If done sensitively with the active participation of the people who already live in the neighborhood these techniques can be transformative. The goal is to discover what works and build upon those successes incrementally over time. It’s bootstrap urban revival on a shoestring budget.

    These days market demand for urban living is strong and there’s money to be made in redeveloping what’s left of these old neighborhoods. They have “authenticity” and “texture” that can’t be duplicated in new construction. Deep Ellum is well located within walking and biking distance of the central business district as well as Baylor University Medical Center. There’s a spread between what these buildings are now and what they could be with new investment and institutional support.

    While I was in town conference hopping I attended a side presentation organized by a group of prominent business leaders who advocate pulling down the highway that cuts through Deep Ellum. This meeting was held at the behest of the American Conservative and D Magazine populated by a lot of old white guys in suits, not crunchy hippie treehuggers.

    The business argument is simple. The aging highway is at the end of its design life and neither the city of Dallas nor the Texas Department of Transportation has the money to rebuild it since both are functionally insolvent. Dismantling the highway would liberate a huge amount of downtown land that could be redeveloped by the private sector. Construction jobs would be created up front, market demand for urban living would be satisfied, and substantial tax revenue would be generated for the city for many decades into the future. In other words, a cost center would become a profit center.

    And let’s not forget there’s a tremendous amount of money to be made for well placed developers with deep pockets. Hence all the wine and cheese gatherings and thought leaders with their PowerPoints. I hasten to add this isn’t corruption per se. The cost in time, money, and political wrangling is enormous. Only exceptionally well funded organizations can work their way through these endless processes and achieve any kind of worthwhile goal. Why would anyone bother if there wasn’t an equally massive payoff at the end?

    The reality of how land is redeveloped in this context is simple. The cost of buying distressed property, site remediation, upgrading the infrastructure, accommodating all the requirements of multiple bureaucracies from the fire marshal to institutional investors – all while still creating a product the market wants and can actually afford to pay for… leads to this. It’s referred to as the Texas Doughnut. It’s an entire city block of multi-storied parking garages wrapped in a skin of apartments. Sometimes they’re rentals, sometimes they’re condos for sale. If your goal is to recreate the fine grained individually owned mom and pop buildings of a previous century that’s just not going to happen. Again, it’s not impossible. It’s just highly unlikely to pan out for a dozen reasons having to do with the fact that the society that build Main Street no longer exists.

    So let’s go back to the smaller older existing buildings in Deep Ellum. These are at a scale an average family can wrap its mind around. Lots of people dream of owning an independent business and living upstairs. It’s a great arrangement that’s been used successfully for eons all around the world. But there are complications here. The most pragmatic way to purchase and renovate buildings like these is with cash. Some people have it. Most don’t. Private equity (A.K.A. asking your father-in-law or a collection of dentists and chiropractors from the country club for money) works if you have that kind of personal situation and charisma…

    Don’t expect to go to just any random bank and get a thirty year mortgage for one of these places. Almost all banks see such properties as “non-conforming.” They’re used to writing loans for four bedroom two bath homes on cul-de-sacs and then bundling them off at the end of the month to pension funds that require consistency in the product profile. If these were ten thousand square foot strip malls with fifty seven parking spaces on a road with forty thousand cars driving by each weekday there’d be an institutional bundle for that. Same with a two hundred unit garden apartment complex. But a fifteen hundred square foot bakery or barber shop with an apartment upstairs? What kind of freaky platypus is that?

    Some people will sit you down and calmly explain that the guidelines for plain vanilla federally insured mortgages technically include buildings with up to four units and up to 25% commercial space in an otherwise residential building. On paper it’s no different than a single family home. That’s absolutely true. But many older buildings are closer to fifty/fifty residential/commercial. Even if you find a building that does conform you still need to find a banker who will grant that loan in this neighborhood. Again, it’s absolutely possible. But it’s not easy. And if a building is too cheap – generally under $50,000 – no bank will write a mortgage either.

    A commercial loan with a short term – typically eight years – and a significantly higher interest rate might be offered instead of a standard thirty year mortgage. Maybe. As part of the due diligence process the right bank will make you prove that the building is structurally sound, conforms to modern codes, and has a pro forma that can cash flow properly. And then there’s the cost of renovations, complying with the Americans With Disabilities Act, the fire code, and existing zoning regulations… It can be done. But something as basic as installing fire sprinklers or an elevator can easily kill a proposed project. It’s just too expensive in a building with too little value. Sorting out all this stuff takes real skill and experience. I know several seasoned mid-size property developers who lost everything to bankruptcy because their high quality projects came on line just in time for a big market correction and they couldn’t service their debts. And these folks were light years ahead of an ordinary person looking to invest in a modest property.

    The scenario I see all over the country is formulaic. Older buildings in formerly derelict neighborhoods are bought and renovated by well funded and skilled firms who specialize in this kind of development. Shops and apartments are then rented to individuals. These legacy districts become amenity centers that add value to new large scale infill development of the Texas Doughnut variety. There are exceptions, but that’s mostly what I see. It’s neither good nor bad. People sometimes complain about gentrification, but the alternative is for these neighborhoods to continue to decline until they can’t be saved at all. It might be nice if every aspect of society changed to allow other options, but I’m not holding my breath. At the end of the day we live in the world we live in. We have the rules and procedures we have. Shrug. Mom and Pop need to find a new gig.

    This piece first appeared on Granola Shotgun.

    John Sanphillippo lives in San Francisco and blogs about urbanism, adaptation, and resilience at granolashotgun.com. He’s a member of the Congress for New Urbanism, films videos for faircompanies.com, and is a regular contributor to Strongtowns.org. He earns his living by buying, renovating, and renting undervalued properties in places that have good long term prospects. He is a graduate of Rutgers University.