Blog

  • The Reluctant Suburbanite, Or Why San Francisco Doesn’t Always Work

    This week I’m helping a friend move house after watching her grapple with some unappealing options for the last couple of years. In the end she’s leaving San Francisco and moving to the suburbs forty-seven miles to the south. She absolutely hates the suburbs, but given all the possibilities it really is the right thing to do under the circumstances. Here’s a little background. She attended Berkeley University in the 1990′s as a foreign exchange student and fell in love with the Bay Area. She went back home, worked very hard, jumped through a million bureaucratic hoops, and eventually became a naturalized citizen. She’s lived here in San Francisco for the last fifteen years. Eight years ago she bought an apartment next door and we became good friends.

     Screen Shot 2014-11-05 at 9.30.52 PM

    Screen Shot 2014-11-05 at 10.52.01 PM Screen Shot 2014-11-05 at 10.52.46 PM Screen Shot 2014-11-05 at 11.56.50 PM   Screen Shot 2014-11-06 at 12.01.32 AM Screen Shot 2014-11-05 at 10.56.12 PM Screen Shot 2014-11-05 at 11.57.26 PM Screen Shot 2014-11-05 at 10.48.27 PM

    Over the years she went from being a starving student to having a good paying job in the tech sector. Her work was initially downtown which was an effortless ten minute commute by BART (the local rail system). But a few years back she landed a job with one of the big companies in Silicon Valley. She had absolutely no desire to schlep that far to work so one of the terms of her employment was she would work from home most of the time and appear in person at the office once in a blue moon when absolutely necessary. That arrangement worked really well in the beginning. But then the nature of her position changed, she was promoted, she got a raise, and she found herself at the office more and more often. She bought a car and endured the long miserable commute with bumper to bumper traffic that took two hours each way and left her in a foul mood. She took the so-called “Google” bus (all the tech companies have private shuttle buses but they’re all generically referred to as the “Google” bus) but there were problems with that too. The company bus takes just as long as driving. While she was able to be more productive as a WiFi enabled passenger she was still spending an extra four hours a day schlepping back and forth. This was in addition to some very long hours at the office that sometimes involved spending the night solving complex urgent problems or synchronizing with coworkers in India or Singapore. Her life essentially became her job and her commute with little room for anything else. She wasn’t happy and she wasn’t even able to enjoy the things that she loved about living in San Francisco.

    Screen Shot 2014-11-06 at 3.32.25 AM

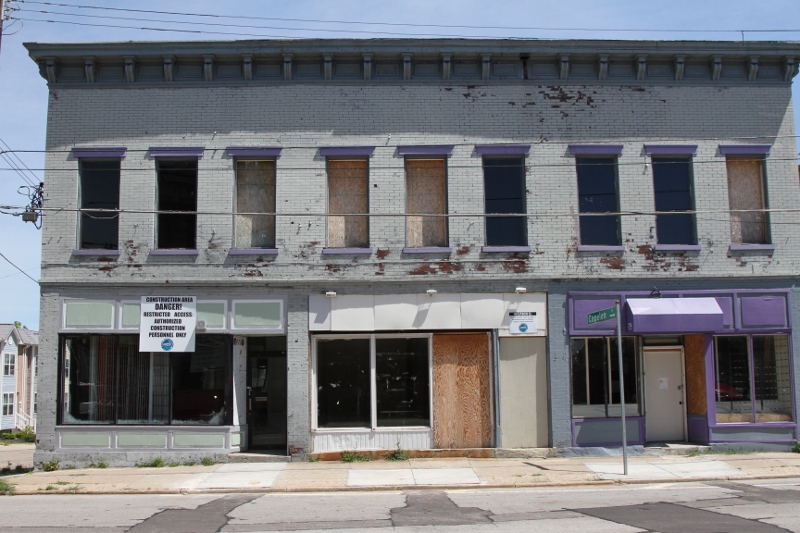
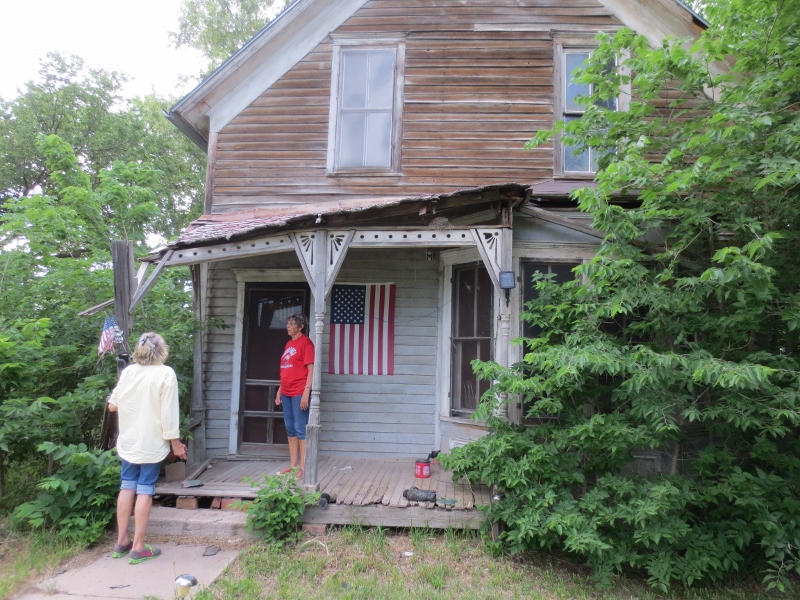
    There’s another aspect of the situation here in San Francisco that motivated her to leave. On three separate occasions in the last year she was approached by strangers as she got on or off the company bus. One guy spit on her, another called her a (well, I won’t use the actual word here, but it’s a crude reference to a female body part) and another guy lectured her about how all the newly arrived tech people were destroying the city. She began to feel distinctly unwelcome in her own neighborhood – and by people who may not even have lived here as long as she has. The irony of the situation is that because she plans to eventually return to San Francisco she needs to keep her apartment. She can’t sell it because she may never be able to afford to buy a new place here. But she can’t rent it either because local regulations make it extraordinarily difficult to remove tenants once they get settled in. In effect she wouldn’t be able to move back into her own home without a significant amount of sturm and drang and a big financial and legal battle. She’d love to rent the place for a few years so the rental income would cover her mortgage, but instead she’s leaving her apartment empty and paying both the city and suburban mortgages. It’s the only logical thing to do under the circumstances. The ordinances that are designed to protect renters are working to take units off the market since no sane person wants to be a landlord in the city.

    You might ask why she doesn’t just quit her job. She did consider it. But she does a very specific kind of thing and doesn’t want to give up her position and the challenges that only a particular kind of company can provide. If she wants to continue in her career she’s most likely going to have to work for one of the other big companies in the southern suburbs. The job wasn’t the problem. The commute was. Now I can picture some of you out there rolling your eyes about this woman and her “problems”. Poor baby. But her dilemma is very similar to a lot of people who need to stay in a job for all sorts of reasons. For example, I know teachers and cops who are so over their jobs, but they’ve been plugging away for an eternity and they just need to hang in there for a few more years in order to collect a full pension. I know other people who lost their jobs and are now forced to do work elsewhere in order to make ends meet. People have their reasons and it’s hard to argue when you start poking at the particulars.

    Screen Shot 2014-11-06 at 2.22.17 AM  Screen Shot 2014-11-06 at 2.21.37 AM Screen Shot 2014-11-06 at 2.48.31 AM Screen Shot 2014-11-06 at 2.46.56 AM Screen Shot 2014-11-06 at 2.47.07 AM Screen Shot 2014-11-05 at 9.32.48 PM Screen Shot 2014-11-05 at 9.48.08 PM

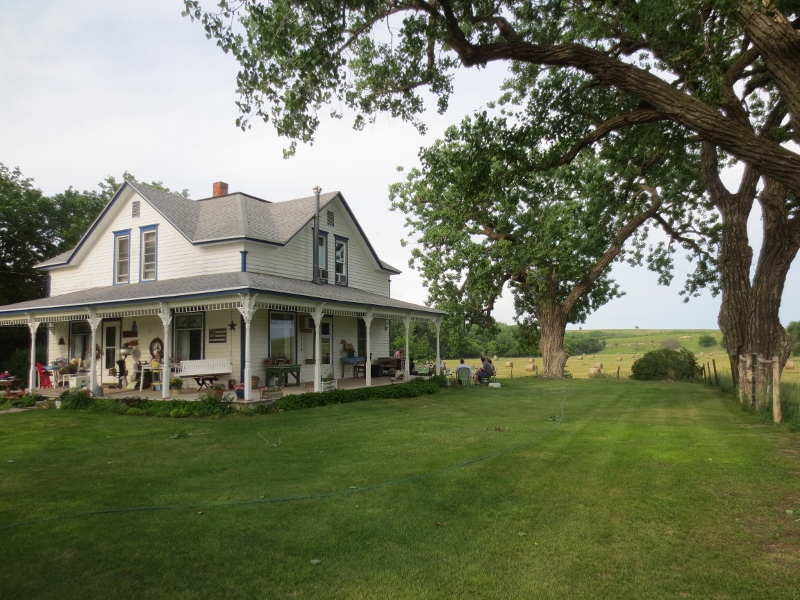
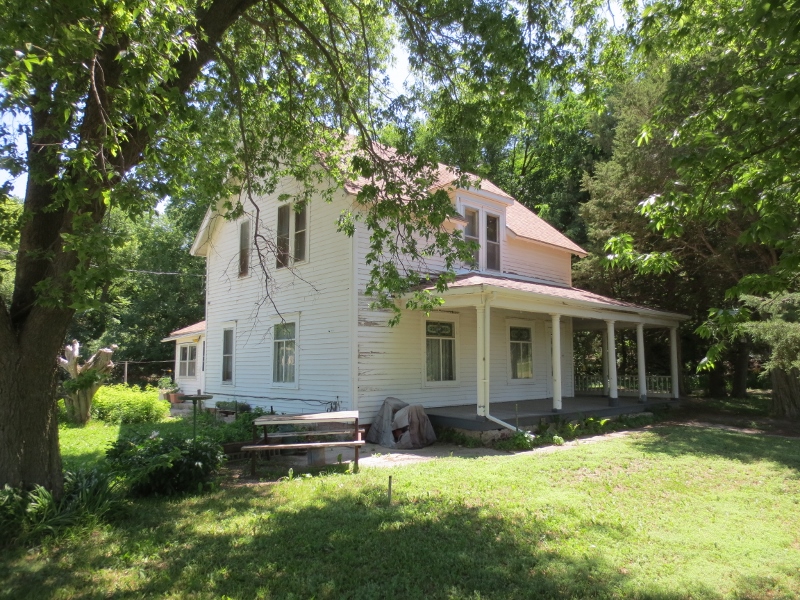
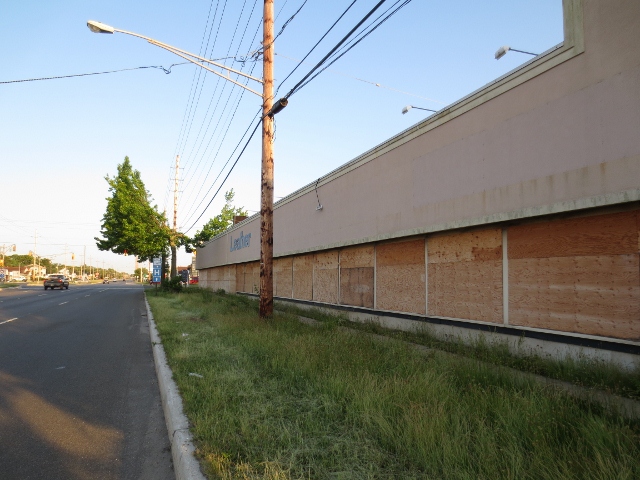
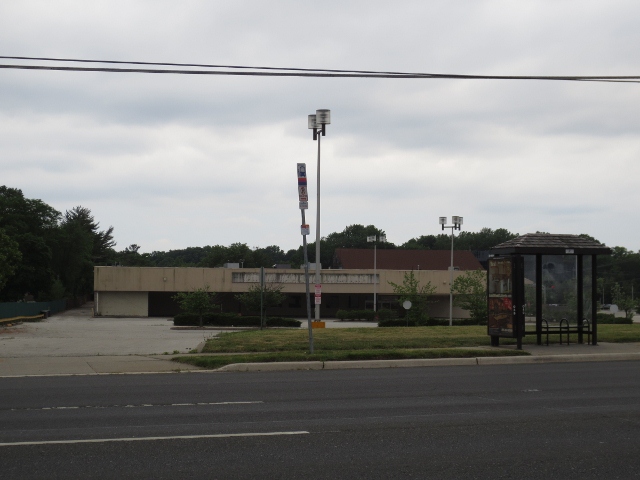
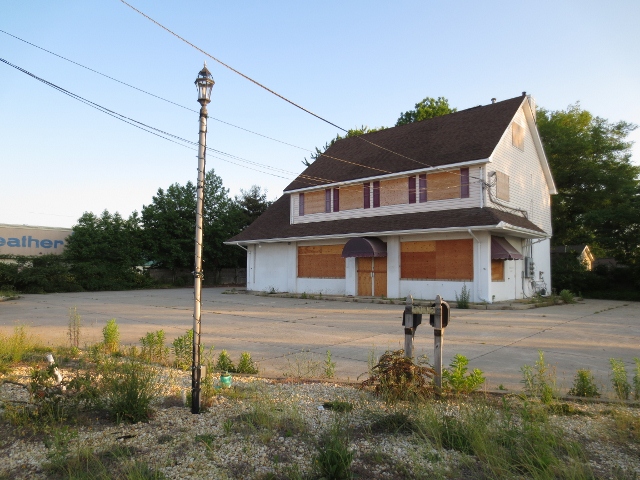
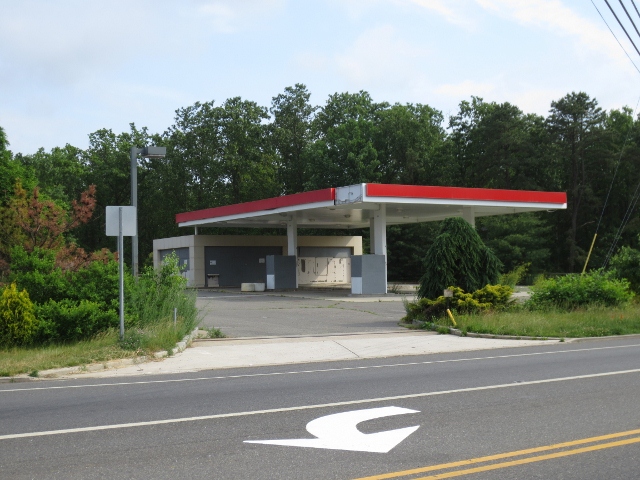
    So here’s what her new place is like. The house is a 1947 tract home with a patch of front lawn and a wee little back yard. She’s got two bedrooms and two baths. It’s cute and she and I agree that it’s very comfortable and has everything most people would want or need in a home. And at $645,000 it’s significantly bigger and less expensive than her one bedroom apartment in the city which is estimated at around $850,000. (She didn’t pay anything like that eight years ago, but prices have skyrocketed lately.) The really important thing about this house is its location a mile from her office. She could ride a bicycle to work if she wanted to, although she will almost certainly drive or take the light rail. It’s physically possible to ride a bike, but it isn’t necessarily safe or pleasant given the wide roads and high speed of the cars and trucks whizzing by. In fact, once you step off the front lawn there really isn’t anything in her neighborhood that’s even remotely worth walking to or as pleasant as what she’s leaving behind in San Francisco. The only place to buy milk and eggs was the corner gas station. But here’s where it gets interesting…

    Screen Shot 2014-11-06 at 2.50.13 AM Screen Shot 2014-11-06 at 2.50.59 AM Screen Shot 2014-11-06 at 2.55.41 AM Screen Shot 2014-11-06 at 2.54.48 AM Screen Shot 2014-11-06 at 2.55.15 AM

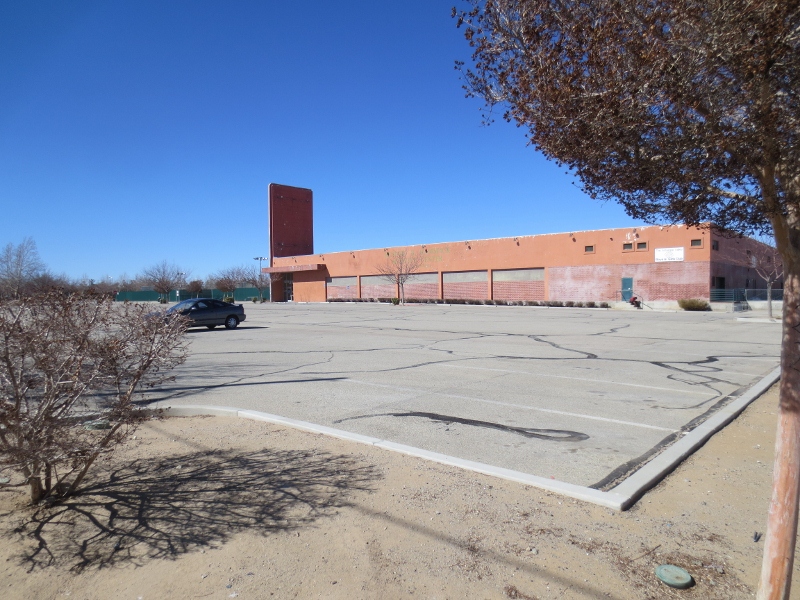
    I asked her where she’d eat since the only places in evidence were drive-thru fast food joints and low end chain restaurants in strip malls. She explained that her company (like all the companies in Silicon Valley) provides a variety of high quality heavily subsidized restaurants within the corporate campus. In fact she invited me to explore the place and we had lunch together a couple of times. Once I registered, went through security, and entered the complex there was an entire self-contained world to explore. These places employ tens of thousands of people from all over the world. At lunch there was excellent dim sum, samosas, saag paneer, dolmas, kibbeh, long salad bars, boreks, beef steaks and potatoes – all locally sourced, organic, seasonal, and beautifully prepared by professional chefs. Kosher? Sure. Halal? No problem. Vegetarian? Of course. Special menu for Diwali? You bet. It was all very good and ridiculously inexpensive. Breakfast, lunch, dinner, late night healthy snacks… they have it covered. We dined indoors, but most people drifted out to one of the many al fresco areas. As we walked from building to building I noticed well populated lounges for relaxation and socializing, Starbucks, volleyball courts, pool tables. There’s a farmers market in the parking lot. There’s a dry cleaners. A masseuse or manicurist can be summoned if need be. These companies have essentially taken over the functions of a town and provided them internally for their employees. Partly they do these things to keep their workers happy. Partly it keeps people at work longer than they might otherwise be willing to stay. But on a fundamental level these companies must know that their location in soul crushing sprawl is so lifeless and unsatisfying that they need to compensate by recreating all the aspects of a real town inside the landscaped berms of low rise office parks. And what about the people who live in the area but don’t work for one of these companies and don’t have security clearance to enjoy the buffet and foreign cinema night?

    I understand why she’s moving, but I wouldn’t want to live there myself.

    John Sanphillippo lives in San Francisco and blogs about urbanism, adaptation, and resilience at granolashotgun.com. He’s a member of the Congress for New Urbanism, films videos for faircompanies.com, and is a regular contributor to Strongtowns.org. He earns his living by buying, renovating, and renting undervalued properties in places that have good long term prospects. He is a graduate of Rutgers University.

  • Childish Things: So Many San Franciscans Don’t Wanna Grow Up. But Who Can Afford To?

    Earlier this year, an extremely clever married couple named Catherine Herdlick and Gabe Smedresman celebrated the latter’s 30th birthday by throwing a citywide Logan’s Run-themed chase game. What a perfect motif for a night out in San Francisco: A pastime for beautiful young adults in this city of beautiful young adults re-creating a movie about beautiful young adults enjoying a lavish, indulgent — and extremely temporary — existence.

    In that film, the beautiful young adults of a dystopian future earth lived it up before aging out in the most extreme manner possible: They were vaporized to make way for more beautiful young adults.

    Here in San Francisco, that would violate the city charter.

    Read the entire piece at SF Weekly.

    Joe Eskenazi is a staff writer and columnist for SF Weekly.

  • 1099 Economy on the Rise

    Here at ZenPayroll, we care a lot about how compensation is done, and the effect compensation can have on the relationship between employers and employees. Using the employment data we have as a payroll provider, we decided to look at whether the 1099 economy, which has garnered quite a bit of media attention recently, is really growing as fast as people think.

    The short answer is that over the past year, the ratio of independent contractors to full-time employees has meaningfully risen among small and medium-sized businesses in states and major metropolitan areas across the country.

    The nature of work is changing given the decline of lifetime employment. Today, very few people plan to work for the same company their whole life, and people often have several jobs at one time. As a result, and as shown by ZenPayroll’s data, more small business owners are employing contractors as a part of running their business. There are a number of other reasons for this general trend toward a more flexible work structure.

    Click the image to enlarge.

    First, employees want to have more choices when it comes to where and when they work, but also who they work for. Millennials in particular are frequently asking themselves whether they’re fulfilled by what they’re doing. Jess Ostroff, founder of a full-service virtual assistance agency called Don’t Panic Management, said that some of her contractors in New York City are aspiring actors, and they do contract work to support themselves as they pursue longer-term passions and ambitions. 

    Others do contract work purely for the flexibility — one of the first contractors to work for the Don’t Panic Management team is a mother of three who has her own cooking show and also runs a photography business. She supplements those jobs by contracting so she can earn money while spending time with her family.

    For some entrepreneurs, hiring independent contractors is key to their business. Lina Pakrosnyte is the founder and owner of UrbanLeash, a professional pet care company based in Chicago. There are four full-time employees on her team, but she works with over 30 contractors for tech and marketing help, as well as dog walking and cat sitting. With the high turnover in pet care professionals, Lina needs to keep finding contractors to serve her UrbanLeash clients.

    I’ve also talked to many small business owners who prefer having a remote or distributed workforce. Adam McLane, founder of a youth ministry resources company called The Youth Cartel, is one example. Because his business requires expert writers and public speakers, he works with over a hundred contractors from all over the country to produce content and events.

    After the economic downturn several years ago, many people who lost their full-time jobs found contract and part-time work as a way to fill that gap. When times are uncertain, employers also tend to prefer contractors. With the government promising to crack down on employers who misclassify their workers as contractors rather than employees, it’s important for business owners to know the distinction between the two. We published a post recently on the ZenPayroll blog to help small business owners avoid misclassifying their workers

    The future isn’t set in stone, and there will be ongoing debate about the responsibility employers have towards their workers, whether they are employees or contractors. It is important to care of your people if you want to attract and retain great talent.

  • Back to Vlasic

    Earlier this year a trend called “normcore” got a lot of press. Normcore is a fashion idea based on wearing boring, undistinguished clothing such as that from the Gap. Jerry Seinfeld is a normcore fashion icon.

    While normcore was at least in part a joke, I think it illustrates why trend chasing by uncool cities will never make them cool. So you live in some place which isn’t on everyone’s list of the coolest cities. You read all about what’s happening in places like Brooklyn with micro-roasters, micro-breweries, cupcake shops, and artisanal pickles, and you’re like wow, my city has all that now, too. We’ve arrived.

    No you haven’t. Do you think for a minute that the cool kids are going to let you just catch up and join the club? It doesn’t work that way. By the time you get to where they were, they’ve moved on to something else. You’ll never catch up doing it that way.

    The idea of normcore, though probably just ephemera, shows how quickly the script could be flipped on you. Just as you finally master pretentious esoterica, the cool kids suddenly revert back to ordinary.

    I wouldn’t be totally surprised to see something like that happen, actually. While I shouldn’t underestimate the ability of creative people to continue playing leapfrog to new levels of local, bespoke, exclusive, etc., at some point that trend will be played out. Then were do you go? Back to the comfort of ordinary.

    Just when your Rust Belt burg finally has seven different artisanal pickle purveyors, don’t be surprised when the New York Times does an article talking about how the latest trend in Brooklyn is Vlasic kosher dill spears. (In an era in which Millennials are under huge financial pressure, this, like the sharing economy, would also be conveniently a matter of self-interest). Heck, maybe they already have and I just missed it.

    Again, it’s like the way that these industrial towns abandoned their local culture to pursue cool city culture, only to have those cool cities re-appropriate working class culture – Pabst, workwear brands, etc – for themselves. Now these Rust Belt cities are re-importing their own culture back as supplicants. Remember, back in the 90s, the cool cities list used to frequently include the number of Starbucks locations as an indicator. Things change fast.

    I like being able to get a good cup of coffee in these industrial towns now. I think it’s great for cities to have nicer stuff. But don’t ever make the mistake of thinking that by itself will change your relative standing in the marketplace.

    Aaron M. Renn is an independent writer on urban affairs and the founder of Telestrian, a data analysis and mapping tool. He writes at The Urbanophile, where this piece originally appeared

  • Canada’s Prairie Cities Step Up

    Traditionally, the discussion of Canadian urban issues focussed almost exclusively on the Big Three cities: Toronto, Vancouver, and Montreal, with the occasional nod to Ottawa. Calgary, Winnipeg, and Regina were generally only mentioned as punchlines, and, until recently, no one in urban Canada really knew what was going on in Edmonton other than that they had a winning hockey team in the ’80s and a really big mall. Saskatoon, which Joni Mitchell famously escaped as soon as she could, hasn’t historically been on anyone’s radar, and Regina is scarcely mentioned outside the context of football. It’s not surprising that many Prairie residents are defensive or bashful about their cities, given the PR they’ve gotten over the years. But from an outsider perspective, now is a very good time to live on the Prairies.

    With Calgary, Edmonton, Regina, and Saskatoon perennially vying for the title of fastest growing Canadian city, and with Winnipeg in the early stages of an urban renaissance, it’s getting harder to ignore Canada’s Prairie cities. The narrative is shifting. The election of young, urbane, and pragmatic mayors in Calgary, Edmonton, and Winnipeg has put the spotlight on these once ignored cities.

    Naheed Nenshi, a Harvard-educated McKinsey consultant turned university instructor, was improbably elected Mayor of Calgary in a 2010 landslide victory. His quick wit and social media savvy have made him a darling of Canadian urbanists. He was recently short-listed for the World Mayor Prize. Regardless of what one thinks of his policy agenda, he is a good ambassador for the city.

    Not to be outdone, Edmonton elected 34-year-old city councillor and self-proclaimed nerd Don Iveson as mayor in 2013. Iveson recently made headlines for showing up at a comic expo in full Star Trek attire. His nerd-chic appeal has resonated with a cohort of young Edmontonians who feel that the city’s creative community gets short shrift. He, like Nenshi, is thought of as a smart, moderate mayor, an image that flies in the face of the redneck Albertan stereotype that hasn’t been an accurate representation of either of these Alberta cities for quite some time.

    Winnipeg has followed suit, electing privacy lawyer Brian Bowman as mayor. The 43-year-old has chaired both the Winnipeg Art Gallery and the Winnipeg Chamber of Commerce. Like Nenshi and Iveson, Bowman was elected with a diverse support base, including the business and arts communities. Being of Metis descent, he is also considered to be in a strong position to address some of the challenges facing the city’s large, indigenous population.

    The three mayors have more in common than belonging to roughly the same age cohort. All three are seen as moderates, and all have had some minor political experience but aren’t identified strongly with any political party. Each grew up in his respective city. Their biographies underscore an often overlooked advantage of Prairie cities: opportunities for economic mobility.

    As Canada’s Big Three cities get more expensive, Prairie cities are becoming increasingly attractive to recent graduates and early career professionals. Relatively affordable rents and tighter labour markets make them bargains, relative to Toronto or Vancouver. Tighter labour markets combined with the general default instinct among young professionals and graduates to move to Toronto or Vancouver mean that Prairie cities are a good place to get from the bottom to the middle in one’s industry. While there is a ceiling – the best paid financial sector employees will be in Toronto for the foreseeable future – there is less competition. Being able to live in the most attractive urban neighbourhoods for less than the cost of living in generally undesirable Toronto neighbourhoods, or being able to buy a house for a fraction of the sale price in Vancouver, sweetens the deal.

    Prairie cities are also a great place to take a chance. Lower rents mean that someone who wants to open a business needs to accumulate less capital and borrow less money than he or she would in a bigger city. That makes opening a restaurant or founding a start-up a less risky proposition. The same goes for aspiring artists. Relatively cheap gallery space makes it much easier to display one’s work. Whereas it might take family connections or years of networking to get on the board of a non-profit in Toronto or Vancouver, opportunities abound on the Prairies.

    In the world of politics, contrast Nenshi, Iveson, and Bowman, all from fairly ordinary families, with the winner of the last Toronto election.

    Toronto’s new mayor, John Tory, was born to the founder of the prestigious law firm Torys LLP. Tory was given his start in business at telecom giant Rogers by family friend Ted Rogers, the son of Rogers founder Edward Rogers, and went on to later run Rogers. His career also included running the Canadian Football League, making partner at the family firm, serving as principle secretary to former Premier of Ontario Bill Davis, chairing the campaign of former Prime Minister Brian Mulroney, and leading the official opposition in the Ontario legislature. In short, John Tory is the epitome of the Canadian establishment. His chief opponents weren’t exactly political novices either.

    Could Nenshi, Iveson, or Bowman have plausibly become the Mayor of Toronto? The answer is likely no. While some might argue that the level of political competition is necessarily higher in Toronto, the bigger reason is that the entrenched political and business elites in the three major cities have more clout than their Prairie counterparts.

    Calgary, Edmonton, Regina, and Saskatoon are dominated by new money. While Winnipeg has some influential legacy families, the political barriers to entry are generally much lower than they are in Toronto. A person of Bowman’s upbringing would have had an exceedingly difficult time becoming chair of the Chamber of Commerce in Toronto. An academic City Hall gadfly like Nenshi wouldn’t have a chance, even if he considered making a run for Mayor of Toronto. And someone as young as Iveson would have a hard time getting elected as a city councillor in Toronto, let alone as mayor. That isn’t meant to take away from them in the least. It is merely a recognition that the political system in Toronto is much more elite-driven.

    The combination of affordability, opportunity, and economic mobility presents a major opportunity for Canadian Prairies cities. Lower political barriers to entry can facilitate more responsive local governments. Relative isolation can help to spawn innovation of necessity. And upward mobility can help lure young talent from across the county.

    Cynically – or optimistically, depending on one’s view – none of these young mayors has a great deal of power to bend the trajectory of their cities. Mayors are merely single votes on councils, and even city councils are only one of many actors that shape these respective cities. Arguably the most important thing that mayors can do is serve as good ambassadors for their cities. The first step is to convince residents of the reality that things are going pretty well, and even better times lay ahead. The rest of the world won’t believe in Prairie cities until their own residents do. Civic pride is contagious.

    So far Nenshi has been an exceptional civic booster, and Iveson appears to be on that trajectory, too. Bowman seems keen on following in their footsteps. Hopefully, mayors and councillors in the rest of the Prairie cities can do the same. Prairie cities are having a moment, and that moment could potentially be a very long and a very good one.

    Steve Lafleur is the Assistant Director of Research for the Frontier Centre for Public Policy. He currently lives in Winnipeg, Manitoba, and has lived in every major Prairie city with the exception of Saskatoon.

    Flickr Photo by Elsie, Calgary Reviews: A chai latte at Caffe Rosso, Calgary

  • Measuring Current Metropolitan Area Growth from 1900

    Growth in the current land areas of the 52 major metropolitan areas (over 1 million) provides an effective overview of changes in how the population has been redistributed United States since 1900. These metropolitan areas are composed of nearly 440 counties, as defined by the Office of Management and Budget for 2013. There have been such substantial changes in metropolitan area concepts and definitions that reliable comparisons extending beyond a decade from Census Bureau are impossible. (See Caution: Note 1).

    In 1900, the land areas which hold today’s major metropolitan areas had a population of 27.6 million. This was only 36 percent of the national population, which stood at 76.2 million. By 2010, these 52 areas had reached 169.5 million population, approximately 55 percent of the nation’s 308.7 million population (Figure 1). Over the period of 1900 to 2010, the 52 areas captured 61 percent of the nation’s growth, while the balance of the nation accounted for the other 39 percent.

    From 1900

    The growth was anything but equal among the nation’s four Census Bureau regions (metropolitan areas were allocated using the Census Bureau region of the historical core municipality). In 1900, the East was dominant, with 45 percent of the population of the 52 areas. The Midwest was a strong second with 28 percent, while the South had 21 percent of the population. The West accounted for only six percent of the population of the 52 areas.

    By comparison, growth since 1900 has been in the parts of the country least populated in 1900. The South alone obtained 35 percent of the population increase, followed by the West with 30 percent of the increase. The East gained only 18 percent of the increase, while the Midwest gained only 17 percent.

    From 1950

    Things had already begun to change significantly by 1950, when the East’s share had fallen to 37 percent. The Midwest experienced a slight and dropped to 26 percent, while the South remained at 21 percent. The biggest change was in the West, which nearly tripled its percentage of the population, to 16 percent.

    The changes were much more significant to 2010. The formerly dominant East has now been displaced by the South, with 33 percent of the population. The West also passed the East, with 26 percent of the population. The East’s share had fallen to 22 percent, while the Midwest had fallen substantially, to 19 percent (Figure 2).

    Between 1950 and 1970 the highest growth was in the South, which added 11 million residents and the lowest growth was in the East, which added 7 million residents. However, after 1970 there was a sea– change in regional population growth. Since that time, the East and Midwest have fallen strongly behind. From 1970 to 2010, the East added only 3.2 million residents, less than one half the 7.3 million residents added between 1950 and 1970. The Midwest did modestly better, adding 5.6 million residents between 1970 and 2010, but well below the 7.7 million residents added between 1950 and 1970.

    The big gains were made in the South and West. Between 1950 and 1970, the West added nearly as many new residents (10.4 million) as the South (11.0 million), despite starting from a smaller base. However, since 1970, the momentum has shifted to the South which added nearly 30 million new residents from 1970 to 2010. The West also grew strongly, but fell behind the South in growth, with an increase of 22 million. The South accounted for 49 percent of the growth over the period. The substantial deceleration of population growth in California’s coastal metropolitan areas (Los Angeles, San Francisco, San Diego and San Jose) was a major factor in slowing the West’s growth rate (Figure 3).

    Metropolitan Highlights

    A review of the individual metropolitan areas indicates the pervasiveness of growth in the South and West and the more lackluster growth of the East and Midwest. The five fastest growing current metropolitan areas from 1900, 1950, and 1980 to 2010 were all in the South and West. The five slowest growing were all in the East and Midwest (Table).

    2010 Metropolitan Area Population Compared to 1900
    2013 Geographical Definitions
    TOP 10    
    FROM 1900 TO 2010 Times 1900
    1 Miami 1113
    2 Phoenix 150
    3 Orlando 97
    4 Riverside-San Bernardino 92
    5 San Diego 88
    FROM 1950 TO 2010 Times 1950
    1 Las Vegas 40.7
    2 Orlando 11.2
    3 Phoenix 11.2
    4 Riverside-San Bernardino 9.4
    5 Miami 8.0
    FROM 1980 TO 2010 Times 1980
    1 Las Vegas 4.21
    2 Austin 2.93
    3 Raleigh 2.81
    4 Riverside-San Bernardino 2.71
    5 Orlando 2.71
    TOP 10    
    FROM 1900 TO 2010 Times 1900
    1 Pittsburgh 1
    2 Buffalo 1
    3 Providence 1
    4 Boston 1
    5 Rochester 1
    FROM 1950 TO 2010 Times 1950
    1 Pittsburgh 0.91
    2 Buffalo 1.04
    3 Cleveland 1.24
    4 Detroit 1.36
    5 Providence 1.36
    FROM 1980 TO 2010 Times 1980
    1 Pittsburgh 0.89
    2 New Orleans 0.91
    3 Buffalo 0.91
    4 Cleveland 0.96
    5 Detroit 0.99


    No city can compare to the growth registered by Miami since 1900. At that time, the three counties of the 2013 metropolitan area had only 5,000 residents. By 2010, Miami had reached 5.6 million and was more than 1,100 times its size in 1900. Next was fast growing Phoenix, which at 150 times its 1900 size (28,000), grew at only a fraction of Miami’s growth. Orlando is 97 times its 1900 size, Riverside-San Bernardino is 92 times, and San Diego is 88 times its 1900 population.

    The slowest growing were all in the East, although each grew over the past century. Pittsburgh grew the slowest and was 1.81 times its 1900 size in 2010. Buffalo, Providence, Boston and Rochester rounded out the slowest growing five from 1900.

    From 1950, Las Vegas was the fastest growing, with a 2010 population 40.7 times that of 60 years before (complete data is not available for Las Vegas in 1900). Orlando, Phoenix, Riverside-San Bernardino, and Miami were also in the top five.

    The bottom five from 1950 was led by Pittsburgh, which lost population to 2010. The other four, Buffalo, Cleveland, Detroit, and Providence all gained, but only modestly.

    Las Vegas was also the fastest growing since 1980, with a 2010 population was 4.21 times its 1980 level. The other top five cities were Austin, Raleigh, Riverside-San Bernardino, and Orlando.

    The bottom five between 1980 and 2010 followed the pattern since 1950, with the exception of New Orleans, which ranked second slowest growing. This reflects largely the impact of Hurricane Katrina. Other than New Orleans, the four slowest growing were Pittsburgh, Buffalo, Cleveland, and Detroit. All five of these cities lost population from 1980.

    The data for all 52 metropolitan areas for each census year (and 2013) is on this webpage.

    The United States: Moving South and Increasingly

    The population shifts in the United States have been substantial over the past 110 years. In 1900, nearly three quarters of the population of these cities was located in the East and Midwest. By 2010, the balance had shifted substantially, with 59 percent of the population in the major metropolitan areas of the South and West. However, in the West, coastal California growth rates are beginning to look more like those of the East and Midwest. Current projections suggest that this shift will continue, though nothing about the future is a certainty.

    Wendell Cox is principal of Demographia, an international public policy and demographics firm. He is co-author of the "Demographia International Housing Affordability Survey" and author of "Demographia World Urban Areas" and "War on the Dream: How Anti-Sprawl Policy Threatens the Quality of Life." He was appointed to three terms on the Los Angeles County Transportation Commission, where he served with the leading city and county leadership as the only non-elected member. He was appointed to the Amtrak Reform Council to fill the unexpired term of Governor Christine Todd Whitman and has served as a visiting professor at the Conservatoire National des Arts et Metiers, a national university in Paris.

    —-

    Note 1: Caution: This article compares 2013 geographical boundaries of metropolitan areas to census years between 1900 and 2010. In years before 2010, metropolitan area geographical definitions were different from 2010 and before 2000 metropolitan area conceptual definitions were different. As a result, this article does not compare 2013 metropolitan areas with metropolitan areas as defined in any year before 2013.

    Note 2: The population data referred to is for the current county composition of metropolitan areas. These data are not adjusted for county boundary changes that may have occurred. For example, no data is available for Las Vegas in 1900, because its one metropolitan county, Clark, did not exist until the 1910 census.

    Top photo: Miami’s Elser’s Pier in the 1920s.

  • Long Island Suburbs: How Planners Should Treat Age Spots

    Long Island is the birthplace of suburbia, from colonial-period Brooklyn to Levittown and beyond, and its economy has survived booms and busts since the 1950s. As stagnant as it may be, if it’s anything, it is resilient. Today, its problems mirror those of many older suburban areas scattered across the country, and, like many other suburbs, its problems cannot be solved by simply shoehorning in more development – and more tax revenue. Are policymakers addressing the true thorns in the region’s side: Affordable housing, cost-of-living, taxes, racism and fear of change? Planners nationwide could learn much from Long Island if they looked closely at its successes and its failures, and how both evolved.

    In the push to expand housing after WWII, Long Island’s potato fields became subdivisions that, with the passage of time, became increasingly monochromatic, as well as increasingly expensive. The planners of yesteryear crafted strategies that set national precedents in farmland and open space preservation, while simultaneously working to manage unprecedented residential and commercial expansion. During these boom years, planners urged municipalities to protect open space, resulting in yet another set of national benchmarks in regard to groundwater protection.

    Yet the recommendations for an overtly aggressive open space acquisition program were pared down and never fully capitalized upon. Few, if any, of other recommendations leapt from the leather-bound pages of the academic planning texts to become fully implemented. Planning had its moment in the sun on Long Island, but it was quickly eclipsed by special interests with money to spend and projects to greenlight. Today,the academic approach of the previous decades is mostly gone, with the Island’s growth being managed by development firms and nonprofit stakeholder groups. Our current long-term strategies lack a detached professionalism that is unhindered by political forces and agenda-driven ideas.

    The solution being currently proposed is a call for more “responsible” growth. The question is, if growth got Long Island into this mess, how can it eventually get us out? Multifamily units are being proposed under the umbrella of responsible growth, as is the placement of additional sewers. With the arrival of sewers, it is said that growth will be allowed to flourish, helping to keep the wealthy Millennials, stop the cries of “brain drain” and subsequent regional death, and generate jobs.

    At last month’s Destination LI conference (#LIREDI hashtag on Twitter), a group of Millennials spoke about the need for sewers as well as the need for additional growth of multifamily-type units. It was nice to see a new generation become interested and invested in Long Island, and even go so far as to say that this next generation will “fight” to stay in the region. But there was little mention of the fact that there has been an overall 89% increase of units from 1989 to present, or that groundwater quality is compromised as a direct link to overdevelopment, or about the region’s sole source aquifer that dictates appropriate density levels.

    What are the realities of building truly affordable housing in suburban Long Island’s aging suburbs? How can costs be pared down so developers are enticed to build without relying on density to generate profit?

    Planners by trade have to be optimistic, but they must also be realistic when assessing a region’s needs and growth strategies. The current approach by developers and stakeholders is fueled by optimism, but studies the issues on a shallow level instead of working to solve our long-established problems.

    The biggest one? In each town and village hall across Long Island, and in our Nassau-Suffolk region, municipalities often grant density in places where it is simply not appropriate. If an area has a comprehensive plan in place, development should follow the usage that was already determined. But, more often than not, local government awards variances that drastically increase density under the guise of “responsible growth”. These variances add up to a high density sprawl that is worse than the traditional sprawl that they were meant to replace in the first place. They fly in the face of the professional planning efforts undertaken on Long Island over the previous decades. We need a return to professionalism if we are going to create legitimate and workable solutions.

    Urban planning is not merely saying that development is “responsible,” it’s assessing our regions needs by quantifying market trends, environmental data and resident feedback. Planning for our future should not be about catering to one age demographic, but rather, about addressing the needs of all Long Islanders over the course of the future decades. Instead of planning sessions focused on urging downtown development to attract jobs, planners should be justifying why development should be placed in a given downtown, or anywhere else.

    Many tout the expansion of transit, but few address the marked lack of population density that’s necessary to drive the demand and fiscal support of such expansions, or discuss the MTA’s frequent capital budget shortfalls. Planning should be crafted from a scientific and methodological approach, not from buzzwords, faulty surveys or ideal conditions that are neatly summed up on a PowerPoint slide.

    Saying we need affordable housing is easy. Execution of the concept on Long Island has been extremely difficult for decades. Yet this uncomfortable reality is not discussed on panels. Our regional problems require us to confront our balkanized districts, dissect the unbalanced economics of our real estate development, and deal with a heritage of racism furthered by exclusionary municipal jurisdictions.

    Sheer density won’t change sixty years of racial division, jumpstart our stagnant economy , or upgrade our infrastructure to 21st century standards. And, despite what county officials and a myriad of developers are saying, more sewers alone will not solve our woes. We need a sewer plan that works in conjunction with a robust open space plan, which in turn works to complement our approaches to economic development.

    In other words, we need true regional planning.

    To execute our plans, we need professionals. In recent years, municipalities have cut planning staff, and outsourced critically important planning functions to politically-connected boards and stakeholder groups. In Suffolk, the County merged a once nationally-acclaimed department of planning with the economic development department. Despite what anyone says to the contrary, crafting strategies for economic development is not planning. It is a piece of the puzzle, but there are important distinctions that have been forgotten in recent years.

    The convenient narratives of ‘brain drain’, downtown revitalization, and smart growth make it easy to stand behind a podium and tout the benefits of pure, unhindered economic development. But the elephant-sized problem in the room remains. Only this time, instead of being in a single-family home, the elephant’s room will be in in a shiny, new multi-family complex.

    Richard Murdocco regularly writes on land use and policy issues. A collection of his published work can be found on www.TheFoggiestIdea.org, and you can follow him on Twitter @TheFoggiestIdea.

    Flickr photo by Sean Marshall, Weber House in Hempstead, Suffolk County, on Long Island. A plaque in front of the house, built 1947, commemorates one of the first homes in Levittown, New York, considered America’s first planned suburb.

  • California’s Southern Discomfort

    We know this was a harsh recession, followed by, at best, a tepid recovery for the vast majority of Americans. But some people and some regions have surged somewhat ahead, while others have stagnated or worse.

    Greater Los Angeles fails to make the grade. In per capita growth of gross domestic product since 2010, according to analyst Aaron Renn, our region ranks a very mediocre 38th out of 52 metro areas, with a measly 1.5 percent, well below the national average of 3.8 percent. It places behind up-and-comers among the Texas cities, Oklahoma City and some tech-oriented clusters – Silicon Valley ranked second, after Houston. These places have growth rates roughly twice those of the Southland.

    When we wanted to drill down to the more local level, and analyze what is happening by county, we needed to go to the Census Bureau, as opposed to the Bureau of Economic Analysis, where we could glean what is happening in our communities. Our analysis is based on those figures, and neither of us hopes the Southern California region continues to stagnate or decline.

    Poverty

    One of the saddest results of the Great Recession and the weak recovery has been the expansion of poverty across the country. The poverty rate among the country’s 52 largest metropolitan areas, according to the most recent census numbers, grew from 14.9 percent in 1999 to 15.8 percent in 2013, a 7 percent rise. At least one-quarter of that rise has taken place since the recovery began.

    Southland politicians, like those in much of California, often decry income inequality and poverty, but they have not been very effective in combatting it. The region has had higher-than-average poverty for well over a decade, and things have not gotten better recently. Since 2009, the Los Angeles region, which includes Orange County, has seen its poverty rate grow by 1.8 percent, 80 percent higher than the national norm. The area ranked 47th out of 52 in terms of increased poverty. Riverside-San Bernardino saw a similar jump, 1.7 percent, in poverty.

    The scale of the poverty problem in the Southland is much greater than many imagine. When we broke down the figures, Los Angeles County remained the area with the highest concentration of poverty. L.A. saw a slight reduction in poverty from 1999-2010, but has moved in the other direction more recently. From 2010-13, poverty in L.A. County rose from 17.5 percent to 18.9 percent, an 8 percent increase. Poverty now afflicts a considerably larger portion of the population of Los Angeles than it did in 1999.

    But if Los Angeles County endures the largest pocket of poverty, there’s not much for the surrounding counties to shout about. San Bernardino and Riverside counties have each seen rapid 20 percent increases in their poverty rates since 1999; in fact, San Bernardino’s 19.1 percent poverty rate is slightly higher than that of Los Angeles County.

    Orange County fares better, but the curse of poverty is spreading even here. Although its 13.5 percent poverty rate lies below the national average, the ranks of the O.C. poor have jumped 30 percent relative to the entire population since 1999. The expansion of poverty as a share of the population has grown by more than 10 percent since 2010.

    Low Income Growth and High Housing Prices: A Bad Combination

    As befits a region with relatively low GDP growth, incomes in Southern California have stagnated. Median household incomes have dropped in every county in the region, including Ventura and Orange, whose residents boast median household incomes above $70,000, well above the $50,000 range found in Los Angeles, San Bernardino and Riverside. Since 2010, the biggest income drops have happened in the Inland Empire, where real incomes have fallen by nearly 7 percent. Los Angeles also has experienced a drop, with real incomes down 3 percent since 2010.

    For the most part, the more-affluent suburban counties have done better, consistent with the two-speed U.S. economy. Orange and Ventura enjoy median household incomes a full $20,000 above those of Los Angeles County and the Inland Empire. This is after the smaller 2.1 percent reduction (2010-13) in Orange County real incomes. Real incomes have recovered, albeit slightly, only in Ventura. The biggest hit has been concentrated in those parts of Southern California – Los Angeles County and the Inland Empire – historically most dependent on blue-collar professions in manufacturing, logistics and construction. These are, for the most part, also the most heavily Latino and African American areas of the region.

    So, why can’t the Southland replicate the economic boom in the San Francisco Bay Area? Simply put, the Los Angeles region is not the Bay Area, or Seattle. The share of Los Angeles’ jobs that are tied to manufacturing and logistics is twice that of the San Francisco area. Our population is far less well-educated, particularly in the Inland Empire and much of Los Angeles County, and is also far more heavily African American and Latinogroups that have fared particularly poorly. Nationwide, Latino poverty rates, notes a recent Pew study, stand at 28 percent, the highest for any ethnic group.

    Alongside the stagnant economy, growing Latino poverty – which is really the key challenge for Southern California – also reflects a high cost of living. This is most profound in terms of housing costs. Overall, the Southland counties – most notably Los Angeles and Orange – suffer among the highest housing cost burdens, relative to income, than virtually anywhere in the country.

    This can be seen by looking at what parts of the country have the highest percentages of people paying more than 50 percent of pretax income for housing. According to the Center for Housing Policy and National Housing Conference, 39 percent of working households in the Los Angeles metropolitan area spend more than half their incomes on housing, a somewhat higher rate than in the pricier San Francisco and New York areas and much higher than the national rate of 24 percent of households spending more than half of income on housing, itself far from tolerable.

    New Policy Imperatives

    Our current mix of state and local policies are neither reviving the regional economy nor reducing poverty. One key reason is that the current political environment – fostered and perpetuated by greens, urban land interests and organized public workers – places little priority on promoting the growth of the tangible economy that tends to employ blue-collar workers. High energy costs, largely due to the state’s Draconian commitment to renewable fuels, are a direct threat to any kind of industrial growth, while highly restrictive housing policies slow any hope of meeting the needs of renters and prospective homeowners.

    Of course, one could point out that the Bay Area, the one large region in California experiencing above-average income growth, labors under the same progressive policy regime. But the Bay Area, particularly San Francisco, is already largely deindustrialized and its population far more attractive to digitally based companies. It boasts a far larger pool of venture capital, and a unique network to support tech.

    A Google or an Apple can easily move its energy-hungry arrays of computer servers to less-expensive states, along with its device manufacturing. The more grass-roots based, small-business-oriented Southland economy is far less able to adapt to regulatory strictures from Sacramento.

    Southern California leaders clearly need to understand that the region is not winning under the current policy environment in the state. Steps to re-energize our basic industries and restart new housing, particularly single-family housing desired by most young families, need to be taken. Other steps, from reforming the schools and rebuilding basic infrastructure to modernizing higher education, also are imperative. At risk is not just a comfortable way of life, but also the legacy of opportunity that has been so critical to this region from its earliest days, a legacy now at extreme risk.

    This piece first appeared at the Orange County Register.

    Joel Kotkin is executive editor of NewGeography.com and Roger Hobbs Distinguished Fellow in Urban Studies at Chapman University, and a member of the editorial board of the Orange County Register. His newest book, The New Class Conflict is now available at Amazon and Telos Press. He is author of The City: A Global History and The Next Hundred Million: America in 2050. His most recent study, The Rise of Postfamilialism, has been widely discussed and distributed internationally. He lives in Los Angeles, CA.

    Wendell Cox is principal of Demographia, an international public policy and demographics firm. He is co-author of the “Demographia International Housing Affordability Survey” and author of “Demographia World Urban Areas” and “War on the Dream: How Anti-Sprawl Policy Threatens the Quality of Life.” He was appointed to three terms on the Los Angeles County Transportation Commission, where he served with the leading city and county leadership as the only non-elected member. He was appointed to the Amtrak Reform Council to fill the unexpired term of Governor Christine Todd Whitman and has served as a visiting professor at the Conservatoire National des Arts et Metiers, a national university in Paris.

  • The New Bohemia: Not Where You Expect

    There’s an established image in the collective imagination of the kinds of places artsy types tend to live: the painter in a Paris garret, the actor in a Brooklyn brownstone, the musician in a San Francisco Victorian, or the playwright in a fisherman’s shack on Cape Cod. It’s all very romantic. We currently associate these places with vacation destinations and cutting edge high culture so of course that’s where the avant garde would naturally congregate. But people forget that in their day these were the cheapest least desirable locations available. These spots were economically depressed, populated by the lower working class, immigrants, “working girls”, and the substance abusers of their day. In short, they were places that respectable people avoided and where the authorities generally turned a blind eye. How else could artists survive without family money or the income that comes with full time employment in the mainstream economy? And where else could fringe elements of various subcultures thrive without inhibition from the dominant culture? It’s only after decades of anonymous incubation that these neighborhoods eventually became safe and vibrant enough to attract middle class residents in search of good food, nightlife, and tourist photo opportunities.

    The current reality is that the so-called “Creative Class” is being priced out of the places they helped make so desirable in the first place. Many lament their expulsion brought on by gentrification. Fair enough. In many respects it’s sad that these dynamic places are becoming more homogenized and sometimes even sterilized since well paid tech workers, financiers, and corporate lawyers are great at consuming culture, but pretty spotty when it comes to generating it. Then again… let’s not forget that without wealthy patrons or state support there would be no one to underwrite the art in question. Well-intentioned government attempts to preserve low rents through legislation or the construction of subsidized housing units are helpful to the handful of people that are lucky enough to participate. But economic reality generally tends toward gentrification and displacement. So where are the new artist colonies likely to spring up? In other words, where are the new cheap undesirable places where fringe types can thrive without attracting the attention of the authorities? I see three options.

     IMG_7165 (800x533) IMG_7169 (800x533) IMG_7137 (800x533) IMG_7146 (800x533) IMG_7157 (800x533)

    First, for the “traditional” rebel artist who can no longer afford New York, Boston, D.C. or Chicago there’s Buffalo, Cleveland, St. Louis, Pittsburgh, and Cincinnati. These Rust Belt cities have a fine stock of premium buildings and neighborhoods chock full of 19th century architectural gems and grand public parks and plazas at deeply discounted prices. If you want the authentic look and feel of a previous generation’s artist enclave they exist in second, third, and fourth tier cities in America’s forgotten interior. That multi-million dollar industrial live/work loft space in Manhattan is available elsewhere for a tiny fraction of a percent of the cost. A clever member of the Creative Class might initially establish her credentials and connections in Los Angeles or Toronto and then set up shop elsewhere to keep overhead low while sending her creations on to paying customers in more expensive markets.

    unnamed-7 unnamed-8 unnamed-5 unnamed-6 unnamed unnamed-3 unnamed-4 IMG_6476 (800x533) IMG_6477 (800x533)

    Second, there are thousands of depopulated rural villages that exist everywhere in America once you escape the economic forcefields of pricey metroplexes. Key West, Sedona, Provincetown, Carmel, New Hope, and Rehobeth have all been bought up and Disneyfied by now. But there are an unlimited number of small towns and villages that have similar qualities at an infinitely lower price point. Most of these remote country outposts will never become anything different from what they are now – quiet backwaters populated by contented older folks and restless young people eager to flee. But some of them will be colonized by just enough funky individuals that a self-reinforcing community will be able to take root.

    Third, and in my opinion the most viable and likely scenario, involves the reinvigoration of failed suburban districts. When I look around at the desolate commercial strip corridors (pick a crappy suburb… any crappy suburb anywhere from the outskirts of Charlotte to the damp underbelly of Seattle) I can imagine the new “arts districts” of the future. Dead suburban retail buildings and their associated parking lots are the current equivalent of abandoned industrial warehouses or cheap seventh floor walk up apartments. These properties and locations are most ripe for transformation over time. My guess is that most of the action early on will not be out front facing the highway, but in back behind the semi-abandoned muffler shops, defunct carpet emporiums, and burned out supermarkets. The rear loading docks and back alleys typically face quiet subdivisions of modest homes along more humanely scaled streets. It’s possible for individuals to create pleasant convivial places that engage with a selective element of the community while not attracting the attention of code enforcement agencies.

    Screen Shot 2014-10-21 at 6.03.37 PM ouhpoui unnamed-3  unnamed-8 unnamed-7 unnamed-5 unnamed-6 unnamed-16 unnamed-14 unnamed-15 unnamed-13

    Chuck Marohn of Strong Towns here calls this “Good Enough Urbanism”. It may not look like renaissance Florence or Greenwich Village, but it gets the job done in a hurry on a tight budget without the need for committees or regulatory approval. The key to success hangs on likeminded members of an interconnected community working together in an informal and organic way. Some places will develop around a cohesive social core and thrive. Most others will lack focus and the required critical mass and continue to devolve into slums. Happenstance will sort it all out over time. The trajectory is predictable at this point. As architect and urbanist Andres Duany likes to say, “First there are the risk oblivious pioneers, then gradually the neighborhood improves sufficiently to attract the risk aware, then with enough respectable small scale improvements by numerous mom and pops the big developers arrive and prepare the way for the Dentist from New Jersey.”

    John Sanphillippo lives in San Francisco and blogs about urbanism, adaptation, and resilience at granolashotgun.com. He’s a member of the Congress for New Urbanism, films videos for faircompanies.com, and is a regular contributor to Strongtowns.org. He earns his living by buying, renovating, and renting undervalued properties in places that have good long term prospects. He is a graduate of Rutgers University.

  • City and Suburb 2010-2013

    Three years is a short time, but perhaps enough to give a sense of what is happening to US metropolitan areas. For both reasons of less uncertainty (and less work for me), I look at just the 107 US metro areas with 500,000 or more people in 2013. These regions house 213 million, two-thirds of the population. I look at the populations of core cities and their suburbs, comparing amounts and rates of change, with further comparison by population size and by region. One definitional problem is what I mean by “core” central city: not the multi-names given by OMB, but rather the historic cities by which we know the places. These can sometimes be a pair, for example, Minneapolis-St. Paul, Dallas-Ft. Worth, San Francisco-Oakland and San Bernardino-Riverside. Another problem I do not try to deal with is whether there were annexations to the core cities in these 3 years.

    City and Suburb: the Nation

    The 107 core cities grew to almost 60 million, but still only 28 percent of the metropolitan population, the suburbs to 153 million. The central cities grew by almost 2 million, a 3.4% gain, while suburbs added 4.4 million, for a slower rate of 3.0%, giving value to the claim of urban revitalization in recent years. We can first deconstruct this change by size of metro areas, large (those over 2.25 million), medium (those from 1 to 2.5 million), and “small” (those under 1 million).

    The interesting story here is that is that the smaller metros, often thought of as the faster growing, e.g., in the 1990s, were the slowest for 2010-2013 at only 2.5%, for both cities and suburbs. Next were the giant metropolises over 2.5 million, growing at an intermediate rate of 3.2%, again with no difference between cities and suburbs. So the particular successful cities now are the medium-sized metros, here from 1 to 2.5 million, whose cities grew by an impressive 4.3% in 3 years, but with a lower 2.3% growth in their suburbs. These intermediate metro areas also had a much smaller suburban share overall of 58% compared to 74% for the largest areas and 69% for the smaller.

    Differences Across Broad Regions, the North, the South and the West

    Confirming expectations, and continuing trends of several decades, the North’s metro areas had the highest total population, but the smallest change for both cities and suburbs, but the region also shows the biggest gap between very low suburban (1.3 %) and a not quite so low city rate of 1.8%. The south, continuing a pattern of larger absolute and relative growth, with city growth moderately faster (5.3%) than in their suburbs (4.6%).  In the west, too, cities grew just slightly more than the suburbs.

    City and Suburb: Population Change 2010-2013 (Thousands)
    Size Large Metros (>2.5 mil) Medium Metros (1-2.5 Mil) Small Metros (Under 1 Mil) Total
    City 2010             31,004                15,557              11,143               57,704
    City 2013             32,016                16,261              11,426               59,703
    Suburb 2010             87,958                34,959              25,738             148,655
    Suburb2013             90,753                35,907              26,368             153,028
    % in suburb 74 69 70 72
    Large Metros (>2.5 mil) Medium Metros (1-2.5 Mil) Small Metros (Under 1 Mil) Total
    Total Change % change Total Change % change Total Change % change Total Change % change
    Metro Change            3,807.0 3.2                 1,624 2.7 914 2.5                 6,345 3.1
    City Change            1,008.0 3.2                    675 4.3 283 2.5                 1,966 3.4
    Suburb Change            2,799.0 3.2                    949 2.3 631 2.5                 4,379 3
    % change in suburbs 74 58 69 69
    Region North South West Total
    City 2010             23,448                17,882              16,358               57,688
    City 2013             23,920                18,866              16,958               59,744
    Suburb 2010             62,910                48,179              37,565             148,654
    Suburb2013             63,732                50,380              38,921             153,033
    % in suburb 73 73 70
    North  South West Total
    Total Change % change Total Change % change Total Change % change Total Change
    Metro Change                1,241 1.4                 3,144 4.7                  1,956 3.6                 6,341
    City Change                   422 1.8                    944 5.3                     600 3.7                 1,966
    Suburb Change                   892 1.3                 2,201 4.6                  1,356 3.6                 4,449
    % change in suburbs 72 70 69


    Example City and Suburb Change

    Here we examine the full list of places, to find which contribute to the growth of cities and of suburbs. I will note metro areas where the highest absolute and relative growth was in cities (1), or in suburbs (2), and those metro areas, where both city and suburban growth were high. But I will also note metro areas with very low growth and then those which are right in the middle, the average place!  Please see the following table.  The reader can also see the geographic patterns of these differences in absolute and relative growth via two maps, the first showing city growth and the second on suburban growth.

    Fast, Slow, and Medium Growth of Cities and Suburbs
    Fast City Growth Fast Suburb Growth Fast City and Suburb Growth
    Rate Rate City Rate Suburb Rate
    Washington 7.4 Houston 7.8 Dallas 6 6
    Atlanta 6.6 Boise 6.1 San Antonio 6.2 6.5
    Seattle 7.2 Des Moines 7.1 Austin 12 7.7
    Charlotte 8.4 Provo 7.1 Orlando 7.2 6.1
    New Orleans 13 Raleigh 6.9 7.7
    Omaha 6.2 Charleston 6.7 7.3
    Durham 7.6 Ft Myers-CapeCoral 7.5 6.6
    Denver 8.2
    Medium City Growth Medium Suburbs
    All 3.3 to 3.5% All 2.8 to 3.2
    Riverside-SanBernardino Minneapolis
    Las Vegas Tampa-St Petersburg
    Provo Baltimore
    Chattanooga Sacramento
    Honolulu Richmond
    Columbia SC Tucson
    Tulsa
    Fresno
    BatonRouge
    Stockton
    Madison
    Slow Growth City Slow Growth Suburb Slow Growth City & Suburb
    Rate Rate City Rate Suburb Rate
    Cincinnati 0.2 Albany 0.7 Chicago 0.9 0.8
    Baltimore 0.2 Dayton 0.2 Detroit -3.5 0.7
    Milwaukee 0.7 Wichita 0.9 St Louis -0.3 0.6
    Birmingham -0.1 New Orleans 0.8 Pittsburgh -0.1 0.2
    Worcester 0.8 Cleveland -1.7 -0.3
    Baton Rouge 0 Providence -0.1 0.2
    Youngstown -1.4 Hartford 0.2 0.2
    Lancaster -1.5 Buffalo -1 0.1
    Portland, ME 0.8 Rochester -0.1 0.4
    New Haven 0.7 -0.1
    Allentown 0.5 0.8
    Akron -0.5 0.7
    Syracuse -0.3 0
    Toledo -1.7 0.9
    Harrisburg -1.4 1.8
    Largest Absolute Growth
    Cities Rate  Absolute Growth Suburbs Rate  Absolute Growth
    New York 2.8                        231,000 New York 13                     153,000
    Dallas 6                        116,000 Los Angeles 2.3                     211,000
    LosAngeles 2.4                          92,000 Dallas 6                     208,000
    Houston 4.1                          95,000 Houston 7.8                     257,000
    San Antonio 6.2                          82,000 Washington 5.3                     266,000
    Austin 12                          95,000 Miami 4.5                     238,000
    Raleigh 6.9                          84,000 Atlanta 4.3                     205,000
    Boston 2.1                     104,000
    SanFrancisco 4                     133,000
    Phoenix 5                     138,000
    Riverside 3.7                     138,000
    Seatttle 4.8                     127,000
    Denver 5.9                     105,000
    Orlando 6.1                     116,000


    City Growth

    Although New York and Los Angeles had high absolute growth, the rates of growth were modest. In contrast, several southern and western cities showed both high numbers and rates of change—notably Austin, Dallas, San Antonio, three just in Texas, and Raleigh, NC. And there were high rates in more southern and western metro areas: Washington, Atlanta, Charlotte, Durham, but especially New Orleans (recovery), and Seattle and Denver, and the northern outlier, Omaha.

    Most slow-growing or losing cities are in the north – 21 cities – with only Birmingham and Baton Rouge in the south, pretty much a continuation of historic deindustrialization trends. Fourteen have slow growing suburbs as well.

    Suburb Growth

    Suburban growth is absolutely much larger than city growth, so is more prominent on the map.  Fourteen suburban areas added at least 100,000 in three years, led by Washington (266,000), Houston (257,000), and Miami (238,000). But the highest rates of change were for Houston, Des Moines, Boise and Provo, metros where suburban growth was rather faster than central city. Other growing regions include Dallas, San Antonio, Austin, Orlando, Charleston, Raleigh and Ft. Myers-Cape Coral – note all are in the south – for which both city and suburban rates of growth were high.

    Slow growing suburbs but not the core cities characterized Atlanta, Dayton, Wichita, and New Orleans, but in 15 other metro areas, all in the north, both suburban and core city growth was slow. Moderately fast (5 to 6%) city growth occurred for San Jose, Nashville, Oklahoma City, McAllen, TX, and El Paso. Moderately fast growing suburban regions include Miami, Phoenix, Denver, Nashville, Jacksonville, Oklahoma City, Salt Lake, and McAllen.     

    City and Suburb: Richer and Poorer

    The economic context for cities and suburbs has changed. In the 1970s and 1980s core cities suffered as suburban employment expanded mightily, spurred by the new interstate highways, and also fueled by social change, especially school desegregation, leading to massive white flight. Thus cities became poorer as the more affluent joined the suburban lifestyle. Some cities partly recovered by the late 1980s into the 1990s due to growth of the finance sectors, but suburbanization was still dominant even from 2000 to 2010. But around 1990 some cities – mostly high level regional capitals – began to gentrify, as younger, more affluent, professional and educated, and often unmarried singles or partners, reclaimed desirable older city housing. Some are even reverse commuting to suburban jobs, such as to Microsoft from Seattle.

    Such gentrification led to substantial displacement of the poor and of especially of minorities from the cities to adjacent suburbs, again typified by Seattle experience. The process has gone so far that some central cities are no higher in income and lower in poverty than their suburbs, as in Seattle, San Francisco, and Portland. The most gentrified cities, as measured by the share of neighborhoods upgraded, are Boston, Seattle, New York, San Francisco, Atlanta, Chicago, Portland, Tampa, Los Angeles and Denver—many of the biggest metro areas, and also cities with substantial growth 2010-2013.

    The relative vibrancy and high income of these cities is obviously related as well to the growing inequality of income and wealth of the last 20 years. This has particularly hurt the middle classes, but enabled the educated and professional non-family population to reinvigorate the core cities, even if they have to endure very high housing costs. If the economy improves in terms of jobs and middle class income, I would predict more successful growth in the suburbs than the media and even real estate market folks think, as people find more and more affordable housing available.

    Conclusion

    The period of review is short, but does show continuing growth of both core cities and their suburbs, but with the growth edge going to cities, unlike the dominant pattern of earlier decade. The “new urbanist” interpretation might be that people have come to support denser urban living, but an equally plausible interpretation is that the recession is not yet over, and that the market and financing for suburban single family home living is still suppressed. And a further realistic view is that the huge increase in inequality, reducing the number and buying power of the middle classes, is the more likely explanation of the relative success of cities, as adult children return to family homes, elderly move in with children, or people just double up in homes or are forced to accept living in apartments, even if they might prefer homes.

    Richard Morrill is Professor Emeritus of Geography and Environmental Studies, University of Washington. His research interests include: political geography (voting behavior, redistricting, local governance), population/demography/settlement/migration, urban geography and planning, urban transportation (i.e., old fashioned generalist).