Tag: Africa

  • Africa: 800 Million Jobs Needed

    African economies are in a race to get ahead of the demographic boom.

    While some people in the United States are sweating the presence, against the backdrop of a demographically stagnant white population, of the 11 million undocumented immigrants or of the 30+ million other foreign-born residents, there are far bigger numbers brewing in other parts of the world, indeed numbers that are so large that they could affect decades from now the life of an American citizen far more than the rare determined Mexican or Guatemalan who manages henceforth to scale President Trump’s purportedly impenetrable border wall.


    In the next decades as was so often the case in history, the future shape of the world could once again be decided in Europe and by Europe’s and the West’s handling of Africa’s incipient demographic boom.

    In fact, if you are a generous-minded European who shares the Pope’s noble sentiment and who views the ongoing wave of migrants coming into your country as a benign and positive development; or, if you believe that borders are outdated constructs and that all refugees and other immigrants should be welcomed into the rich world; indeed, if it is your view that anyone who stands in the way of this openness is misguided by racist and nefarious motives, then it behooves you to test the strength of your belief by examining the larger demographic data coming out of Africa and Asia.

    Because it is likely that your kindness and generosity will be, in the next decades, tested to their limits (unless they are limitless like the Pope’s). Because the two million people who have entered Europe on foot or via inflatable rafts in the past few years are, in scale, only thin vapor rising out of the demographic cauldron that is boiling up in Africa and south Asia. There are potentially many many more to come.

    The Numbers

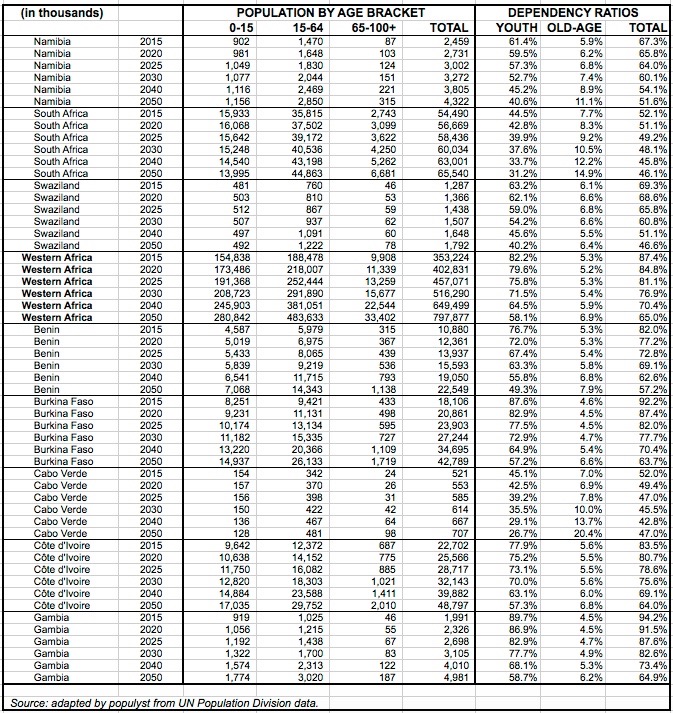
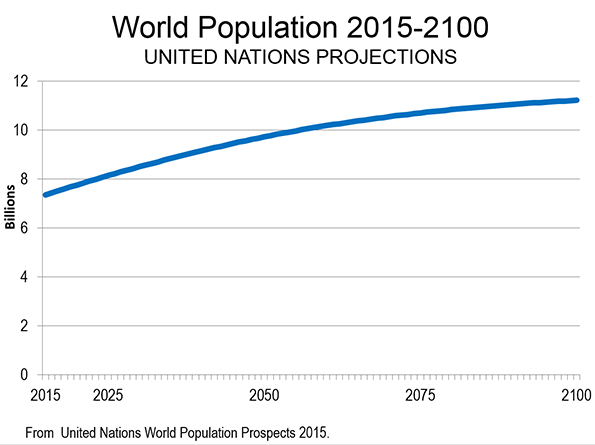
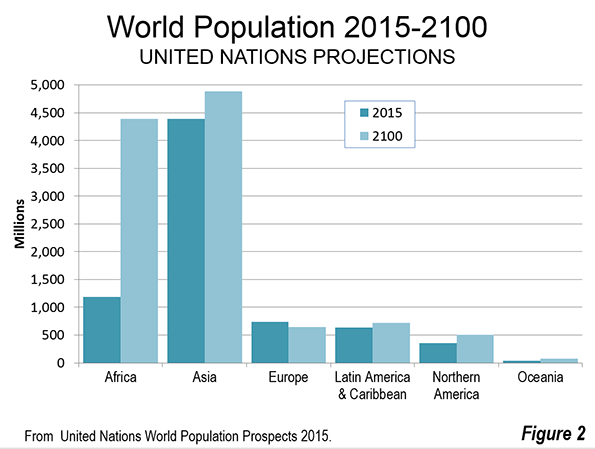
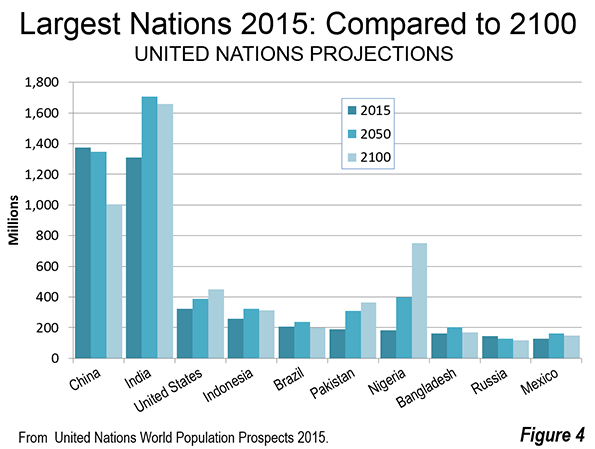
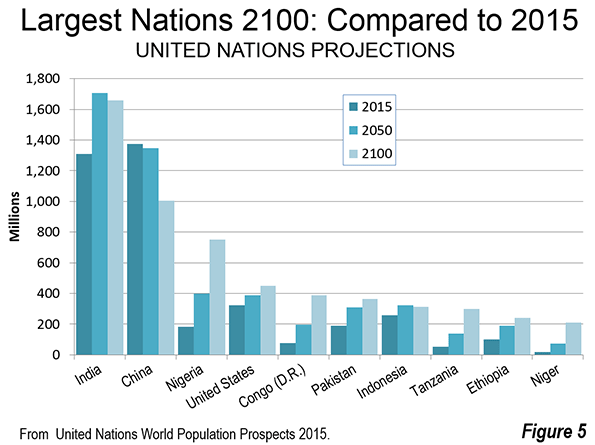
    If Africa does not get its act together to start creating jobs at a rapid rate, there may be tens of millions more such people attempting to migrate in the future. The world population in 2015 stood at 7.3 billion and, on the UN’s medium variant, was expected to rise to 9.7 billion in 2050. Half of this 2.4 billion increase would take place in sub-Saharan Africa where the population will more than double in nearly every country.

    (See at the bottom of the article region and country tables derived from the UN’s medium variant).

    Today sub-Saharan Africa has a billion people. In 2050, it will have 2.1 billion. Of more vivid concern is the fact that the working-age population, aged 15 to 64, will grow by 800 million people from 500 million to 1.3 billion. This 800 million increase is roughly equal to five times the current size of the US labor force.

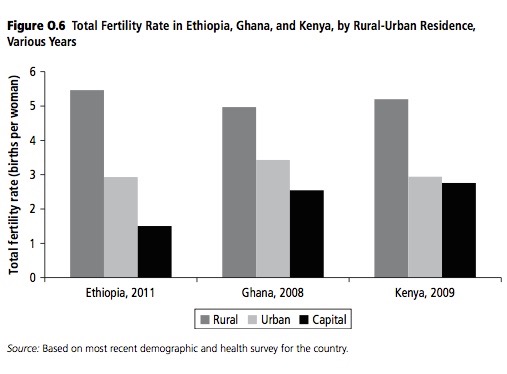
    It is possible that these numbers are too high. But it should be noted that, in arriving at these forecasts, the UN Population Division has plugged into its assumptions a significant decline in fertility rates across the sub-continent, from 4.8 children per woman today to 3.1 in 2050. On a constant-fertility scenario assuming no decline in the fertility rate, the population boom would be even larger. The working age population would rise to 1.6 billion (instead of 1.3 billion under the median variant) and the increase from today would then be equal to 1.1 billion (instead of 800 million). These are unimaginable numbers that are unlikely to materialize.

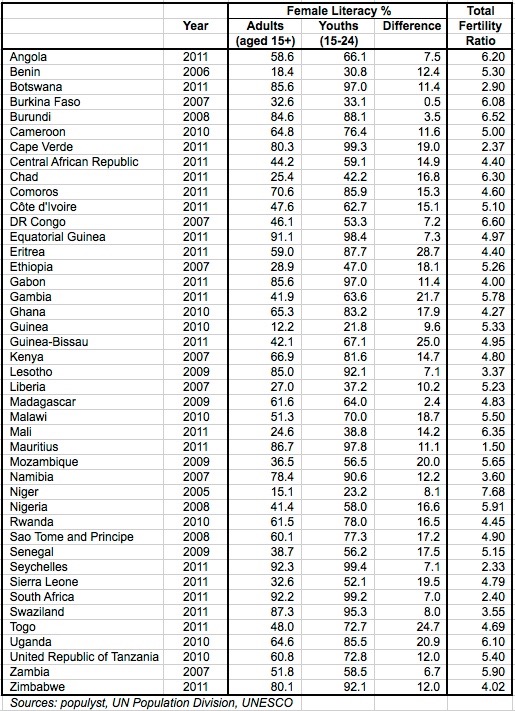
    (See this article for the Total Fertility Ratio of every African country from the highest, Niger at 7.7, to the lowest, Mauritius at 1.5.)

    In some ways, the precise magnitude of the boom is unimportant, so long as we accept that it will be somewhere between large and very large. Even a sanguine scenario that would halve the increase of the working age population from 800 million to 400 million would still present a challenge that African economies are today ill-equipped to handle. Economic conditions are insufficient even today to adequately feed, dress, educate and shelter the population.

    One reason to feel some optimism is the fact that the BRIC countries (Brazil, Russia, India and China) also experienced a big rise in their working-age populations in the past thirty-five years and they managed to handle their demographic boom effectively. But this positive outcome was greatly assisted by a steep decline in China’s dependency ratio (DR) from 0.77 to 0.38. The DR is the ratio of dependents, children and the elderly, to working adults.

    By comparison, the DR of sub-Saharan Africa is projected to fall from 0.86 today to a still elevated 0.63 in 2050. The decline in the youth DR (see tables below) is somewhat offset by a rise in the old-age DR that is itself due to an expected increase in life expectancy.

    Certainly, if African fertility falls faster than median variant estimates, the total DR would decline more rapidly and there could be a faster acceleration in job creation and in GDP per capita.

    (See at the bottom of the article the change in the dependency ratio for every country).

    The Drive for Change

    Africa is a wealthy continent but its wealth is highly concentrated in the hands of a few and it is often domiciled outside of Africa, in offshore financial centers, and in real estate and other assets all over the developed world. For decades, this configuration has worked wonders for Africa’s rulers and their entourages.

    If the above numbers are correct, that configuration is not sustainable in the long run. Not only will there be many more Africans in the future than in the past, but the advances in global connectivity through the internet and mobile phones mean that these future Africans will be much more aware of the prevailing living standards in the rich world. Even now, each has in the palm of his hand a direct visual connection to Europe, the United States and other prosperous places. They have seen what a rich society looks like and they want their own place within it.

    So what are the steps that can be taken to improve conditions in Africa? They can be summed up as the following:

    • Fight corruption and cronyism. They divert capital to a small percentage of the population, capital that should be re-invested within Africa.

    • Stop or reduce capital flight from poor to rich countries. A lot of Africa’s money is parked in offshore bank vaults, real estate projects or trophy property in the West.

    • Raise confidence among foreign investors. With less corruption and clearer exit strategies, foreign money would flood into Africa.

    • Institute a more inclusive form of governance that helps spread power and wealth away from the elite and to a greater segment of the population.

    • Create or reinforce an independent judiciary, strengthen the rule of law, including respect for contract law and property rights.

    • Invest in infrastructure. Africa needs trillions of dollars for projects ranging from power generation and water treatment plants to new roads and transportation systems.

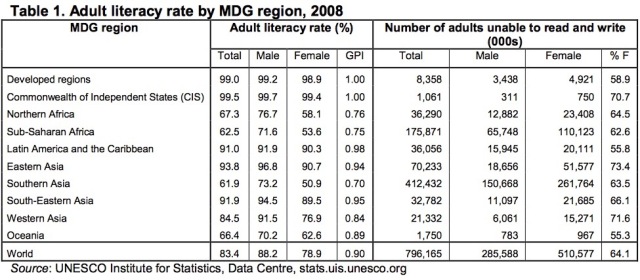
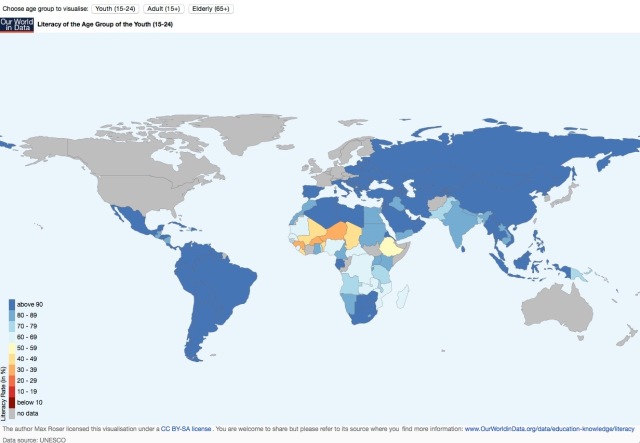
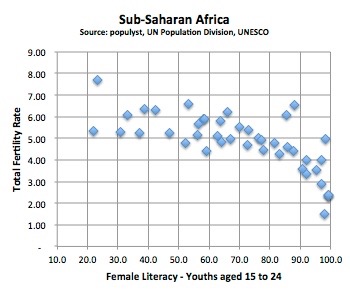
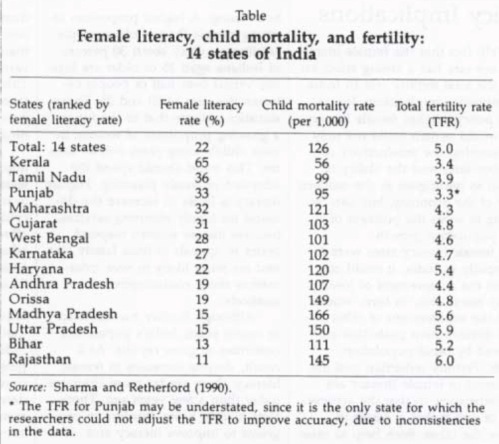
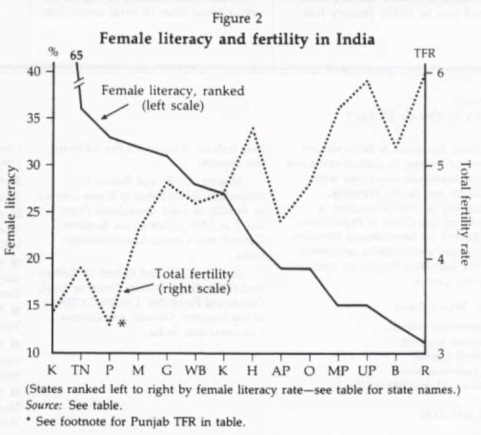
    • Boost literacy to rich-country levels, and close the gender gap in literacy. There is a strong correlation between female literacy and fertility. The greater the literacy, the lower the number of children per woman.

    • Lower fertility. There is also a strong correlation between fertility and GDP per capita. Several countries like China that experienced a sharp decline in fertility enjoyed a significant demographic dividend.

    Because there is now on the one hand an entrenched elite that may not easily let go of its privileges and on the other hand enormous demographic pressure on the economy, it is becoming clear that the current configuration is no longer sustainable. Either Africa gets on the fast road to modernization and industrialization, or the continent could suffer dislocation and instability at a near unimaginable scale.

    There is certainly a strong desire by many foreign parties to invest in Africa, but there is a lack of confidence in one’s ability to recover the investment with or without a profit. This major hurdle can be overcome by modernizing Africa’s institutions and its financial system, and as importantly by attacking corruption and cronyism.
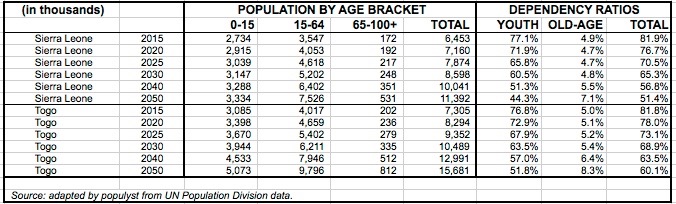
    Tables

    The data below were compiled by populyst from the UN Population Division’s medium variant. Note that in sub-Saharan African in 2015-2050:

    • the youth population (under 15 years old) is not quite doubling.

    • the working-age population (15 to 64) is more than doubling.

    • the elderly population (over 64) is more than tripling, albeit from a low base.

    In the world overall, the under 15 number will be stagnant, the 15-64 will grow by 25% and the over 64 will more than double.

    This piece originally appeared on Populyst.net

    Sami Karam is the founder and editor of populyst.net and the creator of the populyst index™. populyst is about innovation, demography and society. Before populyst, he was the founder and manager of the Seven Global funds and a fund manager at leading asset managers in Boston and New York. In addition to a finance MBA from the Wharton School, he holds a Master’s in Civil Engineering from Cornell and a Bachelor of Architecture from UT Austin.

    Photo: Lars Rohwer (Lars Rohwer – per OTRS) [CC BY-SA 3.0], via Wikimedia Commons

  • New Infrastructure in Sub-Saharan Africa

    This post will be continuously updated as we learn about new projects.

    On the three main vectors of wealth creation, African countries have lagged other developing nations for several decades. Sub-Saharan Africa is the poorest region of the world and suffers from poor infrastructure, uneven literacy, endemic corruption, political instability and war. While this is problematic for the present, improving conditions are pointing to a more promising future.

    In particular, sub-Saharan Africa could have a unique opportunity to realize a demographic dividend if its elevated fertility rate and dependency ratio decline in the same way as have those of other countries in the past.

    The experience of China shows that a significant dividend can be reaped if other conducive factors are also present. Most important among them are a growing workforce that is more literate and productive, and an institutional framework that is supportive of economic development.

    Innovation-based productivity gains as we understand them in the West can be scarce in the poorest developing countries. But productivity can be improved quickly through educational programs and through well targeted infrastructure projects.

    There is much to do given that Africa has a large infrastructure deficit. A World Bank Fact Sheet provides the following numbers:

      • Electricity: The 48 countries of Sub-Saharan Africa (with a combined population of 800 million) generate roughly the same amount of power as Spain (with a population of 45 million).

      • Roads: Only one-third of Africans living in rural areas are within two kilometers of an all-season road, compared with two-thirds of the population in other developing regions.

      • Water: Water storage capacity is currently 200 cubic meters per capita and needs to increase to at least 750 cubic meters per capita, a level currently found only in South Africa. Only six million hectares, concentrated in a handful of countries, are equipped for irrigation. Though less than five percent of Africa’s cultivated area, the irrigation-equipped area represents 20 percent of the value of agricultural production.

      • The cost of redressing Africa’s infrastructure deficit is estimated at US$38 billion of investment per year, and a further US$37 billion per year in operations and maintenance; an overall price tag of US$75 billion. The total required spending translates into some 12 percent of Africa’s GDP. There is currently a funding gap of US$35 billion per year.

      Below are some recently announced projects in sub-Saharan Africa that will likely have a large impact on nearby populations. (Some of the links are behind a paywall).

      Uganda-Tanzania pipeline

      Tanzania and Uganda signed on May 26 an intergovernmental agreement for the construction of the world’s longest electrically heated crude-oil export pipeline, which is being designed by Houston-based Gulf Interstate Engineering Co.


      The 1,445-kilometer East Africa Crude Oil Pipeline (EACOP) project, which is being developed by France’s Total SA, China’s CNOOC and UK’s Tullow Oil, would enable the commercialization of the estimated 6.5 billion barrels of crude-oil reserves in Uganda’s Albertine basin. (link)

      Tanzania rail project

      A joint venture of Portuguese and Turkish construction firms has been awarded a $1.2-billion contract for a new 202-kilometer, single-track, 1,435-millimeter-gauge railway line, in Tanzania. The segment is part of the 1631-km Dar es Salaam-Isaka-Kigali and Keza-Musongati railway project connecting the country to neighboring Burundi and Rwanda. (link)

      Landlocked Ethiopia seeking stake in Somali port

      Ethiopia is in talks to acquire shares in a joint venture involving DP World Ltd. that will manage a port in northern Somalia, a Somali official said, a move that could give the fast-growing yet landlocked Horn of Africa economy its first stake in foreign docks. (link)

      Mozambique suspension bridge

      Chinese crews, with the help of German supervisors, are building what will be Africa’s largest suspension bridge, in Mozambique. Slated for completion in the third quarter of this year, the 3,003-meter-long, $725-million Maputo Bridge and Link Roads project will strengthen north-south connections and provide a new road link to South Africa and Swaziland. (link)

      East African Power Plant

      Two foreign-led consortiums have been awarded contracts to build the East Africa-sited, 80-MW Rusumo hydropower project, which is intended to reduce electricity costs and promote renewable power in Tanzania, Rwanda and Burundi. (link)

      Rwanda Airport

      The South African subsidiary of a Portuguese civil construction company has won a two-phase, $818-million contract to construct Bugesera International Airport in Rwanda under a build-own-operate-transfer model, with a view to turning it into central Africa’s premier air transport hub by 2018. (link)

      Tallest Building in Africa

      Kenyan President Uhuru Kenyatta recently laid the foundation stone for what will be the tallest building in Africa in the Upper Hill neighborhood of Nairobi. Construction is underway at the development site, and slated for completion by December 2019.


      The ambitious project will see twin glass-facade towers rise above the city, the larger standing at 300 meters tall, far surpassing the continent’s current leader — Johannesburg’s 223-meter Carlton Centre. (link)

      Zimbabwe Road Expansion

      Zimbabwe has signed an agreement with a Chinese-Austrian consortium to resume the delayed $2.7-billion rehabilitation and expansion of the 971-kilometer Beitbridge-Harare-Chirundu highway, which links landlocked Zimbabwe and Zambia to the ports of Durban and Richards Bay in South Africa. (link)

      Dams in Ethiopia

      Italy’s Milan-based industrial group Salini Impregilo has been awarded a $2.8-billion hydropower project by the Ethiopian Electric Power Corp., a state-controlled company that produces, transmits, distributes and sells electricity in Ethiopia.


      The contract involves the construction, with financing from Italy’s credit agency Servizi Assicuative de Commerce Estero, of the 2,200-MW Koysha Dam on the Omo River in the southern part of the country.


      Salini currently is constructing Ethiopia’s 6,000-MW Grand Ethiopian Renaissance Dam, which, when commissioned in 2017, will be Africa’s largest and the world’s No. 11 largest hydropower project. The Italian construction firm last year completed the 1,870-MW Gibe III hydroelectric power project at a cost of $1.6 billion. (link)

      These are only a few examples of the new infrastructure in Africa. The need for new roads, power plants, rail connections, harbors, water and wastewater facilities, telecommunications etc. is very large and presents a significant opportunity for investors, under the proper governance preconditions.

      This piece originally appeared on Populyst.

      Sami Karam is the founder and editor of populyst.net and the creator of the populyst index™. populyst is about innovation, demography and society. Before populyst, he was the founder and manager of the Seven Global funds and a fund manager at leading asset managers in Boston and New York. In addition to a finance MBA from the Wharton School, he holds a Master’s in Civil Engineering from Cornell and a Bachelor of Architecture from UT Austin.

      Photo: Al Gesh Road, Sahara. (Photo by KaiAbuSir via Wikimedia Commons)

  • A Partnership-Driven Process to Promote Entrepreneurship in Ghana

    In Ghana, about 80 percent of the working-age population is self-employed in an economy of improvisation and self-reliance where the quest to make a living is played out daily. The complexity of operating in the business environment — characterized sometimes as fetching water with a basket — has deterred many entrepreneurs from upgrading their business skills, raising capital and taking risks to grow. So many remain in the informal sector — a fluctuating medley of businesses that are agile enough to navigate the ever-changing jumble of economic headwinds but unable to scale up in any meaningful way.

    The hope and promise of local development is that people will be empowered to achieve a higher standard of living in terms of economic prosperity and quality of life. With the advent of Ghana’s formal decentralization policy, the nation’s 216 district assemblies are now the designated champions of local development, which depends considerably on strengthening small and medium-sized enterprises by improving local competitiveness.

    In May, 300 representatives of Ghana’s metro and rural districts assembled in Kumasi, a sprawling city of more than 2 million people, for the second annual Conference on Local Government. Praxis Africa organized the conference on behalf of the Ministry of Local Government and Rural Development, which focused on the United Nations sustainable development goals. Agreed to by 193 countries to mark out a roadmap for global prosperity, the SDGs have a goal of 7 percent growth per year in the world’s least developed countries. Ghanaian President John Mahama has been appointed co-chair of a group of SDG advocates by UN Secretary-General Ban Ki-moon, making the SDGs a prominent dimension of Ghana’s development plans.

    Ghana’s ministers of Local Government and Rural Development, Chieftaincy and Traditional Affairs, and Fisheries and Aquaculture Development, plus the deputy minister of Communication and the regional Ashanti minister all highlighted the need for sustainable, inclusive growth that creates employment and prosperity. Multi-stakeholder partnerships involving government, the private sector and civil society were hailed as the glue that holds the development process together. Collins Dauda, minister of Local Government and Rural Development, affirmed that public/private partnerships are a new way of dealing with the traditional Ghanaian way of doing things, which is known as the “do-and-share” principle.

    Partnership-driven development is essential in an age where many successful enterprises are less the product of an individual entrepreneur than of the assembled resources, knowledge, and other inputs and capabilities that can be mobilized in a local entrepreneurial ecosystem. In Ghana, formalization and growth of micro, small and medium-sized enterprises is essential for development. There is wide agreement that lack of access to finance and markets, low levels of education, poor business skills and an absence of suitable mentors are among the biggest obstacles that entrepreneurs face. Praxis Africa’s guidance to the districts in working with entrepreneurs is to help them by:

    • Understanding the area’s economic advantages and opportunities.
    • Connecting with the business and financial resources that are available locally, regionally and nationally.
    • Navigating the local business environment, including permitting and regulations.
    • Championing infrastructure development that is essential for conducting business.

    Decentralization of economic development is not unique to Ghana, as a confluence of potent forces is creating an era of localism and decentralization across the planet — driven in part by increasing global connectedness. There is no single formula for success for any community in the 21st century. Nonetheless, to foster and sustain a robust local economy, a community must take full advantage of its unique combination of resources, culture, infrastructure, core competencies in industry and agriculture and the skills of entrepreneurs and workers. 

    Delore Zimmerman, president of Praxis Strategy Group in Fargo, N.D., and co-founder of Praxis Africa.

    Photo: a panel discussion as part of the second annual Conference on Local Government, held in may in Kumasi, Ghana. IMAGE: PRAXIS AFRICA

  • MENA Economies: Trouble Ahead

    The economies of the Middle East and North Africa (MENA) are ill prepared for the coming population boom.

    War, terrorism, repression and poverty are all common features in much of today’s Middle East and North Africa (MENA). How are the region’s demographics changing in the next few decades? And what is the prognosis for improved living conditions?

    It is difficult to look at the UN 2015 report and believe that the future will play out as outlined by the numbers. Even under the UN’s ‘medium variant’, which assumes a steady decline in total fertility ratios (TFR = average children per woman), the projected population growth would add significant stress on nations that are ill prepared to feed, educate and provide the needed jobs of the future.

    Note in the first table that TFRs have been falling for decades and are expected to continue trending towards the 2.1 replacement level, or indeed lower in many cases. Except for Egypt, the North African countries are already near replacement and will dip lower by 2050. And all the Western Asia countries, with the notable exception of Iraq, will be near or below replacement by 2050.

    (click to enlarge.)

    Screen Shot 2016-01-08 at 9.54.57 AM

    Yet between now and 2050, the MENA population will still grow significantly. Every country will have more people by 2050 than today. Lebanon stands out as the sole exception but this is explained by the fact that its population recently bulged by 20% or more due to the influx of Syrian refugees. In due time, a number of these refugees will return to Syria or emigrate to a third country.

    (click to enlarge.)

    Screen Shot 2016-01-08 at 9.54.51 AM

    In thirty five short years, Egypt is seen adding 60 million people to its current 91 million. The people of Iraq, Yemen and Sudan would double and those of Somalia nearly triple. The relatively richer Iran and Turkey (technically not in the MENA region but added here for comparison) will grow more modestly, as will oil-rich Kuwait, Saudi Arabia, the UAE and Qatar. In all, there will be nearly 300 million more people in the MENA, a worrying prospect given the current condition of the region’s economies.

    (click to enlarge.)

    Screen Shot 2016-01-08 at 9.54.38 AM

    Under the right conditions, a growing population could be an encouraging sign and a potent contributor to economic growth. But these conditions include a falling dependency ratio (the number of children + elderly, divided by the number workers). In this case, as shown in the table, the dependency ratio is expected to rise in half the MENA countries. An encouraging sign is the fact that it will be falling in the countries with the fastest growing populations, though perhaps not sufficiently to create the opportunity for a strong demographic dividend.

    In Egypt for example, the DR would fall from 62.3 to 56.5, not a large decline. And in Iraq, it would go from 78.7 to a still high 63.7. Yemen and Syria stand out for faster declines in their DRs but these figures may be less reliable given the current turmoil they suffer.

    (click to enlarge.)

    Screen Shot 2016-01-08 at 9.54.21 AM

    The MENA region therefore faces a long-term challenge to absorb the large rise in its working-age populations. As shown in this table, there will be, within 35 years, 40 million more Egyptians and 30 million more Iraqis seeking employment and improved living standards. In the entire MENA, there would be 180 million more people of working age. Optimism dictates that from the current travails will emerge a model that meets the needs of these rising populations.

    Some economic figures

    Compared to the years 2001-05 and 2006-10, the most recent five year period has seen a marked slowdown in Egypt, Jordan, Oman, Lebanon and Qatar, and continued strong growth in Saudi Arabia, the UAE and Iraq (to the extent that these figures can be trusted). The IMF’s estimates for 2015 and 2016, shown in the table, may prove too optimistic if energy prices remain low.

    (click to enlarge.)

    Screen Shot 2016-01-12 at 5.21.32 PM

    Screen Shot 2016-01-12 at 5.19.25 PM

    Per capita GDP shows a clear divide between on one side the oil rich countries Saudi Arabia, Qatar, Kuwait and the UAE, and on the other side poor or mismanaged countries. In theory, Iraq’s and Libya’s oil wealth should position them to join the club of the wealthy. But with the price of oil down from over $100 per barrel in 2014 to about $30 today, there will be contraction in the GDP figures of the richer countries with repercussions across the entire MENA region.

    (Note: Per UN appellation and data in this article, State of Palestine encompasses the West Bank and Gaza.)

    Sami Karam is the founder and editor of populyst.net and the creator of the populyst index™. populyst is about innovation, demography and society. Before populyst, he was the founder and manager of the Seven Global funds and a fund manager at leading asset managers in Boston and New York. In addition to a finance MBA from the Wharton School, he holds a Master’s in Civil Engineering from Cornell and a Bachelor of Architecture from UT Austin.

    MENA country map by DanPMKOwn work adapted from Africa in the World (grey).svg by TUBS, CC BY-SA 3.0, .


  • How Many People Will Live in Africa in 2050 and 2100?

    Large declines in fertility will depend on raising female literacy above 80%.

    Every few years, the United Nations Population Division releases demographic projections for the entire world and for every country, region and continent. Although the UN’s database is the most used source on demographics, the data is not equally reliable for all countries.

    Countries in the developed world conduct regular censuses and produce detailed numbers that are considered reliable. Less developed countries conduct censuses on an irregular basis or are completely unable to conduct them and have instead to rely on demographic sampling. In the poorest countries of the world, most of which are in sub-Saharan Africa, censuses are infrequent or nonexistent and even sampling can be irregular and unreliable.

    This poses a problem today because the biggest population growth by far is expected to take place in these same poor countries. In order to get a fair picture of the world population in the 21st century, we need to get reliable data from the fastest growing region.

    François Pelletier who heads the UN’s Population Estimates and Projections Section told populyst that he considers the data for the next 35 years, that is the projections for the years 2015-2050, to be fairly reliable, with greater confidence in the near years than in the later years. The further the horizon of the projections, the greater the uncertainty. In this regard, Pelletier suggested that the projections beyond 2075, especially those focusing on the median trajectory at the country level, be treated with some degree of caution.

    This makes perfect sense because a small change in the assumptions for child mortality and total fertility ratios (TFR = average children per woman) will have a relatively small impact in the near years and a cumulatively larger impact in the later years.

    For example, if we assume for sub-Saharan Africa a low variant fertility ratio of 4.02 children per woman in 2020-2025 instead of a medium variant closer to 4.42, the cumulative impact of this change adds up to a difference in population size of ‘only’ 80 million people after ten years, a 5% deviation, but of as many as 600 million after fifty years, a 20% deviation.

    Another source of demographic projections is the Vienna-based Wittgenstein Centre and it has cast doubt on the UN’s projections for world and Africa populations. In a note written by Samir KC, the Centre argues that the UN’s projections are too high because the fertility ratio in Africa is likely to fall faster than the UN predicts.

    The Centre’s rationale is reached through analogy with the Asian fertility decline between 1970 and 1990 which was steeper than is predicted by the UN for Africa. Samir KC writes (our emphasis):

    Once countries urbanize and citizens become wealthier, fertility declines everywhere.

    The most important factor is women’s education. Already today, an Ethiopian woman with secondary education has on average only 1.6 children, compared to a woman with no education who has 6 children.

    This relationship is true across Africa (see figure).

    Fertility-rate

    We know that access to education is expanding across Africa. There is even talk of an education dividend.

    Once all girls go to school and stay there longer, they will have fewer children, especially as they will also be exposed to a more modern lifestyle, be it through TV, the cell phone and the fact that Africa is urbanizing rapidly.

    This has also been the experience in Asia. It took about 20 years in Asia for its fertility to decline from more than 5 children per woman during early 1970s to less than 3 children per woman in early 1990s.

    Similarly, India took about 20 years for its fertility to decline from 4.7 children per woman in early 1980s to 3.1 by early 2000s.

    With new development and the plans for the better future in the making, it won’t be a surprise if the average African family would have only three children as soon as 2035.

    If that assumption bears out, then Africa cannot reach 4 billion — and the world would peak this century at below 10 billion.

    So who is right, the UN or the Wittgenstein Centre?

    First, let us look at what each party is projecting. Second, let us examine in greater depth the correlation between fertility ratios and female literacy. Finally, let us see if the Wittgenstein Centre’s use of the Asian precedent makes sense for Africa.

    Running the Numbers

    Screen Shot 2015-11-17 at 8.16.19 PM

    The adjoining tables (click to enlarge) show the UN’s projections for its low and medium variants. We ignore the high variant and other variants for now because our main purpose is to discuss whether the medium variant is too high, as alleged by the Wittgenstein Centre.

    If we look at the two variants for the year 2050 in the table below, we can see that the difference in population size in sub-Saharan Africa is about 200 million or approximately 10% of the total, a non negligible deviation but one that does not fundamentally alter one’s view of the future. Looking further out to 2100, the difference is much more significant at nearly 1.2 billion or about 30% of the total.

    Going through the same comparison for the whole world, the difference is 1 billion in 2050 and a big 4 billion in 2100, respectively 10% and 50% of the total. Also highlighted are figures for India, another high growth country.

    Screen Shot 2015-11-17 at 8.15.20 PM

    The Wittgenstein forecast is a bit lower than the UN’s low variant and assumes a sub-Saharan fertility ratio of 3.0 instead of 3.25 for the UN. Its population estimates for Africa in 2100 is 2.6 billion people, marginally lower than the UN’s low variant which is at 3 billion. We say “marginally” only in the sense that this difference looks large but it results from a small change in assumptions starting now 85 years earlier.

    Female literacy and Fertility Ratios

    Looking at women’s education, it is clear that female literacy, the cornerstone of Wittgenstein projections, is further behind in sub-Saharan Africa than in any other region of the world. The Indian subcontinent and the Middle East/North Africa also lag the rest of the world. Table 1 below shows that the lag in female literacy has been most pronounced in Southern Asia, Africa and the Middle East (Western Asia). Encouragingly, table 2 shows that the lag is significantly narrower among younger people.

    Screen Shot 2015-11-21 at 6.29.19 AM

    Screen Shot 2015-11-21 at 6.29.11 AM

    It is clear that literacy is improving in Africa. The Oxford economist Max Roser compiled this map from UNESCO data and published it on his site Our World in Data. Click on the map to use the interactive feature.

    Screen Shot 2015-11-20 at 12.10.37 PM (2)

    The data shows solid progress in the literacy rate for youth aged 15-24, compared to older groups. For example, 66% of Nigeria’s youth (15-24) are literate, compared to 51% for the overall adult population (defined as 15+ here) and only 22% for the elderly population (65+). Other sub-Saharan countries show a similar progression.

    The countries with the highest literacy rate among the youth group are also the ones with the lowest fertility ratios. Botswana and South Africa have youth literacy rates of 95% and 99% and TFRs of 2.9 and 2.4, respectively.

    One surprising data point is Kenya with a literacy rate of 82% and a TFR of 4.4. Though lower than the 5.1 sub-Saharan average, Kenya’s TFR is still quite high, suggesting that the biggest decline in fertility may occur at a literacy rate that is higher than 80% or 85%. It may be that the TFR falls slowly as literacy rises from 50% to 85% and falls rapidly as it rises from 85% to 100%.

    In order to examine this hypothesis, we compiled the following tables and charts.

    The table shows rates of female literacy for all sub-Saharan countries (except Congo, Somalia and South Sudan). Many of these figures may not be reliable but the trend is clear that female literacy is improving all over the African subcontinent.

    Screen Shot 2015-11-23 at 11.25.32 AM (2)

    Plotting these figures, we reach the most important conclusion which is that the biggest decline in total fertility takes place after female literacy rises over 80%. Under 80%, the fall in TFRs and correlation with literacy is very weak. Excluding all countries with female adult literacy over 80%, the regression has an r-squared of only 0.29 (0.21 if the outlier Niger is also removed). Data from Burundi, Equatorial Guinea and Uganda look somewhat suspect with literacy over 80% and TFRs at 6.5, 4.97 and 6.1.

    Screen Shot 2015-11-23 at 11.19.09 AMVersion 2


    There may be cultural factors that may slow down this dynamic. In order to get a fuller picture, we looked for data on gender inequality. The United Nations Development Programme ranks countries by gender inequality. As shown in the table below, sub-Saharan African countries dominate the bottom of the ranking. It is not surprising that countries ranked lowest on the Gender Inequality Index also have the lowest female literacy and highest fertility ratios. Niger, Mali, Chad, DR Congo, Mozambique, Liberia, CAR all still have youth female literacy well below or barely above 50%. Niger looks especially challenging with a TFR of 7.7 and very low female literacy.

    Screen Shot 2015-11-19 at 2.03.39 PM (2)


    Non-African countries among the bottom 30 include lowest-ranked Yemen (152nd), Afghanistan (149th), Papua New Guinea (135th), Haiti (132nd), Egypt (130th), Pakistan (127th), India (127th) and Syria (125th). Nigeria and a number of others were not ranked in the latest data.

    Analogy with Asia 1970-1990

    Finally, does the Wittgenstein’s use of the precedent of Asia in 1970-1990 make sense for Africa now? We can see in the tables above that the fertility ratio in Asia fell from 5 in 1970 to 3 in 1990.

    We can also see that China played a big role in this decline with its own TFR falling from 5 to 2. The one-child policy contributed to this accelerated decline but a big leap in literacy from about 50% to well over 90% was also a big contributor. Our hypothesis that fertility falls modestly under 80% female literacy, and collapses precipitously above 80% is supported by the Chinese experience. Literacy rose in the 1950s and 1960s but the TFR was still at 6.3 children per woman in 1965-70, very close to the 1950-55 TFR of 6.11. But twenty years later in 1985-90, female youth literacy exceeded 90% and the TFR fell to 2.75.

    India is following a similar path with its female youth literacy ratio rising from 67.7 in 2001 to 87.2 in 2015 and its TFR falling from 3.3 in 2001 to 2.48 now. In the case of India however, the decline appears more gradual and is not obviously faster above the 80% literacy threshold. The table and graph below show that in the case of India the correlation holds well for literacy rates that are well below 80%.

    Screen Shot 2015-11-23 at 4.11.32 PM (2)Screen Shot 2015-11-23 at 4.11.55 PM (1)


    Other considerations

    Another way to gauge the validity of the Asia analogy is to see whether Asia was more or less developed in 1970 than sub-Saharan Africa is today. If Asia was more developed, then the analogy may not be valid and the decline in African TFR will likely be slower. In order to answer this question, we look at electricity consumption per capita as a proxy for development.

    According to the World Bank, electricity consumption per capita in 1970 was 150 kilowatt hour (kWh) in China and 95 kWh in India. Below are the figures for the most populous countries in sub-Saharan Africa.

    Screen Shot 2015-11-19 at 1.20.03 PM (2)


    Per capita electricity consumption in Kenya and Nigeria in 2012 (most recent World Bank data) looked roughly in line with China in 1970, while DR Congo and Tanzania in 2012 looked closer to India’s consumption in 1970. In the absence of a more robust method, we could say that the TFR in Kenya and Nigeria could decline like China’s in 1970-90, while the TFR in DR Congo and Tanzania could decline like India’s, and the TFR in Ethiopia and Uganda could decline even more slowly.

    Under this scenario, the TFR for Kenya and Nigeria would fall to 2 by 2035, while in DR Congo and Tanzania, it would fall to only around 4, and in Ethiopia and Uganda to a still higher level.

    In a similar vein, we could look at urbanization since people living in urban areas tend to have fewer children. With the exception of Uganda, all the countries in the table appear more urbanized than China was in 1970. The percentages shown for DR Congo (42%) and Nigeria (46.9%) look suspect because they are not far below China’s current percentage of urbanization 54.4%. It looks like definitions of urbanization differ across countries and we may fall back on electricity consumption as a more reliable indicator.

    Version 2


    Conclusion

    All in, the answer to how fast African TFRs will decline remains elusive. We can however draw the following conclusions:

    • Demographics are not on automatic pilot. Proactive intervention to raise female literacy, to invest in infrastructure and to improve governance will all have a significant impact on future fertility rates. Absent these measures, it should not be assumed that TFRs will decline in Africa as fast as they did in Asia. They may remain high or they may decline for other reasons such as food or water scarcity.
    • The correlation between female literacy and fertility ratios is neither linear nor gradual. In the case of sub-Saharan Africa, TFRs seem to decline rapidly above 80% female literacy. Below 80%, the correlation is negligible or nonexistent.
    • The recent history of Asian fertility may or may not be a reliable precedent for Africa. China’s evolution in particular was greatly impacted by government policy, including the one-child policy, the literacy campaigns and the expansion of global trade.
    • Data from Africa and other less developed countries is generally unreliable. For example, it is possible that literacy rates and/or fertility rates for some African countries are inflated. It is also possible as a consequence that the relationship between literacy and fertility is in fact quite linear, as seen in the case of India.

    Sami Karam is the founder and editor of populyst.net and the creator of the populyst index™. populyst is about innovation, demography and society. Before populyst, he was the founder and manager of the Seven Global funds and a fund manager at leading asset managers in Boston and New York. In addition to a finance MBA from the Wharton School, he holds a Master’s in Civil Engineering from Cornell and a Bachelor of Architecture from UT Austin.

    Some sources used in this article:

    UNESCO Institute for Statistics: ADULT AND YOUTH LITERACY: National, regional and global trends, 1985-2015

    UNESCO Institute for Statistics: ADULT AND YOUTH LITERACY: Global Trends in Gender Parity

    Population Institute: How Female Literacy Affects Fertility: The Case of India

    Sreemarti Chakrabarti: Women and Adult Literacy in China

    World image by BigStockPhoto.com.

  • Report: Africa’s Demographic Transition, Dividend or Disaster?

    A recent report published jointly by the World Bank and by Agence Française de Développement highlights the challenge of realizing Africa’s promised demographic dividend. The title Africa’s Demographic Transition: Dividend or Disaster? (see footnote 1) sums up the authors’ thesis that the dividend is not an automatic result of falling fertility ratios (TFR).

    Instead, falling TFRs open a window of opportunity which can lead to a demographic dividend when governments and the public sector implement the requisite steps to capitalize on this opportunity. Lower child mortality usually leads to falling fertility ratios and improvements in women’s health. But most important among concurrent or subsequent initiatives are investments in education, and the provision of sufficient jobs to a booming working-age population.

    From the report [our emphasis]:

    Declines in child mortality, followed by declines in fertility, produce a “bulge” generation and a period when a country has a large number of working-age people and a smaller number of dependents. Having a large number of workers per capita gives a boost to the economy provided there are labor opportunities for the workers.

    And elsewhere:

    The first and perhaps most challenging step is to speed up the fertility decline in countries where it is currently slow or stalled. Reducing fertility leads to immediate gains in income per capita as youth dependency rates fall. However, achieving the full potential of the demographic dividend requires economic policies that take advantage of the opportunity. Formulating and implementing policies that strengthen financial institutions and encourage saving will channel rising incomes into domestic savings and investments that further fuel growth and development.

    Empirical evidence points to three highly interactive accelerators [of fertility decline]:

    • Health, especially child health. Child health is a critical input into fertility declines. As children’s health and survival rates improve, family demand for more children declines as confidence in child survival increases. Smaller family sizes improve maternal health, which further improves child health, completing a virtuous cycle.
    • Education, especially education for girls. Female education is a critical driver of lower desired fertility and the transition from high to low fertility. Fertility decline, in turn, has a strong effect on education by allowing for fewer, healthier, better nourished, and better educated children.
    • Women’s empowerment, which is clearly related to the first two. Better educated and healthier women with more market, social, and decision-making power in the family—are likely to have fewer children (World Bank 2011). And women who have fewer children—as a result of delayed age of marriage, delayed first sexual contact, or more space between births—are much more likely to enter the paid labor market, to have higher earnings, and to be more empowered.

    Further, the report provides a road map of the policies that are necessary to convert fertility decline into a first demographic dividend and a second demographic dividend. These policies are shown in Table 0.3 (all charts below are from the report).

    Screen Shot 2015-10-29 at 10.04.26 AM


    Table 0.1 shows a correlation between each country’s total fertility ratio (TFR) and its GDP per capita. Countries with high TFRs have lower GDP per capita. Some of the most populous countries, Kenya, Ethiopia and Tanzania are in the middle ranges, while others like DR Congo are near the GDP bottom (and TFR top). Nigeria is an outlier with better than average GDP per capita but a higher than average TFR. Botswana and South Africa have higher GDP per capita and lower TFRs.

    Screen Shot 2015-10-28 at 1.49.21 PM


    Table 0.2 shows the relation of child mortality and TFRs. Low mortality coincides with a low TFR. Nigeria and DR Congo are problematic with high mortality and high TFRs, whereas Tanzania still maintains a higher than average TFR despite relatively low child mortality.

    Screen Shot 2015-10-28 at 1.50.27 PM


    Figure 0.5 shows the evolution of TFRs for several countries since 1960. Niger’s remained high while South Africa’s declined. Nearly all country TFRs are falling, albeit at a slower rate than previously expected in some cases.

    Screen Shot 2015-10-28 at 1.49.50 PM

    Figure 0.6 shows the clear divide in TFRs between rural and urban areas of Ethiopia, Ghana and Kenya. An increase in agricultural productivity and the creation of urban jobs will contribute to further declines in TFRs.

    Screen Shot 2015-10-28 at 1.50.06 PM


    Download the full report here.

    Sami Karam is the founder and editor of populyst.net and the creator of the populyst index™. populyst is about innovation, demography and society. Before populyst, he was the founder and manager of the Seven Global funds and a fund manager at leading asset managers in Boston and New York. In addition to a finance MBA from the Wharton School, he holds a Master’s in Civil Engineering from Cornell and a Bachelor of Architecture from UT Austin.

    1. Canning, David, Sangeeta Raja, and Abdo S. Yazbeck, eds. 2015. Africa’s Demographic Transition: Dividend or Disaster? Africa Development Forum series. Washington, DC: World Bank. doi:10.1596/978-1-4648-0489-2. License: Creative Commons Attribution CC BY 3.0 IGO
  • Providing Electricity to Africa by 2050

    How many Africans will have access to electricity by 2050?

    According to the World Bank’s latest figures, 64.6% of the population of sub-Saharan Africa lacked access to electricity in 2012, or a total of 572 million people. Across the world, 1.09 billion have no access to electricity. So, sub-Saharan Africa accounts for more than half the total.

    Given the expected boom in the African population and the likely increase in access, the demand for electricity infrastructure is going to explode between now and 2050. On UN estimates (medium variant), the sub-Saharan population will jump from 886 million in 2012 to 2.1 billion in 2050. Assuming that each country’s current access rate remains the same, 381 million additional people will have access to electricity and 855 million additional people will not.

    Screen Shot 2015-09-15 at 4.33.48 PM (2)

    In order to maintain its current low rate of access, sub-Saharan Africa would have to increase its power generation by at least 100%, and more likely by 200% or more if one accounts for the frequent power outages across the continent.

    In order for the subcontinent to raise to 50% the percentage of people who have electricity on a reliable basis, it would need to increase its electricity generation by a factor of 3 to 5.

    Power Africa

    Then there is President Obama’s Power Africa initiative launched in 2013 which seeks to “double access to power in sub-Saharan Africa”. At first, Power Africa focused on six countries – Ethiopia, Ghana, Kenya, Liberia, Tanzania and Nigeria – and its goal was to add 10,000 megawatts of electricity generation and 20 million new connections.  But during the US-Africa Leaders Summit of 2014, the program was expanded to other countries and its scope was tripled to 30,000 megawatts and 60 million new connections. (Note: this assumes 2,000 connections per megawatt. In developed countries, the ratio is often closer to 1,000 connections per megawatt).

    July 2015 fact sheet from the White House states that Power Africa has helped bring on line 4,100 megawatts to 4 million connections. But critics claim that these projects were already in progress before the program was introduced and that new projects have been slow to get off the ground. As reported in this New York Times article, Sam Amadi, chairman of the Nigerian Electricity Regulatory Commission, the country’s electric power regulator, recently said that he was “not aware of any concrete plans for power plants that have emerged as a result of Power Africa.”

    In the long term, if ‘double access’ means doubling the number of people who have access to electricity without necessarily increasing individual consumption, that would translate into access for an additional 314 million people, roughly equivalent to the current size of the US population.

    But if ‘double access’ means doubling the percentage of people who have access to electricity, that would mean enough new electricity to reach an additional 1.19 billion people on the continent in 2050. This number exceeds the 2015 combined populations of the USA and Europe.

    If Africa reaches 100% access in 2050, it will have built enough infrastructure to reach 1.8 billion additional people, a near six-fold increase from the number that have access today.

    Other populous nations of the world already enjoy higher access rates. But here also, there is likely to be significant new demand from rising population numbers. Assuming the same access rates in 2050 as in 2012, there would need to be new infrastructure to reach an additional 708 million people living in Mexico, Brazil and several Asian countries.

    Per Capita Consumption

    At the same time, ‘access’ can mean different things to different people. In the United States, per capita consumption of electricity stands at nearly 13,000 kWh. In China, it is 3,475 kWh. In India, 744 kWh and in much of sub-Saharan Africa, it is less than 500 kWh. Below are per capita consumption numbers for Africa.

    Screen Shot 2015-09-23 at 2.25.54 PM (2)<

    And here are per capita consumption numbers for other emerging nations:

    Screen Shot 2015-09-23 at 2.26.12 PM (2)

    As usual, financing and execution will be the main hurdles but it is clear that the demand for new electricity infrastructure is going to be very very high in Africa and in Asia.

    Sami Karam is the founder and editor of populyst.net and the creator of the populyst index™. populyst is about innovation, demography and society. Before populyst, he was the founder and manager of the Seven Global funds and a fund manager at leading asset managers in Boston and New York. In addition to a finance MBA from the Wharton School, he holds a Master’s in Civil Engineering from Cornell and a Bachelor of Architecture from UT Austin.

    Photo by DIVatUSAID via Flickr

  • 500 Years of GDP: A Tale of Two Countries

    Last year (2014), China overtook the United States in gross domestic product adjusted for purchasing power (GDP-PPP, see point 4 for explanation), according to both the International Monetary Fund (IMF) and the World Bank (Note 1). It may come as a surprise, but this is really a matter of China simply reasserting its position as the world’s largest economy, which it had lost around 1890 to the United States. This is based on estimates developed by the late legendary economist Angus Maddison of the Organization for Economic Cooperation and Development (OECD).

    Over the 515 years from 1500 to 2015, the available data seems to suggest that the largest economy in the world almost always been either China or the United States. The one exception indicated was in 1700, when India had the highest GDP (for most years there is only incomplete data). This article provides highlights of GDP PPP data in US$2015 (Note 2), beginning less than a decade after Columbus "discovered America" and less than 70 years after the last great pre-Columbian Chinese sailing expedition, led by Admiral Zheng He. Maddison’s data is used and adjusted to 2015$ through 1970, with IMF data used for 1980 to 2015.

    Further, in the earlier years, virtually all nations had very low GDPs per capita. This was to begin changing with the industrial revolution. Thus, the early data can be characterized as being strongly related to population, because there was much less difference in GDP per capita based on level of development.

    1500: In 1500, China was the largest economy in the world, followed closely by India, both with estimated GDP’s of approximately $100 billion. France was a distant third at approximately 18 billion, followed closely by Italy and Germany. What is now the United Kingdom ranked 10th, at barely one quarter the output of France (Figure 1).

    1700: This was the only reported year between 1500 and 2015 that China or the United States did not lead the world. India had the strongest economy in 1700, closely followed by China. Throughout the entire period to the middle of the 20th century, China’s economy was larger than India’s by a relatively small margin. At the same time “the great powers” of the West were still well behind China and India, with France retaining third-place with a GDP less than one fourth that of China and 1/6 that of India. The United Kingdom was yet to break into the top five, ranking eighth (Figure 2).

    1820: By 1820, the next year for which full data is available, China resumed its lead and by a larger margin. India was second, slightly more than one half that of China. The United Kingdom finally appears, in third-place with a GDP one sixth that of China and only slightly ahead of France (Figure 3). The available data shows China to have retained the top position through 1870.

    1890: By 1890, the United States had emerged as the world’s largest economy, opening up an approximately five percent lead over China. India ranked third, followed by the United Kingdom and Japan (Figure 4).

    1930: By 1930, the ascendancy of the United States was clear. China, then reeling from social disorder and civil strife, still remained the second largest economy, but trailed the United States by approximately two thirds. There was little difference between China and the next three largest economies, Germany, the United Kingdom and India (Figure 5).

    1980: Half a century later, in 1980, the United States retained a similar lead, but now over second-ranked Japan. Germany was a close third, followed by Italy and France. India ranked ninth, approximately 30 percent ahead of 10th ranked China. Then the Deng Xiaoping era was getting underway (Figure 6), leading to China’s resurgence back towards the top.

    2010: China’s ascendancy was obvious by 2010, reaching within 20 percent of the United States, which remained number one. This had been a dramatic reversal, since China’s GDP had been little more than one tenth that of the United States only 30 years earlier (1980). India was also restored to a leadership position, ranking third. Japan was fourth and Germany was fifth (Figure 7).

    2015: The 2015 IMF projections show China to have recovered first-place after at least a 125 year hiatus. The United States was second, approximately four percent behind China. India, Japan and Germany remained in third, fourth and fifth place (Figure 8). The BRIIC developing nations are in the top 10, with Russia, Brazil and Indonesia ranking sixth through eighth (in addition to China and India in first and third place). Two other powers of Europe round out the top 10, the United Kingdom and France.

    Observations

    The impact of China’s difficult 19th century is indicated by a 10% GDP decline, despite an increasing population. It seems likely that this is at least partially attributable to the Opium Wars, treaty ports and related extraterritorial jurisdiction by external powers. China’s GDP in 1900 had fallen 10 percent from its 1820 level.

    It is notable that through much of their empire-colonial relationship between the United Kingdom and India, the colony had the larger GDP. This was the case from 1820 through 1900. This is principally due to the larger population of India. For example, in 1870, India’s GDP was one-third larger than that of the United Kingdom. In the same year, however, the UK GDP per capita was six times that of India.

    Similarly, while China’s GDP is larger than that of the United States in GDP, its GDP per capita is about one-fourth that of the US.

    Projections

    GDP projections produced for 2050, by PWC (Price Waterhouse Coopers) indicate that even more significant changes could be ahead. PWC expects China to have GDP of $61 trillion (US$2014). India is projected to be restored to its previous second place, at $42 trillion, just ahead of the United States ($41 trillion). BRIICs members Indonesia and Brazil would be 4th and 5th, while BRIICs Russia would be 8th. Mexico and Japan would follow Brazil, with Nigeria and Germany rounding out the top ten.

    If PWC is right, the dominance of China and the United States might be supplanted by the historically dominant duo of China and India. Of course, no one knows for sure. Forecasting economics is even harder than forecasting population.

    ——————–

    Note: All data is converted into 2015 international dollars using the US GDP implicit price deflator. US
    dollars are the basis of international dollars.

    Photo: Zheng He Park, Nanjing (by author)

    ——————–

    Wendell Cox is Chair, Housing Affordability and Municipal Policy for the Frontier Centre for Public Policy (Canada), is a Senior Fellow of the Center for Opportunity Urbanism (US), a member of the Board of Advisors of the Center for Demographics and Policy at Chapman University (California) and principal of Demographia, an international public policy and demographics firm.

    He is co-author of the "Demographia International Housing Affordability Survey" and author of "Demographia World Urban Areas" and "War on the Dream: How Anti-Sprawl Policy Threatens the Quality of Life." He was appointed to three terms on the Los Angeles County Transportation Commission, where he served with the leading city and county leadership as the only non-elected member. He served as a visiting professor at the Conservatoire National des Arts et Metiers, a national university in Paris.

  • Poorer Nations Set for 99% of Population Growth

    According to the new United Nations World Population Prospects: The 2015 Revision, the population of the world is projected to rise from 7.3 billion in 2015 to 11.2 billion in 2100. This represents a 53 percent increase. However, over the period, population growth will moderate substantially. This is indicated by the annual growth rate the first year (2015 to 2016), at 1.1 percent, compared to the last year (2099 to 2100) at 0.1 percent. Annual population growth is projected to decline 90 percent from the beginning of the period to the end (Figure 1).

    Growth by Continent

    The distribution of growth among the continents will be anything but even. Approximately 83 percent of the growth is projected to be in Africa, which is to grow approximately 270 percent. Asia is expected to account for 13 percent of the world’s growth and add 11 percent to its population. Northern America (Note), while growing 40 percent is expected to account for four percent of the world’s population growth. Latin America and the Caribbean are expected to account for 2.2 percent of the world’s growth, and add 14 percent to their population. Europe (including all of Russia) is expected to decline in population by 13 percent (Figure 2).

    Population Growth by Income Status

    World population growth is expected to vary widely by current income status (Figure 3). Income status is indicated on page 137 of this United Nations publication.

    The world’s high income nations are expected to add only eight percent (111 million) to their population and will represent only three percent of the population growth. These nations are principally in North America and Europe, but also include Japan, South Korea, Saudi Arabia and others.

    The world’s upper middle income nations are expected to experience a population decline of three percent, which amounts to a loss of 82 million residents. China, Russia, Mexico, South Africa, Iran and Brazil are examples of upper-middle income nations. When combined with the high income gain noted above the more affluent half of the world’s nations would add 29 million residents, or just 0.7 percent of the world’s growth. This is fewer people than live in the Tokyo metropolitan area.

    This means that more than 99 percent of world growth from 2015 to 2100 is expected to be among the lower income nations. The lower middle income nations would gain 2 billion people, representing 52 percent of the population growth.  The lower-middle income nations include India, Indonesia, Nigeria, the Philippines, Vietnam, Guatemala and others.

    The lower income nations would gain 1.8 billion people, capturing 47 percent of the world’s growth. The lower income nations include Bangladesh, Tanzania, Myanmar, the Democratic Republic of the Congo and others.

    In the high income and upper middle income regions, population growth will be also anything but consistent. Nations such as the United States, the United Kingdom, France, Canada and Australia are expected to grow far faster. The United States is expected to add 40 percent to its population and more than four times the population growth of all of the upper half of nations. Canada (up 39 percent) and Australia (up 77 percent), combined, are expected to add more population than the total upper income half of nations.  These gains will be largely offset by losses in Japan, Germany, South Korea, Italy and others.

    Largest Population by Nation

    China, with the largest population in 2015, is expected to fall behind India in 2050 and remain in second place by 2100. India is expected to be the largest nation in both 2050 and 2100. However, India’s population will be less in 2100 than it was in 2050.

    Eight of the 10 most populated nations, including India and China are expected to have a lower population in 2100 than in 2050 (Figure 4). Pakistan is expected to reach its population peak in 2095 and start declining in 2096. This leaves only the United States among today’s today’s 10 largest nations that is expected to be adding population in 2100. The growth rate between 2099 and 2100 (0.2 percent) is expected to be considerably below the growth rate at the beginning of the period (2015-2016), which was 0.7 percent.

    By 2100, there are expected to be substantial changes to the top 10 nations in population. Five of the 10 largest nations in the world are expected to be in Africa. This is an increase from one in 2015 (Figure 5). Nigeria will have replaced the United States as the third largest nation, with approximately 750 million people, having more than quadrupled in size. The Democratic Republic of the Congo (Congo – Kinshasa) would rank fifth, and is expected to reach 390 million people, quintupling in size. Tanzania would rank eighth, reaching 300 million residents, nearly 6 times its 2015 population. Ethiopia would have more than 240 million residents, 2.5 times its current population and would rank ninth. The 10th largest nation would be Niger, with 210 million residents, a figure 10 times its 2015 level. Among the African nations in the top 10, only Ethiopia would be declining by 2100, having reached its population peak in 2097.

    Pakistan would retain its current sixth position, while Indonesia would fall from 4th to 7th. As noted above, India would be the largest nation in China would be second largest in 2100. By that date India would have an overall gain of approximately 350 million people from 2015, while China would lose 370 million people. The United States would add more than 125 million people. Brazil, which is currently ranked 5th, would lose approximately 10 million people and fall to 13th position. Eighth ranked Bangladesh, which was long among the fastest growing nations in the world, would gain only 10 million people and fall to 14th position. Russia, ranked 9th, would fall to 23rd, losing 25 million residents. Mexico, ranked 10th, would gain 20 million residents, and would be ranked 18th in 2100.

    The Uncertainty of Projections

    Of course projections of any kind are subject to wide error ranges. Economic growth, the extent of poverty, wars, social trends, medical advances and other factors can interfere. The simple fact is that none of us and no organization knows the future for sure. One study of UN population trends in six Southeast Asian nations found that 1980 projections from 1950 were 13.9 percent off by nation, with a range from minus 20 percent to plus 27 percent. There had been some improvement in comparing 1975 projections to 2000 actual populations, with an average error of 8.2 percent. The range was little improved, from minus 23 percent to plus 25 percent. Obviously projections are likely to be much more accurate in early years and the chances for greater accuracy are improved in larger nations or regions.

    A World of Challenges

    Regardless of the extent of accuracy, which cannot be known at this point, the projections indicate a continuation of trends that cause concern. A world that is experiencing virtually 100 percent of its growth in its poorest areas cannot help but face a tougher future. This makes it clear that the principal priority of governments around the world should be to improve affluence and reduce poverty. The challenges are gargantuan, but focusing on these issues is likely to result in a better, though less than ideal, world.

    Note:  Northern America includes Canada, the United States, Greenland, Bermuda and the French territory of Saint Pierre and Miquelon.

    Photograph: Western Railway Headquarters (Churchgate), Mumbai, India (by author)

    Wendell Cox is Chair, Housing Affordability and Municipal Policy for the Frontier Centre for Public Policy (Canada), is a Senior Fellow of the Center for Opportunity Urbanism (US), a member of the Board of Advisors of the Center for Demographics and Policy at Chapman University (California) and principal of Demographia, an international public policy and demographics firm.

    He is co-author of the "Demographia International Housing Affordability Survey" and author of "Demographia World Urban Areas" and "War on the Dream: How Anti-Sprawl Policy Threatens the Quality of Life." He was appointed to three terms on the Los Angeles County Transportation Commission, where he served with the leading city and county leadership as the only non-elected member. He served as a visiting professor at the Conservatoire National des Arts et Metiers, a national university in Paris.

  • U.S. Late to the Party on Latin America, Africa

    President Barack Obama’s proposed tilt of U.S. priorities toward the Pacific – and away from the historical link to Europe – represents one of the most encouraging aspects of his foreign policy. Although welcome, we should recognize that this shift comes about three decades too late and that it may miss the rising geopolitical centrality of sub-Saharan Africa and Latin America. The emergence of these longtime historically impoverished backwaters has been largely missed as American policy-makers and businesses are now obsessed with the challenges and opportunities posed by the emergence of China and, to a lesser extent, India. Sub-Saharan Africa, for example, over the past decade has produced six of the world’s 10 fastest-growing economies. Through 2011-15, according to the International Monetary Fund, seven of the fastest-growing countries will be African, and Africa as a whole will surpass the slowing growth rates in Asia, particularly China.

    This growth has caused the region’s poverty rates, still unacceptably high, to fall from 56.5 percent in 1990 to 47 percent today. Further growth will likely push poverty levels down further.

    Outgrowing U.S.

    With 600 million people, including a middle class of some 400 million, Latin America represents one of the world’s great growth markets. Over the past two years the growth rate in Latin America has been twice – and more in some countries – that in the United States, Europe and Japan. Latin America’s unemployment rate is reaching historic lows. A decade ago, it was 11 percent. Today it is 6.5 percent, well below levels in the U.S. or Europe.

    As in Africa, growth has worked to reduce Latin America’s historic high rate of poverty by 17 percent since 1990. Overall, Latin America’s combined gross domestic product is already larger than that of Russia and India combined – larger, in fact, than any nation or region besides the U.S., the E.U. and China.

    Demographic trends are likely to accelerate this process. Rapidly aging populations in Europe, Japan and East Asia threaten both workforce growth and fiscal stability. Today, people at least age 60 account for 13 percent of the population in China, 15 percent in east Asia, 32 percent in Japan and 22 percent in Europe, but barely one in 10 residents in Latin America; only 6 percent of Africa’s population is made up of seniors. By 2050, one-third of people in east Asia, Europe and China will be over 60, while Japan will pass 40 percent. In contrast, Latin America’s over-60 population will be 20 percent, and Africa’s half that.

    Indeed, over the next decade, Africa is slated to add more people than all of Asia, while Latin America’s growth will far exceed that of Europe, East Asia or North America. A surprising percentage of the residents in these regions will be middle class. From 2000-14, according to a McKinsey survey, the number of African households with annual incomes of at least $5,000 will grow from roughly 59 million to well over 106 million. Africa already has more middle-class households (defined as those with incomes of at least $20,000) than India.

    This demographic vibrancy is helping spark industrial growth, both for export and domestic consumption. Latin American countries, led by Brazil, have emerged as industrial centers while Mexico is rapidly replacing China as the preferred foreign manufacturing platform for American firms hailing from California to Texas. Manufacturing growth – particularly in textile and garments – has also begun to grow in parts of sub-Saharan Africa, following in many ways the patterns earlier seen in Japan, China, Southeast Asia and Bangladesh.

    Hunt for Resources

    But much of the importance of these regions lies with their enormous natural resources.

    Conventional wisdom in our chattering classes holds that, in the "information age," raw materials no longer represent an advantage for economic growth. Yet as the world’s population grows, and its middle class expands, there seems to be a cascading demand for raw materials, either for direct consumption or for use in manufactured goods. Energy consumption itself, according to the International Energy Agency, could rise as much as 50 percent by 2030, with more than 84 percent of that increase coming from fossil fuels.

    Increasingly the competition over Latin America and Africa reflects something of a reprise of what was once seen as "the great game," where European colonial powers struggled for control of resources and land masses in regions as diverse as Central Asia, Africa, South America and the Middle East. Today, this struggle includes many more protagonists, including Japan, Korea and, most powerfully, China, all of whom are targeting investments in the continent.

    One result has been growing interest in Africa, where foreign direct-investment projects grew by 27 percent in 2011 alone. American companies like Wal-mart and Google are expanding there, but much of the big investment comes from China. China’s former vice-minister of commerce, Wei Jianguo, recently told China Daily that Africa eventually will surpass the U.S. and the E.U. to become China’s largest trading partner. Last year, Latin America reaped a record $145 billion in FDI, an increasing share from China.

    Resource-hungry China has reason to focus on Africa and Latin America, which hold much of the world’s diminishing supply of not-yet-developed farmland, as well as tremendous reserves of precious minerals and energy. Africa, by current accounts, possesses 10 percent of the world’s reserves of oil, 40 percent of its gold, and 80 percent to 90 percent of the chromium and the platinum metal group.

    These supplies, notes a recent McKinsey report, may be grossly undercounted, since much of the continent has not been thoroughly explored. But, to date, Africa has a proven stock of $13 trillion to $14.5 trillion worth of energy resources (oil, coal, gas, uranium); South Africa alone is estimated to have $2.5 trillion in mineral wealth.

    Latin America, too, enjoys ample natural resources, to go with its rapidly developing industrial sector. Brazil is the world’s third-leading food exporter, and other Latin countries, such as Chile and Mexico, have been emerging as major producers of commodities.

    Latin America also seems well-positioned to benefit from the shift of world energy production from the Middle East and Russia to the Americas. Brazil has already made large strides in offshore oil development; possible future offshore oil finds in Mexico and Cuba create an energy boom through the entire Caribbean Basin.

    U.S. Needs to Shift

    Clearly, the rise of these two regions signals that we need to adjust our foreign policy priorities. American business is already becoming more engaged with these two continents; over the past decade trade growth there has more than tripled, compared with a doubling of trade with Asia and Europe. We need to move not only beyond our old strategic ties with Europe, and embroilment with the volatile Middle East, and look to engage in the places where our primary rivals, notably China, already see the future of the world economy.

    Will America, finally awakening from its European slumbers and no-win Middle Eastern involvements, get with the new program? It took three decades for the foreign policy establishment to acknowledge the reality of the Pacific era. Hopefully it won’t take nearly as long to acknowledge the growing influence of both our southern neighbors and emergent powerhouse that is Africa.

    Joel Kotkin is executive editor of NewGeography.com and a distinguished presidential fellow in urban futures at Chapman University, and a member of the editorial board of the Orange County Register. He is author of The City: A Global History and The Next Hundred Million: America in 2050. His most recent study, The Rise of Postfamilialism, has been widely discussed and distributed internationally. He lives in Los Angeles, CA.

    This piece originally appeared in the Orange County Register.

    World image by BigStockPhoto.com.