Tag: Asia

  • Still Set to Depopulate, Japan Raises Long Term Population Projection

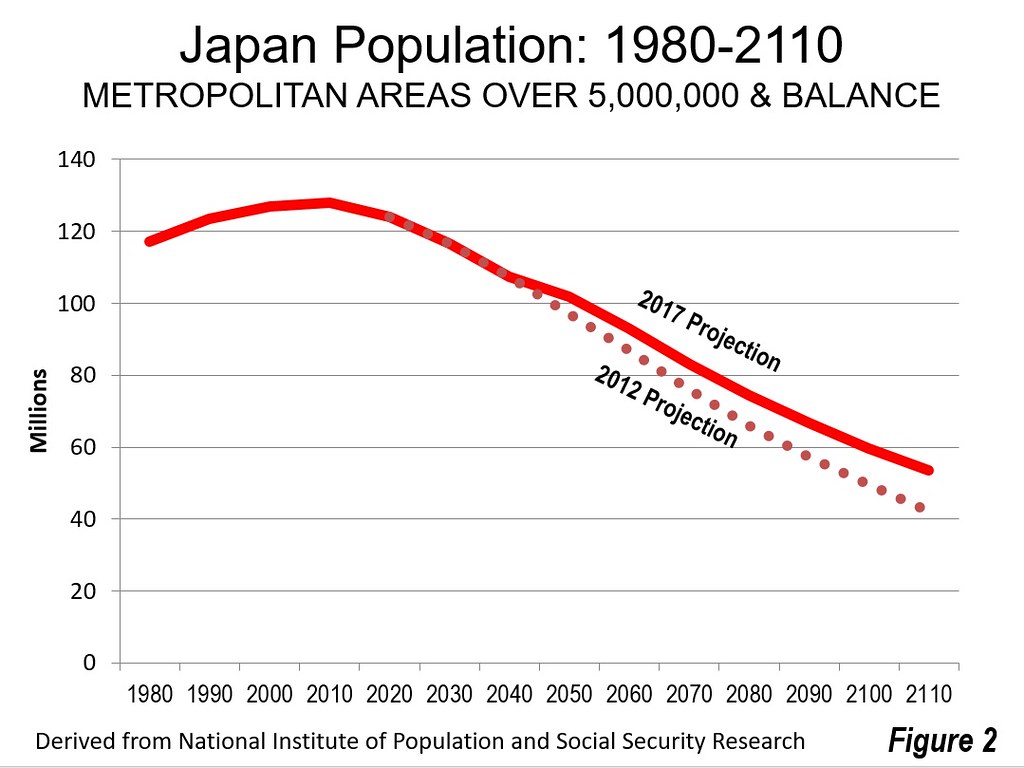
    Japan is well known for its huge expected population loss, likely to be the greatest in the world for a major nation by the end of the century. However, things do not look as bleak as they did just five years ago. The National Institute of Population and Social Security Research (Japan) just released its 100 year population national projections based upon the results of the 2015 census, which is an update of the 2012 projections based on the 2010 census. The projections are virtually identical until 2040, when Japan’s population is expected to be approximately 107 million, down from the 2015 level of 127 million. After that time, however, the population loss is expected to moderate. By 2110, the population under the medium fertility/medium mortality scenario is projected to be 53.4 million, down more than 70 million from the 2010 peak of 128 million (Figure 1). This is more than 10 million higher than projections released in 2012, which anticipated 42.9 million residents in 2110, approximately equal to the population of the Nagoya metropolitan area (prefecture based).

    The Largest Cities

    Projections are not available beyond 2040 below the national level. However, the latest 2040 prefectural population projections, based on the 2010 census, give an idea of how the loss is likely to be distributed in the early years.

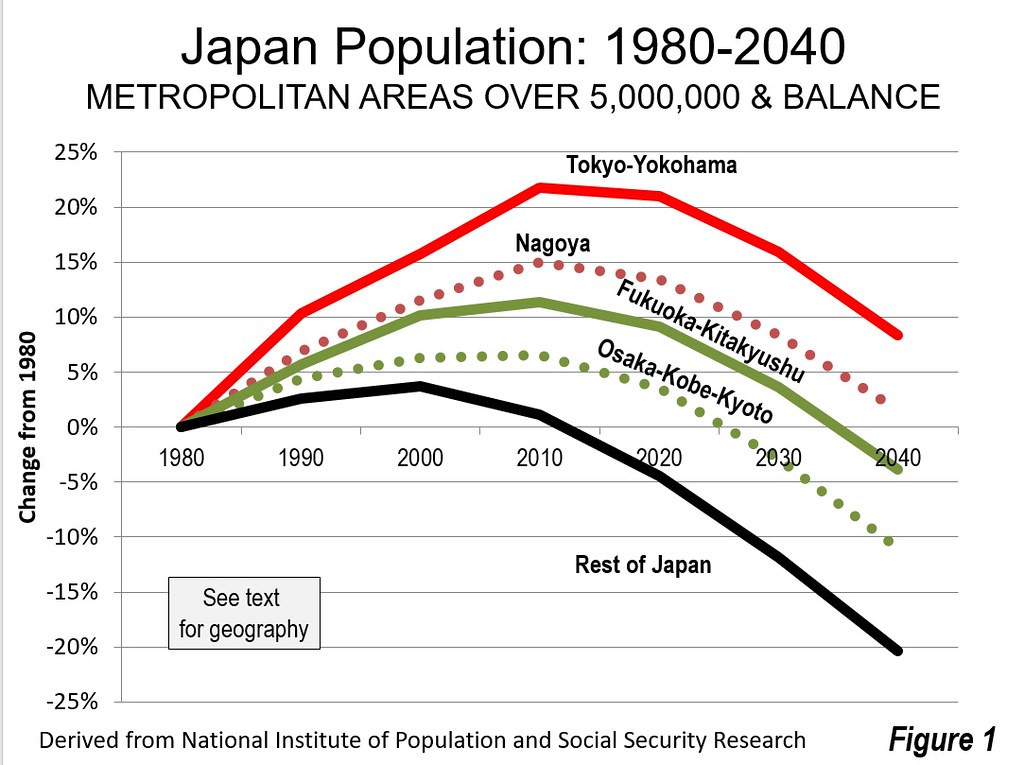
    Japan has four cities (metropolitan areas) with more than 5 million residents that can be roughly delineated by prefectural boundaries, Tokyo – Yokohama, Osaka – Kobe – Kyoto, Nagoya and Fukuoka –Kitakyushu. These areas are expected to do much better in future population trends than the rest of the nation.

    Figure 2 provides a comparison of the actual populations from 1980 to 2010 for these cities, along with projections to 2040. Tokyo – Yokohama retains the largest share of its population, falling 11.0 percent from its peak. This includes the prefectures of Tokyo, Kanagawa, Saitama, Chiba, Ibaraki, Toshigi, Gunma and Yamanishi. In 1980, Tokyo – Yokohama had a population of 36.7 million, which rose to 43.5 million in 2010 and is expected to fall to 38.7 million by 2040.

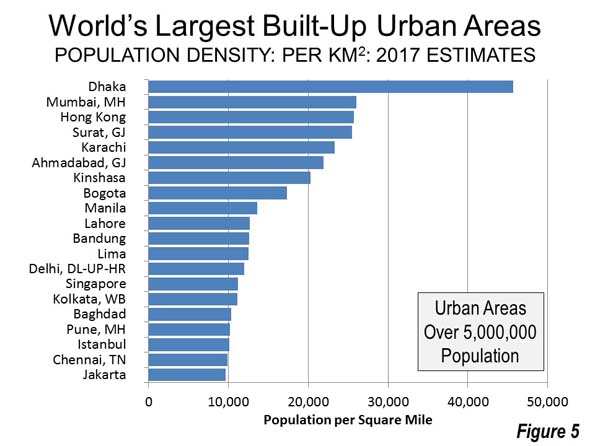
    With strong growth continuing in places like Jakarta, Delhi and Manila, it seems unlikely that Tokyo – Yokohama will retain its “largest city in the world” status. Guanghou – Foshan – Shenzhen – Dongguan and the rest of the Pearl River Delta may also emerge as a larger metropolitan area should high levels of commuting develop (metropolitan areas are normally delineated by commuting patterns).

    The second largest city, Osaka – Kobe – Kyoto is expected to do more poorly, with the loss of 16.5 percent. Osaka – Kobe – Kyoto includes the prefectures of Osaka, Hyogo, Kyoto and Nara. In 1980, Osaka – Kobe – Kyoto had a population of 17.4 million, which rose to 18.5 million in 2010 and is expected to fall to 15.4 million by 2040.

    Nagoya, the third largest city, does nearly as well as Tokyo – Yokohama, losing 11.7 percent of its population. This includes the prefectures of Aichi, Gifu and Mie. In 1980, Nagoya had a population of 9.8 million, which rose to 11.3 million in 2010 and is expected to fall to 10.0 million by 2040.

    Fukuoka – Kitakyushu (Fukuoka prefecture) is expected to lose 13.7 percent of its population between 2010 and 2040. In 1980, Fukuoka – Kitakyushu had a population of 4.6 million, which rose to 5.1 million in 2010 and is expected to fall to 4.4 million by 2040.

    The population losses in the rest of the nation are expected to be more severe, at 21.2 percent. Outside the four largest cities, there was a 1980 population of 54.1 million, which rose to 54.8 million in 2010 and is expected to fall to 43.1 million by 2040.

    2040 Prefecture Projections

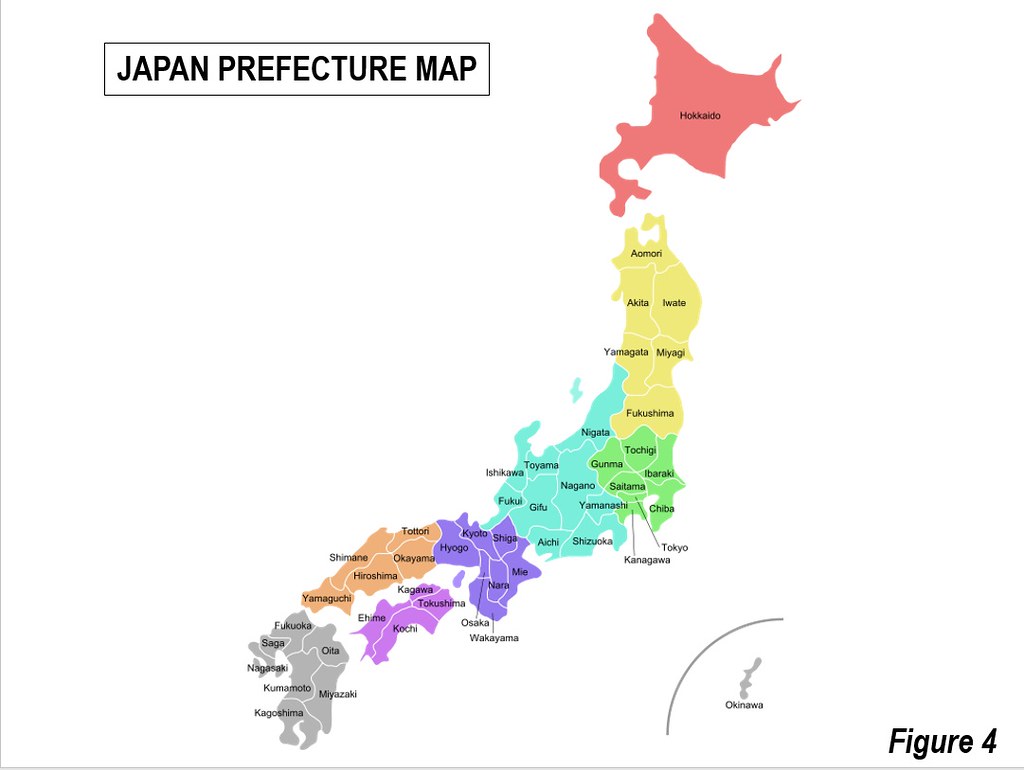
    Among the country’s 47 prefectures, only two are outside the four largest cities. Okinawa would lose the least population, 2.9 percent (Table). Shiga, which is sandwiched between Osaka – Kobe – Kyoto and Nagoya would have the second lowest population loss at 7.8 percent, just above that of Tokyo Prefecture, which is at the core of Tokyo-Yokohama. Fourth ranked Aichi is the core prefecture of Nagoya. Kanagawa and Saitama are in Tokyo – Yokohama, and Fukuoka includes Fukuoka – Kitakyushu. Chiba is in Tokyo – Yokohama, ninth-ranked Myagi includes the large city of Sendai, with 10th-ranked Kyoto being a part of the Osaka – Kobe – Kyoto metropolitan area. Osaka, the core prefecture of Osaka – Kobe – Kyoto ranks 12th. Generally, the core areas are expected to retain their population better than the more outlying areas.

    The prefectures with the largest losses tend to be more rural. The greatest losses are projected to be in on the northern part of Honshu (the main island), in Akita (31.6 percent), Amore (28.6 percent) and Iwate (25.9 percent). Kochi, on the island of Shikoku would have the third greatest loss, at 26.5 percent (See Japan Prefecture map – Figure 3).

    Conjectural Projections

    A “what if” analysis was performed to conjecture about what Japan might look like below the national level by 2110, when its 53 million population is projected to be nearly 60 percent below the 2010 peak. A population change factor was computed averaging the share of population losses for each prefecture from 2020 to 2040 and the overall share of the population expected to be in each prefecture in 2040.

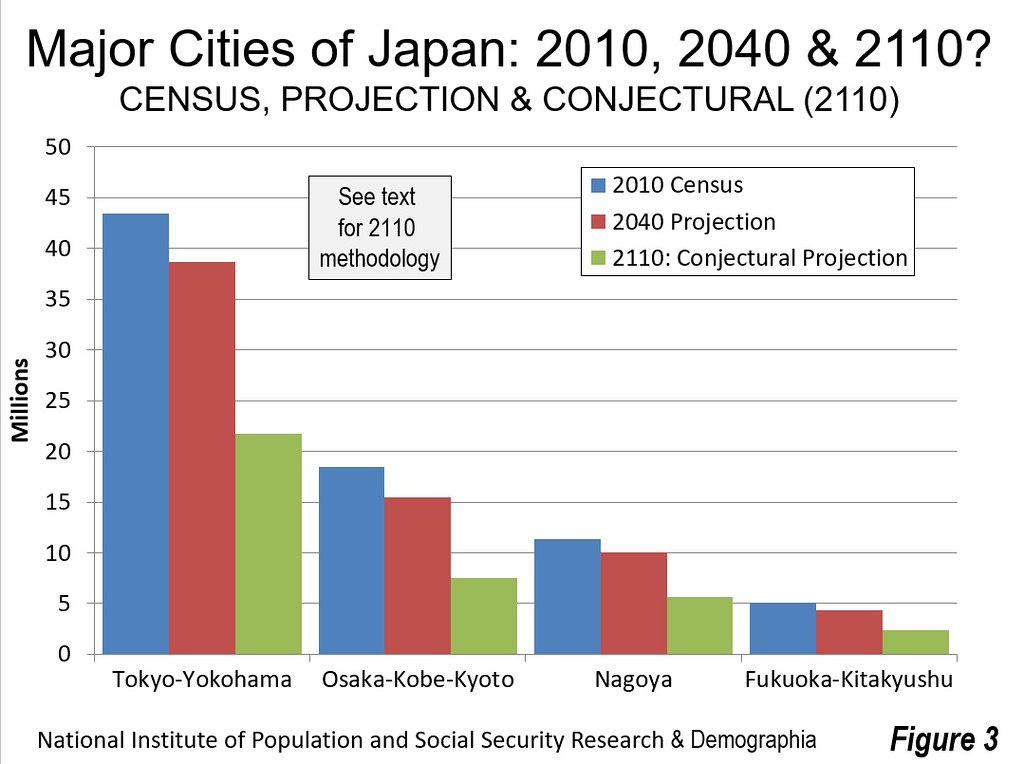
    The “what if” scenario suggests that population losses in each of the largest cities will be more than 50 percent from 2010, the population losses in Tokyo-Yokohama and Nagoya would be just under 50 percent. Fukuoka – Kitakyushu would lose 54 percent, while Osaka – Kobe – Kyoto would drop nearly 60 percent (Figure 4). Each of these, however, would be far better than the rest of the nation, with a decline of nearly 70 percent.

    However, at the prefectural level, prefectures without larger cities would drop even more (Table). Only Okinawa, Shiga, Tokyo, Aichi and Kanagawa would lose less than half their population. At the other end of the scale, Akita, Amore, Kochi and Iwate would lose 80 to 90 percent of their population.

    However, the population loss is distributed. The Japan of 2110 is likely to be radically different than today. At the same time, population projections are no more than projections and no one can know the future for sure. But Japan seems likely to face serious challenges from population losses in the decades to come, perhaps a harbinger of what can happen in an increasingly post-familial world.

    By Tokyoship (Own work) [Public domain], via Wikimedia Commons

    Japan: Population by Prefecture 2010 to 2040 Projection and 2110
    Rank Prefecture 2010 Census 2040 Projection Change from 2010 2110 Comectural Change from 2010
    1 Okinawa 1.393 1.369 -2.9% 0.950 -31.8%
    2 Shiga 1.411 1.309 -7.8% 0.813 -42.4%
    3 Tokyo 13.159 12.308 -7.8% 7.606 -42.2%
    4 Aichi 7.411 6.856 -8.2% 4.199 -43.3%
    5 Kanagawa 9.048 8.343 -8.8% 5.004 -44.7%
    6 Saitama 7.195 6.305 -12.5% 3.397 -52.8%
    7 Fukuoka 5.072 4.379 -13.2% 2.339 -53.9%
    8 Chiba 6.216 5.358 -13.5% 2.790 -55.1%
    9 Miyagi 2.348 1.973 -14.4% 1.003 -57.3%
    10 Kyoto 2.636 2.224 -15.0% 1.116 -57.7%
    11 Hiroshima 2.861 2.391 -15.4% 1.191 -58.4%
    12 Osaka 8.865 7.454 -15.4% 3.670 -58.6%
    13 Ishikawa 1.170 0.974 -15.5% 0.484 -58.6%
    14 Hyogo 5.588 4.674 -15.5% 2.303 -58.8%
    15 Okayama 1.945 1.611 -15.8% 0.796 -59.1%
    16 Tochigi 2.008 1.643 -16.7% 0.778 -61.2%
    17 Ibaraki 2.970 2.423 -17.1% 1.127 -62.1%
    18 Mie 1.855 1.508 -17.2% 0.704 -62.0%
    19 Gunma 2.008 1.630 -17.3% 0.756 -62.4%
    20 Kumamoto 1.817 1.467 -17.4% 0.687 -62.2%
    21 Saga 0.850 0.680 -17.8% 0.313 -63.1%
    22 Shizuoka 3.765 3.035 -17.9% 1.368 -63.7%
    23 Oita 1.197 0.955 -18.3% 0.429 -64.1%
    24 Gifu 2.081 1.660 -18.5% 0.733 -64.8%
    25 Miyazaki 1.135 0.901 -18.7% 0.398 -64.9%
    26 Fukui 0.806 0.633 -19.3% 0.272 -66.3%
    27 Nara 1.401 1.096 -20.0% 0.447 -68.1%
    28 Nagano 2.152 1.668 -20.2% 0.689 -68.0%
    29 Kagawa 0.996 0.773 -20.2% 0.317 -68.2%
    30 Kagoshima 1.706 1.314 -20.3% 0.546 -68.0%
    31 Yamanashi 0.863 0.666 -20.5% 0.271 -68.6%
    32 Toyama 1.093 0.841 -20.9% 0.331 -69.7%
    33 Hokkaido 5.506 4.190 -21.8% 1.558 -71.7%
    34 Niigata 2.374 1.791 -22.0% 0.671 -71.7%
    35 Tottori 0.589 0.441 -22.2% 0.165 -72.0%
    36 Ehime 1.431 1.075 -22.3% 0.397 -72.3%
    37 Fukushima 2.029 1.485 -22.3% 0.491 -75.8%
    38 Nagasaki 1.427 1.049 -23.5% 0.363 -74.6%
    39 Yamaguchi 1.451 1.070 -23.5% 0.369 -74.6%
    40 Shimane 0.717 0.521 -24.2% 0.174 -75.7%
    41 Tokushima 0.785 0.571 -24.4% 0.185 -76.4%
    42 Yamagata 1.169 0.836 -25.1% 0.263 -77.5%
    43 Wakayama 1.002 0.719 -25.2% 0.222 -77.8%
    44 Iwate 1.330 0.938 -25.9% 0.273 -79.5%
    45 Kochi 0.764 0.537 -26.5% 0.151 -80.3%
    46 Aomori 1.373 0.932 -28.6% 0.211 -84.6%
    47 Akita 1.086 0.700 -31.6% 0.109 -90.0%
    2010 and 2040 data from the National Institute for Population & Social Security Research
    2110 dsta from Demographia. See text.

    Wendell Cox is principal of Demographia, an international public policy and demographics firm. He is a Senior Fellow of the Center for Opportunity Urbanism (US), Senior Fellow for Housing Affordability and Municipal Policy for the Frontier Centre for Public Policy (Canada), and a member of the Board of Advisors of the Center for Demographics and Policy at Chapman University (California). He is co-author of the “Demographia International Housing Affordability Survey” and author of “Demographia World Urban Areas” and “War on the Dream: How Anti-Sprawl Policy Threatens the Quality of Life.” He was appointed to three terms on the Los Angeles County Transportation Commission, where he served with the leading city and county leadership as the only non-elected member. He served as a visiting professor at the Conservatoire National des Arts et Metiers, a national university in Paris.

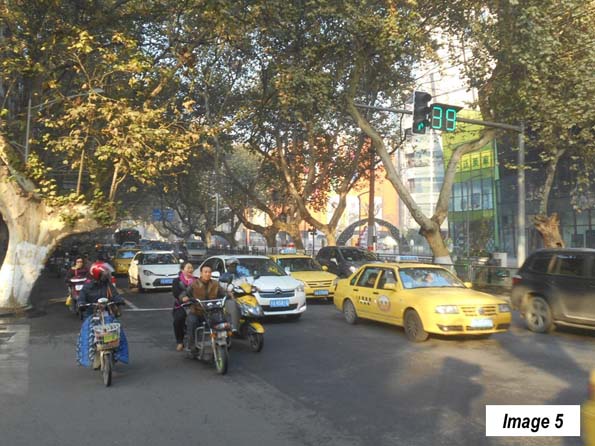
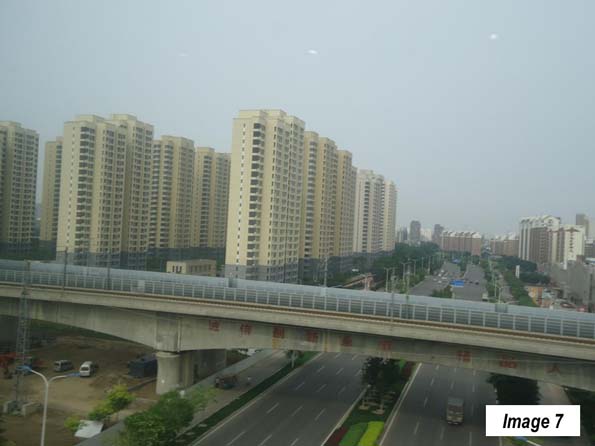
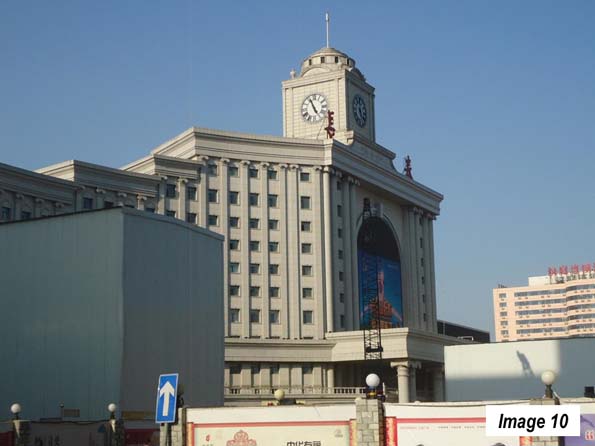
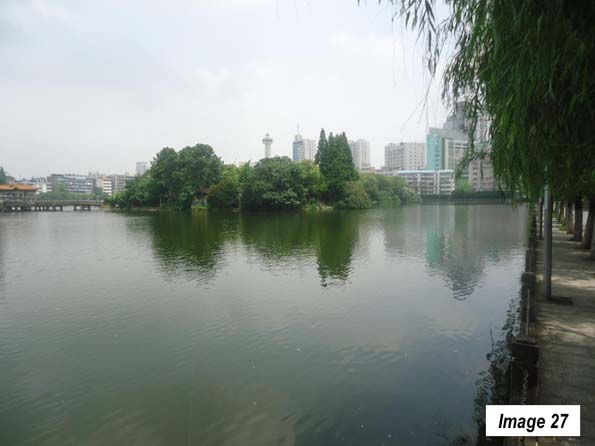
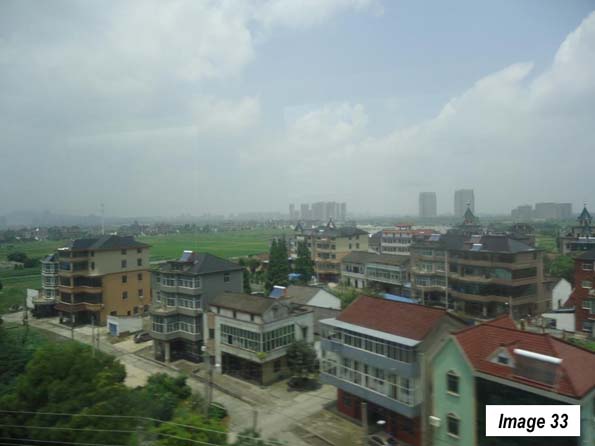
    Photo: Fukuoka (by author)

  • The 37 Megacities and Largest Cities: Demographia World Urban Areas: 2017

    Many of the world’s biggest cities are getting bigger still. In 2017, the number of megacities — urban areas with better than ten million people —   increased to 37 in 2017, as the Chennai urban area entered their ranks. Chennai becomes India’s fourth megacity, along with Delhi, Mumbai and Kolkota. These are among the major findings in the just released 13th annual edition of Demographia World Urban Areas, which provides population, land area and population density estimates for the 1,040 identified built-up urban areas (cities) in the world. Built-up urban areas are the physical form of the city, a definition which separates out the urban, or constructed form of the city from the rural and smaller town areas with which they form a metropolitan area or labor market (Figure 1).

    The World’s Largest Cities

    Asia increasingly dominates the ranks of the world’s most populous cities. Tokyo-Yokohama continues to be the largest urban area in the world (Figure 2), a ranking it has held for more than six decades. It is estimated the Tokyo Yokohama house a population of 37.9 million, living in approximately 3300 square miles (8,500 square kilometers) with a population density of 11,500 per square mile (4,400 per square kilometer).

    Jakarta is the second largest urban area, with a population of 31.8 million 9,600 per square kilometer). Delhi, India’s capital held onto third position, with a population of 26.5 million. Delhi has now opened up a more than 3.5 million lead on 8th ranked Mumbai, which had been India’s largest urban area before and which some experts had considered likely to become the world’s largest city. This prediction, like a similar ones made with respect to Mexico City in the 1980s has not come to fruition and it seems unlikely that either urban area will ever be, the world’s largest.

    Manila moved up from fifth position to fourth position, passing Seoul-Incheon (Figure 3). Manila’s population is estimated at 24.3 million, in an area of 690 square miles (1,790 square kilometers) in a population density of 35,100 per square mile (13,600 per square kilometer), the highest density among the top five built-up urban areas.

    Seoul-Incheon remains the only high income city, besides Tokyo,  in the top five. Seoul-Incheon is estimated to have a population of 24.1 million and an urban population density of 22,700 per square mile (8800 per square kilometer).

    The second five includes Karachi, Shanghai, Mumbai, New York and Sao Paulo, with only New York in the high income world. Thus, seven  of the largest 10 cities in the world are now outside the high income world. New York was the largest city in the world from the 1920s until the mid-1950s. London, which was the largest city in the world from the early 19th century to the 1920s is now ranked 34th, while Beijing, which preceded London as largest ranks 11th. Among the next ten largest urban areas, only two — Osaka-Kobe-Kyoto, at 14th and Los Angeles, at 19th are in the high-income world.  Formerly rapidly growing Los Angeles seems likely to drop out of the top 20 before long.

    Dhaka’s High Density

    Dhaka (Figure 4) remains far and away the highest density built-up urban area in the world (Figure 5), Dhaka has an urban density of 118,500 per square mile (45,700 per square kilometer). No other urban area exceeds 70,000 per square mile (27,000 per square kilometer). Yet, Dhaka is not dense enough for some critics, who perceive it to sprawl too much. Notably, Dhaka is about 50 percent denser than Mumbai or Hong Kong (the high income world’s densest city) and more than 30 times as dense as international densification model Portland, Oregon. Portland ranks 963rd in population density out of the 1040 built-up urban areas.

    A Half Urban World?

    In recent years, the population of the world has become majority urban for the first time. Yet, most people do not live in the largest urban areas. For example, only 15 percent of the urban population resides  in the 37 megacities. The middle of the urban population distribution is at a population of approximately 680,000. People who live in urban areas such as Shizuoka (Japan), Mangalore (India), not to be confused with Bangalore, Qitaihe (China) and Allentown (United States) are the average. The population of the urban areas that are larger have half of the urban population, while the smaller includes the other half.

    Distribution of the Population

    World urbanization is dominated by Asia, which has a majority (54 percent) of the built-up urban areas with at least 500,000 population. Asia’s dominance is even greater in population, with 58 percent of the residents in urban areas of 500,000 or more. North America has the second largest share of urban area population, at 12.5 percent, followed by Africa (11.2 percent) and Europe (9.9 percent). By contrast, Europe has the second largest number of urban areas of 500,000 population or more, reflecting the generally smaller population of its cities (Figures 6 and 7).

    Concentration of Future Growth in Asia and Africa

    The latest data underscores the substantial changes that have occurred in urbanization in recent decades. In 1950, 11 of the 20 largest cities were in the high income world, according to the United Nations. On average these cities had 5 million population. Today, only five of the 20 largest cities are in the high income world and their average population is 21.5 million.

    In the decades to come, Asia  seems likely to continue its dominance, while Africa will capture an increasing share of urban population growth. By 2050, the United Nations projects that approximately 1.2 billion residents will be added to Asian urban areas, while nearly 900 million will be added to the urban areas of Africa. This would leave only about 125 million, or five percent of total urban growth for the rest of the world. Of course, projections can be wrong, but the strength of current trends make these forecasts all the more credible.

    Note: Demographia World Urban Areas uses base population figures, derived from official census and estimates data, to develop basic year population estimates within the confines of built-up urban areas. These figures are then adjusted to account for population change forecasts, principally from the United Nations or national statistics bureaus for a 2016 estimate.

    Built-up urban areas are continuously built-up development that excludes rural lands. Built-Up urban areas are the city in its physical form, as opposed to metropolitan areas, which are the city in its economic or functional form. Metropolitan areas include rural areas and secondary built-up urban areas that are outside the primary built-up urban area. These concepts are illustrated in Figure 1 (above), which uses the Paris built-up urban area (unité urbaine) and metropolitan area ("aire urbaine") as an example.

    Wendell Cox is principal of Demographia, an international public policy and demographics firm. He is a Senior Fellow of the Center for Opportunity Urbanism (US), Senior Fellow for Housing Affordability and Municipal Policy for the Frontier Centre for Public Policy (Canada), and a member of the Board of Advisors of the Center for Demographics and Policy at Chapman University (California). He is co-author of the “Demographia International Housing Affordability Survey” and author of “Demographia World Urban Areas” and “War on the Dream: How Anti-Sprawl Policy Threatens the Quality of Life.” He was appointed to three terms on the Los Angeles County Transportation Commission, where he served with the leading city and county leadership as the only non-elected member. He served as a visiting professor at the Conservatoire National des Arts et Metiers, a national university in Paris.

    Photo: Cover of Demographia World Urban Areas: 13th Annual Edition.

  • The End of the Asian Era

    For the past 40 years, the Pacific Rim has been, if you will, California’s trump card. But now, in the age of President Donald Trump and decelerating globalization, the Asian ascendency may be changing in ways that could be beneficial to our state.

    Rather than President Barack Obama’s famous “pivot to Asia,” it now might be more accurate to speak of Asians’ pivot to America. Once feared as a fierce competitor, East Asia is facing an end to its period of relentless growth, and now many interests appear to find that the United States offers a more secure, and potentially lucrative, alternative.

    This era reflects profound changes in East Asia’s prospects. They increasingly are coping with many of the demographic, social and economic challenges that have bedeviled the West since the 1970s — competition from cheaper countries, technological obsolescence, a demoralized workforce and diminishing upward mobility. The verve of the late 20th century is being supplanted by the anxieties of the early 21st.

    Demographic decline

    Forty years ago, overpopulation constituted the big issue facing East Asia. Governments from Singapore to Korea and, most importantly, China, imposed anti-natalist policies, fearing that their economic success would be overcome by a tide of new citizens. Today, East Asia confronts the world’s most stagnant demography.

    By 2030, according to the United Nations, Japan, still the world’s third-largest economy, will have more people over 80 than under 15, and, by 2050, it is expected to see its population fall by 15 percent. Many of the other Asian “tigers,” which followed Japan’s model, are saddled with a fertility rate so low that, over the next 35 years, they will join the island nation among the most elderly nations on earth.

    East Asia’s demographic crisis will hit critical mass once China, the planet’s second-largest and most dynamic large economy, feels the full impact of its super-low fertility rate. By 2050, China’s population will have a demographic look like ultraold Japan’s today — but without the higher affluence levels of its Asian neighbor to pay for all of the retirees.

    Technology and the challenge of Trumpism

    The rise of the Pacific Rim was driven, in large part, by manufacturing growth. Following the model of Japan, Asian countries grew by keeping imports out and building enormous surpluses of manufactured goods. The resulting imbalances were accepted by American administrations even when exacerbated by mercantilist policies directed against our own producers.

    The acceptance of such an arrangement ended in 2016 with the election of economic nationalist Donald Trump. But the new trade environment also includes the effective capture of the Democratic Party by elements close to Vermont’s Sen. Bernie Sanders, now America’s most popular politician. Sanders is fiercely skeptical on free trade, and his candidacy even forced Hillary Clinton, a long-time globalist, to back protectionist policies.

    Trump’s proposals to match China’s import fees and to hector companies into keeping jobs in the United States represent a huge threat to the mercantilist Asian economic model. This, at a time when new automation technology, cheaper energy and rising wage rates also are persuading Asian producers to shift production to the United States.

    Read the entire piece at The Orange County Register.

    Joel Kotkin is executive editor of NewGeography.com. He is the Roger Hobbs Distinguished Fellow in Urban Studies at Chapman University and executive director of the Houston-based Center for Opportunity Urbanism. His newest book, The Human City: Urbanism for the rest of us, was published in April by Agate. He is also author of The New Class ConflictThe City: A Global History, and The Next Hundred Million: America in 2050. He lives in Orange County, CA.

    Photo: Gage Skidmore from Peoria, AZ, United States of America (Donald Trump) [CC BY-SA 2.0], via Wikimedia Commons

  • Death Spiral Demographics: The Countries Shrinking The Fastest

    For most of recent history, the world has worried about the curse of overpopulation. But in many countries, the problem may soon be too few people, and of those, too many old ones. In 1995 only one country, Italy, had more people over 65 than under 15; today there are 30 and by 2020 that number will hit 35. Demographers estimate that global population growth will end this century.

    Rapid aging is already reshaping the politics and economies of many of the most important high-income countries. The demands of older voters are shifting the political paradigm in many places, including the United States, at least temporarily to the right. More importantly, aging populations, with fewer young workers and families, threaten weaker economic growth, as both labor and consumption begin to decline.

    We took a look at the 56 countries with populations over 20 million people, nine of which are already in demographic decline. The impact of population decline will worsen over time, particularly as the present generation now in their 50s and 60s retires, begins drawing pensions and other government support.

    Europe: Homeland of Demographic Decline

    Heading up our list of slowly dissipating large countries is the Ukraine, a country chewed at its edges by its aggressive Russian neighbor. According to U.N. projections, Ukraine’s population will fall 22% by 2050. Eastern and Southern Europe are home to several important downsizing countries including Poland (off 14% by 2050), the Russian Federation (-10.4%), Italy (-5.5%) and Spain (-2.8%). The population of the EU is expected to peak by 2050 and then gradually decline, suggesting a dim future for that body even if it holds together.

    The most important EU country, Germany, has endured demographic decline for over a generation. Germany’s population is forecast to drop 7.7% by 2050, though this projection has not been adjusted to account for the recent immigration surge. The main problem is the very low fertility rate of the EU’s superpower, which according to United Nations data was 1.4 between 2010 and 2015. It takes a fertility rate of 2.1% to replace your own population so we can expect Germany to shrink as well as get very old.

    Nor can Europe expect much help from its smaller countries. Although too small to reach our 20 million person threshold, many of Europe’s tinier “frontier” countries have abysmal fertility rates. Among the 10 smaller countries with the greatest population declines, all are in Europe, and outside Western Europe, with Bulgaria’s population expected to shrink 27% by 2050 and Romania’s 22%. Each of these have below replacement rate fertility. Things are not that much better in Western Europe, where fertility rates are also below replacement rates, but not quite so low. Long-term, the only option for Europe may be to allow more immigration, particularly from Africa and the Middle East, although this may be impossible due to growing political resistance to immigration.

    Demographic Decline: The Asian Edition

    If this were just a European disease, it would not prove such a challenge to the economic future. Europe is gradually diminishing in global importance. The big story in demographic trends is in Asia, which has driven global economic growth for the past generation. The decline of Japan’s population is perhaps best known; the great island nation, still the world’s third largest economy, is expected to see its population fall 15% by 2050, the second steepest decline after Ukraine, and get much older. By 2030, according to the United Nations, Japan will have more people over 80 than under 15.

    But the biggest hit on the world economy from the new demographics will come from China, the planet’s second largest economy, and the most dynamic.

    Until a generation ago, overpopulation threatened China’s future, as it still does some developing countries. Today the estimates of the country’s fertility rate run from 1.2 to 1.6, both well below the 2.1 replacement rate. By 2050 China’s population will shrink 2.5%, a loss of 28 million people. By then China’s population will have a demographic look similar to ultra-old Japan’s today — but without the affluence of its Asian neighbor.

    Other Asian countries have similar problems. Thailand ranks as the fifth most demographically challenged, with a projected population loss of 8%. The population of Sri Lanka, just across Adam’s Bridge from still fast-growing India, is projected to increase only 0.6%.

    Also going into a demographic stall is South Korea, another country which a generation ago worried about its expanding population. With its fertility rate well below replacement (1.3), the country will essentially stagnate over the next 35 years, and will becoming one of the most elderly nations on earth.

    Full List: The Countries Shrinking The Fastest

    Smaller Singapore is an anomaly. The city-state has a rock-bottom fertility rate of 1.2, but projects a population increase of 20% by 2050 due to its liberal and vigorously debated immigration policies.

    Economic Consequences

    Most world leaders are fixated on the unpredictable new administration in Washington in the short term, but they might do better to look at the more certain long-term impacts of diminishing populations on the world’s most important economies. Economists, including John Maynard Keynes, have connected low birth rates to economic declines. On the “devil” of overpopulation, Keynes wrote, “I only wish to warn you that the chaining up of the one devil may, if we are careless, only serve to loose another still fiercer and more intractable.”

    It is already fairly clear that lower birthrates and increased percentages of aged people have begun to slow economic growth in much of the high-income world, and can be expected to do the same in long ascendant countries such as China and South Korea. Economists estimate that China’s elderly population will increase 60% by 2020, even as the working-age population decreases by nearly 35%. This demographic decline, stems from the one-child policy as well as the higher costs and smaller homes that accompany urbanization, notes the American Enterprise Institute’s Nicholas Eberstadt. China’s annual projected GDP growth rate will likely decline from an official 7.2% in 2013 to a maximum of 6% by 2020.

    There are several reasons these demographic shifts portend economic decline. First, a lack of young labor tends to drive up wages, sparking the movement of jobs to other places. This first happened in northern Europe and Japan will increasingly occur now in Korea, Taiwan, and even China. It also lowers the rate of innovation, notes economist Gary Becker, since change tends to come from younger workers and entrepreneurs. Japan’s long economic slowdown reflects, in part, the fact that its labor force has been declining since the 1990s and will be fully a third smaller by 2035.

    The second problem has to do with the percentage of retirees compared to active working people. In the past growing societies had many more people in the workforce than retirees. But now in societies such as Japan and Germany that ratio has declined. In 1990, there were 4.7 working age Germans per over 65 person. By 2050, this number is projected to decline to 1.7. In Japan the ratios are worse, dropping more than one-half, from 5.8 in 1990 to 2.3 today and 1.4 in 2050. China, Korea and other East Asian countries, many without well-developed retirement systems, face similar challenges.

    Finally, there is the issue of consumer markets. Aging populations tend to buy less than younger ones, particularly families. One reason countries like Japan and Germany can’t reignite economic growth is their slowing consumption of goods. This challenge will become all the more greater as China, the emerging economic superpower, also slows its consumption. The future of demand, critical to developing countries, could be deeply constrained.

    What about the USA?

    To a remarkable extent, the United States has avoided these pressing demographic issues. The U.N. has the U.S. tied with Canada for the fastest projected population growth rate of any developed country: a 21% expansion by 2050. Yet this forecast could prove inaccurate.

    One threat stems from millennials who, even with an improved economy, have not started families and had children at anything close to historical rates. Today the U.S. fertility rate has dropped to 1.9 from 2.0 before the Great Recession; population growth is now lower than at any time since the Depression. This places us below replacement level for the next generation. Projections for the next decade show a stagnant, and then falling number of high school graduates, something that should concern both employers and colleges. The United States’ high projected population growth rate, like that of Singapore, is entirely dependent upon maintaining high rates of immigration.

    But even before the election of Donald Trump, who is hell-bent on cracking down on at least undocumented immigration, total immigration to the United States has been slowing. At the same time the fertility rates of some immigrant groups, notably Latinos, have been dropping rapidly and approaching those of other Americans. This is despite the fact that as many as 40% of women would like to have more children; they simply lack the adequate housing, economic wherewithal and spousal support to make it happen.

    In the coming decades, the countries that can maintain an at least somewhat reasonable population growth rate, and enough younger people, will likely do best. To a large extent, it’s too late for that in much of Europe and East Asia. For countries like the United States, Canada and Australia, with among the most liberal immigration policies and large landmasses, the prospects may be far better. However, we also need native-born youngsters to launch, get married and start creating the next generation of Americans.

    This piece originally appeared at Forbes.

    Joel Kotkin is executive editor of NewGeography.com. He is the Roger Hobbs Distinguished Fellow in Urban Studies at Chapman University and executive director of the Houston-based Center for Opportunity Urbanism. His newest book, The Human City: Urbanism for the rest of us, was published in April by Agate. He is also author of The New Class ConflictThe City: A Global History, and The Next Hundred Million: America in 2050. He lives in Orange County, CA.

    Photo: Ahmet Demirel [Public domain], via Wikimedia Commons

  • How Post-Familialism Will Shape the New Asia

    Surprisingly, the modern focal point for postfamilial urbanism comes from eastern Asia, where family traditionally exercised a powerful, even dominant influence over society. The shift toward post-familialism arose first in Japan, the region’s most economically and technologically advanced country. As early as the 1990s sociologist Muriel Jolivet unearthed a trend of growing hostility toward motherhood in her book Japan: The Childless Society? –a trend that stemmed in part from male reluctance to take responsibility for raising children.

    The trend has only accelerated since then. By 2010 a third of Japanese women entering their 30s were single, as were roughly one in five of those entering their 40s – that is roughly eight times the percentage seen in 1960 and twice that seen in 2000. By 2030, according to sociologist Mika Toyota, almost one in three Japanese males may be unmarried by age 50.

    In Japan, the direct tie between low birth rates and dense urbanization is most expressed in Tokyo, which now has a fertility rate of around one child per family, below the already depressed national average. Some of the lowest rates on earth can be seen elsewhere in eastern Asia, including those in Seoul, Singapore and Hong Kong, which are now roughly the same as the rate in Tokyo.

    As more of Asia becomes highly urbanized like Japan, this kind of ultra-low fertility will spread to other parts of the continent. Most critically, this dynamic has already spread to mainland China, or at least to its larger cities, where fertility rates have dropped well below 1.0. In 2013, Shanghai’s fertility rate of 0.7 was among the lowest ever reported – well below the “one child” mandate removed in 2015 and only one-third the rate required to simply replace the current population. Beijing and Tianjin suffer similarly dismal fertility rates.

    This pattern of low fertility, notes demographer Gavin Jones, suggests that rapid urbanization has already made the notion of the one-child policy antiquated. Now, even with fertility policies being loosened, many Chinese families are opting not to take advantage, largely due to the same reasons cited in other parts of the world: the high cost of living and high housing costs.

    Perhaps no city better reflects Asia’s emerging urban paradigm than Seoul, the densest of the high-income world’s megacities outside of Hong Kong. The Korean capital is more than 2.5 times as crowded as Tokyo, twice as dense as London and 5 times as crowded as New York. No surprise then that self-styled urban pundits love the place, as epitomized by a glowing report in Smithsonian magazine that painted Seoul as “the city of the future.” Architects, naturally, joined the chorus. In 2010 the International Council of Societies of Industrial Design named Seoul the “world design capital.”

    Ultimately, Seoul epitomizes the retro-urbanist fantasy: a city that is dense and dominating, rapidly turning the rest of the country into depopulating backwaters. Seoul has monopolized population growth in Korea, accounting for nearly 90% of total growth since 1970. Seoul also currently holds nearly 50% of the country’s population, up from 20% in 1960.

    Seoul’s development has come at the expense of not just its own hinterlands but also its own humanity. Its formerly human-scaled form of housing, known as a hanok , which was one story tall and featured an interior courtyard, has been largely replaced with tall, often repetitive towers that stretch even into the suburbs. While architects and planners celebrate this shift, they rarely consider whether this form of urbanization creates a good place for people, particularly families.

    When you consider the trends in similar cities, it’s unsurprising that Korean sociologists have noted the shift to high-density housing as being unsuitable for families with children.

    Over time the impact of these housing policies will be profound. By 2040 Korea’s population will join those of Japan and Germany as one of the world’s oldest. This will occur despite determined government efforts to encourage childbearing, efforts that may well be doomed by the government’s similar commitment to a dense, centralized urban form.

    What will happen to societies that are likely to retain extremely low rates of fertility? Japan, notes Canadian demographer Vaclav Smil, represents “an involuntary global pioneer of a new society.” Japan certainly exemplifies one way societies may evolve under diminishing birth rates.

    Projecting population and fertility rates is difficult, but the trajectory for Japan is unprecedented. The UN projects Japan’s 2100 population to be 91 million, down from 2015′s 127 million, but Japan’s own National Institute of Population & Social Security Research projects a population of 48 million, nearly 50% lower than the UN’s projection.

    Japan’s urban centralization both feeds and accelerates this trend. Rather than disperse, Japan’s population is “recentralizing.” A country with a great tradition of regional rivalries, home to an impressive archipelago of venerable cities, is becoming, in effect, a city-nation, with an increased concentration on just one massive urban agglomeration: Tokyo. This has, for the time being, allowed Tokyo to escape the worst of Japan’s demographic decline, drawing heavily on the countryside and smaller cities, both of which are losing population. From 2000 to 2013 the Tokyo metropolitan area added 2.4 million residents, while the rest of the nation declined by 2 million.

    Tokyo is now home to almost one in three Japanese. But its growth is likely to be constrained, as the last reservoir of rural and small-city residents seems certain to dry up dramatically. A projection for the core prefecture of Tokyo indicates a 50% population cut by 2100 to a number smaller than it was at the beginning of World War II; 46% of that reduced population will be over 65.

    This suggests it is time, in high-income countries at least, to shift our focus from concerns about overpopulation to a set of new and quite unique challenges presented by rapid aging and a steadily diminishing workforce. Even birth rates in developing countries are tumbling toward those of wealthy countries. As British environmental journalist Fred Pearce puts it, “the population bomb’ is being defused over the medium and long term.”

    Some, like Pearce, see the Japanese model as an exemplar of a world dominated by seniors – with very slow and even negative population growth – that will be “older, wiser, greener.” Following the adolescent ferment of the 20th century, Pearce looks forward to “the age of the old” that he claims “could be the salvation of the planet.”

    Yet, if the environmental benefits of a smaller, older and less consumptive population may be positive, there may be other negative ramifications of a rapidly aging society. For one thing, there will be increasingly fewer children to take care of elderly parents. This has led to a rising incidence of what the Japanese call kodokushi , or “lonely death,” among the aged, unmarried and childless. In Korea, Kyung-sook Shin’s highly praised bestseller, Please Look After Mom, which sold 2 million copies, focused on “filial guilt” in children who fail to look after their aging parents and hit a particular nerve in the highly competitive eastern Asian society that seems to be drifting from its familial roots.

    Additionally, an aging population will certainly diminish demand for both goods and services and likely would not promote a vibrant entrepreneurial economy.

    China will face its own version of “demographic winter,” although sometime later than Japan or the Asian Tiger states. The U.S. Census Bureau estimates that China’s population will peak in 2026 and then will age faster than any country in the world besides Japan. Its rapid urbanization, expansion of education and rising housing costs all will contribute to this trend. China’s population of children and young workers between 15 and 19 will decline 20% from 2015 to 2050, while that of the world will increase nearly 10%.

    In China the consequences of the rising number of elderly will be profound. Demographer Nicholas Eberstadt, for example, sees the prospect of a fiscal crisis caused by an aging and ultimately diminishing population. China, he notes, faces “this coming tsunami of senior citizens” with a smaller workforce, greater pension obligations and generally slower economic growth.

    It seems likely, as has occurred in Japan already, that rising costs associated with an aging population, and a dearth of new workers and consumers, will hamper wealth creation and income growth. Societies dominated by the old likely will become inherently backward-looking, seeking to preserve the existing wealth of seniors as opposed to creating new opportunities for the increasingly politically marginalized younger population.

    The shift to an aging population also creates, particularly in Asia where urbanization is most rapid, the segregation of generations, with the elderly in rural areas and the younger people in cities. Around the world, the results of this shift are likely to resemble those seen in Japan, with cities becoming home to an ever expanding part of the population, while people in the countryside are destined to grow older and ever more isolated. It is not clear how the expanding senior population, which was traditionally cared for by younger generations, will fare with fewer children to support them and in the absence of a well-developed welfare state.

    Later this century these same challenges will even be felt in many parts of the developing world. In rapidly urbanizing, relatively poor countries such as Vietnam, the fertility rate is already below replacement levels, and it is rapidly declining in other poorer countries such as Myanmar, Indonesia and even Bangladesh. In parts of Latin America, especially Brazil, fertility rates are plunging to below those seen in the United States. Brazil’s birth rate (4.3 in the late 1970s and now 1.9) has dropped not only among the professional classes but also in the countryside and among those living in the favelas. As one account reports, women in Brazil now say, “Afábrica está fechada”–the factory is closed.

    Excerpted from The Human City: Urbanism for the Rest of Us, by Joel Kotkin (B2 Books, 2016)

    This piece first appeared in Forbes.

    Joel Kotkin is executive editor of NewGeography.com. He is the Roger Hobbs Distinguished Fellow in Urban Studies at Chapman University and executive director of the Houston-based Center for Opportunity Urbanism. His newest book, The Human City: Urbanism for the rest of us, was published in April by Agate. He is also author of The New Class ConflictThe City: A Global History, and The Next Hundred Million: America in 2050. He lives in Orange County, CA.

    Photo: John Gillespie, CC License

  • Shanghai to Manchuria and Central China by Train

    There is no better way to see China than by train. This is especially true because foreigners are not allowed to drive rental cars without first obtaining a Chinese drivers license. China has developed the world’s largest high-speed rail system, which includes one of only three profitable routes in the world, along with Tokyo to Osaka and Paris to Lyon.

    Travel by train in China is now more convenient for people who do not speak Mandarin. Tickets may now be purchased over the internet. Details of the trains and ticketing are provided at the end of the article.

    Last month I traveled from Shanghai (Image 1 from a previous trip) to Changchun and Jilin, in Manchuria’s Jilin Province (Manchuria includes the northeastern provinces of Liaoning, Jilin and Heliongjiang, and is called the "Dong Bei" or the "east north") and then to Beijing and on to Nanchang, in Jiangxi Province, finally returning to Shanghai.

    Shanghai is China’s largest urban area, with 22.7 million residents (Note). I started out from Shanghai’s Hongqiao Railway Station, which is one of the most important rail hubs in the country. It is located across the runways from Hongqiao International Airport, from which most domestic flights operate. Most international flights operate from Pudong International Airport, which is 34 miles (55 kilometers) to the east.

    The train used the main Shanghai to Beijing line as far as Tianjin, where the train continues along Bohai Bay toward Manchuria, while the main line turns left toward Beijing.

    It is not long before the train reaches speeds above 300 kilometers per hour (186 miles per hour). For at least the first 135 miles (220 kilometers), to the far edge of Changzhou, there is a mix of primarily urban development with some rural development. There are also many high-rise residential developments and "peri-urban" developments, with rural areas transitioning to urbanization.

    The train travels west through Kunshan, an urban area of 1.9 million residents, part of Suzhou municipality, which also contains the Suzhou urban area (5.4 million). There are particularly good views of the Grand Canal in Suzhou (Image 2, from a previous visit). The Grand Canal was completed approximately 1,400 years ago and for centuries has provided a means for water transport between Hangzhou, to the south of Shanghai, across the Yangtze River and to Tianjin, near Beijing. It is the longest canal in the world, at 1,100 miles (1,800 kilometers).

    From Suzhou, the train continues into Wuxi, an urban area of 3.7 million population (Images 3 and 4). The route continues into Changzhou (urban area population 3.7 million). Finally, is some open country, as the main route travels through a valley to the south of Zhenjiang to Nanjing, an urban area of 6.4 million population, which serves as the capital of Jiangsu. Nanjing was the former capital of China and its streets are lined and cooled in the summer by its "French trees" (Image 5, from a previous visit).

    Leaving Nanjing, the train crosses the Yangtze River and travel through largely agricultural country. It passes through the smaller Suzhou (Anhui province) of Nobel Literature Prize winner Pearl S. Buck, and then through Xuzhou, Jiangsu (1.3 million). In Xuzhou, I noted the elevated connections for the new rail line to Zhengzhou (and also saw them in Zhengzhou). Service will begin in September, cutting three hours off the Shanghai to Zhengzhou travel time, and placing historic tourist attraction Xi’an, with its Terracotta Army, within seven hours of Shanghai.

    The farmland continues to Jinan (3.9 million), the capital of Shandong province, which largely consists of the peninsula of the same name that forms the southern boundary of Bohai Bay. Just north of Jinan, the train crosses the second of China’s great rivers, the Yellow River (Image 6), which is again crossed north of Zhengzhou (below).

    Then there follows the longest stretch of agriculture between Shanghai and Beijing, most of the way to Tianjin (Image 7), an urban area of 11.3 million residents and is now the fastest growing large municipality in China, at more than four percent per year. Soon, we passed through Tangshan (2.4 million) which suffered a disastrous earthquake in 1976 but has been rebuilt (Image 8).

    The train continued northward to Shenyang (3.4 million), the capital of Liaoning (Image 9). Finally, the train reached the destination of Changchun Railway Station (Image 10), 1,500 miles (2,400 kilometers) and 11 hours from Shanghai. Changchun (Image 11) is the capital of Jilin province and has 3.4 million residents.

    Changchun is called the "automobile city," because the government placed the first automobile manufacturing plant here in the late 1950s. This was where the Red Flag limousine was built, favorite of government ministers and which carried President Richard Nixon around Beijing in his 1972 visit. My hotel in Ordos had a classic Red Flag on exhibition (Image 12). Now, automobile manufacturing is spread around the country and includes virtually all of the world’s leading brands. Last year, Chinese bought 21.1 million cars, compared to 17.5 million in the United States, both records.

    Jilin, an urban area with 1.7 million residents,(Images 13, Jilin Railway Station & 14) is only 45 minutes away by train, separated by picturesque rolling agricultural country from Changchun (Images 15 & 16). The corn looks at least as good in Jilin as it does now in Illinois.

    A few days later I took the train from Changchun to Beijing South Railway Station (Image 17) to connect for the flight to Ordos, Inner Mongolia (See: Surprising Ordos: The Evolving Urban Form). Beijing is the nation’s second largest urban area, with 20.4 million residents.

    Flying back from Ordos, my next train trip was from Beijing West Railway Station. I could have traveled by subway, but since the view underground is not as good, traveled by taxi. Early Sunday morning, the traffic on the Third Ring Road from my hotel near the CCTV Tower (across town) was horrific.

    The next train ride was to Nanchang, along the Beijing to Guangzhou line. This is the other principal north-south route though its traffic appears to be light compared to the Shanghai to Being route. The train traveled (Image 18) toward, Shijiazhuang, an urban area of 3.5 million residents and the capital of Hebei province (Images 19 and 20).

    Parts of these first three trips coursed through the planned Jin-Jing-Ji megacity, which will better integrate the urban areas between Beijing, Tangshan, Tianjin and Shijiazhuang.

    Continuing south, the train stopped at Zhengzhou, the capital of Henan (5.8 million), with its impressive extension of the Zhengzhou new area and the new railway station (Images 21 & 22). The train then headed south toward Wuhan, (7.6 million residents), the capital of Hubei and  a heavy industrial area that is been called the "Chicago" of China. Before reaching Wuhan, there was attractive rolling scenery in northern Hubei (Image 23), then the Yangtze River crossing in Wuhan (Image 24). Just a few miles upriver (the direction of the camera shot), Chairman Mao, at 72 years old, is reputed to have swam across the Yangtze in 1966.

    The July greenery of central China was impressive. It continued into northern Hunan province (Image 25) and its capital of Changsha, an urban area of 3.8 million. In Changsha, the train diverted from the Beijing to Guangzhou line and turned eastward toward Nanchang. Along the way, the "peri-urban" development seemed to get more intense (Image 26). 

    The Nanchang urban area (Image 27) has a population of 2.8 million and sits on the Gan River, which eventually flows into the Yangtze, to the north. It is home of the Pavilion of Prince Teng, on the older east bank city, across from the newer development on the west bank (Image 28).

    A few days later, the last leg of the trip from Nanchang to Shanghai Hongqiao took less than four hours. Between Nanchang and Hangzhou, (7.6 million), the capital of Zhejiang, there was more greenery, rolling and mountain country and intense peri-urban development (Images 29-31). Hangzhou has been undergoing a huge construction boom (Image 32). It was less than one hour to Shanghai, and the peri-urban development continued to intensify (Image 33).

    All in all, the five train trips had covered more than 3,700 miles (6,000 kilometers) and passed through 14 provincial level jurisdictions.

    Trains

    The best trains in China are the "G" trains, the "D" trains, and the "C" trains, all of which are of European high-speed rail quality. The "G" trains have a top speed of more than 300 kilometers per hour. The "D" trains have a top speed of 250 kilometers per hour, while the "C" trains are shuttles, such as those operating between Tianjin and Beijing or Changchun and Jilin and tend to operate at 250 kilometers per hour or more.

    All of these trains use similar equipment (Image 34). Image 35 is the inside of a 2nd class coach, which have with reclining seats and snack service. All of the trains have information displays in each car indicating train speed, time, etc. (Image 36). Stations may be central as in Tianjin or near-airport distances from the urban core, as in Jilin and Wuhan.

    Tickets

    Ticket purchase has become simple. Tickets can now be booked from virtually anywhere and paid for by credit card. US residents will pay a service fee of up to $6 per ticket. Confirmation documents are provided over the internet and can be presented at any station in China to receive the tickets all at once. My ticket pickup took no more than 10 minutes at the downtown Shanghai Railway Station.

    I would recommend using a travel agency that is located in China, has a toll-free 24 hour number from one’s home country, has agents with good English skills, and a local China number for use when there. I was very happy with travelchinaguide (https://www.travelchinaguide.com/), which meets this description. Train schedules can be accessed at https://www.travelchinaguide.com/china-trains/.

    Note: The urban area populations are as estimated in 2016, taken from Demographia World Urban Areas: 12th Annual Edition (2016).

    Wendell Cox is principal of Demographia, an international pubilc policy and demographics firm. He is a Senior Fellow of the Center for Opportunity Urbanism (US), Senior Fellow for Housing Affordability and Municipal Policy for the Frontier Centre for Public Policy (Canada), and a member of the Board of Advisors of the Center for Demographics and Policy at Chapman University (California). He is co-author of the "Demographia International Housing Affordability Survey" and author of "Demographia World Urban Areas" and "War on the Dream: How Anti-Sprawl Policy Threatens the Quality of Life." He was appointed to three terms on the Los Angeles County Transportation Commission, where he served with the leading city and county leadership as the only non-elected member. He served as a visiting professor at the Conservatoire National des Arts et Metiers, a national university in Paris.

    Photo: Changchun, Jilin, China: urban core (by author)

  • China’s Navy: A Maritime Power?

    When China’s navy looks beyond its coastal waters, which it increasingly does, it sees a kind of Great Wall. The Chinese call this the “First Island Chain,” a line of islands, some small, others huge, extending from the Japan archipelago to the north, the Ryuku island chain past Taiwan, and the Philippines to the south. The waters within this arc are considered an integral part of China itself.

    Increasingly, China’s sailors are penetrating this barrier through various choke points to gain access to the broader Western Pacific Ocean. In late November, a large formation of Chinese long-range bombers and support craft passed through the gap between Okinawa and the island of Miyako, the so-called “Miyako Channel”.

    The Miyako Channel is strategically vital for China because it is one of the few international waterways through which the Chinese navy and air can access the Pacific Ocean without violating somebody’s space. It is also located close to the Japanese-controlled Senkaku islands which are also claimed by China.

    The first time a Chinese H-6K bomber passed through the channel was September, 2013; the first multi-plane formation to use this passageway was in May this year, and late this year an unusually large formation of eight bombers and support aircraft passed through the gap, flew around the Pacific, and then returned to home base through the channel.

    The H-6K is a modified and much improved version of an old Soviet Tu-22 bomber, known as a “Badger”. It has been configured to hold cruise missiles under its wings or in its bomb bay. The planes reportedly flew about 620 miles into the Pacific before returning to their home base near Shanghai.

    Both the Chinese navy and the air force are learning to conduct extended maritime operations far from home waters and into the wider Western Pacific. Of course, China has maintained a permanent, rotating flotilla of two destroyers and a supply ship in the waters off the coast of Somalia and the Gulf of Aden since 2009. Unlike Japan, it does not have a permanent base in that region, although it is seeking one.

    In March, 2014, two Chinese warships docked at Abu Dhabi, the first time a Chinese fleet had made a port call on the Arabian Peninsula since the days of the Treasure Ships of Admiral Zheng He. In 2013, the Chinese navy made its first goodwill visit to South America, and it stationed a guided missile frigate in the Mediterranean to help escort ships removing chemical weapons from Syria.

    These missions are not war fighting, but the ships have enhanced capabilities for operating in seas far from home. They have gained experience in coordinating with other naval services on anti-piracy patrol, and exercised with other navies, including those of South Korea and Pakistan.

    In the summer of 2013 a Chinese naval flotilla passed through the Soyu Strait, which separates Hokkaido from the southern tip of Russia’s Kurile islands; they returned to their home base through the Miyako Channel. The People’s Daily trumpeted this maneuver as if it were a major triumph. Never mind that these narrow waters are international passageways or that they could easily be closed off if the Japanese decided to do so.

    China routinely conducts naval and air exercises beyond the First Island Chain as far away as the Philippine Sea, and the number of Chinese naval flotillas passing through the First Island Chain has increased significantly in recent years. There were two in 2008 and 2009, four in 2010, five in 2011, and eleven in 2012. In 2012 surface combatants were deployed seven times to the Philippine Sea; they were deployed nineteen times in 2013. The Maneuver-5 exercise in the Philippine Sea involved units from all three of China’s fleets, its largest open-ocean exercise to date.

    The Chinese navy has now penetrated all of the Western Pacific choke points along the chain, from the Tsuruga Strait separating Hokkaido from Honshu in northern Japan to the Bashi Strait separating Taiwan from the Philippines and the Sunda Strait in Indonesia. In October, 2012 a flotilla exited the East China Sea through the narrow passage way between Taiwan and Japan’s Yonaguna island in the Ryukyu chain (where the Japanese army has constructed a surveillance radar).

    This is thought to have been a signal from Beijing of displeasure over Tokyo’s decision to buy the Senkaku islands a month earlier. Later, two Sovremnny Class destroyers and two frigates exited the chain through the Miyako Strait and returned via the waters separating Yonaguna from Taiwan.

    The navy has steadily progressed from a handful of vessels, to multi-fleet (i.e. elements from all three of China’s fleets), to combined operations with submarines, drones and long-range bombers. Not only does China maintain a permanent anti-piracy force in the Indian Ocean, it now routinely conducts naval exercises and operates beyond the First Island Chain, says the US National Defense University.

    This year China was invited to participate in the Rimpac exercise in waters near Hawaii. It sent a destroyer, but also an intelligence-gathering ship, making it possibly the first time a nation spied on an exercise in which it was a participant.

    When queried as to its purpose and intentions of these missions, Beijing has a standard reply: “The training is in line with the relevant international practices and is not aimed at any one country or target and poses no threat to any country or region.”

    In June, 2015, Beijing issued a white paper on its defense priorities in which it stated what has been obvious to any naval planner paying attention: that China’s naval interests are no longer limited to its coastline, but span the globe. “The traditional mentality [going back to Mao Zedong] that the land outweighs the seas must be abandoned,” the paper states.

    That the Chinese navy will enhance its capabilities for “open seas protection” just puts into words what is actually happening. The white paper leaves little doubt that China is intent on transforming itself into a modern maritime power, capable of challenging Japan or the US in Asia and elsewhere.

    Todd Crowell is the author of The Coming War, published by Amazon as a Kindle Single.

    First Island Chain (perimeter marked in red) map by Suid-Afrikaanse (GFDL) via Wikimedia Commons

  • Too Many Places Will Have too Few People

    The adage “demographics are destiny” is increasingly being replaced by a notion that population trends should actually shape policy. As the power of projection grows, governments around the world find themselves looking to find ways to counteract elaborate and potentially threatening population models before they become reality.

    Nowhere is this clearer than in China’s recent announcement that it was suspending its “one child” policy. The country’s leaders are clearly concerned about what demographer Nicholas Eberstadt has labeled “this coming tsunami of senior citizens” with a smaller workforce, greater pension obligations and generally slower economic growth.

    A second example is Europe’s open migration policy. Despite widespread opposition by its own citizens, and cost estimates that run to a trillion euros over 30 years, Europe’s political and business leaders regard migration as critical to address the Continent’s aging demographics. Germany knows it may not be able to keep its economic engine running without a huge influx of workers.

    In defense of the migration policy, European Union economists project that refugees from the Middle East, Africa and Central Asia could boost Europe’s GDP by 0.2 percent to 0.3 percent by 2020.

    This all speaks to a kind of demographic arbitrage between countries with aging demographics and those with youth to spare. Half the world’s population already lives in countries with fertility rates below replacement level (2.1 per woman).

    Read the entire piece at The Orange County Register.

    Joel Kotkin is executive editor of NewGeography.com and Roger Hobbs Distinguished Fellow in Urban Studies at Chapman University, and a member of the editorial board of the Orange County Register. He is also executive director of the Houston-based Center for Opportunity Urbanism. His newest book, The New Class Conflict is now available at Amazon and Telos Press. He is also author of The City: A Global History and The Next Hundred Million: America in 2050. He lives in Orange County, CA.

    Photo “Nursery Cart” by flickr user Pieterjan Vandaele

  • Rural Industrialization: Asia’s 21st Century Growth Frontier

    A World Bank report released earlier this year featured a jarring statistic: 200 million people moved to East Asia’s cities between 2000 and 2010. That figure is greater than the populations of all but five of the world’s countries. Commentators argue that the urbanization of Asia is inevitable, with one calling recent growth “just the beginning.” Considered alongside figures about urban migration, the fact that only 1 percent of Asia’s land is urbanized (a popular statistic) appears to validate predictions about the increasing densification of cities. However, growth in the capacity of cities to accommodate industrial growth seems to be flattening. With a rising middle class and booming demand for automobiles, Asian cities can expect no relief from congestion, and this may be a deterrent for businesses. Rural areas are increasingly prepared to absorb this potential shift in demand.

    Urbanization patterns

    In examining Asia’s economic growth through urbanization patterns, it is helpful to consider historic data spanning several decades. Figure 1 compares 54 years of urbanization in Southeast Asia’s five largest economies against India and China, both arguably the 21st century’s most dynamic growth stories and frequent subjects of urbanization research and commentary. Urban population share has been rising consistently in most countries of this study. Malaysia has long seen a population majority living in cities, and China and Indonesia both crossed the 50% threshold in 2011. Thailand has also rapidly urbanized since 2000, and will likely pass 50% this year. By contrast, Vietnam, India, and the Philippines have been slower to urbanize, with the latter declining since 1990. Part of this variation reflects differences in definitions and measurements of urbanization across countries and time, but the underlying pattern remains clear: the past several decades have seen an urban migration of historic scale.

    Figure 1 (Data source: World Bank)

    That urbanization correlates with economic growth is a point rarely overlooked. Indeed, the two have supported one another since the emergence of capital- and labor-intensive manufacturing during the industrial revolution. Borne of historic growth patterns, this logic has been used to support predictions of continued industrial urbanization and policies that promote it. However, remote penetration of connective infrastructure – including both transportation and communications – is replacing old growth models with a new rural industrialization. The following data support this claim.

    GDP and urban growth

    The urban growth-GDP quotient (Figure 2) represents urban population growth divided by GDP, and is effectively a measure of how much economic activity countries are extracting from their cities. It is not an absolute measure such as GMP (gross metropolitan product). Rather, it is a measure of how changes in GDP track changes in urbanization, providing a broader look at the relative role of cities in national economies. A time horizon of nearly three decades (1985 – 2014) is chosen to capture the high growth period after market reforms in China (1979) and Vietnam (1985). The indexing approach is necessary to normalize the scale of variables for more meaningful graphical visualization, essentially “controlling” for vast differences in numeric values (e.g. the GDPs of China vs. the Philippines). It also creates a common reference point to compare longitudinal performance across countries.

    Figure 2 (Data source: World Bank)

    In this metric, China outperforms comparator countries with a particularly rapid increase in the quotient since 2005; it has evidently been successful deriving GDP value from urban areas. By contrast, Indonesia has seen comparatively less urban-based GDP contribution, and Thailand’s contribution has remained roughly the same since outpacing all countries between 1985 and the Asian financial crisis.

    Manufacturing and urban growth

    One factor underlying these differences is the type of industries contributing to GDP growth, and in particular their location patterns (rural vs. urban). An examination of manufacturing value added (MVA) is necessary to sharpen this analysis, as manufacturing is historically an urban-based activity. Cities provide labor, infrastructure, business services, and global connectivity; their importance to manufacturing is undisputed. The raw MVA numbers (Figure 3) indicate that since 2005, China has far outperformed other countries in the study, most of which showed consistent but not transformative growth. Among the latter, India boasts the lone spike in MVA, and that only recently.

    Figure 3 (Data source: World Bank)

    To complete the analysis, Figure 4 compares historic patterns of manufacturing growth against growth in urbanization. The indexed quotient replaces GDP (Figure 2) with MVA and can be regarded as a measure of the extent to which countries leverage urbanization to support manufacturing growth. China’s statistical dominance in previous measures vastly diminishes here. Further, growth in the ability of many remaining countries to derive MVA from cities slows after initially rapid growth.

    Figure 4 (Data source: World Bank)

    The notable exception is India, and this is the critical point in this analysis. India’s competitive advantage is rooted in the country’s tech sector and other higher-value added activities. From call centers to technology R&D, India has developed a defensible regional position in knowledge-based industries, which are increasingly dependent on the by-products of urbanization: an educated workforce, global talent networks, and lifestyle amenities that appeal to higher-income residents. China maintains its position at the top due in part to its particular urban-based industrialization strategy (special economic zones and decentralization reforms empowering cities). However, China’s conversion of rural agricultural land into industrial facilities is an emerging phenomenon, and the line between urban and rural is fading. For example, in many provinces (e.g. Hebei) factory parcels stand alone, surrounded by farms.

    Towards rural industrialization

    In Southeast Asia, as in parts of China, industrialization is not a fundamentally urban phenomenon. From the industrial estates of Thailand’s Eastern Seaboard to the suburban clusters of Vietnam and Indonesia, companies are now finding most everything they need outside of city centers. The advantages are numerous: cheaper land, lower labor costs, less congestion, and in some cases lucrative business incentives. These suburban and rural industrial clusters are even focusing on quality of life for families, looking beyond hard infrastructure to provide housing, education, and recreation facilities. Such amenities appeal to workers of all skill types, from manufacturing to research and development. As such, rural industrialization need not be only smokestacks and assembly lines; an educated workforce can be recruited if rural living standards match those of cities. This broadens the array and sophistication of industries capable of supporting a new kind of growth.

    Hyper-urbanization visits significant inefficiencies on businesses, potentially making rural regions more attractive for operating. In many of Asia’s major cities, snarled traffic grinds life to a near halt and transit infrastructure has provided only modest relief. Aside from Singapore (a frequent statistical exception), Bangkok and Kuala Lumpur are leaders within Southeast Asia in developing urban rail. However, neither system offers the geographic coverage needed to loosen gridlock. Ho Chi Minh City is currently building its first metro line, but construction is delayed and completion appears to be years away. If hyper-urbanization is re-interpreted as a policy challenge rather than a sign of progress, the decentralization of industrial development can be one solution. Asia’s economic fate is not inextricably linked with the size of its cities, and fresh visions of decentralized growth are already proving their value. The potential is vast; for example, Indian Prime Minister Narendra Modi’s “digital push” and recent commitments to rural broadband represent a development path for the country’s remote regions. Technology, expertise, new funding sources, and emerging economic opportunities are ready to support the rise of rural industrialization across Asia.

    Kris Hartley is a Visiting Lecturer in Economics at Vietnam National University – Ho Chi Minh City, and a PhD Candidate at the Lee Kuan Yew School of Public Policy, National University of Singapore.

    Top Photo: Putrajaya, Malaysia: Seri Gemilang Bridge. Behind the bridge on the right side Ministry of Women, Family and Community and Ministry of Urban Wellbeing, Housing and Local Government © CEphoto, Uwe Aranas / , via Wikimedia Commons

  • 500 Years of GDP: A Tale of Two Countries

    Last year (2014), China overtook the United States in gross domestic product adjusted for purchasing power (GDP-PPP, see point 4 for explanation), according to both the International Monetary Fund (IMF) and the World Bank (Note 1). It may come as a surprise, but this is really a matter of China simply reasserting its position as the world’s largest economy, which it had lost around 1890 to the United States. This is based on estimates developed by the late legendary economist Angus Maddison of the Organization for Economic Cooperation and Development (OECD).

    Over the 515 years from 1500 to 2015, the available data seems to suggest that the largest economy in the world almost always been either China or the United States. The one exception indicated was in 1700, when India had the highest GDP (for most years there is only incomplete data). This article provides highlights of GDP PPP data in US$2015 (Note 2), beginning less than a decade after Columbus "discovered America" and less than 70 years after the last great pre-Columbian Chinese sailing expedition, led by Admiral Zheng He. Maddison’s data is used and adjusted to 2015$ through 1970, with IMF data used for 1980 to 2015.

    Further, in the earlier years, virtually all nations had very low GDPs per capita. This was to begin changing with the industrial revolution. Thus, the early data can be characterized as being strongly related to population, because there was much less difference in GDP per capita based on level of development.

    1500: In 1500, China was the largest economy in the world, followed closely by India, both with estimated GDP’s of approximately $100 billion. France was a distant third at approximately 18 billion, followed closely by Italy and Germany. What is now the United Kingdom ranked 10th, at barely one quarter the output of France (Figure 1).

    1700: This was the only reported year between 1500 and 2015 that China or the United States did not lead the world. India had the strongest economy in 1700, closely followed by China. Throughout the entire period to the middle of the 20th century, China’s economy was larger than India’s by a relatively small margin. At the same time “the great powers” of the West were still well behind China and India, with France retaining third-place with a GDP less than one fourth that of China and 1/6 that of India. The United Kingdom was yet to break into the top five, ranking eighth (Figure 2).

    1820: By 1820, the next year for which full data is available, China resumed its lead and by a larger margin. India was second, slightly more than one half that of China. The United Kingdom finally appears, in third-place with a GDP one sixth that of China and only slightly ahead of France (Figure 3). The available data shows China to have retained the top position through 1870.

    1890: By 1890, the United States had emerged as the world’s largest economy, opening up an approximately five percent lead over China. India ranked third, followed by the United Kingdom and Japan (Figure 4).

    1930: By 1930, the ascendancy of the United States was clear. China, then reeling from social disorder and civil strife, still remained the second largest economy, but trailed the United States by approximately two thirds. There was little difference between China and the next three largest economies, Germany, the United Kingdom and India (Figure 5).

    1980: Half a century later, in 1980, the United States retained a similar lead, but now over second-ranked Japan. Germany was a close third, followed by Italy and France. India ranked ninth, approximately 30 percent ahead of 10th ranked China. Then the Deng Xiaoping era was getting underway (Figure 6), leading to China’s resurgence back towards the top.

    2010: China’s ascendancy was obvious by 2010, reaching within 20 percent of the United States, which remained number one. This had been a dramatic reversal, since China’s GDP had been little more than one tenth that of the United States only 30 years earlier (1980). India was also restored to a leadership position, ranking third. Japan was fourth and Germany was fifth (Figure 7).

    2015: The 2015 IMF projections show China to have recovered first-place after at least a 125 year hiatus. The United States was second, approximately four percent behind China. India, Japan and Germany remained in third, fourth and fifth place (Figure 8). The BRIIC developing nations are in the top 10, with Russia, Brazil and Indonesia ranking sixth through eighth (in addition to China and India in first and third place). Two other powers of Europe round out the top 10, the United Kingdom and France.

    Observations

    The impact of China’s difficult 19th century is indicated by a 10% GDP decline, despite an increasing population. It seems likely that this is at least partially attributable to the Opium Wars, treaty ports and related extraterritorial jurisdiction by external powers. China’s GDP in 1900 had fallen 10 percent from its 1820 level.

    It is notable that through much of their empire-colonial relationship between the United Kingdom and India, the colony had the larger GDP. This was the case from 1820 through 1900. This is principally due to the larger population of India. For example, in 1870, India’s GDP was one-third larger than that of the United Kingdom. In the same year, however, the UK GDP per capita was six times that of India.

    Similarly, while China’s GDP is larger than that of the United States in GDP, its GDP per capita is about one-fourth that of the US.

    Projections

    GDP projections produced for 2050, by PWC (Price Waterhouse Coopers) indicate that even more significant changes could be ahead. PWC expects China to have GDP of $61 trillion (US$2014). India is projected to be restored to its previous second place, at $42 trillion, just ahead of the United States ($41 trillion). BRIICs members Indonesia and Brazil would be 4th and 5th, while BRIICs Russia would be 8th. Mexico and Japan would follow Brazil, with Nigeria and Germany rounding out the top ten.

    If PWC is right, the dominance of China and the United States might be supplanted by the historically dominant duo of China and India. Of course, no one knows for sure. Forecasting economics is even harder than forecasting population.

    ——————–

    Note: All data is converted into 2015 international dollars using the US GDP implicit price deflator. US
    dollars are the basis of international dollars.

    Photo: Zheng He Park, Nanjing (by author)

    ——————–

    Wendell Cox is Chair, Housing Affordability and Municipal Policy for the Frontier Centre for Public Policy (Canada), is a Senior Fellow of the Center for Opportunity Urbanism (US), a member of the Board of Advisors of the Center for Demographics and Policy at Chapman University (California) and principal of Demographia, an international public policy and demographics firm.

    He is co-author of the "Demographia International Housing Affordability Survey" and author of "Demographia World Urban Areas" and "War on the Dream: How Anti-Sprawl Policy Threatens the Quality of Life." He was appointed to three terms on the Los Angeles County Transportation Commission, where he served with the leading city and county leadership as the only non-elected member. He served as a visiting professor at the Conservatoire National des Arts et Metiers, a national university in Paris.