Tag: Australia

  • The 37 Megacities and Largest Cities: Demographia World Urban Areas: 2017

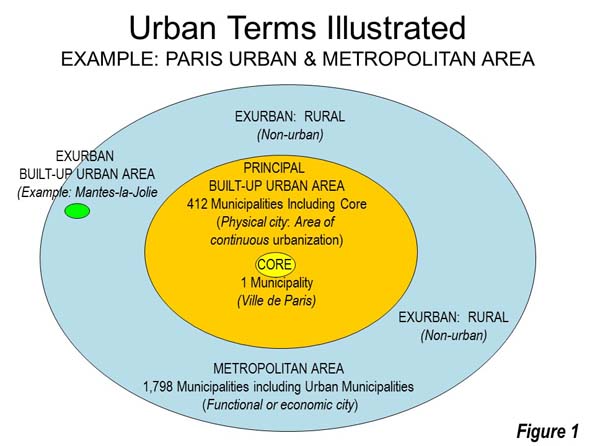
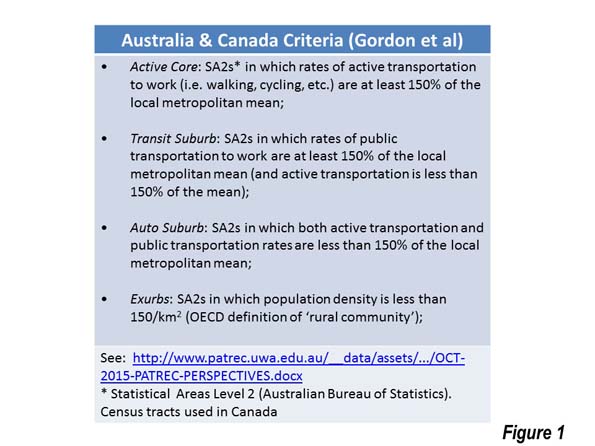
    Many of the world’s biggest cities are getting bigger still. In 2017, the number of megacities — urban areas with better than ten million people —   increased to 37 in 2017, as the Chennai urban area entered their ranks. Chennai becomes India’s fourth megacity, along with Delhi, Mumbai and Kolkota. These are among the major findings in the just released 13th annual edition of Demographia World Urban Areas, which provides population, land area and population density estimates for the 1,040 identified built-up urban areas (cities) in the world. Built-up urban areas are the physical form of the city, a definition which separates out the urban, or constructed form of the city from the rural and smaller town areas with which they form a metropolitan area or labor market (Figure 1).

    The World’s Largest Cities

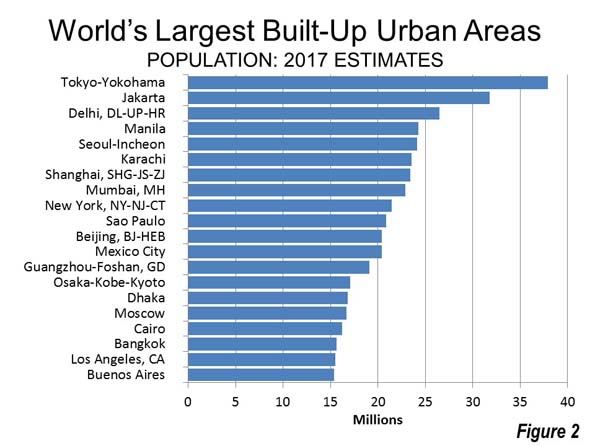
    Asia increasingly dominates the ranks of the world’s most populous cities. Tokyo-Yokohama continues to be the largest urban area in the world (Figure 2), a ranking it has held for more than six decades. It is estimated the Tokyo Yokohama house a population of 37.9 million, living in approximately 3300 square miles (8,500 square kilometers) with a population density of 11,500 per square mile (4,400 per square kilometer).

    Jakarta is the second largest urban area, with a population of 31.8 million 9,600 per square kilometer). Delhi, India’s capital held onto third position, with a population of 26.5 million. Delhi has now opened up a more than 3.5 million lead on 8th ranked Mumbai, which had been India’s largest urban area before and which some experts had considered likely to become the world’s largest city. This prediction, like a similar ones made with respect to Mexico City in the 1980s has not come to fruition and it seems unlikely that either urban area will ever be, the world’s largest.

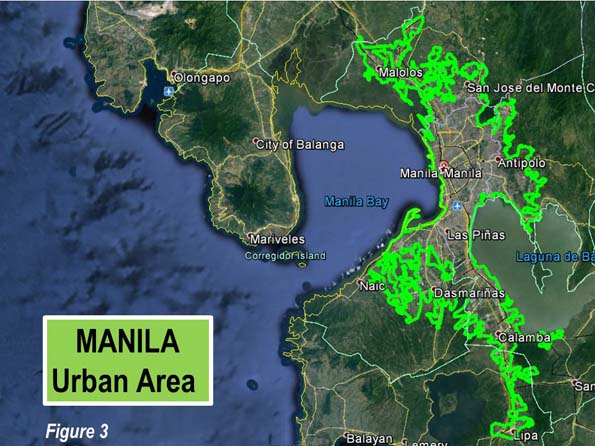
    Manila moved up from fifth position to fourth position, passing Seoul-Incheon (Figure 3). Manila’s population is estimated at 24.3 million, in an area of 690 square miles (1,790 square kilometers) in a population density of 35,100 per square mile (13,600 per square kilometer), the highest density among the top five built-up urban areas.

    Seoul-Incheon remains the only high income city, besides Tokyo,  in the top five. Seoul-Incheon is estimated to have a population of 24.1 million and an urban population density of 22,700 per square mile (8800 per square kilometer).

    The second five includes Karachi, Shanghai, Mumbai, New York and Sao Paulo, with only New York in the high income world. Thus, seven  of the largest 10 cities in the world are now outside the high income world. New York was the largest city in the world from the 1920s until the mid-1950s. London, which was the largest city in the world from the early 19th century to the 1920s is now ranked 34th, while Beijing, which preceded London as largest ranks 11th. Among the next ten largest urban areas, only two — Osaka-Kobe-Kyoto, at 14th and Los Angeles, at 19th are in the high-income world.  Formerly rapidly growing Los Angeles seems likely to drop out of the top 20 before long.

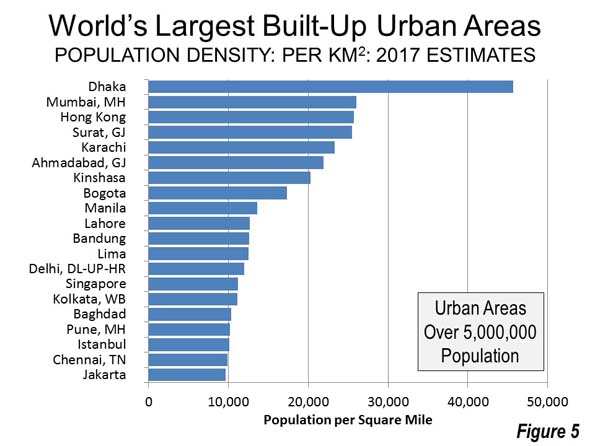
    Dhaka’s High Density

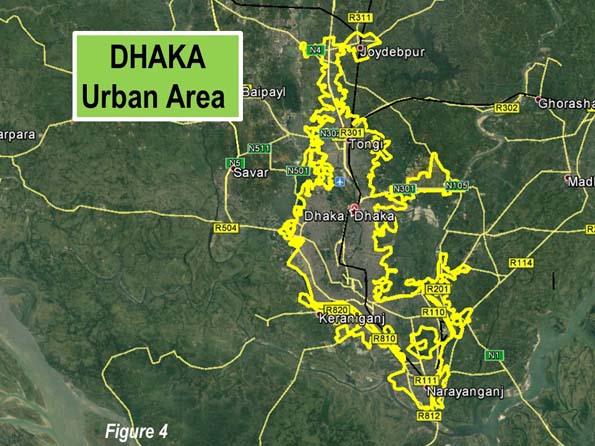
    Dhaka (Figure 4) remains far and away the highest density built-up urban area in the world (Figure 5), Dhaka has an urban density of 118,500 per square mile (45,700 per square kilometer). No other urban area exceeds 70,000 per square mile (27,000 per square kilometer). Yet, Dhaka is not dense enough for some critics, who perceive it to sprawl too much. Notably, Dhaka is about 50 percent denser than Mumbai or Hong Kong (the high income world’s densest city) and more than 30 times as dense as international densification model Portland, Oregon. Portland ranks 963rd in population density out of the 1040 built-up urban areas.

    A Half Urban World?

    In recent years, the population of the world has become majority urban for the first time. Yet, most people do not live in the largest urban areas. For example, only 15 percent of the urban population resides  in the 37 megacities. The middle of the urban population distribution is at a population of approximately 680,000. People who live in urban areas such as Shizuoka (Japan), Mangalore (India), not to be confused with Bangalore, Qitaihe (China) and Allentown (United States) are the average. The population of the urban areas that are larger have half of the urban population, while the smaller includes the other half.

    Distribution of the Population

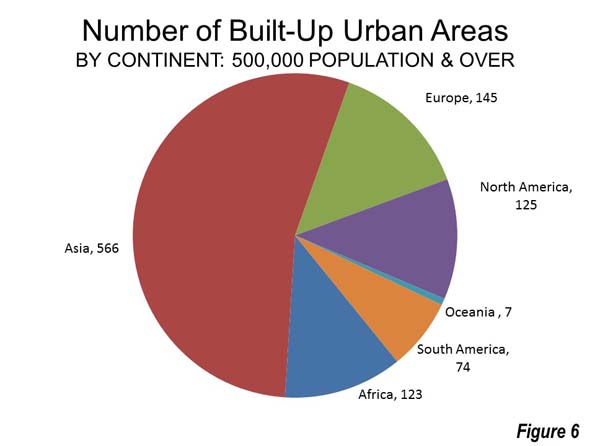
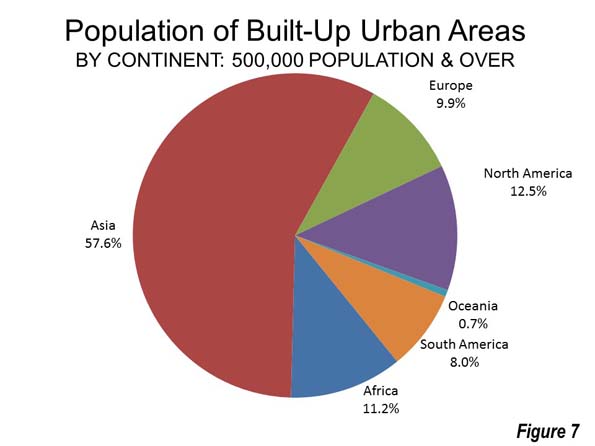
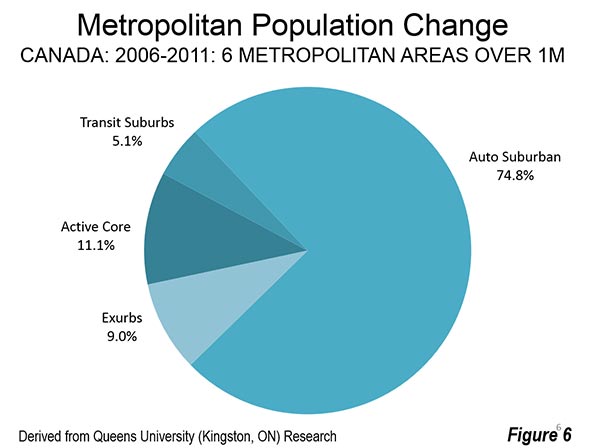
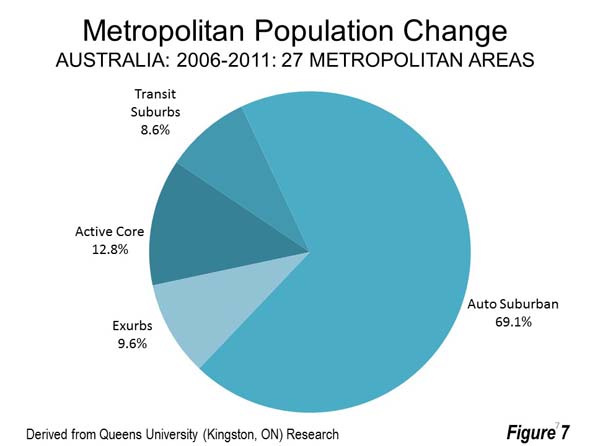
    World urbanization is dominated by Asia, which has a majority (54 percent) of the built-up urban areas with at least 500,000 population. Asia’s dominance is even greater in population, with 58 percent of the residents in urban areas of 500,000 or more. North America has the second largest share of urban area population, at 12.5 percent, followed by Africa (11.2 percent) and Europe (9.9 percent). By contrast, Europe has the second largest number of urban areas of 500,000 population or more, reflecting the generally smaller population of its cities (Figures 6 and 7).

    Concentration of Future Growth in Asia and Africa

    The latest data underscores the substantial changes that have occurred in urbanization in recent decades. In 1950, 11 of the 20 largest cities were in the high income world, according to the United Nations. On average these cities had 5 million population. Today, only five of the 20 largest cities are in the high income world and their average population is 21.5 million.

    In the decades to come, Asia  seems likely to continue its dominance, while Africa will capture an increasing share of urban population growth. By 2050, the United Nations projects that approximately 1.2 billion residents will be added to Asian urban areas, while nearly 900 million will be added to the urban areas of Africa. This would leave only about 125 million, or five percent of total urban growth for the rest of the world. Of course, projections can be wrong, but the strength of current trends make these forecasts all the more credible.

    Note: Demographia World Urban Areas uses base population figures, derived from official census and estimates data, to develop basic year population estimates within the confines of built-up urban areas. These figures are then adjusted to account for population change forecasts, principally from the United Nations or national statistics bureaus for a 2016 estimate.

    Built-up urban areas are continuously built-up development that excludes rural lands. Built-Up urban areas are the city in its physical form, as opposed to metropolitan areas, which are the city in its economic or functional form. Metropolitan areas include rural areas and secondary built-up urban areas that are outside the primary built-up urban area. These concepts are illustrated in Figure 1 (above), which uses the Paris built-up urban area (unité urbaine) and metropolitan area ("aire urbaine") as an example.

    Wendell Cox is principal of Demographia, an international public policy and demographics firm. He is a Senior Fellow of the Center for Opportunity Urbanism (US), Senior Fellow for Housing Affordability and Municipal Policy for the Frontier Centre for Public Policy (Canada), and a member of the Board of Advisors of the Center for Demographics and Policy at Chapman University (California). He is co-author of the “Demographia International Housing Affordability Survey” and author of “Demographia World Urban Areas” and “War on the Dream: How Anti-Sprawl Policy Threatens the Quality of Life.” He was appointed to three terms on the Los Angeles County Transportation Commission, where he served with the leading city and county leadership as the only non-elected member. He served as a visiting professor at the Conservatoire National des Arts et Metiers, a national university in Paris.

    Photo: Cover of Demographia World Urban Areas: 13th Annual Edition.

  • Deindustrialisation in Sydney

    According to property analysts CoreLogic, the Sydney median vacant land selling price has hit $450,000, a massive 20.5 per cent higher than the same time last year. This follows the New South Wales Valuer-General’s January announcement that in the 12 months to July 2016, land values across the city’s north-western and south-western corridors rose by around 25 per cent. Yet a general reluctance to identify out-of-control land values as the prime cause of our housing crisis is matched by a strange indifference to their distorting effects on Sydney’s economic structure. One exception is Michael Cook of Investa Property Group, who recently captured the essential problem. “South Sydney, once the domain of the industrial juggernaut Goodman, is now dotted with high-density Meriton apartments,” he writes. “Where once ‘office’ or ‘industrial’ was the highest and best use, residential is now commanding the big bucks.”

    Cook’s observations are consistent with this account of classic “deindustrialisation” from land economist Alan Evans of Reading University, applicable in many respects to conditions in Sydney:

    It has already been argued that the high price of land will have led to the substitution of other factors for land where this is possible. Where substitution is more difficult, industries will face higher costs, and competition from countries where land or other prices are lower will force them to contract. The net result will have been a shift of production and employment away from some activities which use a lot of space, primarily in manufacturing industry, and towards activities which use relatively little space, primarily services. In this way the planning system will have contributed to the so-called de-industrialisation of Britain over the last 30 years or so.

    While most of our civic and opinion leaders contemplate a “truly global city” for the world’s best and brightest, processes of contraction and dislocation are reshaping Sydney’s industrial base. “The broad trends being observed within Metropolitan Sydney, amplified over the past two years”, said Sass J-Baleh of Colliers International in March, “has been the shift in preference for industrial users, particularly those large users within the manufacturing and logistics industry sectors, to locate further west of Sydney, and the urban renewal of industrial-zoned land in pockets of inner and middle ring areas.” By ‘urban renewal’ she means the conversion of industrial land for residential and ‘mixed use’ purposes, and ‘pockets of inner areas’ means, mostly, the old industrial transportation axis of South Sydney, stretching from Sydney Harbour down to Central Station, Alexandra Canal, Kingsford-Smith Airport and Port Botany.

    In a 2015 report to the NSW Department of Planning, consultancy Urbis note that “industrial land users traditionally located around Sydney’s East and South subregions (ie Botany, Mascot, Banksmeadow etc) have progressively moved west as the city’s population and urban footprint expanded and competition from alternative land uses increases.” Urbis found that in the east and south industrial development has been “priced out … because of their diminishing industrial base (a function of increased inner-city residential densities and planning pressures).” South Sydney industrial land values for larger sites reached $700 per square metre in 2012, say Urbis, while south west and outer south west values were as low as $300 and $250. In the case of industrial development that differential has a large impact, since it’s “delivered at lower margins than development for other land uses.” In other words “land value has a greater role in determining the overall feasibility of development.”

    Colliers report that South Sydney land and capital values achieved a record growth rate of 19.4 per cent over 2016.

    Across metropolitan Sydney, 35 hectares of industrial land was rezoned for other uses in 2013, of which 18.3 hectares was rezoned for medium-density housing. Unsurprisingly a high 79 per cent occurred in Botany Bay LGA (Local Government Area), the lower sector of the old South Sydney hub closest to the port, encompassing Mascot, Botany and Banksmeadow (renamed Bayside LGA in September 2016). While local industrial land values reached $850 per square metre in 2014, the equivalent figure for residential values in Mascot was $1,385. Hence the observation by Colliers’ Edward Princi in 2015, that “residential approvals and rezoning have reduced the traditional industrial base of the city’s south by about 2 million square metres.” CBRE Research estimate that South Sydney will lose 210,000 square metres of industrial stock over the next 5 years. In contrast, the residential populations of Botany Bay LGA and City of Sydney LGA were forecast to grow by 23 and 30 per cent respectively.

    From the gentrified, inner-city band around the CBD, City of Sydney LGA extends down to the industrial zone’s northern Alexandria-Waterloo-Zetland sector. Here residential land values are more than triple those of Botany Bay, as much as $4,751 per square metre in the old factory suburb of Waterloo, just 4 kilometres south of the CBD. “Greater high density development and ongoing gentrification are underpinning the evolution of South Sydney from a blue collar, industrial working class area to an upmarket, mixed-use precinct with a rapidly growing local population”, say agents Jones Lang Lasalle. In June 2015, City of Sydney Council rezoned what are officially called the Southern Employment Lands (“employment lands” are roughly equivalent to industrial lands in NSW planning jargon) to allow for a range of other business activities and housing (parts like Green Square were already the subject of special arrangements). This may just be a case of responding to pressure from landowners, but Lord Mayor Clover Moore’s “green, global and connected” administration would have needed little encouragement.

    By the 1940s, Alexandria/Waterloo was the “largest industrial municipality in Australia”, 415 hectares crowded with 550 smokestack factories churning out products as diverse as soap, tallow, fertilisers, springs, brushes, aircraft, storage batteries, furniture, sporting goods, glass, matches, industrial gases, paper containers, paints and varnishes. “The Birmingham of Australia”, was its nickname. Today Alexandria, Waterloo and Zetland converge on a very different landscape. “One of the largest urban renewal projects undertaken in Australia”, Green Square is a complex of towers providing 20,000 new apartments around a Town Centre with two public plazas, at least one park, an ‘urban stream’, an aquatic centre, a library, and an underground railway station. With an estimated 2030 population of 61,000 packed into 2.78 square kilometres, it will be the country’s most densely populated urban area. The economic principle, elaborated by Evans and others, that “capital is substituted for land in the production of space as land becomes more expensive”, is thus borne out.

    Other parts of industrial South Sydney are being similarly transformed. In 2015 alone, no less than 1,701 apartments were planned or being built amidst the derelict factories and workingmen’s bungalows of neighbouring Rosebery.

    While South Sydney was the heartland of the old industrial zone, it also branched off along the south shore of the harbour west of the CBD, where waterfront sites attracted bulk commodity processing industries reliant on seaborne transportation. Among them the woolstores at Darling Harbour, timber sawing at Rozelle Bay, coal-fired power generation at White Bay, sugar refining at Pyrmont, then further west as Sydney Harbour becomes the Parramatta River, livestock slaughter at Homebush Bay, iron ore smelting at Rhodes, coal-fired gasworks at Mortlake, and oil refining at Camellia. Over the decades, these industrial hubs were uprooted by rising land values and rents, and factors like the availability of motorised transportation. For instance, Urbis point out that between 1993 and 2012 (before the most recent explosion in prices) standard residential land values within a 15 kilometre radius of Sydney CBD rose at double the rate of small industrial land values, by 8.38 per cent and 4.44 per cent respectively.

    Mostly, the old waterfront sites were rezoned for residential, commercial or recreational purposes, but not other industrial uses. Darling Harbour is now a convention, exhibition and entertainment precinct. Rozelle Bay and White Bay, along with Johnston Bay and Blackwattle Bay, are part of The Bays Precinct, an urban renewal plan for mixed use and 16,000 new dwellings on 95 hectares of derelict waterfront land. The small peninsula of Pyrmont is currently Australia’s most densely populated suburb following the completion of Jacksons Landing, a planned community featuring five massive high-rise apartment blocks. Redeveloped as the site of the Sydney Olympics, Homebush Bay is the subject of a 2030 Master Plan for several 45-storey residential towers housing 21,000 more people in 10,700 new apartments. At Rhodes, a project allowing up to five 25-storey buildings will take the expected population to 11,000, “making it one of the most densely populated areas of Sydney outside the CBD.” And Camellia has its own government Land Use and Infrastructure Strategy, proposing “a town centre … public plazas, high-rise apartments and parks.”

    Dislocating land values are having an impact beyond the traditional zones, however. Now they are rippling out to the secondary or middle ring of industrial sites in Sydney’s central west region. From the 1960s and 1970s, places like Blacktown, Holroyd, Rydalmere, Rosehill, Silverwater, Chullora, Villawood, Milperra, Smithfield, Moorebank and Wetherill Park emerged as industrial centres in conjunction with the shift of working class population to the western suburbs and highway upgrades. Urbis identify Smithfield, Wetherill Park and Chullora, along with South Sydney, as locations from which industrial operators are relocating to the outer west and south west.

    Ray White Commercial’s head of research Vanessa Rader explains that “the market extending from Enfield to Moorebank, taking into account regions such as Milperra, Villawood and Chullora in recent years, has been contracting due to competition from other uses such as retail and residential, resulting in increases in land value …” She describes the region as “home to manufacturing, fabrication and wholesale type uses.” Similar analysis came from CBRE’s Raj Chaudhary, who said “the withdrawal of about 100,000 square metres from the central west industrial market, due to rezoning and conversion to residential, is reducing supply in an already tight market …” Last year’s sale of 3 warehouse units in Holroyd for a price equivalent to more than $3,000 per square metre was “the highest industrial per square metre building rate ever achieved in the area.”

    These processes of contraction, dislocation and relocation have transformed Sydney’s industrial geography. According to the NSW Department of Planning’s last Employment Lands Development Program (ELDP) report, 79 per cent of Greater Sydney’s total zoned employment lands, and 93 per cent of the 22 per cent zoned but not yet developed, are now in the central west, south west and outer west subregions. This is up from 60 per cent of all employment lands in 1991, say Urbis. The question is whether planning authorities are supplying enough zoned land serviced with water, sewerage, electricity and road connections on the western periphery to meet demand from new operators and those driven out of other locations, and to relieve pressure on land values generally. While this will receive more detailed treatment on another occasion, the evidence suggests they are failing. “Under the average take-up rate of 163 hectares per annum there is only 2.8 years of supply”, says the ELDP report, “this does not meet the supply standard for undeveloped and serviced land (5-7 years supply).” Malcolm Tyson of Colliers warns that Sydney could run out of industrial land in just 6 years. Dreaming of “global city” amenities like dense housing, commuter rail, walkability and bike paths, our planning elites may be occupied elsewhere. But this is a crisis in the making.

    John Muscat is a co-editor, along with Jeremy Gilling, of The New City, a web journal of urban and political affairs.

    Photo: Derelict White Bay Power Station, Rozelle, Sydney, 2014

  • A Victory for Localism in Australia: Court Blocks Forced Amalgamation

    In a rare victory for grassroots activists, The New South Wales Supreme Court has blocked the forced local government amalgamation of northern suburban councils Ku-ring-gai and the Shire of Hornsby in Greater Sydney. The Ku-ring-gai Council had challenged the parliamentary order and lost at a lower court level , but as The Daily Telegraph put it “Ku-ring-gai Council has won its appeal against a forced merger with Hornsby Council this morning in a judgment that was highly critical of the State Government delegate and its process.” The Council was also awarded costs.

    This forced amalgamation is just one of a number of mergers ordered by the ruling Liberal-National Coalition government of Premier Gladys Berejiklian. This and other such orders have been challenged in court and, according to the Daily Telegraph: “The Berejiklian government’s remaining council merger plans have been thrown into upheaval after the NSW Supreme Court ruled the process used ahead of a proposed merger between Ku-ring-gai and Hornsby Councils did not accord with procedural fairness.”

    Statutory Duty, Disclosure, Public Participation and Procedural Fairness

    In particular, the court indicated concern about a failure of statutory duty, lack of public disclosure and insufficient opportunity for public participation.

    At issue was the recommendation of Delegate Garry West that the forced merger proceed (Delegate West was appointed by the government to make a finding on the government’s forced merger proposal). The Ku-rung-gai Council argued that Delegate West had relied on a merger analysis report by KPMG, a report that the government would not release in public.

    Writing in the opinion, Judge J. A. Basten said: “The Council was right to assert that the delegate could not properly carry out his function of examination without having access to that material…" and found that “that the financial advantages identified by KPMG for the government were a critical element in favour of the merger, but this analysis was not provided to the delegate or public.” Judge Basten concluded that Mr. West had "constructively failed" in his statutory duty of examining the government’s merger proposal, according to the Sydney Morning Herald.

    In addition, Judge Basten pointed out that "Release of the material was also necessary for public participation in the public inquiry to be meaningful." According to the opinion: “The appellant was denied procedural fairness as the delegate chose to rely on the KPMG analysis, rather than conducting his own assessment of the merger, when the appellant was not in possession of the document in which the analysis was contained.”

    No Amalgamation Based on a Secret Report

    Government News reported Greens Local Government spokesman David Shoebridge as saying “Today the Court of Appeal has said the obvious, that it is blatantly unfair to forcibly amalgamate a local council on the basis of a secret report.” (In parliamentary systems, opposition office holders are designated as spokespersons or shadow ministers, replicating the portfolios of the government ministers, who are also legislative members). He added that the decision could “dismantle every single outstanding amalgamation proposal.” He called the decision “an embarrassing blow” for the government’s forced amalgamation program, which he characterized as “unraveling.”

    The Labor Party Opposition Leader Luke Foley expressed similar sentiments, saying “Thank God we have an independent judiciary.”

    Tony Recsei, president of Save Our Suburbs (SOS) NSW, which has opposed the forced mergers, noted that:  “Rational justification for wholesale forced council amalgamations was never provided by the Government.” He added: “The amalgamation “consultation” process was laughable in its duplicity. It was glaringly obvious to anyone who participated that the results had been predetermined.” He characterized the court decision as “… a rare win for the community against a dictatorial government and represents a complete trouncing of underhand bureaucratic manipulation.” Demonstrations have been held to oppose the forced mergers (Photo).


    Photograph courtesy of FOKE (Friends of Ku-ring-gai Environment)

    Still a Threat

    Deputy Premier John Barilaro had demanded two months ago that the Coalition government abandon its forced amalgamation program. His National Party (the Liberal Party’s coalition partner) had recently lost the Legislative Assembly seat of Orange that it had held for 69 years running, a consequence, at least in part of the government’s forced amalgamation program. The National Party has traditionally been strong in the “bush,” including smaller urban areas (such as Orange), outside the major metropolitan areas of Australia. The National Party usually been the coalition partner of the Liberal Party in government at the federal and state level.

    A compromise was reached  such that “country councils” (outside the Greater Sydney area and where the National Party is strong) will not be required to amalgamate. However, a month ago, the government expressed its intention to continue with the Sydney area amalgamations.

    In fact, the government could resurrect the Ku-ring-gai Hornsby forced merger proposal. However, Ku-ring-gai Mayor Jennifer Anderson told the ABC (Australian Broadcasting Corporation) that she was “heartened.” She added that “We have had to go to court to get the Government to listen to us and I am seeking a change of heart from the Premier on this issue as a matter of urgency." She cautioned that "If they continue with the merger process, they will be flying in the face of our community and the court."

    Forced Amalgamation: “Fit for the Dustbin?”

    This initiative is the third local government reorganization since 2000 in New South Wales. Like the previous programs, the justification has been anticipated cost savings. Councils were examined for their fiscal sustainability in “Fit for the Future” reviews.

    Greens spokesman Shoebridge questions the justification for amalgamation. In a Greens of Hornsby website article entitled “Fit for the Future, Fit for the Dustbin,” Shoebridge notes that “When amalgamations have been forced on locals in other states like Victoria and Queensland, rates (taxes) have gone up, services have stagnated and residents end up less connected to the councilors who represent them. In Queensland a number of councils have even begun the expensive process of de-amalgamation, with the Queensland Government bearing the cost of this process.” In that state, the Liberal National government won power promising de-amalgamation votes, yet allowed only four referendums out of the 19 councils seeking relief. All four voted to de-amalgamate.

    Repeating History

    If the Ku-ring-gai amalgamation story sounds familiar, it is. In 2000, the government of Quebec undertook a wholesale program of local government amalgamations. Public reaction was so sharp that the government was defeated at the next election, as the opposition Liberal Party promised de-amalgamation votes. Despite its promises, the Liberals, once elected, required de-amalgamation “yes” votes to equal 35 percent of eligible voters, a prohibitive barrier given the typically low turnouts in local government elections. In the end 32 governments voted to de-amalgamate. In the United States, proposals to force local government amalgamations have not received legislative approval in Pennsylvania, New York, Illinois and Ohio.

    The Sydney area consultant savings report is also familiar. In 1997, the Ontario government announced a forced amalgamation of six local governments in the Toronto area. The “megacity” as it was called was, according to an accounting firm report commissioned by the government, to save $300 million annually, which was not achieved, according to University of Western Ontario local governance expert  Professor Andrew Sancton. Despite overwhelming referendum rejections in six of the cities, the government forced the amalgamation.

    Basic Democratic Values

    Ku-ring-gai Mayor Anderson also stressed basic democratic values, the ability of an electorate to control its government, noting that "This merger should not proceed because Ku-ring-gai ratepayers (taxpayers) will be robbed of the means to decide how and where our rates are spent and of any real say in how our local area is managed.

    These are powerful words. The fight for democracy has been waged for at least the 800 years since Magna Carta and progress has been hard won. Forced amalgamations are anti-democratic and a step backward. It would be one thing if the electorate of Ku-ring-gai had determined that it would be best to amalgamate with Hornsby. But there is a big difference between top-down forced amalgamations and amalgamations that arise from the people themselves. Voluntary amalgamations have a better chance of succeeding than those that are forced.

    However, forced amalgamations dilute the voice of voters, and without  their consent. Usually, as in New South Wales, it is argued that larger government units will be more efficient, exercising economies of scale. The reality is all too often that the economies of scale that are actually achieved are only for special interests, not for the people or their pocket books.

    Wendell Cox is principal of Demographia, an international public policy and demographics firm. He is a Senior Fellow of the Center for Opportunity Urbanism (US), Senior Fellow for Housing Affordability and Municipal Policy for the Frontier Centre for Public Policy (Canada), and a member of the Board of Advisors of the Center for Demographics and Policy at Chapman University (California). He is co-author of the “Demographia International Housing Affordability Survey” and author of “Demographia World Urban Areas” and “War on the Dream: How Anti-Sprawl Policy Threatens the Quality of Life.” He was appointed to three terms on the Los Angeles County Transportation Commission, where he served with the leading city and county leadership as the only non-elected member. He served as a visiting professor at the Conservatoire National des Arts et Metiers, a national university in Paris.

    Photograph: Ku-rin-gai anti-forced amalgamation campaign banner, Photography courtesy of Save Our Suburbs (SOS) NSW.

  • Common Sense on Immigration

    No issue divides the United States more than immigration. Many Americans are resentful of the estimated 11 million undocumented immigrants, worry about their own job security, and fear the arrival of more refugees from Islamic countries could pose the greatest terrorist threat. At the other end of the spectrum are those who believe the welcoming words on the Statue of Liberty represent a national value that supersedes traditional norms of citizenship and national culture.

    What has been largely missing has been a sharp focus on the purpose of immigration. In the past, immigration was critical in meeting the demographic and economic needs of a rapidly growing nation. Simply put, the country required lots of bodies to develop its vast expanses of land and natural resources and to work in its factories.    

    The need for foreign workers remains important, but the conditions have changed. No longer a largely rural, empty country, more than 80 percent of Americans cluster in urban and suburban areas. Many routine jobs have been automated; factories, farms and offices function more efficiently with smaller workforces. Since at least 2000, notes demographer Nicholas Eberstadt, the “Great American Escalator” has stopped working.

    These changes suggest the need to rethink national immigration policies. In a country where wages for the poorest workers have been dropping for decades and incomes have stagnated for the middle class, allowing large numbers of even poorer people into the country seems more burden than balm. They often work hard, but largely in low-income service jobs and in the low end of the health care field. In California, home to an estimated 2.7 million largely Latino undocumented immigrants, approximately three in four Latino non-citizens struggle to make ends meet, as do about half of naturalized Latino citizens, according to a recent United Way study.

    Overall, our current immigrants, legal and illegal, have not advanced as quickly as in previous generations. This, along with the crisis in much of Middle America, should be our primary national concern. This doesn’t necessarily translate to mass deportations or even severe cutbacks in legal immigration, as some, including Attorney General Jeff Sessions and several congressional Republicans, have said. But it certainly does suggest taking a fresh look at how we view immigration.    

    Learning From Abroad

    So, what kind of immigration is best for America?

    Models to consider are those that put premiums on marketable skills and language proficiency rather than family reunification. The Canadian and Australian systems, as President Trump correctly noted, are more attuned to their own national needs, compared with the U.S approach, which emphasizes family re-unification. Canadian authorities allow some 60 to 70 percent of their immigrants to come for economic purposes, notes Carter Labor Secretary Ray Marshall, supporting their system mainly by “filling vacancies that are measured and demonstrated in the Canadian economy.”    

    Such a needs-based program would be a better, and fairer, way of addressing skills shortages than the odious H-IB program, which allows temporary indentured tech workers to replace American citizens. Instead, talented newcomers would be welcomed as future citizens and given the right to negotiate their own labor rates and conditions.

    This emphasis on admitting immigrants with needed skills leaves Canadians and Australians with generally more positive views about immigration than Americans. Australia is one of only three countries in the world where children of migrants do better at school than children of non-migrants. Canadian support for immigration is particularly high in Toronto, which has been transformed from a sleepy Anglo enclave to a vibrant, diverse global capital.

    But such hospitality is not limitless. A former Canadian immigration judge told me recently, in a tone of alarm, that his country’s invitation to 25,000 Syrian refugees could incubate the same sort of disorder that we see across Europe. There, in many heavily immigrant communities, poverty and isolation has persisted, sometimes for generations.    

    I doubt many Americans would want to see the kind of social unrest we see across once peaceful places like Sweden, where women now complain of being perpetually harassed, even as supposedly feminist politicians look the other way. In France, Muslims make up about 7.5 percent of the French population compared to 1 percent in the U.S., but France has been ravaged by Islamic terrorism, Muslim-fueled anti-Semitism, and a widening cultural gap between the immigrants and the indigenous French population. In France and many other European countries, we see the rise of nativist politicians that make Donald Trump seem like Mother Theresa.

    Citizenship and National Culture

    The United States could be headed to a similar devolution. America’s ideals may be universal, but our political community has always been based on U.S. citizenship. You should not have to be an Anglo to admire the Founders, or to embrace the importance of the Constitution. Yet it’s now fashionable among some progressive activists to reject established American political traditions, which constitute a fundamental reason people have come here for the last two centuries.

    Yet the “open borders” lobby on the progressive left increasingly demeans the very idea of citizenship. In some cases, they see immigration as way to achieve their desired end of “white America.” Some advocates for the undocumented, such as Jorge Bonilla of Univision, assert that America is “our county, not theirs” referring to Trump supporters. Others, like New York Mayor Bill di Blasio, refuse to differentiate between legal and illegal immigrants.

    As usual, California leads the lunacy. Gov. Jerry Brown, who famously laid out a “welcome” sign to Mexican illegal and legal immigrants, has also given them drivers’ licenses and provides financial aid for college, even while cutting aid for middle-class residents. Some Sacramento lawmakers are pressing to give undocumented immigrants’ access to state health insurance. Senate President Pro Tem Kevin de Leon recently boasted, “Half of my family would be eligible for deportation under the executive order, because they got a false Social Security card, they got a false identification.”

    The “open borders” ideology has reached its apotheosis in “sanctuary” cities which extend legal protection from deportation to criminal aliens, including those who have committed felonies. Donald Trump opportunistically emphasized this absurd and inappropriate situation—sometimes invoking the names of murdered Americans—during his 2016 campaign. The only mystery is why it would surprise the chattering class that many voters responded to his message.

    Most Americans are more practical about immigration than politicians in either party. The vast majority of us, including Republicans, oppose massive deportations of undocumented individuals with no serious criminal record. Limiting Muslim immigration appeals to barely half of Americans. Only a minority favor Trump’s famous “big beautiful wall” on the Mexico-U.S. border.

    Yet even in California, three-quarters of the population, according to a recent U.C.-Berkeley survey, oppose “sanctuary cities.” Overall, more Americans favor less immigration than more. According to a recent Pew study, most also generally approve tougher border controls and increased deportations. They also want newcomers to come legally and learn English, notes Gallup. This is not just an Anglo issue. In Texas, by some accounts roughly one-third of all Latino voters supported Trump.

    Sadly, immigration as an issue has been totally politicized. Obama deported far more undocumented aliens than his Republican predecessor, or any previous president, for that matter, without inciting mass hysteria. To be sure, Republicans face severe challenges with new generations that are more heavily Latino and Asian and generally more positive about immigration. The undocumented account for roughly one in five Mexicans and upwards of half of those from Central American countries, meaning that overly brutal approaches to their residency would be eventual political suicide for Republicans in many key states, including Arizona, Florida, Nevada, Colorado and even Georgia.

    Any new immigration policy has to be widely acceptable — both where immigrants are common as well as those generally less diverse areas where opposition to immigration is strongest. Unlike many issues, immigration cannot be devolved to local areas to accommodate differing cultural climates; it is, and will remain, a federal issue. A policy that melds a skills-based orientation, compassion, strong border enforcement, expulsion of criminals, and forcing the undocumented to the back of the citizenship line seems eminently fair.

    Economic Growth: The Secret Sauce of Immigration Policy

    Strong, broad-based economic growth remains the key to making immigration work. A weak economy, unemployment, population density, or sudden uncontrolled surges in migration, notes a recent Economic Policy Institute, drives most anti-immigration sentiment. The labor-backed think tank suggests it would be far better to bring in migrants with skills that are in short supply and avoid temporary workers, such as H-1B visa holders, who are paid lower wages, undercutting the employment prospects for Americans.

    Given the demands of competition and changes in technology, it seems foolish to allow many additional lower-skilled people enter our country. This is not elitism: Industry needs machinists, carpenters and nurses as well as computer programmers and biomedical engineers. What we don’t need to do is flood the bottom of the labor market. Again, this reality is race-neutral. Economist George Borjas suggests that the influx of low-skilled, poorly educated immigrants has reduced wages for our indigenous poor, particularly African-Americans, but also for the recent waves of immigrants, including Mexican Americans, over the past three decades.

    Like most high-income countries, America’s fertility rate is below that needed to replace the current generation. This constitutes one rationale for continued legal immigration. But our demographic shortcomings are also entwined with lack of economic opportunity, crippling student debt, and the high cost of family-friendly housing stock. In other words, one reason Millennials are putting off having children is because they can’t afford them.

    Overall immigration is a net benefit, if the economic conditions are right. An overly broad cutback in immigration would deprive the country of the labor of millions of hard-working people, many of whom are highly entrepreneurial. The foreign-born, notes the Kaufmann Foundation, are also twice as likely to start a business as native-born Americans. It’s always been thus—and these aren’t just small, ethnic, family-owned restaurants we’re talking about. More than 40 percent of Fortune 500 companies were founded by immigrants or their offspring.    

    American immigration has succeeded in the past largely due to economic expansion. The historical lesson is clear: a growing economy, more wealth and opportunity, as well as a sensible policy, are the true prerequisites for the successful integration of newcomers into our society.

    Joel Kotkin is executive editor of NewGeography.com. He is the Roger Hobbs Distinguished Fellow in Urban Studies at Chapman University and executive director of the Houston-based Center for Opportunity Urbanism. His newest book, The Human City: Urbanism for the rest of us, was published in April by Agate. He is also author of The New Class ConflictThe City: A Global History, and The Next Hundred Million: America in 2050. He lives in Orange County, CA.

    Photo: Jonathan McIntosh

  • A New Age of Progressive Suburbanism?

    We are living in a global suburban age… While statistics demonstrate that the amount of the world population in metropolitan areas is rapidly increasing, rarely is it understood that the bulk of this growth occurs in the suburbanized peripheries of cities. Domestically, over 69% of all U.S. residents live in suburban areas; internationally, many other developed countries are predominately suburban, while many developing countries are rapidly suburbanizing as well.”

    That’s not some anti-urban crackpot statement (as some inner urban elites might think) but from the introduction to a biennial theme of the MIT Center for Advanced Urbanism (USA). They understand that suburban and regional centres are not irrelevant for the future economy but highly important.  MIT are a pretty credible lot – hardly likely to pursue fringe urban planning or economic theories.

    In Australia, however, that message is not getting through. From the Prime Minister, down, there is a sense of irrational exuberance that the jobs of the future will mostly be concentrated in our CBDs and inner cities. Urban planning which supports increased concentration of employment through generous infrastructure allocations to inner urban areas is the manifestation of this inner urban obsession.  And while CBDs and inner urban areas are lavished with costly projects designed mainly to benefit the minority of people who work there, suburban and regional centres – where the majority live, work and play – have been largely left to fend for themselves.

    This process started in the late 1990s and early 2000s, notions about the “creative class” — many of which are being re-examined by author Richard Florida in a new book —   was a cause celebre amongst planning and government circles. It was widely argued that to attract the creative class of worker (synonymous with high skills and the new economy) cities needed to invest heavily in the quality of life in their downtowns. This was a precursor to the inner urban hipster, and, when real estate prices, rose their successors, the rise of the inner-city latte set.

    This thinking fit in well with two other trendy theories, New Urbanism and ‘Smart Growth’ (which redefined suburban progress as urban sprawl). The collective wisdom moved from supporting a growing suburban realm to one that disparaged it: the burbs were for bogans, the home of sprawl, “McMansions” full of low wage earning, culturally deficient and poorly educated masses, eating fast food diets and slurping sugar drinks. Inner cities by contrast were for educated, cultured and knowledgeable people – who had little need for suburban spaces or suburban habits but greater need for inner city waterfront cycle ways, museums, theatres and quality restaurants run by notable chefs. And, of course, lots of baristas. 

    Urban planning shifted quickly to a highly-regulated approach which promoted much higher densities of inner urban housing (and limits on outward expansion) because, after all, the inner city is where everyone in the future will want to live, right? The promises of these regional planning policies bordered on messianic. Take this example from the “Draft Metropolitan Strategy for Sydney to 2031” from the early 2000s:

    “A home I can afford. Great transport connections. More jobs closer to where I live. Shorter commutes. The right type of home for my family. A park for the kids. Local schools, shops and hospitals. Liveable neighbourhoods.”

    And what have we got thus? Some of the worst housing affordability in the world. Worsening congestion. Longer commutes. Limited housing choice, much of it not ideal for raising families.

    The ongoing policy focus and infrastructure obsession with centralisation is utterly at odds with economic and community signals. New economy industries in technical, scientific or professional services, or health and social care, have little interest in centralisation. Digital technology has broken that tyranny of distance. Undeterred though, we continue to watch as political and industry leaders promote costly infrastructure projects that enhance and support further centralised employment and a concentration of amenity in inner urban cores enjoyed by a privileged, mostly childless minority.

    For the record, the proportion of metropolitan wide jobs in the inner cities of Melbourne, Sydney and Brisbane was 11%, 13% and 12% respectively at the last census.  The reality remains that in our metropolitan centres, most people both live and work outside inner city bubbles of privilege. 

    The penny is finally dropping in some minds. Former Victorian Planning Minister, Matthew Guy (now Opposition Leader) once extolled the virtues of high density inner urban development. Looks like he has had a Damascus moment, commenting in The Australian (March 1, 2017) that: “Victoria is becoming a great, heaving, unsustainable mess. The whole of Victoria is just becoming an offshoot of Melbourne.”

    The emphasis on centralisation of jobs, housing and supportive infrastructure makes little sense in a country with such large land masses and capacity for expansion. Not only that, but the economic winds – enabled by rapid expansion of disruptive technology – are blowing the other way. Suburban and regional centres, long disparaged by the cognoscenti should instead be looked on as part of the solution to economic expansion and development. Where once we promoted urban renewal, we now need to turn our minds to suburban and regional renewal. We need to identify the critical infrastructure constraints of suburban and regional business centres and remedy them to encourage accelerated development of employment opportunities across the board.

    In a bid to put some balance into the discussions about urban development and growth, a Suburban Alliance (www.suburbanalliance.com.au) has been formed in Australia – with the intention of supporting research projects into the nature and needs of the suburban economy, and to use these as a platform for well-informed policy advocacy. Wish us luck. The initial focus starts in Brisbane but if the idea finds support, we’d like to see this expand to cover all major urban and regional centres. 

    The more supporters we can muster the sooner this absurd preoccupation with all things inner city can begin to be balanced with a better understanding of the important role played by suburban and regional business centres and why these are part of the solution to enhanced economic opportunity.

    Ross Elliott has more than twenty years experience in property and public policy. His past roles have included stints in urban economics, national and state roles with the Property Council, and in destination marketing. He has written extensively on a range of public policy issues centering around urban issues, and continues to maintain his recreational interest in public policy through ongoing contributions such as this or via his monthly blog, The Pulse.

    Photo: Photograph by Gnangarra [CC BY 2.5 au], via Wikimedia Commons

  • Suburban Nations: Canada, Australia and the United States

    Professors David L. A. Gordon of Queens University (Canada) and Paul Maginn and Sharon Biermann of the University of Western Australia have now shown Australia to be a largely suburban nation. This follows on Professor Gordon’s work with colleagues in 2013 that came to the same conclusion on Canada based upon 2006 census data. By using census tract data, rather than municipality data, Gordon, et al were able to avoid the misleading but readily accessible jurisdictional analysis (central city versus suburbs) that equated large low-density central municipalities like Calgary and Edmonton, with more compact and dense municipalities like Vancouver and Montreal (or New York with Phoenix). The Gordon, et al criteria is illustrated in Figure 1.

    Broadly following the Gordon et al research, in the Spring of 2014, I published a similar “City Sector Model” using postal code tabulation areas (zip codes) for the major metropolitan areas of the United States. That criteria is illustrated in Figure 2.

    This article compares the Gordon findings in Canada and Australia and contrasts them with my findings in the United States.

    The Gordon Research: Canada and Australia

    In Australia, as in Canada, Professors Gordon, Maginn and Biermann divided metropolitan areas into four classifications at a small area level. The research called the urban core classification "active core," to note the greater dependence of residents on walking and cycling for commuting to work. They divided suburban areas into transit and auto suburban areas, and designated the more rural areas of metropolitan areas as exurban. In both countries, they used the functional or economic definition of cities, which is metropolitan areas or labor market areas (Note 1).

    Gordon, Maginn and Biermann’s analysis shows that Australia’s 27 metropolitan areas are 13 percent “active core”, nine percent transit suburbs, 69 percent auto suburbs and 10 percent exurban. This is nearly the same as the previous research on the 2011 Census of Canada which revealed 12 percent active core, 11 percent transit suburbs, 69 percent auto suburbs and eight percent exurban for all 33 metropolitan areas.

    The Major Metropolitan Areas (Over 1,000,000 Population) In the smaller number of Australian metropolitan areas with more than 1,000,000 population, the “active cores” are only slightly larger than those in Canada (12.4 percent of the metropolitan population versus 11.8 percent). But Canada’s major metropolitan areas has larger “transit suburbs” by a 12.2 percent to 10.0 percent margin. The “auto suburban” figures are virtually the same, with Australia at 70.5 percent and Canada at 70.7 percent. Finally, Australia has a slightly larger “exurbs,” at 7.2 percent compared to Canada’s 5.2 percent (Figures 3 and 4).

    Comparing to the United States

    In the United States, the City Sector Model uses somewhat different criteria. Gordon’s central classifications (“active core” and “transit suburb”) parallel the City Sector Model’s “urban core: CBD” and “urban core: inner ring.” Gordon’s “auto suburban” and “exurban” also roughly parallel the two “suburban” and the exurban City Sector Model classifications.

    Perhaps the largest difference between the two models is in the treatment of commuting. Professor Gordon’s approach is to classify the two central areas based on 50 percent higher than each metropolitan’s area average shares of walking, cycling and transit journey to work travel. The City Sector Model uses an across-the-board minimum 20 percent market share (transit, cycling and walking combined), to replicate a division between more dense pre-World War II development and the automobile oriented suburbs that followed.

    Comparing to the United States

    Of course, it is to be expected that the United States, with the lowest density built-up urban areas (called population centers in Canada and urban centres in Australia) would be even more suburban than Australia and Canada . This is indicated by the data (see Demographia World Urban Areas).

    There are large differences in the two more central classifications. In Australia, the two central areas have 22.4 percent of the metropolitan area population, somewhat less than Canada’s 24.0 percent. In the United States the two central areas have a smaller 14.8 percent of the metropolitan area population (Figure 5).

    Various factors account for this difference. There were, for example, huge urban core population losses   in the United States, but not in Canada and Australia. Another cause is the much earlier motorization of the United States, which by 1929, according to economist Robert Gordon, had achieved 0.9 vehicles per household and had 90 percent of the world’s registered vehicles (Note 2). With this unparalleled market penetration, the U.S. had a several decade long head start in automobile oriented suburbanization. Canada equaled the 1929 U.S. automobile market penetration in the middle 1950s and Australia in the middle 1960s.However, in the suburban classification, the metropolitan areas of the three nations were very similar. The US automobile suburb share of the population, at 68.8 percent was within two percentage points of both Canada and Australia. However, like the urban core, the suburbs showed considerably different results, with the United States having a 16.4 percentage exurban share, compared to approximately 10 percentage point lower shares in both Canada and Australia.

    Part of difference in the exurbs is the larger geographic size of U.S. metropolitan areas, which are far less representative in capturing the genuine labor market. The building geographical blocks used by the U.S. Office of Management and Budget are simply too large for sufficient preciseness. This is illustrated by the Riverside-San Bernardino metropolitan area, which covers an area about the same size as the Canadian province of New Brunswick or the Australian state of Tasmania. By contrast, in Canada, Statistics Canada uses municipalities to construct metropolitan areas, while Australia uses “Statistical Areas Level 4,” which are generally smaller than US counties (Note 3). When the boundaries of a metropolitan area are far larger than the actual commuting shed (as often happens in the United States), more people will be in the metropolitan area.

    At the same time, these results must be interpreted carefully, since there are differences in the criteria and geographical building blocks of metropolitan areas in all three nations.

    Comparison of Population Growth

    Professor Gordon’s research in both nations shows suburban growth   far out stripping growth in the central areas. In Canada, nearly 84 percent of major metropolitan area population growth between 2006 and 2011 was in the “auto suburbs” and “exurbs” (Figure 6). In Australia (27 metropolitan areas), the “auto suburbs” and “exurbs accounted” for nearly 78 percent of population growth (Figure 7). In the United States, the suburbs and exurbs accounted for over 85 percent   (Figure 8).

    Suburban World

    Contrary to planning preference for dense urbanization, suburbanization has occurred virtually wherever people can afford cars. This is even true in Europe, Japan and China. For example, the municipality of Paris continues to languish with a population a quarter below its level of 135 years ago (1881). The 8 million resident urban area growth since that time has been in the suburbs , which now cover more than 25 times the area of the ville de Paris (the central municipality). Other examples, such as the core municipalities of Copenhagen (from 1950), Barcelona and Milan (from 1970) have suffered significant population losses while all metropolitan area growth has been in the suburbs. There are many similar examples around the world.

    Even with the differing definitions, the data in Canada, Australia and the United States is remarkably similar. Of course, not all suburbs are the same, but it should not be surprising that the organic growth of cities continues on their edges.

    Note 1: For further information see: Paul Cheshire, Max Nathan and Henry G. Overman of the London School of Economics in their recent book, Urban Economics and Urban Policy: Challenging Conventional Policy Wisdom.

    Note 2: See Robert J. Gordon, The Rise and Fall of American Growth: The U.S. Standard of Living Since the Civil War, page 374, reviewed at http://www.newgeography.com/content/005364-robert-gordons-notable-history-economics-and-living-standards.  

    Note 3: The larger size of US exurbs is illustrated by the 11,400 square kilometer average areas outside the principal urban areas (exurbs) of US metropolitan areas. In Australia, the average outside the principal urban centres is 6,500 square kilometers, while in Canada the average area outside the principal population centres is 4,600 square kilometers (data based on metropolitan areas with more than 1,000,000 population).

    Wendell Cox is principal of Demographia, an international public policy and demographics firm. He is a Senior Fellow of the Center for Opportunity Urbanism (US), Senior Fellow for Housing Affordability and Municipal Policy for the Frontier Centre for Public Policy (Canada), and a member of the Board of Advisors of the Center for Demographics and Policy at Chapman University (California). He is co-author of the “Demographia International Housing Affordability Survey” and author of “Demographia World Urban Areas” and “War on the Dream: How Anti-Sprawl Policy Threatens the Quality of Life.” He was appointed to three terms on the Los Angeles County Transportation Commission, where he served with the leading city and county leadership as the only non-elected member. He served as a visiting professor at the Conservatoire National des Arts et Metiers, a national university in Paris.

    Photo: Brisbane, Australia Inner Suburbs (by author)

  • Sydney Lurches to Housing Affordability Disaster

    Now and again Australia erupts in controversy about housing affordability. Each time it follows the same course. Some new statistic or media story confirms that prices are out of control. A senior politician is prompted to call for deregulation and more supply, and is backed-up by the property industry. Then come progressive policy wonks saying no, the issue is high investor demand stimulated by tax concessions. Next emerge the welfare lobby, calling for tax reform as well as more social housing and “inclusionary zoning”. After a round of claims and counter-claims, it all fizzles out.

    From the surveyed general public to the Reserve Bank, almost everyone agrees Sydney has a critical problem. The wrangling isn’t over whether to reduce prices, but how. And that depends on where you fit in the city’s system of interests with a stake in property development and construction.

    Conflict of interests

    Generally, these fall into three groups, with their distinct agendas.

    First, the producers and beneficiaries of Big Projects; large-scale housing and urban renewal schemes, particularly high-end apartment developers, top-tier architectural practices, urban planners, rail transport engineers and “sustainability” consultants. Joining them are governments levying value-based property charges, financial institutions with large home mortgage books, and media groups dependent on luxury apartment advertising. “Three of the biggest forces pushing up dwelling prices (the banks, state governments and councils) are like drug addicts”, writes Robert Gottliebsen, “they are hooked on keeping dwelling prices at the current levels or increasing them further”.

    The high-land-value coalition’s agenda encompasses residential densification, preferably on infill or brownfield sites, transit-oriented-development (TOD), and a tendency to CBD-centrism. On the whole, they are supply-solution advocates and support tax concessions.  

    Second, progressive policy analysts and welfare advocates, closely aligned with the university system and highly educated knowledge-worker elite. They, too, promote inner-urban infill development, higher core and middle-ring densities, and public amenities associated with TOD. While the Big Project coalition is mostly driven by finances, cultural-lifestyle factors loom large for knowledge-welfare types. Hence their demands for more housing near “consumer city” localities crammed with trendy bars, pubs, nightclubs, restaurants, cafes, art galleries, theaters, museums and cinemas. This plays into “creative-class” perspectives on economic growth and an aversion to suburbanization as “unsustainable”. Some of them are supply-solution sceptics, leaning toward demand-management, and most are aggressive critics of tax concessions. They urge more social housing schemes and inclusionary zoning, which Big Project lobbies oppose (with good reason; the evidence suggests it reduces supply and raises prices).  

    Third, fringe or greenfield detached house builders, the mass of low-to-middle income industrial or routine service workers, low-level government employees, marginal small traders, in industries like retail, wholesale, logistics, transport, distribution, manufacturing, construction and trades. This worker-trader class is particularly sensitive to input costs, including the impact of high land values on commercial rents. Many rely on real estate as security for financing and gravitate to homes, offices and plant in low-cost, peripheral, auto-oriented regions like Greater Western Sydney.

    There is some overlap between the groups, with elements of the Big Projects coalition, architects, urban planners, sustainability consultants and engineers, crossing over to the knowledge-welfare elite. Apartment developers routinely deploy creative-class and green arguments for proposals which are integrated into broader densification—TOD zoning and infrastructure arrangements.

    Past affordability eruptions were blown off course by the tax issue. Eventually, Labor embraced reform of negative gearing and CGT concessions as policy, urged on by think tanks like Grattan Institute and McKell Institute, prominent knowledge-welfare voices. Yet according to their own estimates, prices would fall by a measly 2 and 0.49 per cent respectively.

    Considering that Sydney prices have escalated by a staggering 64 per cent since 2012, the focus on tax reform is a distraction. Economists like Judith Sloan and Stephen Koukoulas maintain that if there are any tax impacts at all, they are secondary to supply constraints rather than vice versa.

    Most of the Big Projects coalition and worker-trader class subscribe to a supply-solution in principle. But there are differences on what this means in practice. An explicit apportionment of new housing between brownfield-infill sites and greenfield development was dropped from the NSW Government’s A Plan For Growing Sydney. An outcome is achieved by focusing on 14 Priority Growth Areas and Precincts, only 5 of which contain substantial greenfield potential.

    Growth Areas inside established built-up localities are Rhodes East, St Leonards and Crows Nest, Greater Parramatta to Olympic Peninsula, Sydney Metro Northwest, Sydenham to Bankstown Corridor, Western Sydney Employment Area, Epping and Macquarie Park, Arncliffe and Banksia, and Ingleside Precinct. The outer, peripheral areas with most capacity for new land release or greenfield development are North West Growth Area, South West Growth Area, Greater Macarthur Growth Area, Western Sydney Growth Area and Wilton New Town, which lie within seven Local Government Areas (LGAs); Blacktown, The Hills, Camden, Campbelltown, Liverpool, Penrith and Wollondilly Shire.  

    Under A Plan for Growing Sydney, the authorities are planning for an additional 1.6 million people and 664,000 dwellings across the Sydney metropolitan region by 2031. According to NSW Department of Planning “state and local government area household and implied dwelling projections” to 2031, Blacktown LGA will have 48,300 new dwellings, The Hills LGA 28,650, Camden LGA 38,250, Campbelltown LGA 19,450, Liverpool LGA 32,400, Penrith LGA 20,900 and Wilton New Town, in Wollondilly Shire, 16,000 dwellings. In other words, these fringe priority areas are to accommodate an additional 203,950 dwellings, or around 30 per cent of the extra 664,000 dwellings across metropolitan Sydney.

    Of course, not all construction in the 7 peripheral LGAs will be on new land, so the share of total dwellings on greenfield sites will be even lower. The Urban Development Institute of Australia (UDIA) estimates that Sydney greenfield lot production is running at 11,600 a year and will reach 12,355 a year in 2017/18. If achieved, that translates to 185,325 or 27 per cent of the 2031 metropolitan dwelling forecast (equating a fringe lot to a single dwelling). 

    This month, the Department of Planning released accelerated forecasts totaling 184,300 new houses and apartments across the 33 metropolitan LGAs by 2021. Of these, 8,350 are assigned to The Hills LGA, 13,600 to Blacktown LGA, 11,800 to Camden LGA, 6,700 to Campbelltown LGA, 8,050 to Liverpool LGA, 6,600 to Penrith LGA and 1,450 to Wollondilly Shire. Together, these represent 30 per cent of the metropolitan total. Large increases are channeled into established areas, including 21,450 in Parramatta LGA, 18,250 in Sydney LGA (covering the CBD and surrounds), 12,200 in Canterbury-Bankstown LGA and 10,000 in Bayside LGA. NSW Planning Minister Rob Stokes boasted “we are getting the balance better … getting over the greenfield issue was the biggest thing that needed to be done”. The targets were to be fleshed out in Draft District Plans administered by a new planning politburo, the Greater Sydney Commission (GSC).  

    Within days, however, the GSC announced its own strategy and targets. The total housing target is distributed to 6 Districts across the city, Central, North, West Central, West, South West and South, rather than Priority Growth Areas. Based on a metropolitan total target of 725,000 dwellings for 2 million more people, each Draft District Plan nominates a 20 year target to 2036. The South West District contains 4 of the peripheral LGAs with most potential for greenfield construction, Camden, Campbelltown, Liverpool and Wollondilly. Its 20 year housing target is 143,000 dwellings, or 19 per cent of the metropolitan total. Of the other 3 LGAs with most greenfield potential, Penrith accounts for just part of West District’s target of 41,500 dwellings or 5 per cent of the metropolitan total, while Blacktown and The Hills are in West Central District, which is dominated by Parramatta LGA with minimal new land release capacity.

    Higher the density, higher the prices

    Suppression of greenfield development reflects a view that location and density don’t condition the benefits of supply. Yet this is contrary to a body of economic analysis on the land value impacts of urban containment. Citing LSE economist Paul Cheshire, commentator Phil Hayward gives a cogent account of this in “The Myth of Affordable Intensification”.

    Hayward explains that the more density allowed, the higher the average housing unit price becomes. Cheshire put this down to a bidding-war at the margins of each income-level cohort of society for slightly more space. The less average space available per household, the more intense is the bidding-war effect. Site development potential in an urban land market with a regulatory limit on land supply, writes Hayward, seems to capitalise into site values. When the market allows people to consume as much space as they want, the bidding-war effect is absent.

    Urban land economists like Cheshire and Alan Evans at Reading University consider housing a complex good … consisting of many attributes bundled into one composite good. The land base is a particularly important attribute. With rising population and incomes, restrictions on the quantity of land at the periphery ratchet up values across the whole urban region. The evidence that fixed urban growth boundaries put upward pressure on land and thus house prices is clear. While no formal boundary is proposed for Sydney, delimited Priority Growth Areas and GSC Districts have the same effect, operating as land value traps. Between 2009 and 2014, the Sydney median greenfield lot price ballooned from $269,000 to $339,750, reports the UDIA, even though lots released per annum rose from 2503 to 8597.

    To subdue prices, Cheshire argues in a 2009 paper, it isn’t enough to rezone and release enough residential land to meet anticipated demand:

    If we are to provide stable prices … what we need to predict is the effective demand for housing and garden space given that it is the quantity of land that the system allocates. Then we have to allocate not just the quantity of land predicted as being compatible with price stability but more. Not all the land allocated as available for development will actually be developed. One rule of thumb suggested is that this implies allocating 40 per cent more land than the estimated demand indicates is needed.

    In Sydney’s case, the authorities aren’t just failing to supply a buffer of land above population and demand projections. Worse, their targets and greenfield-infill ratio are shaped by bureaucratic value judgements on where people should settle, rather than land markets.

    On top of this, proximity to amenities is another housing attribute which capitalises into prices. Advocates of TOD demand more housing near public transport hubs, or, better coordination of land use and transport infrastructure, as they put it. But evidence from the US suggests that land values within 800 metres of mass transit can rise by up to 120 per cent. Adjacent property prices can rise by 32 to 45 per cent. 

    Opponents of fringe development object that the housing will be too far from jobs, assuming monocentricity or concentration of jobs in the urban core. Yet the Long-Term Public Transport Plan For Sydney found that of the jobs supposedly in centres, 37.1 per cent were actually spread over 33 dispersed locations. Only the CBD with 12 per cent and South Sydney with 2.5 per cent had more than two per cent of the total. The other 62.9 per cent were scattered randomly.  

    Investigating whether outer suburban workers have extra long commutes, in fact, Alan Davies concluded average commute times don’t vary a lot geographically within large Australian cities. Peter Gordon of the University of Southern California has researched commute times in American cities over decades, reporting remarkable stability of travel times across inner and outer metropolitan sectors despite population growth. Many individual households and firms ‘co-locate’ to reduce commute time, he explains, and this spatial adjustment [is easier] in dispersed metropolitan space.

    One advocate of inner-ring densification denied that it relies on price-hiking growth boundaries, claiming that relaxing floor space regulations in an Alonso-type model will give the same [densification] effect, with infinite city size. However, the Alonso model incorporates an artificial assumption of monocentricity. Higher paying professional jobs may locate closer to the core, on average, than lower paying jobs. But it’s lower paid workers who are most in need of cheaper housing. Recently, Grattan Institute’s John Daley wrote “it’s important that new supply is focused on the inner and middle rings – 2-20km out of the CBD – of our large cities … new developments on the edge tend to be a long way from where additional jobs are being created”.

    In other words, he propagates the myth of monocentricity and implies that worker-trader jobs don’t count.

    NSW Treasurer Gladys Berejiklian has announced that residential construction activity in NSW has hit an all-time high. But if that construction is funneled into increasingly expensive sites, Sydneysiders face a recurring home ownership nightmare.

    This is an edited version of an article first published on The New City.

    John Muscat is a co-editor, along with Jeremy Gilling, of The New City, a web journal of urban and political affairs.

    Photo: Photograph by Gnangarra [CC BY 2.5 au], via Wikimedia Commons

  • Australia: Mad As Hell And Not Gonna Take It?

    The result of Australia’s recent Federal election remains unclear, as the count has continued — as of this writing — for days. What is clear is that the major parties suffered a rebuff. One in four Australians voted for an alternative to the traditional mainstream parties, a historic record. Even if incumbent Prime Minister Malcolm Turnbull can win enough seats to control the lower house (nearly tossing out a first term Prime Minister is another first for this election), the Senate is well beyond reach of a majority. As psephologists — those who study elections — digest the details, it is looking increasingly as if the losses can be related to a suburban and regional community disgruntled with the attitudes and indulgences of inner urban elites.

    The values of these elites, including the Prime Minister, seem increasingly at odds with the wider community in everything from economic opportunity to housing, transit, access to education, cost of living concerns, immigration policy, the environment, and more. That divergence made itself felt with a tectonic shift in the latest ballot result.

    First, a crash course in Australian politics. Australia operates a Westminster style democracy. Every person aged 18 and over is required to vote (yes, it’s compulsory). They vote for geographic representatives in the lower house (the House of Representatives), and also for State representatives in the upper house, the Senate — a house of review. Each lower house seat represents approximately 150,000 people. Some electoral districts, given our sparse population density in rural and remote areas, can be larger than Texas in area. Most, however are metropolitan, given that 80 percent of Australians live in just five major cities. Each State elects 12 Senators, plus two for each Territory — being the Australian Capital Territory and the Northern Territory. There are 150 Members of the House of Representative and there are 78 Senators.

    Voting is by a preferential system. Imagine a lower house seat with five candidates representing various political parties. Voters are required to number their ballots in order of preference, and to number each box. The candidate with the least votes is eliminated, but the second preference flows to the candidate numbered next on a given ballot. This process continues until only two candidates remain, the one with the most votes being declared the winner. The same happens in the Senate for each State. Because the Senate typically attracts a wide field of candidates and parties (we even had a Pirate Party this time), the Senate Ballot paper can be over three feet wide. Fortunately, voters only need to number their top six choices of party ‘above the line’ for the Senate. Suckers for punishment can number every single box.

    The main political parties in Australia are the Labor Party (akin to the Democrats); the Liberal Party (akin to Republicans); the National Party (mainly rural conservatives); and The Greens (left wing environmentalists). The party that wins a majority of seats in the House of Representatives forms the government. There is usually a range of smaller fringe parties that record little support, but in this election, One Nation (resembling the Tea Party movement), The Nick Xenophon Party (a populist party), various Christian groups and others combined to achieve 5 seats in the lower house and around 11 in the Senate. Forming a majority in the lower house is now looking difficult, and there is no chance of a majority in the upper house.

    It is unlike the American system in that there is no Presidential vote, although our politics have become Presidential in campaign style. Our Prime Minister (from the conservative Liberal Party, although many in the party dispute his conservatism), is elected by the party’s Members of Parliament only. In other words, the only people who actually get to vote for our current (for the time being) Prime Minister are the voters of Wentworth, his electorate. The rest of the country votes locally for their own candidates. PMs rely on the support of their party room. This is how we manage to have Prime Ministers who can be tossed out not by popular vote, but by party room vote. It makes life interesting, especially in recent years, when we seem to be averaging a new PM each year without the need for an election. The PM forms a Cabinet of their own choosing, drawn from elected party members. This cabinet includes members of both upper and lower houses, but the PM is drawn from the lower house.

    So what happened? In a word: rebellion. Prime Minister Malcolm Turnbull, a graduate of Oxford University and a former barrister, is independently wealthy, living in a multimillion dollar Sydney harbour-side home. Having millionaire leaders might be familiar to Americans, but for Australians it’s unusual. His wife is Lucy Turnbull, a former Lord Mayor of Sydney (which represents only the downtown and immediately adjacent areas), and a prominent urbanist, who also chairs the Greater Sydney Commission. Together, they proudly champion the agenda of the inner urban elites: light rail projects, mass transit projects, increasing urban density, ‘knowledge workers’ as the future of industry, and so on. In the election campaign, Labor Opposition Leader Bill Shorten was happy to be pictured in his campaign bus, actively touring disadvantaged outer-urban and regional areas, while Turnbull was happy to be pictured riding in a Sydney train.

    One of Turnbull’s first acts as Prime Minister, after unseating his conservative predecessor Tony Abbott in a party room coup, was to form a ‘Cities Ministry’ which later released a Smart Cities Plan, much to the adulation of the elites who claimed that without a dedicated Minister for Cities, Australia’s future prosperity was in jeopardy. “Great cities attract, retain and develop increasingly mobile talent and organisations, encouraging them to innovate, create jobs and support growth,” the PM said. The statement was received with wide applause from fawning urban industry groups, media, academics, planners, and left leaning think tanks.

    This wasn’t a focus of the election campaign, but it does perhaps provide an insight into how the politics of a mainstream party and incumbent government, still in its first term, diverged from mainstream Australia. Australia may be among the world’s most highly urbanised nations, but our urbanism is largely suburban by nature. The concerns of suburban and regional electorates focus on cost of living pressures, low wage growth, unaffordable housing, evaporating job opportunities and the casualization of work towards contract positions. For these voters, the importance of inner city light rail projects designed to improve commuting opportunities for a minority of high income, inner-urban dwellers just doesn’t rate on the scale of essential public policy investment. Analysis of the voting patterns of the latest election show that some of the greatest swings against the government came from those middle and outer urban electorates, along with disadvantaged regional communities.

    Neither can the Labor opposition take much comfort from the result. The swing resulted in only a small pickup for them— insufficient to win government — and failed to win enough support from their traditional base, which abandoned the mainstream left for alternative minor parties. Both Liberals and Labor had fallen for the politically correct, left leaning, inner urban policy kool-aid that has increasingly come to represent orthodox establishment views.

    In the same way that the UK ‘Brexit’ Leave vote was supported by communities that did not share in the benefits enjoyed by inner-London elites, many Australians also cast a vote of rebellion, turning their backs on the advice and views of the many inner-urban experts who have talked down to them for years.

    For many, the recent Australian election resembled an opportunity to re-enact the speech of Howard Beale (played by an Australian, Peter Finch) in the film Network: “Things have got to change. But first, you’ve gotta get mad!… You’ve got to say, ‘I’m as mad as hell, and I’m not going to take this anymore!’”

    Ross Elliott has more than twenty years experience in property and public policy. His past roles have included stints in urban economics, national and state roles with the Property Council, and in destination marketing. He has written extensively on a range of public policy issues centering around urban issues, and continues to maintain his recreational interest in public policy through ongoing contributions such as this or via his monthly blog, The Pulse.

    Flickr photo by Pedro Szekely: cloudy skies over the Sydney Opera House.

  • Blaming Foreigners for Unaffordable Housing

    In a number of Western world cities, there is rising concern about foreign housing purchases which may be driving up prices for local residents. Much of the attention is aimed at mainland Chinese buyers in metropolitan areas where housing is already pricier than elsewhere. The concern about housing affordability is legitimate. However, blaming foreigners misses the point, which is that the rising prices are to a large degree the result of urban containment policies implemented by governments.

    London and the United Kingdom              

    The Daily Mail reports that London being deluged with foreign house buyers, who are buying not only expensive properties but also "starter homes," driving prices up. The Mail singles out Russian and Chinese buyers, many of whom pay cash for their purchases. Paula Higgins of the Home Owners Alliance lamented the fact that many foreign buyers are paying cash.  She questions the appropriateness of foreign investment in "family homes." David King, of Priced Out, said: "Foreign investment is driving up prices, making it even harder for ordinary people to get a decent place to live."

    Real estate firms headquartered in Russia are steering their clients to less expensive locations, outside London, such as to the north of England and Wales. A London real estate firm said that only 15% of its sales were to buyers from the UK. There is pressure for the government to protect local home buyers

    Certainly these investors are stepping into an already pricey market. The 11th Annual Demographia International Housing Affordability Survey found London house prices to be a severely unaffordable 8.5 times household incomes in 2014. London has the seventh worst housing affordability out of the 86 major markets rated in nine nations. The outside-the-greenbelt exurbs of London have house prices 6.9 times incomes.

    Vancouver

    Vancouver is a city of immigrants. According to data compiled by University of British Columbia (UBC) Geography Professor David Ley, nearly 90 percent of metropolitan Vancouver’s growth over the past two decades has been from foreign immigration (this article contains a graph with the numbers). Yet, there is significant concern about home purchases in the Vancouver area by mainland Chinese. UBC Professor Henry Yu’s history class described the issue in a video (Blaming the Mainlander).

    The Demographia International Housing Affordability Survey found Vancouver house prices to be a severely unaffordable 10.6 times household incomes in 2014. Vancouver has the second worst housing affordability out of the 86 major metropolitan areas rated in nine nations. Hong Kong has the worst housing affordability, with a median multiple of 17.0.

    California and New York

    Ilya Marritz of Public Broadcasting Systems (PBS) radio station WNYC remarked on how foreign investment is driving up prices in the New York and San Francisco bay areas: "There’s this relatively new trend of people buying properties in the city and not actually spending a lot of time living here." The Demographia International Housing Affordability Survey found New York metropolitan area housing to cost 6.1 times incomes, a 65% increase since before the housing bubble.

    The Diplomat, which specializes in Asia-Pacific affairs, commented that “there’s no doubt that China’s presence in the Bay Area market is driving up prices. The Diplomat quoted real estate executive Mark McLaughlin; “it’s added a demographic of buyers who, generally, take a long-term view. They’re not sellers in the next five to seven years.” Chinese buyers are sitting on much of this property as housing in the Bay Area becomes increasingly scarce, causing its value to skyrocket."

    The Demographia International Housing Affordability Survey places both San Francisco and San Jose metropolitan area house prices at 9.2 times incomes, tied for fourth least affordable in the 9 nations.

    The Los Angeles Times reports strong mainland Chinese purchasing activity in the suburbs of Los Angeles, from the San Gabriel Valley to Orange County, particularly Irvine as well as in Riverside-San Bernardino (the Inland Empire).

    The Demographia International Housing Affordability Survey found house prices to be 8.0 times incomes in Los Angeles, the 10th least affordable major metropolitan area in the Survey. Nearby San Diego prices are even higher, at 8.3 times incomes, earning it the 8th least affordable major metropolitan area in the 9 nation Survey.

    New Zealand

    Things have become more heated in New Zealand. The Labour Party opposition housing spokesperson Phil Twyford blamed foreign investors for driving up house prices in Auckland, New Zealand’s only metropolitan area with more than 1,000,000 population.

    "Kiwi families who are struggling to buy their own home want to know the impact offshore speculators are having on skyrocketing Auckland house prices. They are sick and tired of losing homes at auction to higher bidders down the end of a telephone line in another country."

    This evoked considerable criticism for ethnic insensitivity not only among New Zealand’s large Chinese minority, but also ordinary citizens. Radio New Zealand opined: "For a party that has diligently and deliberately courted the ethnic vote, including the Chinese community in Auckland, this was a risky strategy." The Economics Minister accused Labour of playing "the race card." There was predictable reaction in China, which is New Zealand’s largest goods export partner. The Shanghai Daily headlined: "New Zealand housing market debate descends into race row. "Meanwhile, the National Party government continues its difficult task of trying to reverse the consequences of urban containment policy in Auckland.

    The Demographia International Housing Affordability Survey found Auckland house prices to be a severely unaffordable at 8.2 times household incomes in 2014. Auckland has the ninth worst housing affordability out of the 86 major metropolitan areas rated in nine nations.

    Australia

    In Sydney, the Party for Freedom produced a brochure "blaming Chinese property buyers for pushing up home prices, ‘ethnically cleansing’ Australian families from their suburbs and creating a new ‘stolen generation,’" according to The Sydney Morning Herald (" Race hate flyer distributed in Sydney’s north shore and inner city"). The brochure also referred to foreign purchasers as "greedy foreign invaders," and charged them with "pricing locals out of the market." A You-Tube video was posted in which the party chairman burns the flags of China, the Australian ruling Liberal Party, the Labor Party and the Greens and images of Australia’s Prime Minister and the New South Wales Premier.

    Predictably, this brought a sharp reaction from public officials, such as Lane Cove mayor David Brooks-Horn, whose affluent North Shore community was targeted for distribution of the brochures.

    Despite this "vile attack," as New South Wales Multiculturalism Minister characterized it, there remains serious concern in Australia about rising house prices, which many blame on foreign investors aalthough avoiding the extremes indicated above.

    The Demographia International Housing Affordability Survey found Sydney house prices to be a severely unaffordable 9.8 times household incomes in 2014. This is the third most unaffordable market among the 86 major metropolitan areas rated in nine nations.  Today, The Australian Financial Review reported that the median house price in Sydney has reached $1,000,000 for the first time. This is a 23% increase in just one year.

    Melbourne, with prices 8.7 times incomes is sixth least affordable.

    "Supply, Supply, Supply"

    There is a common theme among those who are blaming foreigners for the escalation in their local house prices: foreign buyers have driven up demand, thus increasing prices and driving local purchasers out of the market. That might be a plausible theory if demand by itself raised prices. But, all else equal, demand results in higher prices only when there is a shortage of supply. And a shortage of supply is exactly what has been produced by government policies in each of the metropolitan areas described above.

    The problem lies largely with the blunt policy instrument of urban containment, which makes it virtually impossible to build on wide swaths of suburban greenfield land. Urban containment policy’s most destructive strategies are urban growth boundaries or greenbelts, which often prohibit development on virtually all greenfield sites and other regulations that deny planning permission on the majority of parcels suitable for housing on and beyond the urban fringe. The shortage of supply so important to the price increases has been produced by government policies in each of the metropolitan areas described above (Figure).

    The problem is that urban containment policy "creates its own weather." Investors are disproportionately drawn to markets where there are shortages. Sir Peter Hall and his colleagues pointed out that development plans provide a guide for developers of where to buy within the metropolitan area (in The Containment of Urban England).

    A Canary Wharf buyer in London told The Wall Street Journal: “If I could afford it I’d buy as many as I could”… “Flats [in London] are a great investment. I can’t see that changing." Nor will it so long as the "sure thing" of extraordinary house price increases supported by planning policy continues. San Francisco Bay Area public officials may as well have hung a "Welcome Speculators" banner from the Golden Gate Bridge.

    James Laurenceson, Deputy Director of the Australia-China Relations Institute at the University of Technology in Sydney, told The Sydney Morning Herald.:

    "Housing affordability is a real problem. The real reasons are right in front of our eyes – limited land releases, zoning regulations, development charges, record low interest rates and tax breaks to property investors. There’s not a Chinese buyer amongst them."

    Indeed, most of the cities above became severely unaffordable well before an affluent middle-class was enabled by China’s economic reforms.

    New South Wales Premier Mike Baird characterized the solution as "supply, supply, supply," which he sees as "the principal lever" for improving housing affordability. Housing affordability proposals that do not start with the supply shortage are little more than empty rhetoric. Attempts to blame the prices primarily on foreigners are not only misleading, but also diverts the public from the more important role played by limiting supply.

    Wendell Cox is Chair, Housing Affordability and Municipal Policy for the Frontier Centre for Public Policy (Canada), is a Senior Fellow of the Center for Opportunity Urbanism (US), a member of the Board of Advisors of the Center for Demographics and Policy at Chapman University (California) and principal of Demographia, an international public policy and demographics firm.

    He is co-author of the "Demographia International Housing Affordability Survey" and author of "Demographia World Urban Areas" and "War on the Dream: How Anti-Sprawl Policy Threatens the Quality of Life." He was appointed to three terms on the Los Angeles County Transportation Commission, where he served with the leading city and county leadership as the only non-elected member. He served as a visiting professor at the Conservatoire National des Arts et Metiers, a national university in Paris. 

    Photograph: Opera House, Sydney (by author).

  • Australian Treasurer Given Primer on Housing Economics

    Wodonga (Victoria) mother of two Mel Wilson has made headlines across Australia with an open letter to Federal Treasurer Joe Hockey on housing affordability. In commenting on Australia’s housing affordability crisis, the Treasurer has told a press conference "The starting point for a first home buyer is to get a good job that pays good money."

    Australia has a severe housing affordability problem. As the Demographia International Housing Affordability Survey showed in January, Sydney median house prices had reached 9.8 times median household incomes of by the third quarter of 2014. In the intervening months house prices have escalated so much that some say the median price will soon pass $1 million.

    It was not that long ago that house prices were far more reasonable in Australia. Nationally, in the early 1990s, house prices averaged around three times incomes. Since that time, house prices have more than doubled relative to incomes. This is placed a considerable burden on purchasing households, especially first home buyers.

    Ms. Wilson incredulously took Treasurer Hockey through the economics of buying a first house in Sydney. She reminded him that it would take all of the average wage earner’s take home pay for four years to save the down-payment on the median house, now priced at A$915,000 (approximately US$700,000.  The entire letter is published below.

    In a later statement, the Treasurer, to his credit, indicated the need for strong lobbying of the states to make more land available to increase supply. The problem in Sydney and Australia is not unique. Similar house cost crises have developed from London to Toronto and San Francisco, where governments have severely limited the land that can be used for new residences, with the wholly predictable result that prices escalate out of control.

    Ms. Wilson, and other concerned (or baffled, as Ms. Wilson puts it) Australians should hope that Treasurer Hockey’s "strong lobbying" is successful. The economic reality is that until there is liberalization of the land use restrictions responsible for much of the housing cost escalation, there will be no relief, other things being equal. Indeed, house prices are likely to just keep going skyward. This requires a mid-course correction toward policies that place improving the standards of living and reducing poverty at a higher priority than urban design.

    Letter from Ms. Mel Wilson to Treasurer Joe Hockey:

    Dear Joe,

    I just wanted to touch base with you regarding your comment that young people are able to enter the property market if they just “get a good job that pays good money.”

    I just wanted to ask you how one might go about this?

    Are you going to be reviewing all the current Awards that are in place to ensure that most jobs pay “good money”?

    Are you going to be creating hundreds of thousands of new jobs that, under your Awards, pay over $100,000 per year?

    Apologies if I have missed this fantastic news, but as someone working in 2 senior HR roles, I believe I would have known about this so that I could pass the message on to some very tired, over qualified employees who currently fall under various Federal and State awards and are being paid between $18 to $25 per hour.

    Are you aware of what the average Australian wage is?

    Are you aware of what the average Australian mortgage in Sydney is?

    Are you aware of the first-home buying process?

    Just in case these facts and figures aren’t available to you, I thought you might be interested.
    The average weekly wage according to the Australian Bureau of Statistics on 1st January 2015 was $1,128.70, or $58,692.40 before tax. This means a take home amount of about $904.00 per week.
    The median house price in Sydney, according to the Domain Group Housing Price Report, as of March 2015, was $914,056.

    Not sure if you know how first home buying works at the moment, but you normally need a deposit of about 20%. This is to pay for the Stamp Duty (which is a State Tax you must pay every time you buy a property), and also to assist in the approval process so that you don’t need to pay Lenders Mortgage Insurance.

    So in this instance, the first home buyer would need about $182,811.00 saved to purchase a house that is the average price in Sydney.

    So to go out and get one of these “good jobs that pay good money” I assume these young people you speak of would need to go to university first.

    On average, it takes about 3 -4 years to get a degree, so if a young person goes to University straight out of school, they can expect to finish their course and be ready for the workforce at about 21, with a HECS-HELP debt of over $20,000. To make this a bit easier for you to understand, let’s say there is a young person named Joe Junior who has done just this.

    If Joe Junior is extremely lucky, and is up there with the best of the graduates from that course and that year, he will get a job straight out of University paying usually under the average wage.
    However, lets just be extremely generous here and say that Joe Junior got a job and was on the national weekly take home wage of $904 per week.

    Joe Junior needs to only save every single dollar worked for about 4 years to save his $182,811 deposit for their first home. Thank you, Mr Hockey, for throwing in that $7,000 first home owner grant too – that meant Joe Junior could get into his first home 8 weeks earlier!

    Just a quick side note, this example does not take into consideration the rising house prices, or Joe Junior’s HECS-HELP debt that he obtained from getting his degree to get one of your so-called “good jobs”.

    Joe Junior is now 25 (not so junior anymore), has been living at home with his parents this entire time and has not been able to spend a single dollar on any bills, board or holidays or public transportation. He also can’t afford a car or petrol for a car but then again “poor people don’t drive cars”. Oh wait, Joe Junior isn’t a poor person – he has a “good job that pays good money.”

    Luckily Joe Junior’s parents have been happy to drive their little Joe Junior to and from work every day and provide free housing, clothing, medical expenses and also provide the food for his breakfast, lunch and dinner each day.

    So finally Joe Junior has saved his $182,811 deposit (of which only about half will go towards his mortgage due to the stamp duty cost), and can now purchase his first home, with a mortgage of about $822,650.00.

    According to the Commonwealth Bank’s online mortgage estimator, the repayments for a mortgage of this amount are $1,073.00 per week over 30 years.

    So hopefully Joe Junior’s average weekly wage of $904.00 has gone up enough to cover the cost of the mortgage.

    Joe Junior has been applying for these “good jobs hat pay good money" that you speak of (I assume by "good money" you mean more than the average wage as you have just seen it is not even enough to cover the cost of the average house prices’ mortgage in Sydney), but hasn’t had any luck as yet. He needed to stay in the same job post university to demonstrate to the bank job stability so that he could purchase his first home. So he only has a degree, and experience in the one job, one industry, and there are just not that many jobs out there paying “good money.”

    Joe Junior now also can’t wash his clothes, eat food, or get to and from work as he no longer lives with his parents, so getting one of these “good jobs” is even more difficult.

    So Joe Senior, are you really aware of all the facts and figures when you says things like buying your first home is “readily affordable” to young people?

    Just slightly confused as to what you were thinking when you said these words at the media conference in Sydney.

    Looking forward to another one of your politically correct, direct and well thought out responses.

    Regards,
    Another baffled Australian