Tag: Australia

  • Better Suburbs = Better Cities: Employment and the Importance of the Suburban Economy

    Australia’s inner city areas and CBDs are a focus of media and public policy attention, with good reason. But it’s also true that the real engines of employment are outside the inner city areas and that the dominant role of our suburban economy as an economic engine is grossly understated, even ignored. This is not good public policy. It’s not even common sense. 

    I have a view that the focus on urban renewal and inner urban economic development has become a policy obsession of late. It’s the trendy thing to quote Richard Florida’s ‘creative class’ theories which become the excuse to increasingly spoil inner city workers with transport, cultural and other forms of taxpayer funded infrastructure. There was a time when inner city areas, if not recapitalised, risked pockets of blight. But those days have passed. Today, it is the suburban landscape – much derided in fashionable inner city policy circles – that risks pockets of blight if not brought back to the attention of policy makers and strategically recapitalised.

    The imperative is simple: the suburban economy is so much larger than inner city areas. As a rule of thumb, between 8 and 9 out of ten jobs in our major metro regions of Brisbane, Sydney and Melbourne are suburban. Only one in ten or at most two in ten, are found in the inner city areas. Achieving a 10% improvement in the suburban economic engine is hypothetically equivalent to achieving an 80% improvement in the economic performance of the inner cities. 

    So why this preoccupation with the inner cities to the detriment of the suburbs?

    First, a quick review of the evidence as provided in the Census. 

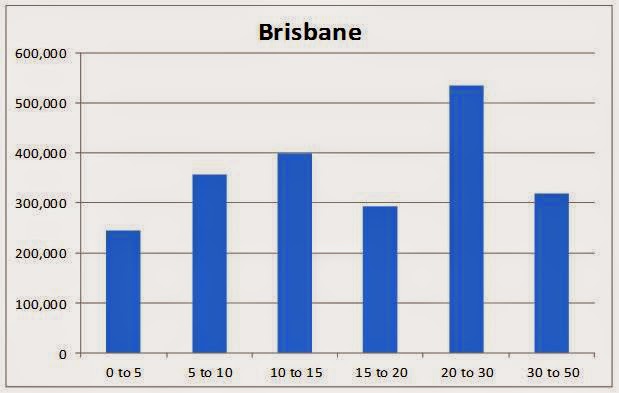
    In Brisbane, the CBD itself accounts for 12.5% of the Brisbane region’s employment numbers – one in eight. The combined CBD and inner city areas – including the CBD – account for around 170,000 jobs.  That’s not a very big number.  As a proportion of state-wide jobs, it’s less than 9%. As a proportion of the 925,000 jobs across the metro region of Brisbane, it’s less than one in five – and that’s with including the near city areas like South Brisbane, Fortitude Valley and Spring Hill. 

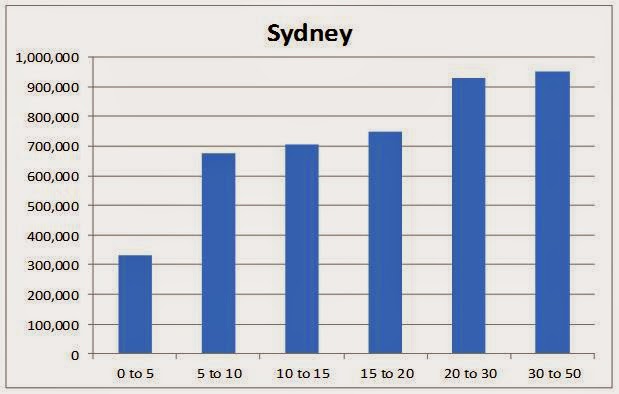
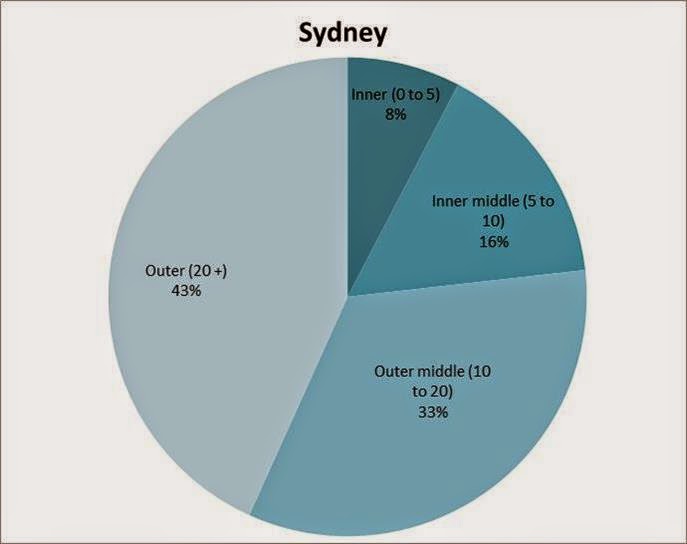
    In Sydney in 2011, the CBD accounted for only 8.3% of all jobs in New South Wales, and for only 13.4% of all jobs in wider metropolitan Sydney. Including the surrounding areas of Pyrmont, Ultimo, Potts Point, and Woolloomooloo raises this share to just 9.7% of all jobs in the state and 15.6% of jobs in metropolitan Sydney. So one in ten state-wide jobs and one in every six or seven metro wide jobs. 

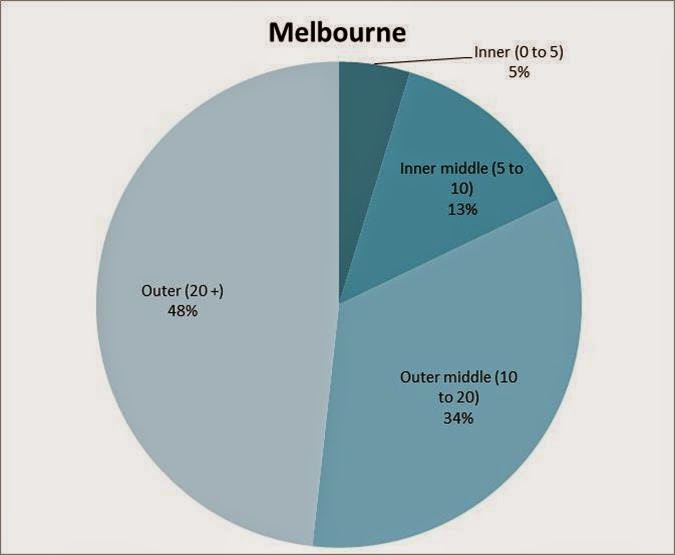
    In Melbourne, the CBD is home to just 7.6% of the state’s total employment, and to just 10.6% of all jobs in greater Melbourne. Including the ‘fringe’ locations of Docklands and Southbank sees this share rise to only 10.3% of the state and 14.3% of greater Melbourne, which is one in ten of all jobs in the state and one in seven metro wide jobs.

    In none of these centres is the concentration of inner city jobs close to one in four metro wide jobs. Yet if you asked a room full of people – industry and planning experts included –a significant proportion will think the figures are much higher. I’ve done this several times at workshops and presentations and there are a worrying proportion of people who seem to think the figure is more than 50%. A wider survey of the general public might even put the figure higher – it would be an interesting exercise to find out.

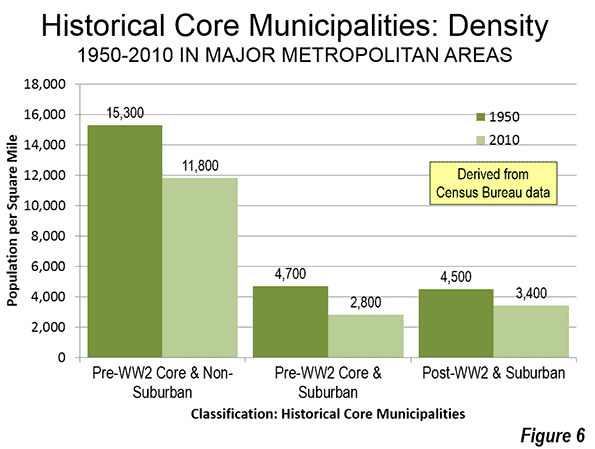
    Suburban employment centres are by nature much more widely dispersed. Teachers, doctors, dentists, tradies, factory workers, shop workers and so on do not rely on close proximity to each other to perform their work, as do CBD employment markets. In the suburban business districts of our metro regions, workforce concentrations typically fall into a band somewhere between 3,000 and 5,000 jobs per square kilometre. Places with super-regional shopping centres will tend to be at the upper end of that scale while industrial areas at the lower end. CBDs, by contrast, can easily have pockets where the employment density sails past 10,000 or 20,000 jobs per square kilometre.

    But however dispersed these suburban jobs may be, it doesn’t make them any less important to the economy – particularly given their dominant role as employment and economic engines.

    So why then the preoccupation with the inner cities and why the dearth of policy interest in the suburbs? 

    Perhaps the inner cities are seen as more glamorous? There are more higher paying jobs and more CEOs to the square mile than anywhere else. It’s where cultural facilities and seats of government are found. It’s where the most expensive real estate is. Basically, any concentration of money plus power is always going to grab attention. It’s an age when celebrity tweets capture more media and public attention than important issues of economic policy. The CBDs and inner city areas are widely seen as ‘where it’s at’ and where the cool people are. ‘Nuff said?

    Sadly, even policy makers seem to have fallen for the inner city bling over suburban substance. The importance of transport workers, freight workers, teachers, doctors, tradies or suburban white collar employment to the economy receives next to no policy comment. The performance of suburban transport systems, the need to promote higher employment density in key centres, the pathways by which property owners could be encouraged to partner with public sector agencies for suburban centre improvement – none of these seem to appear as workshop or forum topics promoted by any of the leading industry groups. 

    I suspect there’s also a strong element of cultural cringe as it applies to our suburban heritage. Frequently mocked as a cultural wasteland or ‘home of the bogan’, there’s an almost desperate desire to prove we’re an advanced society by focussing on the lifestyles and achievements of our inner city areas and the people who live and work there, to the exclusion of all else. ‘Urbanists’ grab headlines and appear as keynotes at any number of planning conferences. Sub urbanists (and there are plenty of them) are evidently persona non grata.

    It’s as if a prosperous, successful and highly efficient suburban economy simply doesn’t cut it in the global race for attention and status amongst cities, which seems almost exclusively focussed on the how much like downtown New York or downtown Paris every other city can pretend to be. 

    The reality is that the inner city economy is reliant on – not divorced from – the performance of the suburban economy. In the same way that there can be no public sector without a profitable private sector, I suggest that a strong and prosperous inner city economy relies heavily on a strong and prosperous suburban economy. And in the same way that strategic infrastructure and policy decisions are needed for the inner city to operate at optimum efficiency, the exact same applies to suburban economies.  

    The question is whether this balance is being achieved.

    Ross Elliott has more than 20 years experience in property and public policy. His past roles have included stints in urban economics, national and state roles with the Property Council, and in destination marketing. He has written extensively on a range of public policy issues centering around urban issues, and continues to maintain his recreational interest in public policy through ongoing contributions such as this or via his monthly blog The Pulse.

  • Where We Live: The Case for Suburban Renewal

    The advent of Australian ‘urban renewal’ in the 1990s has been such a blistering policy success that it’s now arguably well out of proportion to the realities of need based on where people actually live. It’s as if the magic “5 kilometre ring” around our city centres has become a policy preoccupation and an industry obsession. One look at the evidence though suggests perhaps it’s time we turned attention to the suburbs, where the vast majority of us live, to restore some balance.

    The middle and outer suburbs may not capture the interest of intellectual elites or (with some exceptions) provide the homes of the wealthiest in our society, but they do continue to house the vast majority of Australians. All the hype and excitement about “inner city café lifestyles” belies the statistics which show in stark reality that Australia is not only a nation of city dwellers, but within those cities we are overwhelmingly a nation of sub-urban, as opposed to urban, dwellers. 

    Gushing media reports about inner city real estate markets and frantic development activity, public transport projects, parkland projects, bikeways, cultural facilities and the like fail to mention that only 10% of us, at most, live within the 5 kilometre ring. A thumping majority of 90% to 95% of Australians, in the major cities of Sydney, Melbourne and Brisbane, live outside the 5 kilometre ring of privilege. As a rule, 70% to 80% of us live further than 10 kilometres from the city centre, in outer-middle and outer suburban areas. It’s also true that the majority of us not only live beyond the inner city, but we also work outside it. Our pattern of living is not only overwhelmingly suburban, but so is our economy. (More on this next month).  

    So how do our three largest cities shape up on the evidence?

    Sydney


    There are just over 330,000 Sydney residents living within 5 kilometres of the city centre. There are a total of 4.34 million people living within 50 kilometres of the city centre, so that’s a fairly small 8% of the total who call the inner city home.   Twice as many people – 675,000 – live from 5 to 10 klms out and the numbers and percentages continue to rise the further out you go. They may live at lower densities in the outer suburbs but numerically they outnumber inner city residents ten to one. If we think of suburbs from 10 to 20 klms out as ‘outer middle’ areas and those over 20 klms out as ‘outer’, then 80% of the Sydney population lives further than 10 klms from the city centre. 

    Melbourne


    There are fewer people living within 5 klms of the Melbourne City Centre than even Brisbane. Of the total 4.154 million people who live within 50 klms of the city centre, this is just 5% of the total. There are a further 13% of Melburnians who call the 5 to 10 klm band home, while a very substantial 82% of Melburnians call the outer-middle and outer bands home.  Even if the number of people living within the 5 klm ring of Mebourne’s CBD doubled, it would have next to no impact on the overwhelmingly suburban distribution of the population across the Melbourne metro area.

    Brisbane


    In Brisbane, there are around a quarter of a million people within 5 klms of the city centre. That represents 11% of the total 2.15 million people who live within 50 klms of the centre. A further 17% or 356,500 live from 5 to 10 klms out, which actually makes Brisbane the more centrally populated of the three cities studied. 72% of Brisbane residents live further than 10 klms out in middle-outer and outer suburbs which is still a very large majority but not quite the 80% of Sydneysiders nor the 82% of Melburnians. 

    Observations

    One observation worth making is that our governance systems aren’t well designed to deal with large metro regions. Sydney has an astonishing 38 local governments across its metro area, and Melbourne has 12. Brisbane is the exception, with one large local authority providing local government services to 1.13 million people. But even in Brisbane’s case that leaves a further 1 million people living within 50 klms of the city centre governed by a number of different local authorities.

    I am not suggesting we should have single local governments for our entire metro areas. In fact there are some good reasons for the ‘local’ in local government to focus on smaller areas. However, if we want metro wide solutions to apply policy attention and taxpayer funds equitably to suburban and urban areas, local governments may not be best vehicle. You could hardly expect, for example, the highly exclusive Sydney City Council – which at 25 square kilometres covers an area not much larger than its CBD and nothing more – to put up their hand and say “we don’t really need NSW taxpayers to subsidise our outrageously expensive light rail extension because we understand there are higher priorities for people in Bankstown or Hornsby.” 

    Which means that state governments, working with local and federal agencies, are the ones needed to adopt a broader governance approach to metro regions, with a focus on sustaining and developing the suburban economy along with the inner urban.

    The other, more glaring observation is that democracy seems to be failing the suburbs. Nine out of ten city dwellers may live in the suburbs and more eight in ten also work there, but increasingly it’s hard to shake the suspicion that it’s the people who live and work within a 5 klm ring of our city centres that are making the decisions and spending the money. 

    From politicians to heads of government departments, media organisations and industry leaders: the well off and the influential are overwhelmingly from the inner city. They live there, they work there, and primarily socialise and circulate within this hot house of privilege and influence. It may also explain why in some urban planning circles, there is an increasing sense of anti-suburban elitism creeping in. The suburbs and their ‘McMansions’ are topics of disdain for some, which is a pity. 

    The people who live in the middle-outer and outer suburbs of our cities in the main don’t live there because they have to: they live there because they want to. They don’t deserve derision, nor are they looking for sympathy. It may surprise inner city elites, but many have little interest in battling congested inner city traffic or paying excessive real estate prices or living in crowded inner urban arrangements or paying exorbitant parking fees for the privilege of working or living in or simply visiting in the inner city and what it has to offer.

    Yet while numerically superior in every way, the suburban existence remains largely shunned in policy circles. The more that the intelligentsia become isolated from the suburban heartland of our economy and way of life, the weaker we become as a nation. 

    Ross Elliott has more than 20 years experience in property and public policy. His past roles have included stints in urban economics, national and state roles with the Property Council, and in destination marketing. He has written extensively on a range of public policy issues centering around urban issues, and continues to maintain his recreational interest in public policy through ongoing contributions such as this or via his monthly blog The Pulse.

  • What We Earn

    Discussions about housing affordability focus almost exclusively on the price of the real estate, movements in which are monitored by multiple organisations on a seemingly daily basis. There is comparatively little discussion about people’s incomes, which are equally as important as prices in determining what can and can’t be reasonably afforded. The income profile of what most Australian’s actually earn paints a sobering picture which could more often be taken into account in debates about housing and affordability.

    It’s becoming fashionable again for business lobbies to complain about Australia’s high wage structure. It explains, they’ll argue, why we lost Holden, Ford, Toyota, and (almost) Qantas, among other things. And yes, Australia’s wages are high by competitor standards – but so are our costs. One of the most fundamental of needs, along with food and clothing, is shelter. And it’s the cost of shelter relative to incomes which has been stretched to beyond reach for a large proportion of young Australians.

    Reducing minimum wages or reducing wage growth further, if at the same time allowing housing costs to further escalate, will only make this situation worse. Arguably, if we could substantially reduce the cost of supplying new housing, this would relieve upward pressure on wages and work towards improving our global competitiveness – along with repairing living standards for working and middle class families, rather than eroding them.

    First, here are some of the facts on the infrequently discussed income side of the equation. (I am again indebted to the team at Urban Economics for making these available. These are top line numbers only: if you want more detailed analysis, please contact Kerrianne Bonwick).

    Nearly two in three of all Australians earn less than $52,000 per annum. It doesn’t much matter whether it’s Brisbane, Sydney or Melbourne; the proportion is roughly the same.  It’s not much. Slightly more than another one in every eight earn from $52,000 to $78,000 per annum. Roughly eight in ten Australians earn less than $78,000 per annum.

    Personal Incomes

    Brisbane

    Sydney

    Melbourne

    < $52,000

    64.4%

    62.8%

    65.4%

    $52,000-$78,000

    15.0%

    13.8%

    14.1%

    $78,000 to $104,000

    7.0%

    7.2%

    6.4%

    > $104,000

    6.3%

    8.2%

    6.5%

    Not Stated

    7.2%

    8.1%

    7.7%

    Source: Urban Economics

    Problem? It is if you’re trying to buy into the housing market. Take a modest house of say $400,000 (very modest depending on location). A worker on $50,000 – and these represent nearly two thirds of all workers remember – is facing a price multiple which is 8 times their gross pre-tax income.  Basically, two thirds of us are stuffed in terms of affording even a modest $400,000 property if we weren’t already in the market. A more reasonable price multiple of say 5 times income would require an income of $80,000 per annum or more. But there are less than 15% of Australians who fit this category.

    But wait, shouldn’t we count household, as opposed to personal, incomes? A good point, particularly for younger families and young couples, where dual incomes are the norm due to necessity.

    But even based on combined household incomes, a third of all households earn less than $52,000 per annum. Another 14% to 15% earn between $52,000 and $78,000 and another 11% or 12% earn between $78,000 and $104,000. A reasonably healthy 30% of all households bring in a combined $104,000 per annum or more, but seven in ten bring in less than that.

    Taking our modest $400,000 home again, and  roughly half of all household incomes fall short of the $80,000 mark required for a price-to-income multiple of five. For one in three of every households, their combined income means a price to income multiple of eight times. They are pretty much stuffed, still.

    Household Incomes

    Brisbane

    Sydney

    Melbourne

    < $52,000

    32.8%

    32.2%

    34.3%

    $52,000-$78,000

    15.5%

    14.1%

    15.5%

    $78,000 to $104,000

    12.3%

    11.3%

    11.8%

    $104,000 – $156,000

    18.1%

    18.0%

    17.1%

    $156,000 – $208,000

    7.7%

    8.7%

    7.3%

    > $208,000

    3.6%

    5.5%

    3.8%

    Not Stated

    10.1%

    10.3%

    10.4%

    Source: Urban Economics

    Hang on, isn’t it more relevant to focus on the demographic that’s more likely to be trying to get into the property market, because older people and retirees, who already own or are paying off homes, may skew the figures? Absolutely: this is the key demographic, especially if you’re a developer of new detached housing product – which is what this cohort mainly wants to buy to raise a family in (as opposed to the apartment they might rent while pre-children).

    Personal income profiles of the 25-34 year old age group are pretty much in line with the Australia wide picture. More than half earn less than $52,000 and roughly eight in ten earn less than $78,000 per annum, which means eight in ten of this age group – who are at the peak of their family formation potential – would be faced with a price multiple of more than 5 times incomes on a $400,000 property, and more than half would be faced with a price multiple which is eight times their income, or more.

    Personal Incomes 25-34 year olds

    25-34year olds

    Brisbane

    Sydney

    Melbourne

    < $52,000

    55.2%

    52.9%

    56.2%

    $52,000-$78,000

    23.1%

    21.7%

    22.9%

    $78,000 to $104,000

    9.3%

    10.0%

    8.4%

    > $104,000

    5.6%

    7.4%

    5.4%

    Not Stated

    6.8%

    8.0%

    7.0%

    Source: Urban Economics

    None of this is great news. For developers trying to provide affordable new housing in new greenfield estates in urban fringe locations, the reality of these income profiles can’t be escaped. I had the privilege of visiting one such estate in south east Queensland recently and what I saw was absolutely first class product at very good entry level prices in a very well designed environment. No ‘McMansions’ here – just quality new detached three and four bedroom homes, on small lots, priced from around $350,000 – and in some cases less.

    But even at $350,000, only around 15% or so of the target 25 to 34 year old demographic could afford to get in with a price multiple of less than 5 times an individual’s income. That proportion would rise taking into account combined incomes for this age group, but it won’t rise beyond around a quarter or a third.  The reality is that more than half this age group would find an entry level $350,000 home would be six times their combined incomes or more. It would be tough going.

    Granted, interest rates are currently very low and some governments are offering stamp duty and other concessions to first time buyers. But these are having next to no impact on this market. Rates of first home buyer activity are at generational lows.  And interest rates won’t stay this low forever. A significant rise in variable home loan rates could tip a substantial number of families in this age group from the ‘just making it’ basket into the ‘we’re stuffed’ basket.

    Since the ‘do nothing’ policy approach doesn’t seem to be working, what could be done to turn the situation around? Basically, it’s a simple formula between incomes and prices. You either increase incomes or reduce prices. The first probably isn’t an option unless incomes can gradually creep up with inflation and with productivity gains over time.

    But what could also happen is the cost of supplying new housing (not referring to existing stock) could be reduced. New housing is heavily taxed and over regulated (the same cannot be said of existing stock). Something like a quarter to a third of the cost of the new home in an urban fringe location is due entirely to various taxes, charges and compliance costs (which do not apply to existing stock). It is also affected by the rapid escalation in land costs due to policy induced supply constraints in areas of ample available land (the same can’t be said of existing stock in mostly built-out inner or middle ring areas). Most of these additional costs of supply owe themselves to policy changes made since the early 2000s – precisely the time when the affordability gap began to widen.

    It does seem a compelling place to start.

    We should aspire to a more competitive Australia but this policy effort cannot just focus on labour costs because our incomes, while high by competitor standards, are now generally insufficient to cover one of the basic necessities of life: shelter. We have made this happen because policy makers have deliberately increased the cost of delivering new housing with new taxes, charges and compliance costs, all justified on esoteric planning or sustainability principles but impossible to justify on social equity or economic grounds.

    These policy changes were made to suit political agendas at the time: they were not needs-based or market-based policy changes. (It also has to be said the political agendas at the time were in the hands of Labor State governments, starting with Bob Carr in NSW but which spread rapidly to other jurisdictions. Why Labor Governments introduced policies which hurt people on working wages is as mystifying to me as to why Liberal Governments have continued to maintain the same policy positions, with minimal amendment).

    The gap between the cost of supplying even relatively basic housing on the urban fringe, and the incomes of the people who in past generations could afford it, will continue to widen unless regulators and policy makers begin to grasp the wider economic consequences of policy-inflated costs for new housing supply.

    Footnote: why a five times multiple? There is no strong reason. The authors of the global housing affordability report Demographia will argue that affordable housing should be around three times incomes. Moderately unaffordable they define as between 3 and 4, and between 4 and 5 is defined as ‘seriously unaffordable.’ The multiples of 7 or 8 times incomes, which we’re seeing in Australia, are off the scale. But for the purpose of argument, if even relatively high (by international standards) multiples of 5 times incomes seems like a utopian dream, it illustrates how far incomes need to rise or costs of new supply should fall before we get even close to the situation that prevailed for most of our history. It’s a big challenge.

    Ross Elliott has more than 20 years experience in property and public policy. His past roles have included stints in urban economics, national and state roles with the Property Council, and in destination marketing. He has written extensively on a range of public policy issues centering around urban issues, and continues to maintain his recreational interest in public policy through ongoing contributions such as this or via his monthly blog The Pulse.

  • Urban Core Jurisdictions: Similar in Label Only

    The fortunes of U.S. core cities (municipalities) have varied greatly in the period of automobile domination that accelerated strongly at the end of World War II. This is illustrated by examining trends between the three categories of "historical core municipalities" (Figure 1). Since that time, nearly all metropolitan area (the functional or economic definition of the city) growth has been suburban, outside core municipality limits, or in the outer rings of existing, core municipalities.   

    Approximately 26 percent of major metropolitan area population is located in the core municipalities. Yet, many of these municipalities include large areas of automobile orientation that are anything but urban core in their urban form. Most housing is single-detached, as opposed to the much higher share of multi-family in the urban cores, and transit use is just a fraction of in the urban cores.

    Even counting their essentially suburban populations, today’s core municipalities represent, with a few exceptions, a minority of their metropolitan area population. The exceptions (San Antonio, Jacksonville, Louisville, and San Jose) are all highly suburbanized and have annexed land area at a substantially greater rate than they have increased their population.

    According to the 2010 census, using the 2013 geographic definitions, core cities accounted for from five percent of the metropolitan area population in Riverside-San Bernardino to 62 percent in San Antonio (Figure 2).

    International Parallels

    These kinds of differences are not limited to the United States. For example, the city (municipality) of Melbourne, Australia has little more than two percent of the Melbourne metropolitan area population. Indeed, the city of Melbourne is only the 23rd largest municipality in the Melbourne metropolitan area and has a population smaller than a single city council district in Columbus, Ohio.

    These virtually random variations in core city sizes lead to misleading characterizations. For example, locals sometimes point out that San Antonio is the 6th largest city in the United States. True, San Antonio is the 6th largest municipality in the United States, but the genuine, classically defined city – the broader metropolitan area that is the urban organism – ranked only 26th in size in 2010. The suburbs and exurbs, as defined by municipal jurisdictions, are smaller than average in San Antonio, but the city itself stretches in a suburban landscape up to more than 15 miles (24 kilometers) beyond its 1950 borders.

    Core municipality mayors have been known to travel around the as representatives of their metropolitan areas. In some cases core municipality mayors represent constituencies encompassing the entire metropolitan area (such as Auckland or soon to be major metropolitan Honolulu). Others have comparatively small constituencies. For example, the mayor of Paris presides over only 18 percent of the metropolitan area population, the mayor of Atlanta 8 percent, the mayor of Manila 6 percent, Melbourne 2 percent and Perth, Australia just 0.5 percent (Figure 3).

    Core Municipalities in the United States

    A remnant of U.S. core urbanization is evident within the city limits of municipalities that were already largely developed in 1940 and have not materially expanded their boundaries. These are the Pre-World War II Core & Non Suburban category of core municipalities. Between 1950 and 2010 these core municipalities lost a quarter of their population, dropping from 24.5 million residents to 19.3 million (Figure 4). All but Miami lost population. Despite improved downtown population fortunes, the last decade saw a small further decline of 0.2 percent overall. Only two legacy cities, New York and San Francisco, now exceed their peak populations of the mid-20th Century.

    Again, this is the typical pattern internationally. Throughout the high-income world, the urban cores that have not expanded their boundaries and had little greenfield space for suburban development have had declining in population for years. My review of 74 high income world core municipalities that were fully developed in the 1950s and have not annexed materially showed that only one had increased in population by 2000 (Vancouver). Since that time, a few that had experienced more modest declines have recovered to record levels, such as Munich and Stockholm. Most others, such as London, Paris, Milan, Copenhagen and Zurich remain below their peak populations.

    In the United States, most of the strong growth has taken place in the "Pre-World War II & Suburban" classification, doubling from 10.1 million residents to 20.4 million since 1950. These include core cities with strong pre-war cores, but which have either annexed large areas or already contained large swaths of rural territory at that time (like Los Angeles, with its San Fernando Valley, which was largely agricultural) that later became heavily populated.

    Many of these core cities experienced population declines within their 1950 boundaries (such as Portland, Seattle and Nashville between 1950 and 1990). Los Angeles, however, has been the exception. The more highly developed central area (as defined by the city Planning Department) within the city limits has increased in population by one-third since 1950. The continuing suburbanization of the city of Los Angeles, however, is indicated by the fact that the central area’s share of city population has fallen from 68 percent to 47 percent.

    The "Post-World War II & Suburban" core cities are much smaller and their metropolitan areas are nearly all suburban. These include metropolitan areas like Phoenix and San Jose. The population of these metropolitan areas has increased more than seven fold, from 700,000 to 5.2 million.

    Land Area: The differences between the three historical core municipality classifications are most evident in land area. Among the "Pre-World War II & Non-Suburban" cores, land areas were almost unchanged from 1950, with much of the difference reflected in Chicago’s O’Hare International Airport annexation. In contrast, the "Pre-World War II & Suburban" cores more than tripled in size, adding an area larger than Connecticut to their city limits. The percentage increase was even larger in the "Post-World War II & Suburban" cores which covered 10 times as much land in 2010 as in 1950 (Figure 5).

    Population Density: Over the 60 year period, the population density of the "Pre-World War II & Non-Suburban" cores dropped from 15,300 per square mile to 11,400 (5,900 per square kilometer to 4,400). The "Pre-World War II & Suburban" and "post-World War II & Suburban" cores started with much lower densities and then fell farther. The core city densities in these municipalities are approximately one-half the population densities of Los Angeles suburbs (Figure 6).

    The Need for Caution

    All of this indicates the importance of caution with respect to core versus suburban and exurban comparisons. For example, Atlanta, which represents only 8 percent of the urban organism (metropolitan area) in which it is located is not comparable to San Antonio, with its 62 percent of the metropolitan population. These distinctions are important when we talk about different regions.

    Wendell Cox is principal of Demographia, an international public policy and demographics firm. He is co-author of the "Demographia International Housing Affordability Survey" and author of "Demographia World Urban Areas" and "War on the Dream: How Anti-Sprawl Policy Threatens the Quality of Life." He was appointed to three terms on the Los Angeles County Transportation Commission, where he served with the leading city and county leadership as the only non-elected member. He was appointed to the Amtrak Reform Council to fill the unexpired term of Governor Christine Todd Whitman and has served as a visiting professor at the Conservatoire National des Arts et Metiers, a national university in Paris.

    Chicago photo by Bigstock.

  • Urban Containment: Land Price Up 5 Times Income & Smaller

    The shocking extent to which urban containment policy (urban consolidation policy) is associated with higher land (and house) prices is illustrated by a recent press release from RP Data in Australia. The analysis examined the vacant building lot prices for the period of 1993 to 2013.

    During the period, the median price of a vacant lot rose 168 percent after adjustment for inflation. This is nearly 5 times the increase in the median household incomes of the seven largest capital cities (Sydney, Melbourne, Brisbane, Perth, Adelaide, Canberra and Sydney).

    But it gets worse. The median lot size was reduced nearly 30 percent. This should put paid to the myth that urban containment reduces lot prices as it reduces their sizes (Figure). The same dynamic has been indicated in the United States.

    Australia has been plagued by huge house cost increases relative to incomes in association with urban containment policy. Before the adoption of urban containment policy, it was typical for house prices to average three times or less than that of household income. Now, Sydney has the highest median multiple (median house price divided by median household income) of any major metropolitan area in the New World, with the exceptions of Vancouver and San Francisco. Melbourne, the second largest metropolitan area in Australia, has a median multiple of 8.4, making it fifth most costly in the New World, behind San Jose. All of Australia’s major metropolitan areas "severely unaffordable," including slow-growing Adelaide (6.3), as well as most smaller areas.

    For a complete listing of median multiples by major metropolitan area, see the 10th Annual Demographia International Housing Affordability Survey.

    Additional information on the RP Data research is available at Australian Property Through Foreign Eyes

  • Growing Traffic Threatens Sydney

    In the "letter of the week" in The North Shore Times, Save Our Suburbs President Tony Recsei decries the rising traffic congestion that is occurring in Sydney from the densification policies. Urban planners had misled residents into believing that higher population densities would reduce traffic congestion as more people shifted to mass transit. Recsei notes that "While in higher densities, a slightly higher proportion of people use public transport, this is completely overwhelmed by the greater number now in the area who still have to use their cars for all sorts of reasons." With an understandable pride typical of Sydneysiders, Recsei asks "Why should policies be allowed to transform beautiful Sydney into just another overcrowded city in the world?"

    Why indeed. There are two overwhelming outcomes that are shared by cities that have climbed on the urban containment bandwagon: (1) destruction of housing affordability and (2) severely intensified traffic congestion. Sydney suffers from a particularly acute strain of the disease. The land rationing of urban containment policy has house affordability to a severely unaffordable level. Sydney’s traffic congestion has also become among the worst in the world. Of course things could be worse. Vancouver, with an urban planning regime to which some Sydney leaders and planners aspire, is even worse in both categories.

    Note: Tony Recsei is also a newgeography.com author (an example is Predictable Political Punditry Down Under).

  • Cities and Sustainability: Is Intensification Good Policy?

    This post examines the idea that we can promote sustainability by increasing the densities of large cities around their centres.  This compact city paradigm presumes that we can reshape the consumption of citizens in environmentally benign ways by reshaping the cities they live in.  

    The sustainability challenge is the challenge of consumption: how much and what we consume drives our impact on the planet.  But presuming that by enforcing urban intensification we will transform ingrained patterns of consumption in favour of the environment may be a step too far.  Will obliging more citizens to live at higher densities in smaller dwellings around city centres really pave the way to environmental salvation?

    Some evidence of urban impacts

    The Australian Conservation Foundation is committed to ecological sustainability, tackling the social and economic causes of environmental problems.  Among other things, the Foundation publishes the onlineAustralian Consumption Atlas. This is a useful source for addressing the role of urbanisation and urban form.

    The Atlas is based on methodology which traces the direct and indirect demands on the environment of different goods and services.  Consumption patterns from Household Expenditure Surveys are related to household size and type, members’ age structure, incomes and education, and the statistical areas they live in. Using this information the environmental impacts of individuals living in different areas can be mapped. 

    Three indicators of impact are displayed in the atlas: tonnes of greenhouse gas emitted, litres of water consumed, and ecological footprint.  The latter estimates the area of resources required to support a person’s lifestyle.  You can read more about the methodology here.

    The data underlying the atlas is dated – based on the 2001 Census and 1999 Household Expenditure Survey, among other things.  But I do not expect the relativities it demonstrates, or the conclusions it supports, to have changed much.

    Cities don’t consume; people do

    Here is the authors’ key conclusion. Our urban planners, designers, and politicians should consider carefully:

    despite the lower environmental impacts associated with less car use, inner city households outstrip the rest of Australia in every other category of consumption. Even in the area of housing, the opportunities for relatively efficient, compact living appear to be overwhelmed by the energy and water demands of modern urban living, such as air conditioning, spa baths, down lighting and luxury electronics and appliances, as well as by a higher proportion of individuals living alone or in small households.

    In each state and territory, the centre of the capital city is the area with the highest environmental impacts, followed by the inner suburban areas. Rural and regional areas tend to have noticeably lower levels of consumption.

    (Consuming Australia: Main Findings, 2007, Australian Conservation Foundation, p.10)

    Looking inside Sydney

    I explored the indicators for different parts of Sydney.  Here are some results.

    Indicators of Environmental Impacts: Sydney Centre and Suburbs

    People in Inner Sydney generate 92% more greenhouse gas than the New South Wales Average, and well over twice as much as people in the lower income western suburbs, like Penrith and Blacktown. The levels are a bit higher for people in the more prosperous northern suburbs. Despite proximity to major employment centres, and an efficient commuter rail service, the consumption patterns of Willoughby and Ku-ring-gai residents generate high levels of air pollution. 

    Looking East to Sydney CBD
    (Source: www:freeaussiestock.com)

    A similar pattern is evident for water consumption – residents of the hot, dry, western suburbs account for the least consumption, Inner and North Sydney residents the most.  They also have the biggest ecological footprint.

    So what does this tell us?

    The lesson is not necessarily that location in the CBD is less sustainable; but that the lifestyle associated with it is. 

    I have discussed the potential inefficiency of small, multi-unit dwellings elsewhere.  Over and above that, the high cost of redevelopment in central locations calls for housing construction strategies that add little to sustainability.  

    One strategy is to build to modest standards.  This keeps the price down and rental yield up for investors; or creates opportunities for ownership by low income earners.  Another strategy is to adopt high standards of fit-out and install luxury appliances in favoured locations to make multi-unit dwellings attractive to wealthier households. 

    Neither option is particularly environmentally sympathetic.  

    Smaller is still better

    I also reviewed the indicators for smaller cities and towns in New South Wales.  (In some cases these included surrounding rural settlement).  

    Indicators of Environmental Impacts: New South Wales Towns and Small Cities

    This suggests that smaller towns hold the key to environmentally sustainable lifestyles, even more than city suburbs.  For example,  Coffs Harbour’s 73,000 residents generate greenhouse emissions at 88% of the state average, and just 46% of inner Sydney residents.  They consume water at 81% of the State rate (and 60% of North Sydney), and have an ecological footprint just 60% of their inner Sydney counterparts.  Similar patterns are evident in coastal settlements like Byron Bay (33,000 residents), Ballina (42,000), and Port Macquarie (77,000) and inland towns such as Griffith (26,000), Tamworth (60,000), and Wagga Wagga (64,000).

    What does it all add up to?

    A simple overview can be derived by summing the percentage deviations of each area from the New South Wales average across the three measures. Admittedly this is a course approach: it weights each indicator equally, and ignores differences in how much centres vary across each individually.  Nevertheless, it provides a sufficiently meaningful overview to confirm that towns and small cities are generally more sustainable than a large city, and that the suburbs perform better than the inner city. 

    Summary Index of the Environmental Impact of Urbanisation

    Explaining the sustainability dividend of small towns

    There can be any number of explanations for this, the obvious one being that it is all about income.  Perhaps the advantages of lifestyles outside Sydney simply reflect lower average incomes in smaller cities and towns.  As people become more affluent or seek more income, they migrate into the main cities taking their high consumption expectations with them; or by living in large cities they are more likely to earn – and consume – more. 

    Conversely, living in smaller cities and settlements may reflect lifestyle preferences which are intrinsically less environmentally intrusive.  At the same time. small settlements make less travel demands given the greater proximity to work, shopping, service, and recreation opportunities.  In addition, lower density housing may provide more opportunities for passive energy efficiency, directly reducing resource consumption for comparable activities.  

    Flawed policy

    Until we know more, however, we need to avoid the trap of determinism.  It would be short-sighted simply to invert the current paradigm, for example, and decide that policies to encourage people to live outside large cities and city centres will somehow enhance sustainability. 

    Ultimately, how we live is more important than where we live.  What the evidence here confirms, though, is that under current patterns of consumption promoting large scale urban consolidation is flawed as environmental as well as urban policy. 

    Phil McDermott is a Director of CityScope Consultants in Auckland, New Zealand, and Adjunct Professor of Regional and Urban Development at Auckland University of Technology.  He works in urban, economic and transport development throughout New Zealand and in Australia, Asia, and the Pacific.  He was formerly Head of the School of Resource and Environmental Planning at Massey University and General Manager of the Centre for Asia Pacific Aviation in Sydney. This piece originally appeared at is blog: Cities Matter.

    Aukland harbour photo by Bigstockphoto.com.

  • Congratulations Senator Bob Day

    Congratulations to Bob Day, who was elected as a federal Senator from South Australia. Day was one of six Senators elected from the state in the September 7 election. While most of the seats in the lower house of Parliament were quickly decided, the Senate seats too considerably longer under Australia’s preferential voting system. According to the Australian Broadcasting Company, Day’s election and that of the other five Senators was confirmed on October 2.

    Day is an ultimate entrepreneur, having founded Home Australia and related companies that has emerged as a leading home builder across the nation. He served a term as President of the Housing Industry Association. Day has also been a newgeography.com author, writing a piece on one of his passions, the importance of restoring housing affordability in Australia (see The Land Premium that’s Punishing Property).

  • A Suburban Economic Future?

    The basic, often unappreciated, fact  about economic life in Australia’s  metropolitan regions are that most of the jobs are in suburban locations. Our central business districts (CBDs) – prominent though they are – account for only around 10% of all metro wide jobs. That rises to maybe 15% if you include inner city areas. But still, 85% of everyone else who calls Brisbane, Sydney, or Melbourne home works somewhere other than the CBD or inner city.

    Not only that, but the share of jobs in the suburbs versus the city has been rising, at least marginally. This doesn’t mean that CBD job markets are shrinking (in the main, they’re not) just that suburban employment markets are growing faster. So CBDs are becoming, perhaps inexorably, less dominant.

    The evidence also shows that suburban employment isn’t distributed evenly but in various concentrations. Some of these areas add to very large numbers – rivalling the totals found in CBDs – but they do so at much lower densities  of employment. Concentrations of 2,000 to 4,000 jobs per square kilometre are dense by suburban standards but still only a fraction of CBD concentrations, which can closer to 100,000 per square kilometre. For many suburban employment areas, concentrations are even lower at maybe 500 to 1000 jobs per square kilometre. While CBD office workers measure their space in square metres (roughly 15 to 20 per person) some suburban workers might measure theirs in acres.

    The income profiles of CBD and suburban workers vary. Across the three major centres of Brisbane, Sydney and Melbourne, the research shows that suburban workers, on average, earn considerably less than CBD workers. The top ten income areas city wide are nearly all inner city areas, and these workers earn more than double the average of the bottom 10 areas (which are invariably suburban). The average CBD worker, according to the census, pockets between A$80,000 and A$90,000 per annum. The average suburban worker pockets around $50,000 per annum. Given that suburban jobs account for around 85% of all jobs, the CBD is indeed a privileged centre of income earning ability.

    Having said that, there are still interesting pockets of suburban employment where above average incomes are to be found. The Brisbane airport and port region, for example, features in the top 10 income earning locations along with inner city locations, even though the majority of jobs (62% to 74% according to the Census) are blue collar.

    CBDs and suburbs vary widely as well in transit choice. For suburban workers, the private car is the overwhelming mode of transport (above 80% to 90%), not by choice or because of some “love affair” with the car, but of necessity. The very nature of dispersed suburban employment makes public transport uneconomic, which is why only around 5% of suburban workers use it. For CBD workers though, public transport is more widely used because it’s more available and convenient: more than 50% (and more than 60% in Sydney’s case) of CBD workers make use of it.

    The evidence also shows that the closer you live to the city, the more likely you are to use public transport to get to your CBD workplace. The proportion of people with CBD jobs falls the further you live from the CBD: meaning outer suburban residents are highly unlikely to have CBD jobs and hence only around 3% to 5% use public transport. Ironically, given CBD jobs earn the highest incomes and are also more likely to use public transport to get to work, we have a situation where those with the highest paying jobs are enjoying the biggest benefit of heavily subsidised public transport. You could argue on this evidence that those on lower suburban incomes are subsiding the train and bus fares of their higher paid CBD workforce cousins.

    Now for the future

    The evidence is one thing but where it all leads can provoke any number of alternative scenarios. Just for the sake of discussion, here’s one possibility: that cost and convenience factors will increasingly work against CBDs and inner cities and more and more businesses will establish, grow, or relocate to, suburban employment locations.

    It’s possible this shift is already underway. The evidence shows a slow diminution of CBD prominence. Technology is increasingly reducing the person to person immediacy and co-location advantages of a highly concentrated CBD environment. We communicate more and more through electronic means, which also means physical location is less and less essential to daily business contact.

    Costs are another factor. CBD offices and retail space are expensive relative to suburban locations. They are worth it in terms of prestige where this matters (leading legal or accounting firms for example), or where central location is important. But as costs via rents rise, the equation is constantly recalculated. Is it worth headquartering large numbers of staff in CBD offices when these staff have limited need for face to face business dealings outside the business? The cost/benefit analysis is an ongoing exercise and the business press contains plenty of evidence of companies who increasingly decide the suburban alternative is attractive. Rising car parking costs – for business visitors and clients along with staff – are just another factor in the falling competitive advantage for CBDs.

    Employee costs could also be a factor. Even basic administrative roles in CBD locations command higher pay packets than similar roles in suburban locations, for whatever reason. If it is possible for administrative functions to be located in a suburban location where total employee costs are less, will this become a factor in the trade-off between CBD and alternative suburban locations?

    Congestion may be another. As urban densities rise, especially around CBDs and inner city areas, congestion of all forms (private and public transport) will increase. Density is after all almost a synonym for congestion. Will businesses in increasingly congested CBD or inner city environments opt for suburban alternatives where congestion is less of an issue?  We can not yet say.

    On the other hand, because CBDs and inner cities feature such a concentration of social amenities through public infrastructure (entertainment, cultural and recreational facilities) they may continue to appeal as residential addresses. Is it possible that as CBDs and inner cities develop their residential stock, we may find significant numbers of people who live in CBD locations for the inner city amenity, but who work in suburban locations? Time will tell.

    Planning schemes would have to adapt to any of the above scenarios. Existing suburban economic areas may need their development density  under city plans increased to meet demand. TODs may become places where people travel to a suburban workplace centred on a train station or bus interchange, as opposed the current thinking which is that people will live near suburban transit nodes in order to work in inner city locations.

    Any number of other scenarios are possible. My research has attempted to present the statistical evidence on the suburban nature of employment in our metropolitan regions, and make some observations about the public policy and future development implications. Given the extent of commentary, research and public policy concentration around the CBDs and inner city, the research suggests that some equally intense efforts to improve our suburban economic environment would yield significant community wide results.

    Ross Elliott has more than 20 years experience in property and public policy. His past roles have included stints in urban economics, national and state roles with the Property Council, and in destination marketing. He has written extensively on a range of public policy issues centering around urban issues, and continues to maintain his recreational interest in public policy through ongoing contributions such as this or via his monthly blog The Pulse.

  • The Myth of Green Australia

    Having collected the Nobel peace prize in 2007, Al Gore’s fortunes as a climate crusader slid into the doldrums.  But 8th November 2011 arrived as a ray of sunshine. On that day Australia’s parliament passed into law the world’s first economy-wide carbon tax. Rushing to his blog, Gore posted a short but rapturous statement, cross-posted in The Huffington Post. His fervent language echoed in progressive circles across the globe. Australians have been held-up as pioneering environmentalists ever since, putting Americans to shame.

    “This is a historic moment”, thundered Gore. “With this vote”, he blogged, “the world … turned a pivotal corner in the collective effort to solve the climate crisis”. He proclaimed it “the result of tireless work of an unprecedented coalition that came together to support the legislation”; he praised the “leadership of Prime Minister [Julia] Gillard and the courage of legislators”; and he declared “the voice of the people of Australia has rung loud and clear”.

    But maybe Gore’s enthusiasm was a bit misplaced. In September, less than two years later,   Australians seem likely, according to the polls, to hand the Gillard Labor government a stinging landslide defeat.     

    “A pivotal corner in the collective effort”

    As it turns out, and not for the first time, Gore’s analysis was wrong. For one thing, calling the carbon tax “pivotal” is pure hyperbole. Although a relatively large land mass, Australia is populated by just 23 million people who collectively emit a minuscule 1.5 per cent of the world’s greenhouse gases. Nor is the country influential in a broader political union or association beyond its borders.  Since climate change alarmists suggest that global emissions must fall by 25 to 40 per cent in 2020 compared to 1990 levels, Australia’s efforts must be seen as more symbolic than effective.    Currently, the tax and its post-2015 form as an emissions trading scheme (ETS) are adjusted for a trivial 5 per cent cut from 2000 levels in 2020; 5 percent of 1.5 percent of the world’s emissions barely registers against a few days increase in countries like China.   

    Environmentalists maintain that the important thing is not results, but setting a moral example of climate action. They argue Australia’s emissions may be tiny in absolute terms, but amongst the highest in per capita terms. Major emitters like the US, China, India and the EU, they argue, can be shamed into action by Australia’s noble sacrifice. Unfortunately for them, this argument, not very strong to being with, deflated like a punctured balloon since the shambles at Copenhagen.

    We’ve been here before. In December 2009 Australia’s newly minted Labor Prime Minister, Kevin Rudd, with a bulging entourage of 114 officials, descended on the Copenhagen conference to negotiate a successor to the Kyoto Protocol. He was awarded the task of preparing a draft negotiating text. Rudd played an active role in the lead up, having signed Kyoto and undertaken to legislate for an ETS in his first term, a serious step given Australia’s status as the world’s leading coal exporter. Before flying out to Denmark, he introduced the necessary bills into parliament for a second time.

    Copenhagen was a test of the ‘noble sacrifice’ argument driving Rudd’s activism but resulted in an epic fail. Rudd’s draft text was tossed aside and the conference collapsed into bickering between delegations from the developed and developing worlds. There was no successor to Kyoto, just a flimsy, non-binding accord the delegates “took note of” but didn’t adopt. Greenpeace called Copenhagen “a crime scene”.    

    The UN’s Framework Convention on Climate Change has stayed off the rails ever since. Later Conferences of the Parties (COPs) at Cancun and Durban did little more than kick the can down the road. Durban opened twenty days after the “historic moment” of Australia’s carbon tax, but delegates deferred all talk of a binding agreement to 2015, anticipating a possible start in 2020. Canada pulled the plug on Kyoto altogether, later followed by Japan and Russia. “This empty shell of a plan leaves the planet hurtling towards catastrophic climate change”, huffed Friends of the Earth.

    Under the non-binding Copenhagen Accord, parties were invited to submit emission reduction “pledges”, and most have done so. Even if achieved, though, they get the world nowhere near 25 to 40 per cent reductions on 1990 levels in 2020. Writing in Nature, analysts from the Potsdam Institute of Climate Impacts dismiss them as “paltry”. Amid rising emissions, Australia’s “pivotal” carbon tax is but a straw in the wind.

    “An unprecedented coalition that came together”

    At the end of 2009, Rudd’s ETS was rejected by parliament a second time, due in part from rising doubts about the climate agenda. As 2010 progressed, his popularity waned, battered by his inept handling of the contentious mining tax. Labor colleagues bristled at his secretive and high-handed manner, while powerful union bosses resented his indifference to their concerns. Taking advantage of drooping opinion polls, Rudd was sacked and replaced with Deputy Prime Minister Julia Gillard.

    This sent shockwaves through the country, which had never seen a sitting prime minister dumped in his first term. Fearing a backlash, Gillard hastily called an election for 21st August, hoping to exploit positive feelings around serving as Australia’s first female leader. She proved a poor campaigner, however, and a series of damaging leaks scuttled her efforts. Labor’s support faded and on election night Gillard was left with 72 seats, four short of a majority in the 150 seat House of Representatives. The Liberal-National opposition ended up with 73 seats, also short of a majority. The balance of power was in the hands of one Greens Party member and four independents.

    After weeks of negotiations, the Greens and three of the independents pledged support for a Labor Government under Gillard, the first minority government since the 1940s.  But it became increasingly clear that a fresh election would produce a solid Liberal-National Party majority. Returning to the people for a new mandate was never in Gillard’s interests. As for the Greens and independents, fortune delivered them more power than they ever had or would ever have again. Making the most of their time in the sun, they opted for Gillard, who wasn’t about to call another election. Gillard’s coalition may be “unprecedented”, in Al Gore’s words, but it’s untrue that they “came together to support” high principle. They were thrown together by electoral chance and stuck together out of grim self-interest.

    “Leadership of Prime Minister Gillard and the courage of legislators”

    After the second rejection of his ETS, Rudd shelved the policy indefinitely, to the dismay of the world’s environmentalists. The inner circle which advised him to take this course, according to later revelations, included Julia Gillard. On becoming prime minister she showed little enthusiasm for the climate cause, ruling out a price on carbon unless there was “a deep and abiding community consensus”. Her tokenistic policy at the 2010 election was “citizen’s assembly” to canvass options. The opposition also ruled out a price on carbon. Twice in the lead up to polling day, Gillard explicitly denied rumours of a hidden agenda, uttering the now infamous words “there will be no carbon tax under the government I lead”.

    Gillard entered the post-election negotiations desperately hoping to save her prime ministership.  The radical Greens would never have backed the conservative opposition. But when they demanded a carbon tax as the price of their support, she caved in a fit of panic, displaying little of the courage praised by Gore. The independents signed on to keep the minority government in business.

    Labor’s Clean Energy Future package includes a carbon tax, but also billions of dollars of compensation and credits to cushion the blow. In a massive money churn, around $5 billion of the revenue is disbursed to households in higher benefits and tax breaks, and $9.2 billion goes to industry assistance, including free permits for high emitting industries, $300 million to the steel industry, $1.26 billion to the coal sector, and $1.2 billion to manufacturing. Unhappy about these handouts, the Greens were bought off with a $10 billion Clean Energy Finance Corporation. Australians are left wondering how all of this encourages shifts to “cleaner” energy sources. The handouts muffle some damaging impacts of the tax, but they are hardly “courageous” from the perspective of Al Gore.

    “The voice of the people of Australia has rung loud and clear”

    Gillard made her plans for a carbon tax public on 25th February 2011. Her residual popularity sank like a stone. The Newspoll of 18-20 February 2011 recorded 50 per cent satisfied and 39 per cent dissatisfied with her performance. In the next survey of 4-6 March 2011, those figures were reversed: 39 per cent satisfied, 51 per cent dissatisfied. Labor’s support (first preference) plunged to 30 per cent in the March survey, from 38 per cent at the election. These results were consistent with a general fall in support for climate action. From a high of 68 per cent in 2006, reported the Lowy Institute Poll, it dropped to 41 per cent in 2011. Only 32 per cent of Australians supported the carbon tax when Gore wrote his rapturous blog post.    

    Gillard’s frantic attempts to recover have come to nothing, and calling an election for 14th September hasn’t helped. The latest Newspoll of 5-7 April 2013 had her satisfaction rating at a dismal 28 per cent, with 62 per cent dissatisfied. Labor’s support is still in the basement at 32 per cent, with the Liberal-Nationals at 48 per cent. Likely, the government faces a devastating loss of around 20 seats.  

    The opposition’s implacable campaign against the carbon tax has rocked Gillard’s time in office. They promise to repeal it, dismantle much of the Clean Energy Future package and even abolish the Department of Climate Change. Since the 2010 election Labor has suffered a succession of defeats at the state level, losing power in New South Wales, Victoria, Queensland and the Northern Territory, while the Liberal-National Coalition improved their majority in Western Australia. These elections were fought on state issues, but in every case the conservatives echoed Opposition Leader Tony Abbott’s anti-carbon tax message. Closer to home, Gillard was forced to stare down moves against her by colleagues to restore Kevin Rudd, once in February 2012 and again in March this year. Four senior cabinet ministers were sacked or resigned after the second episode. Labor limps forward in the worst possible shape.

    A Liberal-National victory would probably mean the end of climate change as a major political priority in Australian politics. Al Gore was mistaken. He didn’t hear “the voice of the people of Australia” on 8th November 2011; but if he’s listening he’ll hear it “loud and clear” on 14th September 2013.

    John Muscat is a co-editor of The New City Journal.