Tag: Best Cities 2011

  • Listing the Best Places Lists: Perception Versus Reality

    Often best places lists reflect as much on what’s being measured, and who is being measured as on the inherent advantages of any locale.  Some cities that have grown rapidly in jobs, for example, often do not do as well if the indicator has more to do with perceived “quality” of employment.

    Take places like Denver and Seattle. Both do well on what may be considered high-tech measurements – bandwidth, educated migration, entrepreneurial start ups – but have trailed other places in terms of creating jobs. Others, such as Oklahoma City and Raleigh, do better in terms of overall job creation and cost competitiveness.

    There are effectively few truly objective criteria, and the Area Development list does tend to weigh a bit heavy on the factors that help more expensive – although not necessarily the most costly – cities. If cost of doing business, or regulatory environments were given more weight, some of the high fliers would not do as well.

    We prefer to focus less on atmospherics and more on how people, and businesses, are voting for their feet. San Francisco and New York have generally had slower job growth and greater outmigration, but do well on lists that focus on perceived qualitative factors.

    But then there is Austin. Here is one region that has it all, the low costs and favorable regulatory climate of Texas along with the amenities associated with a high-tech region. The area creates a large number of jobs of varying types and is still inexpensive enough to attract young, upwardly mobile families. This gives it a critical advantage over places like Silicon Valley, Los Angeles or New York.  Unlike those three centers, Austin performs extraordinarily well in quantitative measurements.

    The region that most closely matches Austin in these respects is not Seattle and Denver, but Raleigh Durham. Recently a group of leaders from Raleigh made a visit to Denver to learn what makes that city successful. Speaking to the group, we pointed out that by objective measurement – job growth, educated migration, population growth – Raleigh beat Denver by a long shot, yet it was to Denver the group was looking for inspiration. In fact, over the past three years, Americans have moved to Raleigh at a rate more than three times that of Denver.  Perception can be a funny thing which makes a winner feel inferior to a clear runner-up.

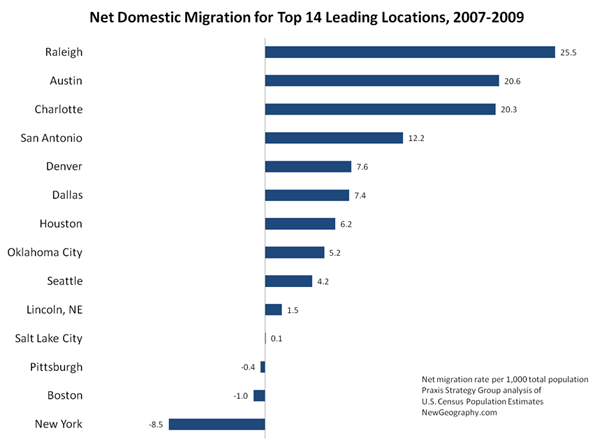
    Another strange result is that New York and Houston had the same number of mentions. Yet looking at numbers — from educated migration, job growth, population increase — Houston slaughters New York. People, from the college educated on down are flocking to Houston while fleeing, in rather large numbers, from New York. One has to wonder where the rankers live and where they are coming from. Houston triumphs on performance, while New York, to a large extent, wins on perception. 

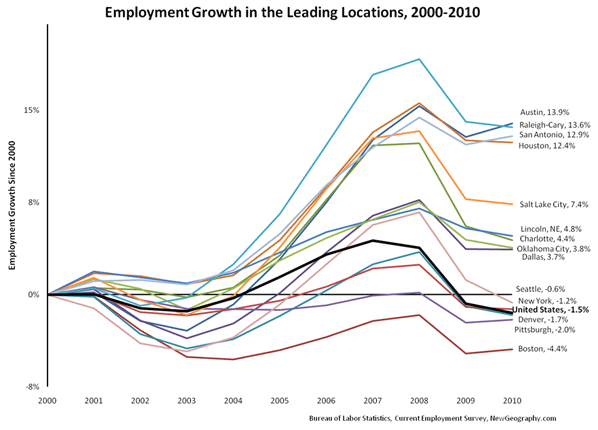
    Looking simply at job growth over the past ten years for the Leading Locations mentioned on at least five surveys, the 14 regions separate themselves into three groups.  The top tier of places – Austin, Raleigh, San Antonio, and Houston – all have seen job growth of more than 12% and seem to be recovering from the recession faster than the others.  

    Salt Lake City and Charlotte were tracking with the top tier of places until 2007 but have since fallen to the second tier of cities.  The remainder of the second tier includes steady growers Dallas and Lincoln, along with Oklahoma City, a region that has seen a boom in jobs since bottoming out in 2003.

    The final job growth tier of places includes five regions that have fewer jobs than ten years ago.  Seattle drops just below the zero line after being hit particularly hard by the 2001 and 2008 recessions, while New York and Denver finish near the national rate.  Pittsburgh and Boston spent most of the decade below their 2000 employment levels, but each seem to be recovering from the recession faster than many of the other Leading Locations cities. 

    But perhaps the biggest problem with lists has to do with the size of regions. Much of the fastest growth in America, particularly in terms of jobs, has been in small metros, many with fewer than 1 million or 500,000 residents. Smaller dynamic areas such as Anchorage, Alaska; Bismarck, North Dakota; Dubuque, Iowa; or Elizabethtown, Kentucky – all in the top 25 of NewGeography’s Best Cities for Job Growth 2011 Rankings – are too small to show up on some lists yet may be a location of choice for expansion. This reflects not so much their relative desirability but the fact that, unlike larger regions, they simply are not included on many rankings.

    Ultimately, a list of lists does tell us much, but perhaps only so much for a specific individual or business. For someone interested in the movie business, for example, Los Angeles – and increasingly places like New Orleans or Albuquerque – are great draws, but perhaps not so much for financial services.  The lists of lists are useful to identify hotspots, but for most location decisions, it may be more imperative to drill down to more detailed industry sectors and workforce attributes. And most of all, take the perception factor into account and look instead at the real numbers to tell you where to go.

    This piece first appeared at AreaDevelopment.com, as part of its Leading Locations series discussing best cities rankings.

    Joel Kotkin is a Distinguished Presidential Fellow in Urban Futures at Chapman University in California, an adjunct fellow with the London-based Legatum Institute, and the author of The Next Hundred Million: America in 2050. Mark Schill is Vice President of Research at Praxis Strategy Group, an economic research and community strategy firm.  Both are editors at NewGeography.com, a provider of two surveys for Area Development’s Leading Locations list.

    Photo by mclcbooks

  • Is The Information Industry Reviving Economies?

    For nearly a generation, the information sector, which comprises everything from media and data processing to internet-related businesses, has been ballyhooed as a key driver for both national and regional economic growth. In the 1990s economist Michael Mandell predicted cutting-edge industries like high-tech would create 2.8 million new jobs over 10 years.  This turned out to be something of a pipe dream. According to a recent 2010 New America Foundation report, the information industry shed 68,000 jobs in the past decade.

    Yet this year, information-related employment finally appears to be on the upswing, according to statistics compiled by Pepperdine University economist Michael Shires. The impact of this growth is particularly marked in such long-time tech hot beds as Huntsville, Ala., Madison, Wis., and San Jose-Sunnyvale-Santa Clara, Calif., in the heart of Silicon Valley, all of which have relatively high concentrations of such jobs.

    The San Jose area, home of Silicon Valley, arguably has benefited the most from the  information job surge. Much of this gain can be traced to the increase in social networking sites such as Facebook, LinkedIn and Twitter, all of which have been incubated in the Valley. Good times among corporations  have led many to invest heavily in software productivity tools, while those marketing consumer goods have boosted spending for software and internet-related advertising.

    The 5,000 mostly well-paying information jobs added this year was enough to boost San Jose’s standing overall among all big metros 20 places to a healthy No. 27 in our ranking of the best cities for jobs.

    But as economists enthuse over the tech surge, we need to note the limitations of information jobs even in the Valley. Software and internet jobs, which have increased 40% over the past decade, have not come close to making up for the region’s large declines in other fields, notably manufacturing, construction, business and financial services. Overall, the region has lost 18% of its jobs in the past decade — about 190,000 — the second-worst performance, after Detroit, among the nation’s largest metros. It still suffers unemployment of close to 10%, well above the national average of 9.0%.

    This dual reality can also be seen in the local real estate industry. Office vacancies may be back in the low single digits in some markets popular with social networking firms, such as Mountain View, but they remain around 14 or higher throughout the region — 40% higher than in 2008. No matter how impressive reporters find a new headquarters for high-fliers like Facebook, the surplus of redundant space, particularly in the southern parts of the Valley, suggest we are still far from a 1990s style boom.

    Some observers also warn that the long-term prospects for the Valley may not be as good as local boosters assume.  Analyst Tamara Carleton cites many long-term factors — like the financial condition of local cities and diminishing prospects for less skilled workers — that make it tougher on those who live below the higher elevations of the information economy. She also says that a precipitous decline in foreign immigration could slow future innovation.

    This dichotomy is even more evident in the other big information gainer among our large cities, Los Angeles. Although it is little known by the media or pundit class, the Big Orange actually boasts the nation’s single largest number of information jobs. Its over 5% growth in information jobs translates to roughly 10,000 new positions over the past year. In LA, the big sector for information jobs is likely not social media but traditional entertainment, one of the area’s core industries.

    Yet information growth clearly is not bailing out the overall economy. Other much larger sectors, such as manufacturing and business services, continue to shrink. The area still suffers from an unemployment rate of roughly 12%.

    Other information winners among our large metros include Boston and Seattle, both traditional centers for software-related jobs. These areas have not been as hard-hit by the real estate and industrial declines as their California counterparts, so increasing information employment does not constitute the outlier that we see in the Golden State.

    Less expected gains were notched by some of our other big information sector winners. One big surprise was New Orleans-Metairie-Kenner, whose information sector, including a growing film and television industry, expanded almost 39% in past year. As is the case with its strong overall rankings in our best cities survey, the Big Easy’s comeback from the devastation of Katrina is heartening. But we must curb our enthusiasm by pointing out that total regional employment remains 100,000 less than it was before the hurricane.

    Equally intriguing has been the strong performance of Warren-Troy-Farmington, Hills, Mich., and Detroit-Livonia, each of which has benefited from the resurgence of the American auto industry. In these areas, information jobs tend to be tied to the needs of large industrial companies. The state has also waged a major campaign for film and television jobs, as part of an attempt to diversify its economy.

    Yet for all the hype that surrounds industries like media and software, it’s critical to point out that overall this is not a huge employment sector. Even in Seattle — home to Microsoft, Amazon and other software based companies — information jobs account for barely 6% of the total. In Los Angeles, it’s 5%, compared with 10% each for manufacturing and hospitality. In media-centric New York, information accounts for barely 4% of jobs, less than half that of financial services and one-third that of the huge business service sector.

    In most other areas, including those experiencing strong growth, information jobs constitute an even smaller part of the economy. In New Orleans, Warren, Mich., and Detroit, such jobs account for less than 2% of employment . Still, the growth of this sector is a promising one for  economies that have long been dominated, like New Orleans, by the generally low-paying hospitality industry, or in the case of the Michigan cities, the volatile and often chronically hurting manufacturing sector.

    The increase in information jobs, however welcome, should not be sold as a universal elixir for  creating widespread prosperity. Over time, strong regional economies are those that rely on diverse employment sources rather than one.  Growth in high-tech and media jobs can wow impressionable reporters and earn economic developers bragging reights, but they can do only so much to lessen the recession’s impact on the vast majority of workers and the broader regional economy.

    Top Cities for Information Job Growth, 2009-2010
    New Orleans-Metairie-Kenner, LA 38.86%
    Honolulu, HI 25.11%
    Shreveport-Bossier City, LA 18.85%
    Huntsville, AL 14.71%
    Leominster-Fitchburg-Gardner, MA  13.33%
    Redding, CA 10.53%
    Madison, WI 10.20%
    San Jose-Sunnyvale-Santa Clara, CA 10.01%
    Grand Rapids-Wyoming, MI 7.63%
    Providence-Fall River-Warwick, RI-MA 6.33%
    Top Big Cities for Information Job Growth, 2009-2010
    New Orleans-Metairie-Kenner, LA 38.86%
    San Jose-Sunnyvale-Santa Clara, CA 10.01%
    Providence-Fall River-Warwick, RI-MA 6.33%
    Los Angeles-Long Beach-Glendale, CA  5.08%
    Warren-Troy-Farmington Hills, MI  3.97%
    Boston-Cambridge-Quincy, MA  3.54%
    Riverside-San Bernardino-Ontario, CA 3.46%
    Charlotte-Gastonia-Rock Hill, NC-SC 3.02%
    Detroit-Livonia-Dearborn, MI  2.48%
    Seattle-Bellevue-Everett, WA  1.47%

    Joel Kotkin is executive editor of NewGeography.com and is a distinguished presidential fellow in urban futures at Chapman University, and an adjunct fellow of the Legatum Institute in London. He is author of The City: A Global History. His newest book is The Next Hundred Million: America in 2050, released in February, 2010.

    Photo by Angelo Amboldi

  • Manufacturing Stages A Comeback

    This year’s survey of the best cities for jobs contains one particularly promising piece of news: the revival of the country’s long distressed industrial sector and those regions most dependent on it. Manufacturing has grown consistently over the past 21 months, and now, for the first time in years, according to data mined by Pepperdine University’s Michael Shires, manufacturing regions are beginning to move up on our list of best cities for jobs.

    The fastest-growing industrial areas include four long-suffering Rust Belt cities Anderson, Ind. (No. 4), Youngstown, Ohio (No. 5), Lansing, Mich. (No. 9) and Elkhart-Goshen, Ind. (No. 10). The growth in these and other industrial areas influenced, often dramatically, their overall job rankings. Elkhart, for example, rose 137 places, on our best cities for jobs list; and Lansing moved up 155. Other industrial areas showing huge gains include Niles-Benton Harbor, Mich., up 242 places, Holland-Grand Haven, Mich., (up 172),  Grand Rapids, Mich., (up 167)   Kokomo Ind., (up 177) ; and Sandusky, Ohio, (up 128).

    Industrial growth also affected some of the largest metros, whose economies in other areas, such as business services, often depend on customers from the industrial sector. Economist Hank Robison, co-founder of the forecasting firm EMSI, points out that manufacturing jobs — along with those in the information sector — are unique in creating high levels of value and jobs across other sectors in the economy.  They constitute a foundation upon which other sectors, like retail and government, depend on.

    Take the case of Milwaukee. The Wisconsin city rode a nearly 3% boost in industrial employment to increase its ranking among the best large metros for jobs: It rose from a near-bottom No. 49 (out of 65) to a healthy No. 23. As manufacturing employment surged, others sectors, notably business services, warehousing and hospitality, showed solid increases after years of slow or even negative growth.

    Milwaukee’s growth reflects some of the greater trends affecting the industrial sector, whose overall income is up 21% since mid-2009.  The Fed’s monetary policy, combined with deficit-related concerns, has certainly helped by depressing the value of the dollar, keeping American prices more competitive with foreign producers. Low prices have helped U.S. industrial exporters gain sales, much as it has boosted agricultural commodity producers to sell their goods to growing countries like China, India and Brazil. Exports now account for 12.8% of all U.S. output, the largest percentage since the Commerce Department starting tracking in 1929.

    These new markets are particularly strategic to regions like Milwaukee and other parts of the Great Lakes. Despite the industry’s massive shrinkage of the past decade, these areas retain significant specialized skills in fields like machine tools, automotive parts and temperature controls, which are all in demand in the developing world as well as at locally based firms, many of which are enjoying high profits. Allen-Edmunds, a high-end shoe maker based in the region, has seen export business surge.

    Similarly Peoria, Ill., has benefited from a boom in overseas orders for heavy equipment from Caterpillar, its dominant industrial company. Caterpillar sells the kind of heavy moving and mining machinery now in great demand, particularly in developing countries.

    One big driver of industrial growth has come from the source of so much pain in the past: the auto industry. Although production remains 25% below its 2007 peak, the industry, which accounts for roughly one-fifth of the nation’s industrial output, is on the rebound.  Ford Motor is achieving its best profits in over a decade, and both Chrysler and General Motors are officially in the black.

    Long-depressed industry center Warren-Troy-Farmington Hills, Mich., topped our list of manufacturing job-creators, with an impressive 8.2% increase. Second place went to the Detroit-Livonia-Dearborn area, which experienced 3.5% growth. Of course this recent expansion hardly makes up for decades of decline — auto industry employment, for example, is still down over 34% from its 2005 peak. But industrial expansion has clearly improved job prospects across the board; over the past year, for example, Warren experienced healthy growth in its information, business services and wholesale trade sectors.

    Of course, not all the big gainers in the industrial sphere are located in Great Lakes. The movement of manufacturing to other parts of the country, particularly to Texas and the Southeast means a better industrial climate helps those regions as well.  The list of fastest-growing industrial areas among our big metros includes San Antonio, Texas (No. 3); Atlanta (No. 7); Oklahoma City (No. 8) and Austin-Roundrock, Texas (No. 10) — all of which did very well in our overall jobs survey. Many of these areas are business-friendly, have low housing costs, reasonable taxation and business-friendly regulatory environments that induce industrial expansions.

    Another contributing factor to industrial growth in places like Austin is high-tech manufacturing. Covering everything from servers to specialized production equipments, the expansion of this sector accounts for a healthy 1.7% upturn in San Jose, No. 6 among our large metro regions, a welcome turnaround for an area that shed some 17% of its industrial jobs over the past decade.

    But some of the best progress took place in smaller communities spread across the country. Take Yakima, Wash., which came out first on our manufacturing job growth list with a heady 19% growth in industrial jobs.  Metal fabrication plants companies such as Canam Steel have led the way, with some of the new demand coming from Canadian sources.

    Other strong performers included Midland, Texas, which ranked sixth in our industrial rankings — fifth  among the smaller cities. Here an expanding oil and gas sector has sparked a strong revival not only in manufacturing but also in business services and finance.

    If manufacturing growth has become a new shaper of overall job growth, some regions may need to move beyond the post-industrial mindset that dominates so much of regional e development orthodoxy. Take the coastal areas in California: Los Angeles-Long Beach, which has the nation’s largest industrial base and high unemployment, continues to lose manufacturing jobs – over 28% gone over the past decade — in part due to strict regulatory controls and a basic inattention to this sector by government officials.

    In contrast, some hard-hit economic regions like Modesto, in California’s Central Valley, have promoted industrial growth. Last year, a nearly 14% increase in manufacturing jobs — much of it food related — helped the area gain some 92 places on our survey . They have not exactly won a gold medal, but certainly the improvement amount to  more than chopped liver.

    To be sure, cities can grow without robust manufacturing. Take financial centers like New York, university towns or Washington, D.C., where paper-pushing remains the core competency. But for many areas, particularly those beyond the urban “glamour zone,” getting down and dirty at the factory represents a solid economic strategy. In fact, it may be one of the best way to nurture your region back to health.

    Top Cities for Manufacturing Job Growth, 2009-2010
    Yakima, WA 19.0%
    Sebastian-Vero Beach, FL 17.4%
    Palm Coast, FL 16.7%
    Anderson, IN 14.3%
    Youngstown-Warren-Boardman, OH-PA 13.2%
    Midland, TX 13.0%
    Modesto, CA 12.0%
    Yuma, AZ 9.8%
    Lansing-East Lansing, MI 9.3%
    Elkhart-Goshen, IN 9.3%
    Top Big Cities for Manufacturing Job Growth, 2009-2010
    Warren-Troy-Farmington Hills, MI 8.2%
    Detroit-Livonia-Dearborn, MI  3.5%
    San Antonio-New Braunfels, TX 3.2%
    Milwaukee-Waukesha-West Allis, WI 2.9%
    Louisville-Jefferson County, KY-IN 2.0%
    San Jose-Sunnyvale-Santa Clara, CA 1.7%
    Atlanta-Sandy Springs-Marietta, GA 1.7%
    Oklahoma City, OK 1.6%
    Pittsburgh, PA 1.6%
    Austin-Round Rock-San Marcos, TX 1.5%

    This piece originally appeared in Forbes.com

    Joel Kotkin is executive editor of NewGeography.com and is a distinguished presidential fellow in urban futures at Chapman University, and an adjunct fellow of the Legatum Institute in London. He is author of The City: A Global History. His newest book is The Next Hundred Million: America in 2050, released in February, 2010.

    Photo by bobengland

  • The Best Cities for Jobs 2011

    These may be far from the best of times, but they are no longer the worst. Last year’s annual “Best Cities for Jobs” list was by far the most dismal since we began compiling our rankings almost five years ago. Between 2009 and 2010, only 13 of 397 metropolitan areas experienced any growth at all. For this year’s list, which measured job growth in the period between January 2010 and January 2011, most of the best-performing areas experienced actual employment increases — even if they were modest.

    For Forbes’ list of the best cities for jobs, we ranked all 398 current metropolitan statistical areas, based on employment data from the Bureau of Labor Statistics reported from November 1999 to January 2011. Rankings are based on recent growth trends, mid-term growth and long-term growth and momentum. We also broke down rankings by size — small, medium and large — since regional economies differ markedly due to their scale.

    Reflecting the importance of the war effort in stimulating local economies, command of this year’s best place for jobs was handed to the Army from the Marines. Killeen-Temple-Fort Hood, Texas, shot up to No. 1 from No. 4, while Jacksonville, N.C., last year’s first-place winner and home to Camp Lejeune, dropped to 19th place.

    Read about how we selected the 2011 Best Cities for Job Growth

    Once again the best places for jobs tended to be smaller communities where incremental improvements can have a relatively large impact. Eighteen of the top 20 cities on our list were either small (under 150,000 nonfarm jobs) or mid-sized areas (less than 450,000 jobs).

    But no place displayed more vibrancy than Texas. The Lone Star State dominated the three size categories, with the No. 1 mid-sized city, El Paso (No. 3 overall, up 22 places from last year) and No.1 large metropolitan area Austin (No. 6 overall), joining Killeen-Temple-Fort Hood (the No. 1 small city) atop their respective lists.

    Texas also produced three other of the top 10 smallest regions, including energy-dominated No. 4 Midland, which gained 41 places overall, and No. 10 Odessa, whose economy jumped a remarkable 57 places. It also added two other mid-size cities to its belt: No. 2 Corpus Christi and No. 4 McAllen-Edinburgh-Mission.

    Whatever they are drinking in Texas, other states may want to imbibe. California–which boasted zero regions in the top 150–is a prime example. Indeed, a group of California officials, led by Lt. Gov. Gavin Newsom, recently trekked to the Lone Star State to learn possible lessons about what drives job creation. Gov. Jerry Brown and others in California’s hierarchy may not be ready to listen, despite the fact that the city Brown formerly ran, Oakland, ranked absolute last, No. 65, among the big metros in our survey, two places behind perennial also-ran No. 63 Detroit-Livonia-Dearborn, Mich.

    One lesson that green-centric California may have trouble learning is that, however attractive the long-term promise of alternative energy, fossil fuels pay the bills and create strong economies, at least for now. Even outside of Texas, oil capitals did well across the board, not surprising given the surging price of gas. Our No. 2 small metro, Bismarck, N.D., which also No. 2 overall, is the emerging capital of the expanding Dakota energy belt. Also faring well are Alaska’s two oil-fire cities, Fairbanks (No. 10 on our small list) and Anchorage (No. 3 on the medium-sized list).

    There were some intriguing surprises as well. Most welcome are signs of revival from New Orleans-Metarie, La., which moved up a stunning 46 places to capture the No. 2 slot among our large metros. The region lost 11% of its population and nearly 16% of its jobs during the last decade. But now the Big Easy seems to be finding its place again among America’s great cities. Jobs, up 3.5% since 2006, have been created by rebuilding, a resurgence of tourism and a growing immigrant population – the region’s Hispanic population grew by 35,000 over the past decade.

    There were other inspirational improvements this year. Sparked by a revival in manufacturing, a host of former sad sacks in parts of the Midwest are showing signs of definite improvement. Niles-Benton Harbor, Mich., a long-time denizen at the bottom of our list, shot up a remarkable 242 places this year to a respectable No. 121. Another old industrial city, Kokomo, Ind., ascended 177 places to No. 215, while Holland-Grand Haven, Mich. improved by 172 places to No. 221 and Grand Rapids, Mich., rose 167 places to No. 183. Milwaukee, a long-time loser among our largest metros, moved up by a healthy 163 places overall to a better-than-average No. 143.

    The Northeast Corridor has also made strong progress. Here the likely explanation can be found in the fruits of Obamanomics. The stimulus has been particularly good for the vibrant economies surrounding the ever-expanding federal leviathan. Among the large metros, Washington-Arlington-Alexandria, Va., did best of all the cities outside the South, repeating its No. 6 ranking among large metro areas. Right behind, at No. 7 on the large city list, sits the primarily suburban Northern Virginia metro area, while Bethesda-Rockville-Frederick, Md., ranks 12th.

    The other big East Coast winners are the financial and university-oriented economies, which have reaped huge benefits from the TARP bailout and the Obama Administration’s college-centric stimulus plan. After the Texas cities and the imperial center, most of the best performing big metros are located in financial and university centers, including No. 9 New York City, No. 10 Philadelphia, No. 11 Pittsburgh, No. 13 Boston and No. 15 Raleigh-Cary, N.C.

    So who’s losing? Outside of Oakland and the big Southern California metros — including No. 60 Los Angeles, No. 59 Sacramento, No. 58 Riverside-San Bernardino and No. 50 Santa Ana-Anaheim- Irvine — the bottom tier consisted of a motley crew of mid-South cities like Memphis (#64 on the big city list) and still-struggling, former big Sunbelt boomtowns Las Vegas (No. 62), West Palm Beach-Boynton Beach-Boca Raton, Fla. (No. 56), Ft. Lauderdale-Pompano Beach-Boynton Beach, Fla. (No. 54), Phoenix-Mesa-Glendale, Ariz. (No. 53), Atlanta-Sandy Springs-Marietta Ga. (No. 52) and Tampa-St. Petersburg-Clearwater, Fla. (No. 51).

    For the most part, these areas rose with the housing bubble and will not fully recover until the economy diversifies beyond real estate speculation. Already some of the bubble victims are showing signs of life, including No. 155 Merced, Calif., up 134 places, and No. 167 Orlando, Fla., which rode a revived interest in tourism to jump 89 places since last year.

    While energy, America’s three wars, the recovering financial markets and real estate problems have played the lead role in setting the stage for the best places to do business, the Intermountain West has shown resilience with Salt Lake City, at No. 20 among large cities; Provo-Orem, Utah, Ogden-Clearfield, Utah, and Boulder, Colo. at Nos. 10, 25 and 26, respectively, among mid-sized cities; and Logan, Utah, and Fort Collins, Colo. at Nos. 9 and 38 among small cities.

    As America struggles with a weak economic recovery, opportunities abound across the geography of the states—even in places where it seems bleakest like California, Nevada and Florida. If old industrial areas can stage the glimmers of a comeback, along with over-taxed and over-regulated Gotham, and greater New Orleans can rise from the near dead, these areas, with generally newer infrastructure and attractive climates, might be next to experience a resurgence of their own.

    Read about how we selected the 2011 Best Cities for Job Growth

    This piece originally appeared in Forbes.com

    Joel Kotkin is executive editor of NewGeography.com and is a distinguished presidential fellow in urban futures at Chapman University, and an adjunct fellow of the Legatum Institute in London. He is author of The City: A Global History. His newest book is The Next Hundred Million: America in 2050, released in February, 2010.

    Michael Shires, Ph.D. is a professor at Pepperdine University School of Public Policy.

    Photo by Bas Lammers

  • 2011 How We Pick the Best Cities For Job Growth

    The methodology for the 2011 rankings largely corresponds to that used last year, which emphasizes the robustness of a region’s growth both recently and over time. It allows the rankings to include all of the metropolitan statistical areas (MSAs) for which the Bureau of Labor Statistics reports monthly employment data. They are derived from three-month rolling averages of U.S. Bureau of Labor Statistics “state and area” unadjusted employment data reported from November 1999 to January 2011.

    “Large” areas include those with a current nonfarm employment base of at least 450,000 jobs. “Midsize” areas range from 150,000 to 450,000 jobs. “Small” areas have as many as 150,000 jobs. This year’s rankings reflect the current size of each MSA’s employment, unlike last year when some were “held over” in size categories to facilitate comparisons.

    This year’s rankings use four measures of growth to rank all areas for which full data sets were available from the past 10 years. Because of the expanded availability of data since last year, we were able to include another small MSA (Manhattan, KS) in this year’s rankings for a total of 398 regions. Generally, this year’s rankings can be directly compared to the 2010 rankings for MSAs for the large and midsize categories, although there are eight MSAs that are reported in the Small size category that were Medium last year and one (Honolulu, HI) that was large that is now reported as medium-sized. In instances where the analysis refers to changes in ranking order, these adjustments are made accordingly, reporting the changes in ranking as if they had been categorized in their current category last year.

    The index is calculated from a normalized, weighted summary of: 1) recent growth trend: the current and prior year’s employment growth rates, with the current year emphasized (two points); 2) mid-term growth: the average annual 2005-2010 growth rate (two points); 3) long-term trend and momentum: the sum of the 2005-2010 and 1999-2004 employment growth rates multiplied by the ratio of the 1999-2004 growth rate over the 2005-2010 growth rate (two points); and 4) current year growth (one point).

    The data reflect the North American Industry Classification System categories, including total nonfarm employment, manufacturing, financial services, business and professional services, educational and health services, information, retail and wholesale trade, transportation and utilities, leisure and hospitality, and government.

  • Midsized Cities Rankings – 2011 Best Cities for Job Growth

    Read about how we selected the 2011 Best Cities for Job Growth

    2011 Size Ranking
    Area
    2011 Weighted INDEX
    2010 Nonfarm Empl (1000s)
    2010 Size Rank
    Size Movement from 2010
    1
    El Paso, TX
    92.5
    281.2
    5
    4
    2
    Corpus Christi, TX
    82.5
    179.1
    7
    5
    3
    Anchorage, AK
    79.8
    170.7
    3
    0
    4
    McAllen-Edinburg-Mission, TX
    78.7
    223.4
    6
    2
    5
    Fayetteville-Springdale-Rogers, AR-MO
    71.4
    201.9
    13
    8
    6
    Little Rock-North Little Rock-Conway, AR
    68.3
    338.8
    15
    9
    7
    Shreveport-Bossier City, LA
    67.5
    176.7
    12
    5
    8
    Charleston-North Charleston-Summerville, SC
    67.1
    283.8
    25
    17
    9
    Knoxville, TN
    66.5
    325.5
    43
    34
    10
    Provo-Orem, UT
    65.9
    180.3
    30
    20
    11
    Lincoln, NE
    65.3
    171.5
    10
    -1
    12
    Lexington-Fayette, KY
    64.8
    247.5
    14
    2
    13
    Honolulu, HI
    64.7
    441.2
    3
    14
    York-Hanover, PA
    64.6
    176.0
    46
    32
    15
    Madison, WI
    64.5
    344.7
    33
    18
    16
    Green Bay, WI
    63.5
    165.7
    56
    40
    17
    Huntsville, AL
    63.4
    207.7
    4
    -13
    18
    Beaumont-Port Arthur, TX
    63.3
    159.7
    38
    20
    19
    Lansing-East Lansing, MI
    62.5
    219.2
    68
    49
    20
    Allentown-Bethlehem-Easton, PA-NJ
    62.1
    333.6
    26
    6
    21
    Ann Arbor, MI
    62.0
    198.0
    50
    29
    22
    Durham-Chapel Hill, NC
    60.8
    280.6
    1
    -21
    23
    Worcester, MA-CT NECTA
    60.3
    240.7
    59
    36
    24
    Scranton–Wilkes-Barre, PA
    59.3
    254.2
    28
    4
    25
    Ogden-Clearfield, UT
    59.2
    191.2
    19
    -6
    26
    Boulder, CO
    59.1
    159.5
    35
    9
    27
    Peoria, IL
    59.0
    178.8
    65
    38
    28
    Portland-South Portland-Biddeford, ME NECTA
    58.8
    187.8
    41
    13
    29
    Reading, PA
    58.4
    167.6
    55
    26
    30
    Poughkeepsie-Newburgh-Middletown, NY
    57.8
    248.1
    29
    -1
    31
    Asheville, NC
    57.6
    167.2
    60
    29
    32
    Springfield, MO
    57.5
    191.2
    24
    -8
    33
    Mobile, AL
    56.4
    175.0
    63
    30
    34
    Trenton-Ewing, NJ
    56.1
    237.0
    11
    -23
    35
    Pensacola-Ferry Pass-Brent, FL
    56.0
    158.2
    45
    10
    36
    Syracuse, NY
    55.8
    314.7
    18
    -18
    37
    Evansville, IN-KY
    55.5
    172.8
    57
    20
    38
    Des Moines-West Des Moines, IA
    55.3
    313.5
    9
    -29
    39
    Augusta-Richmond County, GA-SC
    55.1
    209.5
    22
    -17
    40
    Grand Rapids-Wyoming, MI
    54.7
    366.9
    86
    46
    41
    Jackson, MS
    52.7
    250.9
    27
    -14
    42
    Lancaster, PA
    52.6
    226.7
    62
    20
    43
    Bakersfield-Delano, CA
    51.6
    225.5
    36
    -7
    44
    Bridgeport-Stamford-Norwalk, CT NECTA
    51.3
    398.7
    54
    10
    45
    Baton Rouge, LA
    51.0
    363.5
    2
    -43
    46
    Tallahassee, FL
    50.5
    170.1
    16
    -30
    47
    Chattanooga, TN-GA
    50.1
    230.7
    82
    35
    48
    Harrisburg-Carlisle, PA
    49.8
    317.1
    21
    -27
    49
    Calvert-Charles-Prince George’s, MD
    49.4
    377.4
    48
    -1
    50
    Framingham, MA NECTA Division
    49.2
    153.3
    53
    3
    51
    New Haven, CT NECTA
    47.6
    266.4
    44
    -7
    52
    Tacoma, WA Metropolitan Division
    47.6
    264.5
    39
    -13
    53
    Springfield, MA-CT NECTA
    47.6
    285.4
    77
    24
    54
    Greenville-Mauldin-Easley, SC
    47.6
    296.2
    74
    20
    55
    Tulsa, OK
    47.6
    408.0
    37
    -18
    56
    Davenport-Moline-Rock Island, IA-IL
    47.3
    179.0
    69
    13
    57
    Kansas City, KS
    45.2
    421.2
    32
    -25
    58
    Colorado Springs, CO
    45.1
    245.1
    49
    -9
    59
    Albany-Schenectady-Troy, NY
    44.8
    433.1
    17
    -42
    60
    Baltimore City, MD
    42.3
    349.1
    73
    13
    61
    Spokane, WA
    42.1
    204.7
    31
    -30
    62
    Columbia, SC
    39.1
    342.0
    42
    -20
    63
    Toledo, OH
    39.1
    299.9
    95
    32
    64
    Albuquerque, NM
    39.1
    370.5
    20
    -44
    65
    Oxnard-Thousand Oaks-Ventura, CA
    38.3
    274.0
    80
    15
    66
    Wichita, KS
    37.8
    283.5
    64
    -2
    67
    Akron, OH
    36.4
    318.9
    87
    20
    68
    Fort Wayne, IN
    35.5
    201.2
    79
    11
    69
    Lake County-Kenosha County, IL-WI Metropolitan Division
    35.3
    371.2
    71
    2
    70
    Santa Barbara-Santa Maria-Goleta, CA
    34.9
    161.2
    66
    -4
    71
    Boise City-Nampa, ID
    34.3
    250.0
    61
    -10
    72
    Fresno, CA
    34.2
    279.6
    67
    -5
    73
    Roanoke, VA
    33.6
    153.6
    51
    -22
    74
    Youngstown-Warren-Boardman, OH-PA
    32.4
    220.5
    93
    19
    75
    Lakeland-Winter Haven, FL
    31.5
    194.5
    70
    -5
    76
    Gary, IN Metropolitan Division
    30.7
    262.2
    76
    0
    77
    Tucson, AZ
    29.9
    354.1
    58
    -19
    78
    Dayton, OH
    29.4
    370.8
    90
    12
    79
    Canton-Massillon, OH
    29.3
    159.2
    94
    15
    80
    Montgomery, AL
    29.3
    166.7
    52
    -28
    81
    Palm Bay-Melbourne-Titusville, FL
    24.4
    192.0
    75
    -6
    82
    North Port-Bradenton-Sarasota, FL
    24.0
    239.9
    89
    7
    83
    Santa Rosa-Petaluma, CA
    23.9
    170.3
    88
    5
    84
    Winston-Salem, NC
    23.6
    203.4
    47
    -37
    85
    Deltona-Daytona Beach-Ormond Beach, FL
    22.9
    153.4
    83
    -2
    86
    Stockton, CA
    21.8
    187.7
    78
    -8
    87
    Wilmington, DE-MD-NJ Metropolitan Division
    21.3
    328.1
    72
    -15
    88
    Reno-Sparks, NV
    20.1
    189.8
    92
    4
    89
    Cape Coral-Fort Myers, FL
    17.2
    194.9
    91
    2
    90
    Greensboro-High Point, NC
    15.0
    337.5
    85
    -5
  • All Cities Rankings – 2011 Best Cities for Job Growth

    Read about how we selected the 2011 Best Cities for Job Growth

    2011 Overall Ranking
    Area
    2011 Weighted INDEX
     

    2010 Nonfarm Empl (1000s) 
    Overall Rank 2010
    Overal Movement
    1
    Killeen-Temple-Fort Hood, TX
    93.8
    129.0
    4
    3
    2
    Bismarck, ND
    92.8
    63.0
    2
    0
    3
    El Paso, TX
    92.5
    281.2
    25
    22
    4
    College Station-Bryan, TX
    92.3
    98.5
    3
    -1
    5
    Midland, TX
    90.8
    69.2
    62
    57
    6
    Austin-Round Rock-San Marcos, TX
    89.1
    769.3
    9
    3
    7
    New Orleans-Metairie-Kenner, LA
    88.9
    522.6
    294
    287
    8
    Dubuque, IA
    88.6
    56.6
    93
    85
    9
    Manhattan, KS
    88.3
    57.0
    10
    Pascagoula, MS
    85.4
    58.7
    30
    20
    11
    Odessa, TX
    84.1
    61.8
    87
    76
    12
    Corpus Christi, TX
    82.5
    179.1
    38
    26
    13
    Logan, UT-ID
    82.2
    54.4
    110
    97
    14
    Houston-Sugar Land-Baytown, TX
    82.1
    2552.3
    21
    7
    15
    Fairbanks, AK
    81.0
    37.7
    42
    27
    16
    Elizabethtown, KY
    81.0
    47.6
    103
    87
    17
    San Antonio-New Braunfels, TX
    80.7
    841.3
    12
    -5
    18
    Dallas-Plano-Irving, TX Metropolitan Division
    80.6
    2043.4
    44
    26
    19
    Jacksonville, NC
    80.5
    47.2
    1
    -18
    20
    Lawton, OK
    80.5
    44.0
    7
    -13
    21
    Lebanon, PA
    80.5
    50.1
    106
    85
    22
    Anchorage, AK
    79.8
    170.7
    18
    -4
    23
    Longview, TX
    79.4
    97.0
    140
    117
    24
    Joplin, MO
    79.1
    79.8
    105
    81
    25
    Kennewick-Pasco-Richland, WA
    79.0
    99.2
    16
    -9
    26
    Gulfport-Biloxi, MS
    78.9
    105.3
    192
    166
    27
    McAllen-Edinburg-Mission, TX
    78.7
    223.4
    28
    1
    28
    Brownsville-Harlingen, TX
    77.9
    127.2
    31
    3
    29
    Columbia, MO
    77.2
    93.4
    32
    3
    30
    Auburn-Opelika, AL
    77.0
    53.3
    79
    49
    31
    Clarksville, TN-KY
    76.6
    83.4
    124
    93
    32
    San Angelo, TX
    76.4
    44.9
    85
    53
    33
    Morgantown, WV
    76.4
    65.4
    17
    -16
    34
    Wheeling, WV-OH
    76.2
    67.9
    81
    47
    35
    Ithaca, NY
    76.1
    65.6
    24
    -11
    36
    Jonesboro, AR
    75.9
    49.2
    43
    7
    37
    Springfield, IL
    74.6
    111.7
    59
    22
    38
    Fargo, ND-MN
    74.6
    122.4
    8
    -30
    39
    Grand Forks, ND-MN
    74.4
    54.0
    37
    -2
    40
    Corvallis, OR
    74.2
    38.1
    274
    234
    41
    Washington-Arlington-Alexandria, DC-VA-MD-WV Metropolitan Division
    74.1
    2412.6
    47
    6
    42
    Cumberland, MD-WV
    73.8
    39.9
    128
    86
    43
    Northern Virginia, VA
    73.8
    1306.5
    35
    -8
    44
    Oshkosh-Neenah, WI
    73.5
    92.7
    145
    101
    45
    Portsmouth, NH-ME NECTA
    73.5
    53.7
    60
    15
    46
    Warner Robins, GA
    73.3
    59.7
    26
    -20
    47
    Wenatchee-East Wenatchee, WA
    73.2
    38.6
    36
    -11
    48
    Nashville-Davidson–Murfreesboro–Franklin, TN
    73.1
    742.9
    217
    169
    49
    Waco, TX
    73.0
    105.8
    41
    -8
    50
    Fort Collins-Loveland, CO
    72.9
    133.6
    68
    18
    51
    Myrtle Beach-North Myrtle Beach-Conway, SC
    72.7
    110.8
    199
    148
    52
    New York City, NY
    72.6
    3731.4
    89
    37
    53
    Harrisonburg, VA
    72.6
    62.7
    69
    16
    54
    Iowa City, IA
    72.6
    90.5
    27
    -27
    55
    Haverhill-North Andover-Amesbury, MA-NH  NECTA Division
    72.3
    76.5
    65
    10
    56
    Las Cruces, NM
    72.3
    69.1
    33
    -23
    57
    Johnstown, PA
    71.9
    60.7
    129
    72
    58
    Philadelphia City, PA
    71.9
    661.8
    112
    54
    59
    Texarkana, TX-Texarkana, AR
    71.9
    56.9
    76
    17
    60
    Eau Claire, WI
    71.7
    80.4
    181
    121
    61
    Pittsburgh, PA
    71.7
    1129.8
    111
    50
    62
    Bowling Green, KY
    71.6
    59.7
    260
    198
    63
    Fayetteville-Springdale-Rogers, AR-MO
    71.4
    201.9
    75
    12
    64
    Great Falls, MT
    71.3
    35.6
    22
    -42
    65
    State College, PA
    71.2
    74.4
    29
    -36
    66
    Yakima, WA
    71.2
    76.5
    11
    -55
    67
    Hinesville-Fort Stewart, GA
    71.1
    19.5
    20
    -47
    68
    Gainesville, GA
    71.1
    72.8
    241
    173
    69
    Burlington-South Burlington, VT NECTA
    70.7
    113.1
    193
    124
    70
    Bethesda-Rockville-Frederick, MD Metropolitan Division
    70.7
    565.3
    114
    44
    71
    Boston-Cambridge-Quincy, MA NECTA Division
    70.4
    1679.0
    133
    62
    72
    St. Cloud, MN
    69.9
    99.0
    74
    2
    73
    Williamsport, PA
    69.8
    52.6
    203
    130
    74
    Laredo, TX
    69.7
    88.4
    95
    21
    75
    New Bedford, MA NECTA
    69.4
    64.9
    137
    62
    76
    Brockton-Bridgewater-Easton, MA  NECTA Division
    69.3
    87.7
    200
    124
    77
    Glens Falls, NY
    69.1
    53.0
    50
    -27
    78
    Sandusky, OH
    68.9
    35.5
    206
    128
    79
    Ocean City, NJ
    68.6
    36.3
    131
    52
    80
    Hattiesburg, MS
    68.6
    59.3
    14
    -66
    81
    Cedar Rapids, IA
    68.6
    137.5
    48
    -33
    82
    Little Rock-North Little Rock-Conway, AR
    68.3
    338.8
    92
    10
    83
    Raleigh-Cary, NC
    67.8
    500.0
    54
    -29
    84
    Fort Worth-Arlington, TX Metropolitan Division
    67.8
    850.0
    49
    -35
    85
    Tyler, TX
    67.7
    93.3
    67
    -18
    86
    Shreveport-Bossier City, LA
    67.5
    176.7
    73
    -13
    87
    Houma-Bayou Cane-Thibodaux, LA
    67.3
    94.1
    98
    11
    88
    Owensboro, KY
    67.3
    49.8
    149
    61
    89
    Amarillo, TX
    67.2
    110.8
    56
    -33
    90
    Charleston-North Charleston-Summerville, SC
    67.1
    283.8
    136
    46
    91
    Elmira, NY
    67.1
    40.1
    219
    128
    92
    Rochester, NY
    66.7
    506.9
    122
    30
    93
    Altoona, PA
    66.7
    60.5
    118
    25
    94
    Knoxville, TN
    66.5
    325.5
    187
    93
    95
    Barnstable Town, MA NECTA
    66.4
    92.2
    113
    18
    96
    Sioux Falls, SD
    66.3
    133.0
    51
    -45
    97
    Rapid City, SD
    65.9
    59.3
    55
    -42
    98
    Provo-Orem, UT
    65.9
    180.3
    148
    50
    99
    Pueblo, CO
    65.7
    57.1
    34
    -65
    100
    Nassau-Suffolk, NY Metropolitan Division
    65.5
    1232.2
    120
    20
    101
    Lincoln, NE
    65.3
    171.5
    66
    -35
    102
    Lubbock, TX
    65.1
    129.5
    39
    -63
    103
    Lexington-Fayette, KY
    64.8
    247.5
    90
    -13
    104
    Buffalo-Niagara Falls, NY
    64.7
    541.0
    135
    31
    105
    Honolulu, HI
    64.7
    441.2
    141
    36
    106
    York-Hanover, PA
    64.6
    176.0
    201
    95
    107
    Madison, WI
    64.5
    344.7
    152
    45
    108
    Columbus, OH
    64.3
    912.1
    194
    86
    109
    Dover, DE
    64.3
    63.4
    171
    62
    110
    Salt Lake City, UT
    64.2
    613.9
    107
    -3
    111
    Flagstaff, AZ
    63.6
    61.5
    100
    -11
    112
    Green Bay, WI
    63.5
    165.7
    229
    117
    113
    Huntsville, AL
    63.4
    207.7
    19
    -94
    114
    Ames, IA
    63.3
    47.5
    97
    -17
    115
    Beaumont-Port Arthur, TX
    63.3
    159.7
    168
    53
    116
    Charlottesville, VA
    63.2
    98.7
    84
    -32
    117
    Appleton, WI
    63.2
    116.0
    210
    93
    118
    Omaha-Council Bluffs, NE-IA
    63.1
    456.9
    80
    -38
    119
    Jefferson City, MO
    63.0
    77.7
    83
    -36
    120
    Pittsfield, MA NECTA
    62.8
    35.4
    282
    162
    121
    Niles-Benton Harbor, MI
    62.7
    60.3
    363
    242
    122
    Greenville, NC
    62.5
    75.0
    52
    -70
    123
    Lansing-East Lansing, MI
    62.5
    219.2
    278
    155
    124
    Oklahoma City, OK
    62.4
    559.6
    104
    -20
    125
    Allentown-Bethlehem-Easton, PA-NJ
    62.1
    333.6
    142
    17
    126
    Waterloo-Cedar Falls, IA
    62.0
    88.6
    88
    -38
    127
    Kankakee-Bradley, IL
    62.0
    42.9
    40
    -87
    128
    Ann Arbor, MI
    62.0
    198.0
    209
    81
    129
    Springfield, OH
    61.8
    49.9
    254
    125
    130
    Erie, PA
    61.7
    128.5
    302
    172
    131
    Florence-Muscle Shoals, AL
    61.7
    54.8
    78
    -53
    132
    Athens-Clarke County, GA
    61.6
    81.0
    94
    -38
    133
    Palm Coast, FL
    61.5
    18.2
    175
    42
    134
    Tuscaloosa, AL
    60.9
    94.1
    126
    -8
    135
    Bloomington, IN
    60.9
    82.6
    13
    -122
    136
    Durham-Chapel Hill, NC
    60.8
    280.6
    10
    -126
    137
    Billings, MT
    60.8
    78.4
    61
    -76
    138
    Rochester-Dover, NH-ME NECTA
    60.6
    55.9
    178
    40
    139
    Winchester, VA-WV
    60.4
    54.4
    245
    106
    140
    Victoria, TX
    60.4
    49.2
    226
    86
    141
    Worcester, MA-CT NECTA
    60.3
    240.7
    239
    98
    142
    Bloomington-Normal, IL
    60.2
    90.3
    86
    -56
    143
    Milwaukee-Waukesha-West Allis, WI
    60.0
    814.8
    306
    163
    144
    Fayetteville, NC
    59.9
    128.2
    6
    -138
    145
    Cheyenne, WY
    59.8
    43.4
    45
    -100
    146
    Hot Springs, AR
    59.8
    37.1
    166
    20
    147
    Coeur d’Alene, ID
    59.5
    52.6
    109
    -38
    148
    Scranton–Wilkes-Barre, PA
    59.3
    254.2
    146
    -2
    149
    Ogden-Clearfield, UT
    59.2
    191.2
    116
    -33
    150
    Boulder, CO
    59.1
    159.5
    155
    5
    151
    Peoria, IL
    59.0
    178.8
    258
    107
    152
    Portland-South Portland-Biddeford, ME NECTA
    58.8
    187.8
    180
    28
    153
    Reading, PA
    58.4
    167.6
    228
    75
    154
    Johnson City, TN
    58.1
    78.4
    262
    108
    155
    Merced, CA
    58.0
    55.6
    289
    134
    156
    Poughkeepsie-Newburgh-Middletown, NY
    57.8
    248.1
    147
    -9
    157
    Lafayette, IN
    57.7
    93.2
    234
    77
    158
    Asheville, NC
    57.6
    167.2
    240
    82
    159
    St. Joseph, MO-KS
    57.6
    57.3
    5
    -154
    160
    Abilene, TX
    57.5
    65.2
    64
    -96
    161
    Springfield, MO
    57.5
    191.2
    130
    -31
    162
    Panama City-Lynn Haven-Panama City Beach, FL
    57.2
    70.7
    91
    -71
    163
    La Crosse, WI-MN
    57.2
    73.1
    162
    -1
    164
    Denver-Aurora-Broomfield, CO
    56.9
    1191.0
    182
    18
    165
    Mobile, AL
    56.4
    175.0
    247
    82
    166
    Lewiston-Auburn, ME NECTA
    56.3
    47.9
    189
    23
    167
    Orlando-Kissimmee-Sanford, FL
    56.3
    1010.7
    256
    89
    168
    Mankato-North Mankato, MN
    56.1
    52.1
    186
    18
    169
    Lafayette, LA
    56.1
    148.0
    46
    -123
    170
    Trenton-Ewing, NJ
    56.1
    237.0
    71
    -99
    171
    Pensacola-Ferry Pass-Brent, FL
    56.0
    158.2
    197
    26
    172
    Syracuse, NY
    55.8
    314.7
    115
    -57
    173
    Duluth, MN-WI
    55.7
    127.8
    220
    47
    174
    Alexandria, LA
    55.6
    64.0
    63
    -111
    175
    Hartford-West Hartford-East Hartford, CT NECTA
    55.5
    536.3
    132
    -43
    176
    Evansville, IN-KY
    55.5
    172.8
    231
    55
    177
    Utica-Rome, NY
    55.4
    129.7
    82
    -95
    178
    Des Moines-West Des Moines, IA
    55.3
    313.5
    53
    -125
    179
    Augusta-Richmond County, GA-SC
    55.1
    209.5
    125
    -54
    180
    Manchester, NH NECTA
    55.0
    97.5
    96
    -84
    181
    San Jose-Sunnyvale-Santa Clara, CA
    54.9
    859.7
    297
    116
    182
    Leominster-Fitchburg-Gardner, MA NECTA
    54.8
    48.5
    341
    159
    183
    Grand Rapids-Wyoming, MI
    54.7
    366.9
    350
    167
    184
    Sherman-Denison, TX
    54.6
    42.3
    165
    -19
    185
    Topeka, KS
    54.6
    107.9
    138
    -47
    186
    Casper, WY
    53.4
    38.3
    198
    12
    187
    Kingston, NY
    53.4
    60.7
    170
    -17
    188
    Indianapolis-Carmel, IN
    53.4
    870.5
    246
    58
    189
    Decatur, IL
    52.7
    52.6
    263
    74
    190
    Jackson, MS
    52.7
    250.9
    144
    -46
    191
    Lowell-Billerica-Chelmsford, MA-NH  NECTA Division
    52.7
    114.7
    233
    42
    192
    Lancaster, PA
    52.6
    226.7
    243
    51
    193
    Greeley, CO
    52.4
    77.9
    202
    9
    194
    Bakersfield-Delano, CA
    51.6
    225.5
    159
    -35
    195
    Putnam-Rockland-Westchester, NY
    51.4
    554.2
    238
    43
    196
    Bridgeport-Stamford-Norwalk, CT NECTA
    51.3
    398.7
    225
    29
    197
    Charleston, WV
    51.2
    147.1
    153
    -44
    198
    Baton Rouge, LA
    51.0
    363.5
    15
    -183
    199
    Columbus, GA-AL
    50.7
    117.2
    143
    -56
    200
    Savannah, GA
    50.6
    149.5
    176
    -24
    201
    Tallahassee, FL
    50.5
    170.1
    102
    -99
    202
    Rochester, MN
    50.2
    101.7
    72
    -130
    203
    Chattanooga, TN-GA
    50.1
    230.7
    331
    128
    204
    Charlotte-Gastonia-Rock Hill, NC-SC
    50.0
    803.4
    224
    20
    205
    Harrisburg-Carlisle, PA
    49.8
    317.1
    119
    -86
    206
    St. Louis, MO-IL
    49.7
    1291.0
    211
    5
    207
    Battle Creek, MI
    49.6
    56.0
    287
    80
    208
    Sioux City, IA-NE-SD
    49.5
    73.1
    99
    -109
    209
    Calvert-Charles-Prince George’s, MD
    49.4
    377.4
    205
    -4
    210
    Framingham, MA  NECTA Division
    49.2
    153.3
    221
    11
    211
    Seattle-Bellevue-Everett, WA Metropolitan Division
    49.2
    1378.0
    214
    3
    212
    Anderson, SC
    49.1
    60.0
    386
    174
    213
    Mount Vernon-Anacortes, WA
    48.9
    43.8
    281
    68
    214
    Wilmington, NC
    48.7
    135.2
    101
    -113
    215
    Kokomo, IN
    48.4
    41.1
    392
    177
    216
    Idaho Falls, ID
    48.3
    48.2
    154
    -62
    217
    Hanford-Corcoran, CA
    48.3
    35.2
    23
    -194
    218
    San Francisco-San Mateo-Redwood City, CA Metropolitan Division
    47.9
    936.1
    271
    53
    219
    Champaign-Urbana, IL
    47.7
    109.4
    185
    -34
    220
    Terre Haute, IN
    47.7
    70.9
    295
    75
    221
    Holland-Grand Haven, MI
    47.6
    104.6
    393
    172
    222
    New Haven, CT NECTA
    47.6
    266.4
    196
    -26
    223
    Tacoma, WA Metropolitan Division
    47.6
    264.5
    172
    -51
    224
    Springfield, MA-CT NECTA
    47.6
    285.4
    314
    90
    225
    Greenville-Mauldin-Easley, SC
    47.6
    296.2
    300
    75
    226
    Tulsa, OK
    47.6
    408.0
    161
    -65
    227
    Santa Fe, NM
    47.5
    60.4
    191
    -36
    228
    Binghamton, NY
    47.4
    109.5
    156
    -72
    229
    Davenport-Moline-Rock Island, IA-IL
    47.3
    179.0
    279
    50
    230
    Louisville-Jefferson County, KY-IN
    47.0
    590.7
    183
    -47
    231
    Spartanburg, SC
    46.8
    118.9
    366
    135
    232
    Grand Junction, CO
    46.7
    58.8
    235
    3
    233
    Portland-Vancouver-Hillsboro, OR-WA
    46.2
    969.9
    270
    37
    234
    Miami-Miami Beach-Kendall, FL Metropolitan Division
    46.2
    989.6
    292
    58
    235
    Columbus, IN
    46.2
    42.4
    315
    80
    236
    San Diego-Carlsbad-San Marcos, CA
    46.1
    1227.6
    299
    63
    237
    Lynchburg, VA
    46.1
    104.1
    158
    -79
    238
    Punta Gorda, FL
    45.9
    40.7
    301
    63
    239
    Chico, CA
    45.7
    70.2
    232
    -7
    240
    Cape Girardeau-Jackson, MO-IL
    45.4
    43.6
    57
    -183
    241
    Modesto, CA
    45.2
    145.6
    330
    89
    242
    Kansas City, KS
    45.2
    421.2
    151
    -91
    243
    Colorado Springs, CO
    45.1
    245.1
    208
    -35
    244
    Virginia Beach-Norfolk-Newport News, VA-NC
    45.0
    727.4
    174
    -70
    245
    Albany-Schenectady-Troy, NY
    44.8
    433.1
    108
    -137
    246
    Richmond, VA
    44.1
    598.6
    230
    -16
    247
    Peabody, MA  NECTA Division
    43.9
    98.5
    227
    -20
    248
    Hagerstown-Martinsburg, MD-WV
    43.8
    96.9
    252
    4
    249
    Edison-New Brunswick, NJ Metropolitan Division
    43.6
    974.0
    268
    19
    250
    Chicago-Joliet-Naperville, IL Metropolitan Division
    43.4
    3624.2
    312
    62
    251
    El Centro, CA
    43.2
    44.3
    134
    -117
    252
    Missoula, MT
    43.1
    54.4
    164
    -88
    253
    Jacksonville, FL
    43.1
    583.4
    259
    6
    254
    Bergen-Hudson-Passaic, NJ
    43.0
    868.7
    265
    11
    255
    Fort Smith, AR-OK
    42.9
    116.5
    257
    2
    256
    Providence-Fall River-Warwick, RI-MA NECTA
    42.9
    542.0
    336
    80
    257
    Gainesville, FL
    42.6
    127.7
    173
    -84
    258
    Elkhart-Goshen, IN
    42.6
    105.0
    395
    137
    259
    Baltimore City, MD
    42.3
    349.1
    298
    39
    260
    Sumter, SC
    42.3
    37.0
    385
    125
    261
    Spokane, WA
    42.1
    204.7
    150
    -111
    262
    Burlington, NC
    41.9
    55.8
    356
    94
    263
    Olympia, WA
    41.7
    96.6
    70
    -193
    264
    Danbury, CT NECTA
    41.6
    65.8
    355
    91
    265
    Kingsport-Bristol-Bristol, TN-VA
    41.6
    116.9
    304
    39
    266
    Decatur, AL
    41.6
    53.7
    338
    72
    267
    Lake Charles, LA
    40.8
    88.7
    207
    -60
    268
    Norwich-New London, CT-RI NECTA
    40.6
    128.8
    157
    -111
    269
    Salem, OR
    39.8
    142.0
    127
    -142
    270
    Lawrence, KS
    39.8
    49.9
    58
    -212
    271
    Bangor, ME NECTA
    39.5
    63.9
    121
    -150
    272
    Farmington, NM
    39.5
    48.3
    293
    21
    273
    Blacksburg-Christiansburg-Radford, VA
    39.4
    67.9
    167
    -106
    274
    Wichita Falls, TX
    39.3
    58.2
    326
    52
    275
    Salisbury, MD
    39.2
    52.2
    264
    -11
    276
    Columbia, SC
    39.1
    342.0
    184
    -92
    277
    Toledo, OH
    39.1
    299.9
    381
    104
    278
    Albuquerque, NM
    39.1
    370.5
    117
    -161
    279
    Macon, GA
    39.0
    95.9
    273
    -6
    280
    Madera-Chowchilla, CA
    38.9
    32.5
    77
    -203
    281
    Florence, SC
    38.8
    82.5
    288
    7
    282
    Saginaw-Saginaw Township North, MI
    38.7
    83.4
    311
    29
    283
    Oxnard-Thousand Oaks-Ventura, CA
    38.3
    274.0
    323
    40
    284
    Anderson, IN
    38.3
    40.4
    188
    -96
    285
    Cleveland, TN
    37.9
    39.2
    291
    6
    286
    Bremerton-Silverdale, WA
    37.9
    81.8
    123
    -163
    287
    Goldsboro, NC
    37.8
    42.3
    160
    -127
    288
    Wichita, KS
    37.8
    283.5
    250
    -38
    289
    Monroe, LA
    37.6
    75.4
    177
    -112
    290
    Kansas City, MO
    37.5
    536.2
    139
    -151
    291
    Gadsden, AL
    37.4
    35.7
    340
    49
    292
    Huntington-Ashland, WV-KY-OH
    37.3
    113.7
    163
    -129
    293
    Port St. Lucie, FL
    36.9
    120.7
    324
    31
    294
    Minneapolis-St. Paul-Bloomington, MN-WI
    36.8
    1688.1
    269
    -25
    295
    Valdosta, GA
    36.8
    52.3
    244
    -51
    296
    Racine, WI
    36.8
    74.8
    378
    82
    297
    Jackson, TN
    36.6
    57.9
    347
    50
    298
    Akron, OH
    36.4
    318.9
    358
    60
    299
    Danville, VA
    35.8
    39.7
    361
    62
    300
    Kalamazoo-Portage, MI
    35.7
    137.3
    310
    10
    301
    Camden, NJ Metropolitan Division
    35.6
    506.6
    216
    -85
    302
    Fond du Lac, WI
    35.5
    44.9
    373
    71
    303
    Fort Wayne, IN
    35.5
    201.2
    318
    15
    304
    Lake County-Kenosha County, IL-WI Metropolitan Division
    35.3
    371.2
    286
    -18
    305
    Lewiston, ID-WA
    35.1
    25.6
    190
    -115
    306
    Santa Barbara-Santa Maria-Goleta, CA
    34.9
    161.2
    275
    -31
    307
    Cleveland-Elyria-Mentor, OH
    34.7
    992.9
    349
    42
    308
    Rockford, IL
    34.5
    144.0
    383
    75
    309
    Boise City-Nampa, ID
    34.3
    250.0
    242
    -67
    310
    Fresno, CA
    34.2
    279.6
    277
    -33
    311
    Crestview-Fort Walton Beach-Destin, FL
    34.1
    76.2
    169
    -142
    312
    Nashua, NH-MA  NECTA Division
    33.9
    125.1
    253
    -59
    313
    Cincinnati-Middletown, OH-KY-IN
    33.9
    980.6
    248
    -65
    314
    Muncie, IN
    33.8
    49.3
    351
    37
    315
    Parkersburg-Marietta-Vienna, WV-OH
    33.7
    68.8
    195
    -120
    316
    Roanoke, VA
    33.6
    153.6
    212
    -104
    317
    Santa Ana-Anaheim-Irvine, CA Metropolitan Division
    32.5
    1359.6
    353
    36
    318
    Youngstown-Warren-Boardman, OH-PA
    32.4
    220.5
    374
    56
    319
    San Luis Obispo-Paso Robles, CA
    32.3
    95.9
    276
    -43
    320
    Visalia-Porterville, CA
    32.1
    104.8
    222
    -98
    321
    Medford, OR
    32.1
    75.3
    327
    6
    322
    Vallejo-Fairfield, CA
    31.7
    117.9
    303
    -19
    323
    Lakeland-Winter Haven, FL
    31.5
    194.5
    280
    -43
    324
    St. George, UT
    31.5
    45.6
    267
    -57
    325
    Rocky Mount, NC
    31.1
    60.6
    332
    7
    326
    Lima, OH
    30.8
    52.2
    348
    22
    327
    Tampa-St. Petersburg-Clearwater, FL
    30.7
    1117.4
    325
    -2
    328
    Gary, IN Metropolitan Division
    30.7
    262.2
    309
    -19
    329
    Atlanta-Sandy Springs-Marietta, GA
    30.5
    2247.7
    272
    -57
    330
    Waterbury, CT NECTA
    30.3
    62.7
    388
    58
    331
    Vineland-Millville-Bridgeton, NJ
    30.1
    58.2
    179
    -152
    332
    Tucson, AZ
    29.9
    354.1
    237
    -95
    333
    Bellingham, WA
    29.9
    77.7
    223
    -110
    334
    Bay City, MI
    29.7
    36.2
    344
    10
    335
    Salinas, CA
    29.6
    119.5
    251
    -84
    336
    Dayton, OH
    29.4
    370.8
    369
    33
    337
    Canton-Massillon, OH
    29.3
    159.2
    380
    43
    338
    Montgomery, AL
    29.3
    166.7
    218
    -120
    339
    Phoenix-Mesa-Glendale, AZ
    29.3
    1701.2
    320
    -19
    340
    Albany, GA
    29.2
    60.9
    213
    -127
    341
    Pocatello, ID
    28.7
    35.6
    249
    -92
    342
    Fort Lauderdale-Pompano Beach-Deerfield Beach, FL Metropolitan Division
    28.5
    705.4
    337
    -5
    343
    Newark-Union, NJ-PA Metropolitan Division
    27.7
    962.8
    283
    -60
    344
    Napa, CA
    27.6
    58.0
    266
    -78
    345
    South Bend-Mishawaka, IN-MI
    26.3
    132.3
    384
    39
    346
    West Palm Beach-Boca Raton-Boynton Beach, FL Metropolitan Division
    26.3
    503.0
    354
    8
    347
    Santa Cruz-Watsonville, CA
    26.2
    85.9
    305
    -42
    348
    Longview, WA
    26.1
    34.9
    284
    -64
    349
    Atlantic City-Hammonton, NJ
    25.9
    135.3
    329
    -20
    350
    Michigan City-La Porte, IN
    24.6
    42.4
    313
    -37
    351
    Palm Bay-Melbourne-Titusville, FL
    24.4
    192.0
    307
    -44
    352
    Anniston-Oxford, AL
    24.1
    48.7
    255
    -97
    353
    Redding, CA
    24.0
    57.0
    317
    -36
    354
    North Port-Bradenton-Sarasota, FL
    24.0
    239.9
    368
    14
    355
    Wausau, WI
    24.0
    67.0
    360
    5
    356
    Yuba City, CA
    23.9
    36.3
    261
    -95
    357
    Santa Rosa-Petaluma, CA
    23.9
    170.3
    365
    8
    358
    Winston-Salem, NC
    23.6
    203.4
    204
    -154
    359
    Deltona-Daytona Beach-Ormond Beach, FL
    22.9
    153.4
    334
    -25
    360
    Sheboygan, WI
    21.8
    58.3
    370
    10
    361
    Stockton, CA
    21.8
    187.7
    316
    -45
    362
    Riverside-San Bernardino-Ontario, CA
    21.7
    1112.1
    359
    -3
    363
    Bend, OR
    21.6
    59.6
    308
    -55
    364
    Wilmington, DE-MD-NJ Metropolitan Division
    21.3
    328.1
    290
    -74
    365
    Yuma, AZ
    21.2
    49.7
    346
    -19
    366
    Carson City, NV
    21.1
    28.8
    342
    -24
    367
    Sacramento–Arden-Arcade–Roseville, CA
    20.6
    799.5
    322
    -45
    368
    Brunswick, GA
    20.6
    40.4
    285
    -83
    369
    Warren-Troy-Farmington Hills, MI Metropolitan Division
    20.5
    1044.7
    397
    28
    370
    Naples-Marco Island, FL
    20.3
    110.7
    376
    6
    371
    Danville, IL
    20.2
    28.9
    296
    -75
    372
    Reno-Sparks, NV
    20.1
    189.8
    372
    0
    373
    Los Angeles-Long Beach-Glendale, CA Metropolitan Division
    18.8
    3782.6
    352
    -21
    374
    Birmingham-Hoover, AL
    18.8
    488.7
    364
    -10
    375
    Lake Havasu City-Kingman, AZ
    18.2
    45.2
    333
    -42
    376
    Las Vegas-Paradise, NV
    18.2
    797.3
    339
    -37
    377
    Ocala, FL
    18.1
    89.9
    367
    -10
    378
    Sebastian-Vero Beach, FL
    17.8
    43.1
    335
    -43
    379
    Prescott, AZ
    17.7
    54.0
    319
    -60
    380
    Eugene-Springfield, OR
    17.6
    140.6
    343
    -37
    381
    Rome, GA
    17.2
    38.1
    236
    -145
    382
    Cape Coral-Fort Myers, FL
    17.2
    194.9
    371
    -11
    383
    Mansfield, OH
    16.7
    52.1
    362
    -21
    384
    Detroit-Livonia-Dearborn, MI Metropolitan Division
    15.1
    694.6
    394
    10
    385
    Greensboro-High Point, NC
    15.0
    337.5
    345
    -40
    386
    Steubenville-Weirton, OH-WV
    15.0
    43.6
    379
    -7
    387
    Monroe, MI
    14.1
    37.3
    382
    -5
    388
    Hickory-Lenoir-Morganton, NC
    13.7
    142.7
    389
    1
    389
    Morristown, TN
    13.4
    45.3
    396
    7
    390
    Flint, MI
    13.4
    132.7
    375
    -15
    391
    Jackson, MI
    13.3
    53.0
    387
    -4
    392
    Memphis, TN-MS-AR
    11.0
    585.4
    321
    -71
    393
    Muskegon-Norton Shores, MI
    10.3
    57.7
    377
    -16
    394
    Dalton, GA
    9.6
    65.7
    390
    -4
    395
    Oakland-Fremont-Hayward, CA Metropolitan Division
    9.4
    947.0
    357
    -38
    396
    Janesville, WI
    9.3
    60.8
    391
    -5
    397
    Dothan, AL
    8.2
    56.5
    328
    -69
    398
    Pine Bluff, AR
    8.2
    36.5
    215
    -183
  • Large Cities Rankings – 2011 Best Cities for Job Growth

    Read about how we selected the 2011 Best Cities for Job Growth

    2011 Size Ranking
    Area
    2011 Weighted INDEX
    2010 Nonfarm Empl (1000s)
    2010 Size Rank
    Size Movement from 2010
    1
    Austin-Round Rock-San Marcos, TX
    89.1
    769.3
    1
    0
    2
    New Orleans-Metairie-Kenner, LA
    88.9
    522.6
    46
    44
    3
    Houston-Sugar Land-Baytown, TX
    82.1
    2552.3
    3
    0
    4
    San Antonio-New Braunfels, TX
    80.7
    841.3
    2
    -2
    5
    Dallas-Plano-Irving, TX Metropolitan Division
    80.6
    2043.4
    5
    0
    6
    Washington-Arlington-Alexandria, DC-VA-MD-WV Metropolitan Division
    74.1
    2412.6
    6
    0
    7
    Northern Virginia, VA
    73.8
    1306.5
    4
    -3
    8
    Nashville-Davidson–Murfreesboro–Franklin, TN
    73.1
    742.9
    30
    22
    9
    New York City, NY
    72.6
    3731.4
    10
    1
    10
    Philadelphia City, PA
    71.9
    661.8
    14
    4
    11
    Pittsburgh, PA
    71.7
    1129.8
    13
    2
    12
    Bethesda-Rockville-Frederick, MD Metropolitan Division
    70.7
    565.3
    15
    3
    13
    Boston-Cambridge-Quincy, MA NECTA Division
    70.4
    1679.0
    19
    6
    14
    Raleigh-Cary, NC
    67.8
    500.0
    8
    -6
    15
    Fort Worth-Arlington, TX Metropolitan Division
    67.8
    850.0
    7
    -8
    16
    Rochester, NY
    66.7
    506.9
    17
    1
    17
    Nassau-Suffolk, NY Metropolitan Division
    65.5
    1232.2
    16
    -1
    18
    Buffalo-Niagara Falls, NY
    64.7
    541.0
    20
    2
    19
    Columbus, OH
    64.3
    912.1
    26
    7
    20
    Salt Lake City, UT
    64.2
    613.9
    12
    -8
    21
    Omaha-Council Bluffs, NE-IA
    63.1
    456.9
    9
    -12
    22
    Oklahoma City, OK
    62.4
    559.6
    11
    -11
    23
    Milwaukee-Waukesha-West Allis, WI
    60.0
    814.8
    49
    26
    24
    Denver-Aurora-Broomfield, CO
    56.9
    1191.0
    24
    0
    25
    Orlando-Kissimmee-Sanford, FL
    56.3
    1010.7
    36
    11
    26
    Hartford-West Hartford-East Hartford, CT NECTA
    55.5
    536.3
    18
    -8
    27
    San Jose-Sunnyvale-Santa Clara, CA
    54.9
    859.7
    47
    20
    28
    Indianapolis-Carmel, IN
    53.4
    870.5
    34
    6
    29
    Putnam-Rockland-Westchester, NY
    51.4
    554.2
    33
    4
    30
    Charlotte-Gastonia-Rock Hill, NC-SC
    50.0
    803.4
    31
    1
    31
    St. Louis, MO-IL
    49.7
    1291.0
    27
    -4
    32
    Seattle-Bellevue-Everett, WA Metropolitan Division
    49.2
    1378.0
    28
    -4
    33
    San Francisco-San Mateo-Redwood City, CA Metropolitan Division
    47.9
    936.1
    42
    9
    34
    Louisville-Jefferson County, KY-IN
    47.0
    590.7
    25
    -9
    35
    Portland-Vancouver-Hillsboro, OR-WA
    46.2
    969.9
    41
    6
    36
    Miami-Miami Beach-Kendall, FL Metropolitan Division
    46.2
    989.6
    45
    9
    37
    San Diego-Carlsbad-San Marcos, CA
    46.1
    1227.6
    48
    11
    38
    Virginia Beach-Norfolk-Newport News, VA-NC
    45.0
    727.4
    23
    -15
    39
    Richmond, VA
    44.1
    598.6
    32
    -7
    40
    Edison-New Brunswick, NJ Metropolitan Division
    43.6
    974.0
    39
    -1
    41
    Chicago-Joliet-Naperville, IL Metropolitan Division
    43.4
    3624.2
    50
    9
    42
    Jacksonville, FL
    43.1
    583.4
    37
    -5
    43
    Bergen-Hudson-Passaic, NJ
    43.0
    868.7
    38
    -5
    44
    Providence-Fall River-Warwick, RI-MA NECTA
    42.9
    542.0
    55
    11
    45
    Kansas City, MO
    37.5
    536.2
    21
    -24
    46
    Minneapolis-St. Paul-Bloomington, MN-WI
    36.8
    1688.1
    40
    -6
    47
    Camden, NJ Metropolitan Division
    35.6
    506.6
    29
    -18
    48
    Cleveland-Elyria-Mentor, OH
    34.7
    992.9
    58
    10
    49
    Cincinnati-Middletown, OH-KY-IN
    33.9
    980.6
    35
    -14
    50
    Santa Ana-Anaheim-Irvine, CA Metropolitan Division
    32.5
    1359.6
    60
    10
    51
    Tampa-St. Petersburg-Clearwater, FL
    30.7
    1117.4
    54
    3
    52
    Atlanta-Sandy Springs-Marietta, GA
    30.5
    2247.7
    43
    -9
    53
    Phoenix-Mesa-Glendale, AZ
    29.3
    1701.2
    51
    -2
    54
    Fort Lauderdale-Pompano Beach-Deerfield Beach, FL Metropolitan Division
    28.5
    705.4
    56
    2
    55
    Newark-Union, NJ-PA Metropolitan Division
    27.7
    962.8
    44
    -11
    56
    West Palm Beach-Boca Raton-Boynton Beach, FL Metropolitan Division
    26.3
    503.0
    61
    5
    57
    Riverside-San Bernardino-Ontario, CA
    21.7
    1112.1
    63
    6
    58
    Sacramento–Arden-Arcade–Roseville, CA
    20.6
    799.5
    53
    -5
    59
    Warren-Troy-Farmington Hills, MI Metropolitan Division
    20.5
    1044.7
    66
    7
    60
    Los Angeles-Long Beach-Glendale, CA Metropolitan Division
    18.8
    3782.6
    59
    -1
    61
    Birmingham-Hoover, AL
    18.8
    488.7
    64
    3
    62
    Las Vegas-Paradise, NV
    18.2
    797.3
    57
    -5
    63
    Detroit-Livonia-Dearborn, MI Metropolitan Division
    15.1
    694.6
    65
    2
    64
    Memphis, TN-MS-AR
    11.0
    585.4
    52
    -12
    65
    Oakland-Fremont-Hayward, CA Metropolitan Division
    9.4
    947.0
    62
    -3
  • Small Cities Rankings – 2011 Best Cities for Job Growth

    Read about how we selected the 2011 Best Cities for Job Growth

    2011 Size Ranking
    Area
    2011 Weighted INDEX
    2010 Nonfarm Empl (1000s)
    2010 Size Rank
    Size Rank Change from 2010
    1
    Killeen-Temple-Fort Hood, TX
    93.8
    129.0
    4
    3
    2
    Bismarck, ND
    92.8
    63.0
    2
    0
    3
    College Station-Bryan, TX
    92.3
    98.5
    3
    0
    4
    Midland, TX
    90.8
    69.2
    45
    41
    5
    Dubuque, IA
    88.6
    56.6
    68
    63
    6
    Manhattan, KS
    88.3
    57.0
    7
    Pascagoula, MS
    85.4
    58.7
    21
    14
    8
    Odessa, TX
    84.1
    61.8
    65
    57
    9
    Logan, UT-ID
    82.2
    54.4
    81
    72
    10
    Fairbanks, AK
    81.0
    37.7
    31
    21
    11
    Elizabethtown, KY
    81.0
    47.6
    77
    66
    12
    Jacksonville, NC
    80.5
    47.2
    1
    -11
    13
    Lawton, OK
    80.5
    44.0
    7
    -6
    14
    Lebanon, PA
    80.5
    50.1
    79
    65
    15
    Longview, TX
    79.4
    97.0
    94
    79
    16
    Joplin, MO
    79.1
    79.8
    78
    62
    17
    Kennewick-Pasco-Richland, WA
    79.0
    99.2
    12
    -5
    18
    Gulfport-Biloxi, MS
    78.9
    105.3
    124
    106
    19
    Brownsville-Harlingen, TX
    77.9
    127.2
    22
    3
    20
    Columbia, MO
    77.2
    93.4
    23
    3
    21
    Auburn-Opelika, AL
    77.0
    53.3
    58
    37
    22
    Clarksville, TN-KY
    76.6
    83.4
    86
    64
    23
    San Angelo, TX
    76.4
    44.9
    63
    40
    24
    Morgantown, WV
    76.4
    65.4
    13
    -11
    25
    Wheeling, WV-OH
    76.2
    67.9
    59
    34
    26
    Ithaca, NY
    76.1
    65.6
    17
    -9
    27
    Jonesboro, AR
    75.9
    49.2
    32
    5
    28
    Springfield, IL
    74.6
    111.7
    42
    14
    29
    Fargo, ND-MN
    74.6
    122.4
    8
    -21
    30
    Grand Forks, ND-MN
    74.4
    54.0
    27
    -3
    31
    Corvallis, OR
    74.2
    38.1
    166
    135
    32
    Cumberland, MD-WV
    73.8
    39.9
    88
    56
    33
    Oshkosh-Neenah, WI
    73.5
    92.7
    96
    63
    34
    Portsmouth, NH-ME NECTA
    73.5
    53.7
    43
    9
    35
    Warner Robins, GA
    73.3
    59.7
    18
    -17
    36
    Wenatchee-East Wenatchee, WA
    73.2
    38.6
    26
    -10
    37
    Waco, TX
    73.0
    105.8
    30
    -7
    38
    Fort Collins-Loveland, CO
    72.9
    133.6
    50
    12
    39
    Myrtle Beach-North Myrtle Beach-Conway, SC
    72.7
    110.8
    128
    89
    40
    Harrisonburg, VA
    72.6
    62.7
    51
    11
    41
    Iowa City, IA
    72.6
    90.5
    19
    -22
    42
    Haverhill-North Andover-Amesbury, MA-NH  NECTA Division
    72.3
    76.5
    48
    6
    43
    Las Cruces, NM
    72.3
    69.1
    24
    -19
    44
    Johnstown, PA
    71.9
    60.7
    89
    45
    45
    Texarkana, TX-Texarkana, AR
    71.9
    56.9
    55
    10
    46
    Eau Claire, WI
    71.7
    80.4
    117
    71
    47
    Bowling Green, KY
    71.6
    59.7
    158
    111
    48
    Great Falls, MT
    71.3
    35.6
    15
    -33
    49
    State College, PA
    71.2
    74.4
    20
    -29
    50
    Yakima, WA
    71.2
    76.5
    9
    -41
    51
    Hinesville-Fort Stewart, GA
    71.1
    19.5
    14
    -37
    52
    Gainesville, GA
    71.1
    72.8
    148
    96
    53
    Burlington-South Burlington, VT NECTA
    70.7
    113.1
    125
    72
    54
    St. Cloud, MN
    69.9
    99.0
    54
    0
    55
    Williamsport, PA
    69.8
    52.6
    131
    76
    56
    Laredo, TX
    69.7
    88.4
    70
    14
    57
    New Bedford, MA NECTA
    69.4
    64.9
    92
    35
    58
    Brockton-Bridgewater-Easton, MA  NECTA Division
    69.3
    87.7
    129
    71
    59
    Glens Falls, NY
    69.1
    53.0
    35
    -24
    60
    Sandusky, OH
    68.9
    35.5
    132
    72
    61
    Ocean City, NJ
    68.6
    36.3
    90
    29
    62
    Hattiesburg, MS
    68.6
    59.3
    11
    -51
    63
    Cedar Rapids, IA
    68.6
    137.5
    34
    -29
    64
    Tyler, TX
    67.7
    93.3
    49
    -15
    65
    Houma-Bayou Cane-Thibodaux, LA
    67.3
    94.1
    73
    8
    66
    Owensboro, KY
    67.3
    49.8
    97
    31
    67
    Amarillo, TX
    67.2
    110.8
    39
    -28
    68
    Elmira, NY
    67.1
    40.1
    137
    69
    69
    Altoona, PA
    66.7
    60.5
    83
    14
    70
    Barnstable Town, MA NECTA
    66.4
    92.2
    82
    12
    71
    Sioux Falls, SD
    66.3
    133.0
    36
    -35
    72
    Rapid City, SD
    65.9
    59.3
    38
    -34
    73
    Pueblo, CO
    65.7
    57.1
    25
    -48
    74
    Lubbock, TX
    65.1
    129.5
    28
    -46
    75
    Dover, DE
    64.3
    63.4
    111
    36
    76
    Flagstaff, AZ
    63.6
    61.5
    75
    -1
    77
    Ames, IA
    63.3
    47.5
    72
    -5
    78
    Charlottesville, VA
    63.2
    98.7
    62
    -16
    79
    Appleton, WI
    63.2
    116.0
    134
    55
    80
    Jefferson City, MO
    63.0
    77.7
    61
    -19
    81
    Pittsfield, MA NECTA
    62.8
    35.4
    169
    88
    82
    Niles-Benton Harbor, MI
    62.7
    60.3
    213
    131
    83
    Greenville, NC
    62.5
    75.0
    37
    -46
    84
    Waterloo-Cedar Falls, IA
    62.0
    88.6
    66
    -18
    85
    Kankakee-Bradley, IL
    62.0
    42.9
    29
    -56
    86
    Springfield, OH
    61.8
    49.9
    155
    69
    87
    Erie, PA
    61.7
    128.5
    180
    93
    88
    Florence-Muscle Shoals, AL
    61.7
    54.8
    57
    -31
    89
    Athens-Clarke County, GA
    61.6
    81.0
    69
    -20
    90
    Palm Coast, FL
    61.5
    18.2
    113
    23
    91
    Tuscaloosa, AL
    60.9
    94.1
    87
    -4
    92
    Bloomington, IN
    60.9
    82.6
    10
    -82
    93
    Billings, MT
    60.8
    78.4
    44
    -49
    94
    Rochester-Dover, NH-ME NECTA
    60.6
    55.9
    115
    21
    95
    Winchester, VA-WV
    60.4
    54.4
    150
    55
    96
    Victoria, TX
    60.4
    49.2
    141
    45
    97
    Bloomington-Normal, IL
    60.2
    90.3
    64
    -33
    98
    Fayetteville, NC
    59.9
    128.2
    6
    -92
    99
    Cheyenne, WY
    59.8
    43.4
    33
    -66
    100
    Hot Springs, AR
    59.8
    37.1
    107
    7
    101
    Coeur d’Alene, ID
    59.5
    52.6
    80
    -21
    102
    Johnson City, TN
    58.1
    78.4
    160
    58
    103
    Merced, CA
    58.0
    55.6
    174
    71
    104
    Lafayette, IN
    57.7
    93.2
    145
    41
    105
    St. Joseph, MO-KS
    57.6
    57.3
    5
    -100
    106
    Abilene, TX
    57.5
    65.2
    47
    -59
    107
    Panama City-Lynn Haven-Panama City Beach, FL
    57.2
    70.7
    67
    -40
    108
    La Crosse, WI-MN
    57.2
    73.1
    103
    -5
    109
    Lewiston-Auburn, ME NECTA
    56.3
    47.9
    121
    12
    110
    Mankato-North Mankato, MN
    56.1
    52.1
    119
    9
    111
    Lafayette, LA
    56.1
    148.0
    -26
    112
    Duluth, MN-WI
    55.7
    127.8
    138
    26
    113
    Alexandria, LA
    55.6
    64.0
    46
    -67
    114
    Utica-Rome, NY
    55.4
    129.7
    60
    -54
    115
    Manchester, NH NECTA
    55.0
    97.5
    71
    -44
    116
    Leominster-Fitchburg-Gardner, MA NECTA
    54.8
    48.5
    201
    85
    117
    Sherman-Denison, TX
    54.6
    42.3
    106
    -11
    118
    Topeka, KS
    54.6
    107.9
    93
    -25
    119
    Casper, WY
    53.4
    38.3
    127
    8
    120
    Kingston, NY
    53.4
    60.7
    110
    -10
    121
    Decatur, IL
    52.7
    52.6
    161
    40
    122
    Lowell-Billerica-Chelmsford, MA-NH  NECTA Division
    52.7
    114.7
    144
    22
    123
    Greeley, CO
    52.4
    77.9
    130
    7
    124
    Charleston, WV
    51.2
    147.1
    -12
    125
    Columbus, GA-AL
    50.7
    117.2
    95
    -30
    126
    Savannah, GA
    50.6
    149.5
    -8
    127
    Rochester, MN
    50.2
    101.7
    53
    -74
    128
    Battle Creek, MI
    49.6
    56.0
    172
    44
    129
    Sioux City, IA-NE-SD
    49.5
    73.1
    74
    -55
    130
    Anderson, SC
    49.1
    60.0
    226
    96
    131
    Mount Vernon-Anacortes, WA
    48.9
    43.8
    168
    37
    132
    Wilmington, NC
    48.7
    135.2
    76
    -56
    133
    Kokomo, IN
    48.4
    41.1
    231
    98
    134
    Idaho Falls, ID
    48.3
    48.2
    98
    -36
    135
    Hanford-Corcoran, CA
    48.3
    35.2
    16
    -119
    136
    Champaign-Urbana, IL
    47.7
    109.4
    118
    -18
    137
    Terre Haute, IN
    47.7
    70.9
    177
    40
    138
    Holland-Grand Haven, MI
    47.6
    104.6
    232
    94
    139
    Santa Fe, NM
    47.5
    60.4
    123
    -16
    140
    Binghamton, NY
    47.4
    109.5
    99
    -41
    141
    Spartanburg, SC
    46.8
    118.9
    214
    73
    142
    Grand Junction, CO
    46.7
    58.8
    146
    4
    143
    Columbus, IN
    46.2
    42.4
    188
    45
    144
    Lynchburg, VA
    46.1
    104.1
    101
    -43
    145
    Punta Gorda, FL
    45.9
    40.7
    179
    34
    146
    Chico, CA
    45.7
    70.2
    143
    -3
    147
    Cape Girardeau-Jackson, MO-IL
    45.4
    43.6
    40
    -107
    148
    Modesto, CA
    45.2
    145.6
    20
    149
    Peabody, MA  NECTA Division
    43.9
    98.5
    142
    -7
    150
    Hagerstown-Martinsburg, MD-WV
    43.8
    96.9
    153
    3
    151
    El Centro, CA
    43.2
    44.3
    91
    -60
    152
    Missoula, MT
    43.1
    54.4
    105
    -47
    153
    Fort Smith, AR-OK
    42.9
    116.5
    157
    4
    154
    Gainesville, FL
    42.6
    127.7
    112
    -42
    155
    Elkhart-Goshen, IN
    42.6
    105.0
    233
    78
    156
    Sumter, SC
    42.3
    37.0
    225
    69
    157
    Burlington, NC
    41.9
    55.8
    209
    52
    158
    Olympia, WA
    41.7
    96.6
    52
    -106
    159
    Danbury, CT NECTA
    41.6
    65.8
    208
    49
    160
    Kingsport-Bristol-Bristol, TN-VA
    41.6
    116.9
    182
    22
    161
    Decatur, AL
    41.6
    53.7
    199
    38
    162
    Lake Charles, LA
    40.8
    88.7
    133
    -29
    163
    Norwich-New London, CT-RI NECTA
    40.6
    128.8
    100
    -63
    164
    Salem, OR
    39.8
    142.0
    -43
    165
    Lawrence, KS
    39.8
    49.9
    41
    -124
    166
    Bangor, ME NECTA
    39.5
    63.9
    84
    -82
    167
    Farmington, NM
    39.5
    48.3
    176
    9
    168
    Blacksburg-Christiansburg-Radford, VA
    39.4
    67.9
    108
    -60
    169
    Wichita Falls, TX
    39.3
    58.2
    192
    23
    170
    Salisbury, MD
    39.2
    52.2
    162
    -8
    171
    Macon, GA
    39.0
    95.9
    165
    -6
    172
    Madera-Chowchilla, CA
    38.9
    32.5
    56
    -116
    173
    Florence, SC
    38.8
    82.5
    173
    0
    174
    Saginaw-Saginaw Township North, MI
    38.7
    83.4
    186
    12
    175
    Anderson, IN
    38.3
    40.4
    120
    -55
    176
    Cleveland, TN
    37.9
    39.2
    175
    -1
    177
    Bremerton-Silverdale, WA
    37.9
    81.8
    85
    -92
    178
    Goldsboro, NC
    37.8
    42.3
    102
    -76
    179
    Monroe, LA
    37.6
    75.4
    114
    -65
    180
    Gadsden, AL
    37.4
    35.7
    200
    20
    181
    Huntington-Ashland, WV-KY-OH
    37.3
    113.7
    104
    -77
    182
    Port St. Lucie, FL
    36.9
    120.7
    191
    9
    183
    Valdosta, GA
    36.8
    52.3
    149
    -34
    184
    Racine, WI
    36.8
    74.8
    221
    37
    185
    Jackson, TN
    36.6
    57.9
    205
    20
    186
    Danville, VA
    35.8
    39.7
    211
    25
    187
    Kalamazoo-Portage, MI
    35.7
    137.3
    185
    -2
    188
    Fond du Lac, WI
    35.5
    44.9
    217
    29
    189
    Lewiston, ID-WA
    35.1
    25.6
    122
    -67
    190
    Rockford, IL
    34.5
    144.0
    20
    191
    Crestview-Fort Walton Beach-Destin, FL
    34.1
    76.2
    109
    -82
    192
    Nashua, NH-MA  NECTA Division
    33.9
    125.1
    154
    -38
    193
    Muncie, IN
    33.8
    49.3
    207
    14
    194
    Parkersburg-Marietta-Vienna, WV-OH
    33.7
    68.8
    126
    -68
    195
    San Luis Obispo-Paso Robles, CA
    32.3
    95.9
    167
    -28
    196
    Visalia-Porterville, CA
    32.1
    104.8
    139
    -57
    197
    Medford, OR
    32.1
    75.3
    193
    -4
    198
    Vallejo-Fairfield, CA
    31.7
    117.9
    181
    -17
    199
    St. George, UT
    31.5
    45.6
    164
    -35
    200
    Rocky Mount, NC
    31.1
    60.6
    196
    -4
    201
    Lima, OH
    30.8
    52.2
    206
    5
    202
    Waterbury, CT NECTA
    30.3
    62.7
    228
    26
    203
    Vineland-Millville-Bridgeton, NJ
    30.1
    58.2
    116
    -87
    204
    Bellingham, WA
    29.9
    77.7
    140
    -64
    205
    Bay City, MI
    29.7
    36.2
    203
    -2
    206
    Salinas, CA
    29.6
    119.5
    152
    -54
    207
    Albany, GA
    29.2
    60.9
    135
    -72
    208
    Pocatello, ID
    28.7
    35.6
    151
    -57
    209
    Napa, CA
    27.6
    58.0
    163
    -46
    210
    South Bend-Mishawaka, IN-MI
    26.3
    132.3
    224
    14
    211
    Santa Cruz-Watsonville, CA
    26.2
    85.9
    183
    -28
    212
    Longview, WA
    26.1
    34.9
    170
    -42
    213
    Atlantic City-Hammonton, NJ
    25.9
    135.3
    195
    -18
    214
    Michigan City-La Porte, IN
    24.6
    42.4
    187
    -27
    215
    Anniston-Oxford, AL
    24.1
    48.7
    156
    -59
    216
    Redding, CA
    24.0
    57.0
    189
    -27
    217
    Wausau, WI
    24.0
    67.0
    210
    -7
    218
    Yuba City, CA
    23.9
    36.3
    159
    -59
    219
    Sheboygan, WI
    21.8
    58.3
    216
    -3
    220
    Bend, OR
    21.6
    59.6
    184
    -36
    221
    Yuma, AZ
    21.2
    49.7
    204
    -17
    222
    Carson City, NV
    21.1
    28.8
    202
    -20
    223
    Brunswick, GA
    20.6
    40.4
    171
    -52
    224
    Naples-Marco Island, FL
    20.3
    110.7
    219
    -5
    225
    Danville, IL
    20.2
    28.9
    178
    -47
    226
    Lake Havasu City-Kingman, AZ
    18.2
    45.2
    197
    -29
    227
    Ocala, FL
    18.1
    89.9
    215
    -12
    228
    Sebastian-Vero Beach, FL
    17.8
    43.1
    198
    -30
    229
    Prescott, AZ
    17.7
    54.0
    190
    -39
    230
    Eugene-Springfield, OR
    17.6
    140.6
    -11
    231
    Rome, GA
    17.2
    38.1
    147
    -84
    232
    Mansfield, OH
    16.7
    52.1
    212
    -20
    233
    Steubenville-Weirton, OH-WV
    15.0
    43.6
    222
    -11
    234
    Monroe, MI
    14.1
    37.3
    223
    -11
    235
    Hickory-Lenoir-Morganton, NC
    13.7
    142.7
    -1
    236
    Morristown, TN
    13.4
    45.3
    234
    -2
    237
    Flint, MI
    13.4
    132.7
    218
    -19
    238
    Jackson, MI
    13.3
    53.0
    227
    -11
    239
    Muskegon-Norton Shores, MI
    10.3
    57.7
    220
    -19
    240
    Dalton, GA
    9.6
    65.7
    229
    -11
    241
    Janesville, WI
    9.3
    60.8
    230
    -11
    242
    Dothan, AL
    8.2
    56.5
    194
    -48
    243
    Pine Bluff, AR
    8.2
    36.5
    136
    -107