Tag: California

  • California’s Boom Is Poised To Go Bust — And Liberals’ Dream Of Scandinavia On The Pacific

    As its economy started to recover in 2010, progressives began to hail California as a kind of Scandinavia on the Pacific — a place where liberal programs also produce prosperity. The state’s recovery has won plaudits from such respected figures as The American Prospect’s Harold Meyerson and the New York Times’ Paul Krugman.

    Gov. Jerry Brown, in Bill Maher’s assessment, “took a broken state and fixed it.” There’s a political lesson being injected here, as well, as blue organs like The New Yorker describe California as doing far better economically than nasty red-state Texas.

    But if you take a look at long-term economic trends, or drive around the state with your eyes open, the picture is far less convincing. To be sure, since 2010 California’s job growth has outperformed the national average, propelled largely by the tech-driven Bay Area; its 14% employment expansion over the past six years is just a shade below Texas’. But dial back to 2001, and California’s job growth rate is 12%, less than half that of Texas’ 27%. With roughly 10 million fewer residents, Texas has created almost 2.8 million jobs since the turn of the millennium, compared to 2.0 million in California.

    Even in the Bay Area, the picture is less than ideal. Since 2001, total employment in the San Francisco area has grown barely 12% compared to 52% in Austin, 37.8% in Dallas-Ft. Worth, 36.5% in Houston and 31.1% in San Antonio. Los Angeles, by far California’s largest metro area, scratched out pedestrian job growth of 10.3%, slightly above the national increase of 9.3% over that time span.

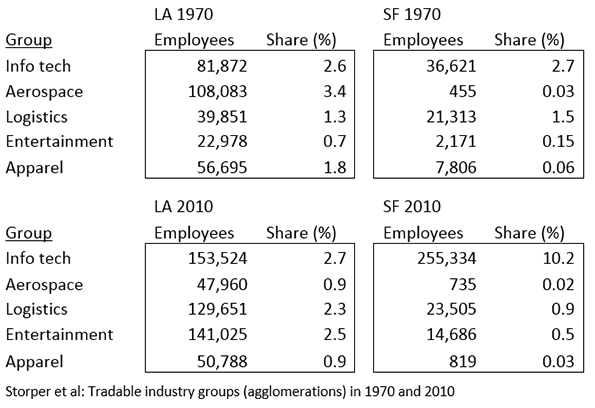
    Remarkably, despite the recent tech boom, California’s employment growth in science, technology, engineering and mathematics-related fields (aka STEM) since 2001 is just 11%, compared to 25% in Texas. Both Austin and San Antonio have increased their STEM employment faster than the Bay Area while Los Angeles, California’s dominant urban region and one-time tech powerhouse, has achieved virtually no growth. This pattern also holds for the largest high-wage sector in the U.S., business and professional services.

    Geographic Disparity: Relying On Facebook

    “It’s not a California miracle, but really should be called a Silicon Valley miracle,” says Chapman University forecaster Jim Doti. “The rest of the state really isn’t doing well.”

    This dependence on one region has its dangers. Silicon Valley has only recently topped its pre-dot-com boom jobs total, confirming the fundamental volatility of the tech sector. And there are clear signs of slowing, with layoffs increasing earlier in the year and more companies looking for space in less expensive, highly regulated areas.

    Consolidation and dominance by a few giants like Google, Facebook, Apple threaten to make Silicon Valley less competitive and innovative, as promising start-ups are swallowed at an alarming rate. Even Sergei Brin, a co-founder of Google, recently suggested that start-ups would be better off launching somewhere else.

    Housing poses perhaps the most existential threat to the Bay Area, particularly among millennials entering their 30s. Only 13% of San Franciscans could purchase the county’s median home at standard rates and term. For San Mateo, the number is 16%. No surprise that as many as one in three Bay Area residents are now contemplating an exit, according to an opinion poll this past spring.

    Outside the Bay Area, where tech is weaker, the situation is much grimmer. In Orange County, the strongest Southern California economy, tech and information employment is lower today than in 2000. In Los Angeles, employment has declined in higher-wage sectors like tech, durable goods manufacturing and construction, to be replaced by lower-wage jobs in hospitality, health and education. A recent analysis by the Los Angeles Economic Development Corp. predicts this trend will continue for the foreseeable future.

    Expanding Inequality

    Perhaps nothing undermines the narrative of the California “comeback” more than the state’s rising inequality. A recent Pew study found California’s urban areas over-represented among the metro area where the middle class is shrinking most rapidly. California now is home of over 30%  of United States’ welfare recipients, and almost 25% of Californians are in poverty when the cost of living is factored in, the highest rate in the country.

    Even in Silicon Valley, the share of the population in the middle class has dropped from 56% of all households to 45.7%, according to a recent report by the California Budget Center. Both the lower and upper income portions grew significantly; today lower-income residents represent 34.8% of the population compared to 19.5% affluent.

    Such disparities are, if anything, greater in Los Angeles, where high rents and home prices, coupled with meager income growth, is deepening a potentially disastrous social divide. Renters in the L.A. metro area are paying 48% of their monthly income to keep a roof above their heads, one reason why the Los Angeles area is now the poorest big metro area in the country, according to American Community Survey data. Overall California is home to a remarkable 77 of the country’s 297 most “economically challenged” cities, based on levels of poverty and employment, according to a recent study; altogether these cities have a population of more than 12 million.

    One critical sign of failure: As the “boom” has matured, the number of homeless has risen to 115,000, roughly 20% of the national total. They are found not only in infamous encampments such as downtown Los Angeles “skid row” or San Jose’s “the Jungle” but also more traditionally middle class areas as Pacific Palisades and through central parts of Orange County.

    The Fiscal Crisis

    California’s “comeback” has been bolstered by assertions that the state has returned fiscal health. True, California’s short-term budgetary issues have been somewhat relieved, largely due to soaring capital gains from the tech and high end real estate booms; just 5,745 taxpayers earning $5 million or more generated more than $10 billion of income taxes in 2013, or about 19% of the state’s total, according to state officials.

    Most likely this state deficit will balloon once asset inflation deflates. Brown is already forecasting budget deficits as high as $4 billion by the time he leaves office in 2019. The Mercatus Center ranks California 44th out of the 50 states in terms of fiscal condition, 46th in long-run solvency and 47th in terms of cash needed to cover short-run liabilities.

    Despite this, the public employee-dominated state government continues to increase spending, with outlays having grown dramatically since the 2011-12 fiscal year, averaging 7.8% per year growth. No surprise that Moody’s ranked California second from the bottom among the states in its preparedness to withstand the next recession. Brown’s own Department of Finance predicts that a recession of “average magnitude” would cut revenues by $55 billion.

    The Cost Of The Climate Jihad

    Relieved over concerns in the short run budget, the rise in revenues has provided a pretext for Brown to push his campaign to fight climate change to extremes. New legislation backed by the governor would impose more stringent regulations on greenhouse gas emissions, mandating a 40% cut from 1990 levels by 2030.

    Brown has no qualms about the economic impact of his policies since he tends to prioritize one sin — greenhouse gas emissions — even above such things as alleviating poverty. Brown’s moves will, by themselves, have no demonstrable impact on climate change given California’s size, temperate climate and loss of industry, as one recent study found. Brown knows this: he’s counting on setting an example that other states and countries will follow. Perhaps less recognized, California’s efforts to reduce emissions may account for naught, since the industry and people who have moved elsewhere have simply taken their carbon footprint elsewhere, usually to places where climate and less stringent regulation allow for greater emissions.

    California’s climate policies, however, are succeeding in further damaging the middle and working class. Environmental regulations, particularly a virtual ban on suburban homes, are driving housing prices up; mandates for renewables are doing the same for energy prices. This hits hardest at traditionally higher-paying blue-collar employment in housing, manufacturing, warehousing and even agriculture.

    California’s climate agenda has accelerated the state’s continued bifurcation — by region, by race and ethnicity, and even by age. Of course the green non-profit advocacy groups and the media will celebrate California’s comeback as proof that strict regulations and high taxes work. They seem not to recognize that that human societies also need to be sustainable, something that California’s trajectory certainly seems unlikely to accomplish.

    This piece first appeared in Forbes.

    Joel Kotkin is executive editor of NewGeography.com. He is the Roger Hobbs Distinguished Fellow in Urban Studies at Chapman University and executive director of the Houston-based Center for Opportunity Urbanism. His newest book, The Human City: Urbanism for the rest of us, will be published in April by Agate. He is also author of The New Class ConflictThe City: A Global History, and The Next Hundred Million: America in 2050. He lives in Orange County, CA.

    Photo: Troy Holden

  • California for Whom?

    “Old in error,” writes historian Kevin Starr, “California remains an American hope.” Historically, our state has been a beacon to outsiders seeking a main chance: from gold miners and former Confederates to Midwesterners displaced by hardship, Jews seeking opportunity denied elsewhere, African Americans escaping southern apartheid, Asians fleeing communism and societal repression, Mexicans looking for a way out of poverty, counter-culture émigrés looking for a place where creation can overcome repression.

    Yet, this notion of California as a land of outsiders is being turned on its head, our state’s dream repackaged — often with the approval of its ruling hegemons — as something more like a medieval city, expelling the poor and the young, while keeping the state’s blessings to the well-educated, well-heeled, and generally older population.

    Some boosters of the current order, such Gov. Jerry Brown, contend that the affluent and the educated are still coming, while the less educated and well-heeled, are leaving. They cite this as evidence that the “declinists” are wrong. Yet, the reality remains that California is losing its allure as a place of opportunity for most.

    COMING AND GOING

    California has been “bleeding” people to other states for more than two decades. Even after the state’s “comeback,” net domestic out-migration since 2010 has exceeded 250,000. Moreover, the latest Internal Revenue Service migration data, for 2013-2014, does not support the view that those who leave are so dominated by the flight of younger and poorer people. Of course, younger people tend to move more than older people, and people seeking better job opportunities are more likely to move than those who have made it. But, according to the IRS, nearly 60,000 more Californians left the state than moved in between 2013 and 2014. In each of the seven income categories and each of the five age categories, the IRS found California lost net domestic migrants.

    Nor, viewed over the long term, is California getting “smarter” than its rivals. Since 2000, California’s cache of 25- to 34-year-olds with college, postgraduate and professional degrees grew by 36 percent, below the national average of 42 percent, and Texas’ 47 percent. If we look at the metropolitan regions, the growth of 25- to 34-year-olds with college degrees since 2000 has been more than 1.5 to nearly 3 times as fast in Houston and Austin as in Silicon Valley, Los Angeles, or San Francisco. Even New York, with its high costs, is doing better.

    In fact, the only large California metropolitan area which has seen anything like Texas growth has been the most unlikely, the Inland Empire. The coastal areas, so alluring to the media and venture capitalists, are losing out in terms of growing their educated workforces, most likely a product of high housing prices and, outside of the Bay Area, weak high-wage job growth.

    The location of migrants tells us something about where the allure of California remains the strongest, and where it has been supplanted. Almost all of the leading states sending net migrants here are also high-tax, high-regulation places that have been losing domestic migrants for years — New York, Illinois, Michigan and New Jersey. In contrast, the net outflow has been largely to lower-cost states, notably Texas, as well as neighboring Western states, all of which have lower housing prices.

    And, finally, there is the issue of age. Historically, California has been a youth magnet, but that appeal is fading. In 2014, according to the IRS data, more than two-thirds of the net domestic out-migrants were reported on returns filed by persons aged from 35 to 64. These are the people who are most likely to be in the workforce and be parents.

    CLASS AND ETHNIC PATTERNS

    Upward mobility has long been a signature of California society. Yet, 22 of the state’s large metro areas have seen a decline in their middle class, according to a recent Pew Research Center study. Los Angeles, in particular, has suffered among the largest hollowing out of the middle-income population in the country. In places like the Bay Area, there’s a growing upper class, while in less glamorous places like Sacramento, it’s the low end that is expanding at the expense of the middle echelons.

    The economy, too, has been tending toward ever more bifurcation, with some growth in tech and business services, largely in the Bay Area. Elsewhere, the overwhelming majority of jobs created since 2007 have come from lower-paying professions, such as health and education and hospitality, or, recently, from real estate-related activities. Overall, traditional, higher-paying, blue-collar jobs – such as construction and durable goods manufacturing – have continued to lose ground. Most California metropolitan areas, most notably Los Angeles, lag most key national competitors — including Texas metro areas, Phoenix, Nashville, Tenn., Charlotte, N.C., and Orlando, Fla. — in higher-paid new jobs in business services and finance.

    But the biggest losers of egalitarian aspirations have been the constituencies most loudly embraced by the state’s progressive establishment: black and brown Californians. Nowhere is this disparity greater than in home ownership, the signature measure of upward mobility and entrance into the middle class. Overall, Latino homeownership in California is 41.9 percent; nationally, it’s 45 percent, and in Texas it’s 55 percent. Similarly, among African Americans, homeownership is down to 34 percent in California, compared to 41 percent nationally and 40.8 percent in Texas. In Los Angeles, which has the lowest overall homeownership percentage among the nation’s largest metro areas, only 37 percent of Hispanics own their own homes, compared to 50 percent in Dallas-Fort Worth.

    CALIFORNIA’S ROAD FORWARD

    One popular progressive theory for how to address the economy lies in trying to emulate places like Massachusetts, a state whose per-capita income ranks among the highest in the country. Yet, this approach fails to confront the huge demographic differences between the states.

    Let’s start with ethnicity. Eighty percent of Massachusetts’ population is comprised of non-Hispanic whites or Asians, who traditionally have higher incomes, while in California whites and Asians constitute only 52 percent. Some 80 percent of the Boston metropolitan area is non-Hispanic white or Asian, compared to only 46 percent the population in the Los Angeles-Orange County area, and 40 percent in the Inland Empire. California has a poverty rate, adjusted for housing costs, of 23.4 percent, while Massachusetts, with its lower share of more heavily disadvantaged minority populations, registers just 13.8 percent.

    California could only resemble Massachusetts if it successfully unloaded much of its disadvantaged minority and working-class population. Although some might celebrate the movement of poorer people out of the state, our poverty rate is unlikely to decrease, since historically disadvantaged ethnicities (African Americans and Hispanics) account for 58 percent of the under-18 population in California, and only 25 percent in Massachusetts.

    Simply put, California faces a gargantuan challenge of generating a better standard of living for a huge proportion of its population. To be sure, both the San Francisco and San Jose metropolitan areas can thrive, like Massachusetts, in a highly education-driven economy. But states like California, Texas and Florida are too diverse, in class and race, to follow the “Massachusetts model.” We need good blue-collar and white-collar, middle-income jobs to keep a more diverse, and somewhat less well-educated, population adequately housed and fed.

    This should be the primary concern of our state. But the governor and legislators seem more interested today in re-engineering our way of life than improving outcomes. True, if you drive up housing and energy prices, some of the poor will leave, but so, too, will young people, the future middle class. Though our largest coastal metropolitan counties — Los Angeles, Orange, San Diego, Alameda, Contra Costa, San Mateo and San Francisco — have long been younger than the rest of country, soon they will be more gray than the nation.

    The demographic future of California seems increasingly at odds with the broad “dream” that Starr and others evoke so powerfully. We are headed ever more toward a state of divided realities, of poorer, downwardly mobile people, largely in the interior and in inner-city Los Angeles or Oakland, and a rapidly aging, wealthier, whiter enclave hugging the coast. For those with the right education, inheritance and a large enough salary, the California dream still shines bright, but for the majority it seems like a dying light.

    This piece first appeared in the Los Angeles Daily News.

    Joel Kotkin is executive editor of NewGeography.com. He is the Roger Hobbs Distinguished Fellow in Urban Studies at Chapman University and executive director of the Houston-based Center for Opportunity Urbanism. His newest book, The Human City: Urbanism for the rest of us, will be published in April by Agate. He is also author of The New Class ConflictThe City: A Global History, and The Next Hundred Million: America in 2050. He lives in Orange County, CA.

    Wendell Cox is principal of Demographia, an international pubilc policy and demographics firm. He is a Senior Fellow of the Center for Opportunity Urbanism (US), Senior Fellow for Housing Affordability and Municipal Policy for the Frontier Centre for Public Policy (Canada), and a member of the Board of Advisors of the Center for Demographics and Policy at Chapman University (California). He is co-author of the “Demographia International Housing Affordability Survey” and author of “Demographia World Urban Areas” and “War on the Dream: How Anti-Sprawl Policy Threatens the Quality of Life.” He was appointed to three terms on the Los Angeles County Transportation Commission, where he served with the leading city and county leadership as the only non-elected member. He served as a visiting professor at the Conservatoire National des Arts et Metiers, a national university in Paris.

    Photograph: Great Seal of the State of California by Zscout370 at en.wikipedia [CC BY-SA 3.0],from Wikimedia Commons

  • California: The Economics of Delusion

    In Sacramento, and much of the media, California is enjoying a “comeback” that puts a lie to the argument that regulations and high taxes actually matter. The hero of this recovery, Gov. Jerry Brown, in Bill Maher’s assessment, “took a broken state and fixed it.”

    Yet, if you look at the long-term employment trends, housing affordability, inequality and the state’s long-term fiscal health, the comeback seems far less miraculous. Silicon Valley flacks may insist that the “landscape now has been altered,” so prosperity is now permanent, but this view is both not sustainable and deeply flawed.

    Jobs: The long view

    Since 2010, California has begun to generate jobs at a rate somewhat faster than the nation, but this still has just barely made up for the deep recession in 2007. The celebratory notion that true-blue California is outperforming red states like Texas is valid only in a very short-term perspective. Indeed, even since 2010, the job growth in Austin and Dallas has been higher than that in the Bay Area, while Los Angeles has lagged well behind.

    If you go back to 2000, the gap is even more marked. Between 2000 and 2015, Austin has increased its jobs by 50 percent, while Raleigh, Houston, San Antonio, Dallas, Nashville, Orlando, Charlotte, Phoenix and Salt Lake City – all in lower-tax, regulation-light states – have seen job growth of 24 percent or above. In contrast, since 2000, Los Angeles and San Francisco expanded jobs by barely 10 percent. San Jose, the home of Silicon Valley, has seen only a 6 percent expansion over that period.

    Regional concentration

    As Chapman University economist and forecaster Jim Doti recently suggested, the California boom is exceedingly concentrated in one region. “It’s not a California miracle, but really should be called a Silicon Valley miracle,” Doti noted in his latest forecast. “The rest of the state really isn’t doing well.”

    Read the entire piece at The Orange County Register.

    Joel Kotkin is executive editor of NewGeography.com. He is the Roger Hobbs Distinguished Fellow in Urban Studies at Chapman University and executive director of the Houston-based Center for Opportunity Urbanism. His newest book, The Human City: Urbanism for the rest of us, will be published in April by Agate. He is also author of The New Class ConflictThe City: A Global History, and The Next Hundred Million: America in 2050. He lives in Orange County, CA.

    Bill Watkins is a professor at California Lutheran University and runs the Center for Economic Research and Forecasting, which can be found at clucerf.org.

  • California’s State Religion

    In a state ruled by a former Jesuit, perhaps we should not be shocked to find ourselves in the grip of an incipient state religion. Of course, this religion is not actually Christianity, or even anything close to the dogma of Catholicism, but something that increasingly resembles the former Soviet Union, or present-day Iran and Saudi Arabia, than the supposed world center of free, untrammeled expression.

    Two pieces of legislation introduced in the Legislature last session, but not yet enacted, show the power of the new religion. One is Senate Bill 1146, which seeks to limit the historically broad exemptions the state and federal governments have provided religious schools to, well, be religious.

    Under the rubric of official “tolerance,” the bill would only allow religiously focused schools to deviate from the secular orthodoxy required at nonreligious schools, including support for transgender bathrooms or limitations on expressions of faith by students and even Christian university presidents, in a much narrower range of educational activity than ever before. Many schools believe the bill would needlessly risk their mission and funding to “solve” gender and social equity problems on their campuses that currently don’t exist.

    The second piece of legislation, thankfully temporarily tabled, Senate Bill 1161, the Orwellian-named “California Climate Science Truth and Accountability Act of 2016,” would have dramatically extended the period of time that state officials could prosecute anyone who dared challenge the climate orthodoxy, including statements made decades ago. It would have sought “redress for unfair competition practices committed by entities that have deceived, confused or misled the public on the risks of climate change or financially supported activities that have deceived, confused or misled the public on those risks.”

    Although advocates tended to focus on the hated energy companies, the law could conceivably also extend to skeptics who may either reject the prevailing notions of man-made climate change, or might believe that policies concocted to “arrest” the phenomena may be themselves less than cost-effective or even not effective at all. So, fellow Californians, sign onto Gov. Torquemada’s program or face possible prosecution and the fires of hell.

    Read the entire piece at The Orange County Register.

    Joel Kotkin is executive editor of NewGeography.com. He is the Roger Hobbs Distinguished Fellow in Urban Studies at Chapman University and executive director of the Houston-based Center for Opportunity Urbanism. His newest book, The Human City: Urbanism for the rest of us, will be published in April by Agate. He is also author of The New Class ConflictThe City: A Global History, and The Next Hundred Million: America in 2050. He lives in Orange County, CA.

    Photo: Troy Holden

  • A ‘Diet’ to Give California Drivers Indigestion

    In the past, it was other people’s governments that would seek to make your life more difficult. But increasingly in California, the most effective war being waged is one the state has aimed at ourselves.

    The Jerry Brown administration’s obsession with becoming a global model for reducing greenhouse gases is leading to an unprecedented drive to completely reshape how Californians live. Rather than focus on more pragmatic, affordable steps to reduce greenhouse gases – more efficient cars, rooftop solar systems and promoting home-based work – the goal increasingly seems like social engineering designed to force Californians to adopt the high-density, transit-oriented future preferred by Brown’s green priesthood.

    The newest outrage comes from the Governor’s Office of Planning and Research in the form of a proposed “road diet.” This would essentially halt attempts to expand or improve our roads, even when improvements have been approved by voters. This strategy can only make life worse for most Californians, since nearly 85 percent of us use a car to get to work. This in a state that already has among the worst-maintained roads in the country, with two-thirds of them in poor or mediocre condition.

    The OPR move reflects the increasingly self-righteous extremism animating the former Jesuit’s underlings. Ironically, the governor’s proposals to impose this road diet rest partly on expanding the California Environmental Quality Act, which Brown, in a more insightful moment, described as a “vampire” that needs a “stake through the heart.” Now, instead, the inquisitors seize on vague legislative language and push it to what the Southern California Leadership Council has dubbed “an undesirable and unmanageable extreme.”

    In essence, the notion animating the “road diet” is to make congestion so terrible that people will be forced out of their cars and onto transit. It’s not planning for how to make the ways people live today more sustainable. It has, in fact, more in common with Soviet-style social engineering, which was based similarly on a particular notion of “science” and progressive values.

    Read the entire piece at The Orange County Register.

    Joel Kotkin is executive editor of NewGeography.com. He is the Roger Hobbs Distinguished Fellow in Urban Studies at Chapman University and executive director of the Houston-based Center for Opportunity Urbanism. His newest book, The Human City: Urbanism for the rest of us, will be published in April by Agate. He is also author of The New Class ConflictThe City: A Global History, and The Next Hundred Million: America in 2050. He lives in Orange County, CA.

  • SF Vs LA: Different Strokes In Urban Development

    Book Review: “The Rise and Fall of Urban Economies: Lessons from San Francisco and Los Angeles.” Michael Storper, Thomas Kemeny, Naji P. Makarem and Taner Osman; Stanford University Press, 2015.

    How and why do places differ in their pace of economic development? Why do some flourish while others lag? These are among the most profound questions in economics and related fields. Are explanations found in geography, culture, institutions, or fortune?

    In “The Rise and Fall of Urban Economies: Lessons from San Francisco and Los Angeles,” Michael Storper, Thomas Kemeny, Naji P. Makarem and Taner Osman consider these questions for two great cities. Storper, Kemeny, Makarem and Osman (hereafter SKMO) direct their attention to the Los Angeles and San Francisco “extended metropolitan regions” — the Census Bureau’s Consolidated Statistical Areas (CSAs) — in the post-1970 years. SKMO claim to have a plausible story about LA/SF divergence, which they do a fine job of presenting in this clearly written and well documented volume.

    Both areas were established centers in high-amenity coastal California settings with similar levels of economic success in base-year 1970. But their fortunes have diverged ever since, with San Francisco taking a significant lead.

    What happened?

    Much of SKMO’s story springs from employment trends summarized in their table, below, which shows jobs data by major sector for their beginning and ending years for each region. Looking at employment shares, both areas had a similarly sized IT sector in 1970, but the Bay Area’s grew spectacularly while LA’s stayed about where it was. LA was specialized in aerospace and defense but, as is well known, that sector declined as the Cold War ended. Both geographic areas started almost equally in share of logistics jobs, but SF’s specialization in that sector subsided, while LA’s grew. LA’s lead in entertainment grew. Both areas lost jobs in apparel, but this hit LA harder, as the region had been more specialized in that sector.

    The LA area was long recognized for its leadership in the entertainment industry, just as the San Francisco area was for its leadership in tech. Yet “Hollywood” has been emulated in many places, including India, South Korea, China, and several European countries, while Silicon Valley’s would-be emulators, though numerous, have been far less auspicious.

    The post-1970s success of the SF region owes much to Silicon Valley, and SKMO note that, on average, SF’s tech sector salaries were higher than those in LA’s entertainment sector. Lots has been written about the unique culture of innovation and entrepreneurialism found in The Valley. There are real and aspiring ‘techno-hubs” practically all over the world. But the Holy Grail — to identify and bottle some kind of formula to spawn another Silicon culture — has not been discovered.

    SKMO note various Silicon Valley pre-1970s events: how the electronics industry had its roots in radio hobbyists, and the 1960s convergence of hippies and techies. The authors identify eleven historical “critical turning points.” Some are private business choices (“Hollywood’s creation of a new project-based organizational structure in the 1950s and 1960s”); some are more in the realm of public policy (“Los Angeles’ Alameda Corridor Project in the 1980s and 1990s”). Others (Steve Jobs liked The Whole Earth Catalog) also make the list, but without any clear direction for today’s planners.

    The authors devote a chapter to what local governments in each of the two regions spent and prioritized. Bay Area government spending was greater in the 1990s, as well as in the first decade of the 2000s. While Bay Area public transit spending was much greater, SKMO admit that both areas suffer bad traffic congestion, and back away from concluding the extra Bay Area public spending had payoffs. They end up concluding that we simply do not know enough about the programs that were funded to make strong statements about how spending might have (or should have) been re-allocated among programs.

    The key chapter of the book addresses what the authors call ‘Beliefs and Worldviews in Economic Development’: “We will see … how the Los Angeles Economic Roundtable and Chamber of Commerce generated very different narratives from those of the Bay Area Council and Joint Venture Silicon Valley… Bay Area leadership has had a more focused and time-consistent perception of its regional economy as a new knowledge economy. Greater Los Angeles leadership beliefs and worldviews have been inconsistent over time, with fleeting conceptions of the New Economy subsequently crowded out by the perception of Greater Los Angeles mainly as a gateway to international trade and logistics and specialized manufacturing.”

    We have to be careful here. The sequence of events is significant: Did important policy choices pre-date the good (SF) or the bad (LA) events the authors document? The unique entrepreneurial and innovative culture bred in Silicon Valley has no discernible starting date. Did the view of Bay Area elites of a new knowledge economy lead the way, or simply acknowledge facts on the ground?

    In their study of LA and SF, SKMO say little about how both areas have failed to reign in housing costs. By failing to contain the rising costs of most households’ single largest expenditure, both regions have failed. Labor markets cannot do their job when many people’s location choices are restricted. In all of their talk of the best regional development strategy, this essential one is not touched on in the study.

    But, caveats aside, “The Rise and Fall of Urban Economies” is data-rich, wide-ranging and provocative. Anyone interested in the American West’s two premier cities should read this important book.

    Peter Gordon is an Emeritus Professor, Price School of Public Policy at the University of Southern California. He now teaches each summer at Zhejian University in Hangzhou, China, and is currently at work on a book that explores how modern cities contribute to economic growth. He blogs at petergordonsblog.com.

  • Problems in the Orange County Grand Jury Light Rail Report

    Earlier this month (May 9, 2016) the Orange County (California) Grand Jury issued a report entitled: “Light Rail: Is Orange County on the Right Track,” which is on the Grand Jury website here. The report largely concludes that it is not and that there is a need for a light rail system in Orange County. On page 7, the 2016 Grand Jury report says: “No Grand Jury has reported on development of light rail systems in Orange County.”

    In fact, there was a previous report, at: http://www.ocgrandjury.org/pdfs/GJLtRail.pdf, which is a 1999 report of the Orange County Grand Jury entitled: “Orange County Transportation Authority and Light Rail Planning.” Both the 1999 and 2016 reports are on the Orange County Grand Jury website as of May 25, 2016. The 1999 report reached fundamentally different conclusions than the 2016 report. Obviously, the 2016 report makes no attempt to reconcile its findings or analysis with the 1999 report.

    Inappropriate Density Comparison

    There are additional problems with the 2016 Grand Jury Report. In making the case for light rail in Orange County, the 2016 Grand Jury put considerable emphasis on the fact that Orange County’s population density is higher than that of Los Angeles County. The reason for Orange County’s population density advantage is the fact that much of Los Angeles County is in the largely undevelopable Transverse Ranges (including the San Gabriel Mountains), with a considerable amount of rural (not urban) desert. The difference is that Orange County’s land area is approximately two-thirds urban, while Los Angeles County’s land area is about one-third urban. This renders the overall density comparison for urban transportation planning meaningless.

    Indeed, the urban density of Los Angeles County is substantially higher than that of Orange County. According to the United States Census Bureau, the population density of the urban areas in Los Angeles County was 6,859 per square mile in 2010, well above Orange County’s 5,738. Los Angeles County’s densest census tract is nearly 2.5 times the density of any census tract in Orange County.

    Transit is About Downtown

    Even so, urban rail ridership bears little relationship to overall urban population density (otherwise the San Jose urban area would be a better environment for rail than the New York urban area). In 2010, San Jose’s density was about 5,820, while New York’s was 5,319 (Los Angeles was 6,999, including the most dense parts of Los Angeles and Orange County and part of San Bernardino County).

    One of the most important keys to transit ridership is the concentration of work destinations in a dense central business district (CBD), to which nearly all high capacity and frequent transit services converge. In the United States, 55 percent of all transit commuting destinations are in the six largest municipalities (such as the city of New York or the city of San Francisco, as opposed to metropolitan areas) with the largest central business districts. This is dominated by New York with about 2,000,000 employees in its CBD. On the other hand, San Jose has one of the smallest central business districts of any major metropolitan area and a correspondingly smaller transit market share than the national average. Orange County, with an urban form far more like San Jose than New York or San Francisco, has little potential to materially increase transit ridership with light rail.

    The record of new urban rail in the United States is less than stellar, evaluated on the most important metric. Generally, new urban rail has resulted in only minor increases in transit’s miniscule market share and in some cases there have been declines.

    In the case of Los Angeles, on which the Grand Jury relies for its conclusion favoring light rail development, three one-half cent sales taxes and spending that has amounted to more than $16 billion on development of new rail lines. Yet, transit ridership has fallen, as reported in the Los Angeles Times (see: “Just How Much has Los Angeles Transit Ridership Fallen”). Former SCRTD (predecessor to the MTA) Chief Financial Officer Thomas A. Rubin has also suggested that the MTA ridership decline may be greater if adjusted for the increased number of transfers that have occurred in the bus-rail system compared to the previous bus system (For example, a person traveling from home to work who starts on a bus, transfers to rail and finished the trip on a bus, counts as three, not one).

    Required Responses:

    The Grand Jury report notes:

    “The California Penal Code Section 933 requires the governing body of any public agency which the Grand Jury has reviewed, and about which it has issued a final report, to comment to the Presiding Judge of the Superior Court on the findings and recommendations pertaining to matters under the control of the governing body. Such comment shall be made no later than 90 days after the Grand Jury publishes its report (filed with the Clerk of the Court).”

    This would apparently require a response by August 9, 2016

    Permission Granted to Cite or Quote this Article or the Linked Documents

    Any respondent is hereby granted permission to cite or quote from this article or the linked documents.

  • California’s High-Speed Rail Authority Wins Dishonor of the California Golden Fleece Award

    The California High-Speed Rail Authority (CHSRA) has won the Independent Institute’s first California Golden Fleece Award for its lack of transparency and history of misleading the public about key details of the state’s “bullet-train” project, which no longer reflect what voters approved in 2008.

    The agency’s “bait-and-switch” strategy justifies a statewide vote on whether or not to proceed with the train system. Californians should reject this unnecessary and expensive boondoggle.

    Background

    In November 2008, California voters approvedProposition 1A, a $9.95 billion bond measure authorizing construction of a high-speed “bullet train” between downtown San Francisco and the greater Los Angeles area. The vote was 53 percent in favor and 47 percent opposed. The ballot measure contained key details regarding the project’s cost, dedicated tracks, trip time, and financing plan. Many of these details have been changed repeatedly since 2008.

    The Cost: A Moving Target

    Before the 2008 vote on the bond measure, the California High-Speed Rail Authority said: “The total cost to develop and construct the entire high-speed train system would be about $45 billion.” Proposition 1A also promised voters that the train system would operate without taxpayer subsidies: “The planned passenger service by the authority in the corridor or usable segment thereof will not require a local, state, or federal operating subsidy.” Soon after voters approved the project, however, cost projections escalated.

    In its original 2012 Business Plan, the CHSRA set the price tag at a staggering $98 billion. Public and political outcry caused rail officials to quickly backtrack. Just five months later, the revised 2012 Business Planlowered the cost by $30 billion by moving to a “blended” route: one that would share existing rail tracks in urban areas with other train systems, rather than building new dedicated tracks.

    Based on this radical redesign, CHSRA said the entire 520-mile system would be completed in 2029 at a cost of $68 billion, but only by eliminating high-speed service between Los Angeles and Anaheim and between San Jose and San Francisco.

    Then in 2016, the CHSRA Business Plan lowered the cost by roughly $4 billion net, to $64 billion, through a combination of vaguely specified “design refinements,” “system optimization,” “value engineering,” and “lessons learned from bids.”

    At this point, the ever-changing cost estimates defy belief. As noted by Dan Walters, Sacramento Beecolumnist and longtime observer of state government: “Those charged with building California’s north-south bullet train system have been more or less making it up as they go along.” But regardless of whether the final cost is $64 billion, $68 billion, $98 billion, or even higher, the reality should be clear: The cost far exceeds the $45 billion approved by voters in 2008, and now with substantial track redesigns.

    Tracks and Trip Time: From Bullet Train to Choo Choo Train

    Public outrage over the $98 billion price tag prompted train officials to abandon the original plan of building dedicated tracks in urban areas. Instead, officials shifted to blended tracks in urban areas: the bullet train would share tracks with the existing Metrolink commuter network in Southern California and the Caltrain system in Northern California. But the blended approach increases trip time considerably from what was promised to voters.

    Voters in 2008 were told the high-speed train would whisk travelers from San Francisco to Los Angeles in a “maximum nonstop service travel time” that “shall not exceed” 2 hours and 40 minutes. This specific trip time was often mentioned by supporters to sell the bond measure to voters. (See for example, here andhere.) But with the blended approach, the fastest time between these cities is now estimated by the CHSRA to be 3 hours and 8 minutes, with zero nonstop trips planned—another violation of Proposition 1A. But more realistic trip times are expected to be 3 hours and 50 minutes, or more, under real-world travel conditions.

    The original 2:40 trip time assumed that trains would operate at peak speeds of 220 mph, and “sustained revenue operating speeds of at least 200 miles per hour.” But under the blended approach, high-speed trains must share tracks with commuter trains and freight trains, forcing them to slow down at the urban “bookends.” And today’s older urban tracks can typically handle maximum speeds of only 125 mph.

    In February 2016, officials announced that the first operating leg of the high-speed train system would be built for $21 billion from downtown San Jose to an agricultural field in Shafter, north of Bakersfield, which would begin operating by 2025. The previous plan called for trains to operate first from Merced to Burbank by 2022, three years earlier. This change in the initial route might appear innocent, but by moving the first leg of construction further north, officials can delay construction on a tunnel through the Tehachapi and San Gabriel Mountains, which is likely to bust the current $64 billion budget.

    According to a Los Angeles Times special report:

    The monumental task of building California’s bullet train will require punching 36 miles of tunnels through the geologically complex mountains north of Los Angeles.

    Crews will have to cross the tectonic boundary that separates the North American and Pacific plates, boring through a jumble of fractured rock formations and a maze of earthquake faults, some of which are not mapped.

    It will be the most ambitious tunneling project in the nation’s history. . . .

    However, a Times analysis of project documents, as well as interviews with scientists, engineers, and construction experts, indicates that the deadline and budget targets will almost certainly be missed—and that the state has underestimated the challenges ahead, particularly completing the tunneling on time.

    “It doesn’t strike me as realistic,” said James Monsees, one of the world’s top tunneling experts and an author of the federal manual on highway tunneling. “Faults are notorious for causing trouble.”

    Serious questions remain about whether sufficient funding will ever materialize to complete the newly proposed first leg from San Jose to Shafter, and then to eventually extend the line north to San Francisco and south through the mountains to Los Angeles as originally promised.

    The Financing Plan: Smoke and Mirrors

    Supporters of the high-speed rail project envisioned financing coming from multiple partners. Under Proposition 1A, California voters approved a $9.95 billion bond in 2008 to help finance construction of the rail network (interest costs will be an additional $9.5 billion). Voters were told that if they approved the bond, the federal government and the private sector would pay for the rest.

    Supporters were counting on private investors kicking in as much as $36 billion. The federal government was also expected to contribute up to $18 billion. Another source of funding that arose in 2014 consisted of earmarking 25 percent of the proceeds from auctioning credits to emit greenhouse gases under California’s “cap-and-trade” program, which is estimated to yield the rail project about $500 million a year. (Under the plan, the rail authority would use the annual “cap-and-trade” revenues through 2024, and then seek to borrow $5.2 billion against future carbon fees from 2025 to 2050.) To date, much of the promised financing has never materialized and largely amounts to wishful thinking.

    Congress has pledged an initial grant of $3.3 billion, mostly through President Obama’s economic stimulus package. But the state has received only $503 million of that money as of 2015. And Congress has balked at additional funding. “Congress is never going to allocate more money to a project that lacks the ridership numbers, speeds, private funding, and voter support once promised,” said Rep. Jeff Denham (R-Turlock), chairman of the House rail subcommittee.

    The legal authorization to impose the state “cap-and-trade” fees expires in 2020, making the future availability of this money questionable. And a lawsuit seeks to block use of the cap-and-trade fees for the high-speed rail project. According to Jessica Peters, principal fiscal and policy analyst with California’s nonpartisan Legislative Analyst’s Office (LAO): “About half of the [San Jose to Shafter] funds would come from cap-and-trade beyond 2020,” when the fees are set to expire. A LAO review of the CHSRA’s 2016 Business Plan also questioned the logic of choosing a field in Shafter as the initial southern terminus:

    Even with a temporary station or platform, ending the IOS [initial operating segment] in an unpopulated agricultural area does not appear to be an effective approach. This is because this location would not have the types of facilities and nearby businesses, such as transit connections, rental car facilities, and shops necessary to meet the needs of train passengers.

    Finally, the private sector has not invested in the project, which is unlikely to ever be profitable. Summarizing, the LAO said that the CHSRA’s current funding plan is “significantly short of the level needed to complete [the entire San Francisco to Los Angeles system] and does not identify how this shortfall [of $43 billion] would be met.”

    Moreover, the pledge to voters in 2008 that the high-speed train would operate without taxpayer subsidies was based on ridership estimates that are quickly evaporating. In 2008, the CHSRA forecasted a base annual ridership of 65.5 million intercity riders and a high projection of 96.5 million intercity riders by 2030.

    But independent analysis concluded:

    The CHSRA ridership projections are considerably higher than independent figures developed for comparable California systems in Federal Railroad Administration and University of California Transportation Center at Berkeley studies. Using generous assumptions, this Due Diligence Report projects a 2030 base of 23.4 million intercity riders, 64 percent below the CHSRA’s base of 65.5 million intercity riders, and a 2030 high of 31.1 million intercity riders, nearly 60 percent below the CHSRA’s high of 96.5 million. It is likely that the HSR will fall far short of its revenue projections, leading to a need for substantial additional infusions of taxpayer subsidies.

    The blended 2012 redesign will increase trip times substantially, making air travel, driving, Skype, or phone calls more attractive relative to a slower train ride:

    [A]ssuming the optimistic travel time projection of 3:50, the 2035 interregional ridership would be approximately two-thirds (67 percent) below CHSRA projected levels [of 21 million] at 6.9 million annually. Assuming realistic automobile costs and more-plausible outside-the-corridor ridership, the 2035 interregional ridership would be 77 percent below the CHRSA forecast, at 4.8 million annually. Even if the number of automobile drivers switching to rail equals the European experience, ridership would still fall nearly 65 percent short of the CHSRA projection.

    Thus, the CHSRA’s downgraded ridership estimate of 21 million people is still likely to be wildly exaggerated. The promise to operate the high-speed trains without subsidies, therefore, is fantasy using realistic ridership numbers: calculations by Joseph Vranich and Wendell Cox concluded that day-to-day operating losses will generate annual deficits totaling between $124 million and $373 million at the operating-cost midpoint projected by CHSRA for 2035. Subsidies would be needed to backfill these deep deficits.

    The money secured to date is far less than needed to complete the project. With no clear path to obtaining the funds needed for completion, many Californians now decry “the train to nowhere.” And realistic ridership projections show that annual subsidies will likely be needed to keep the trains rolling, if the project is built at all.

    The Pathologies of Government: A Lesson in Perverse Political Incentives

    California’s high-speed rail project highlights that governments do a poor job of assessing the costs and benefits of capital-investment projects since politicians do not personally bear the costs and benefits of the projects or of their calculation errors. In fact, politicians have an incentive to exaggerate the benefits and hide true costs, as was done with the bullet train, to build support for these projects. In contrast, private investors and private operators generally have an incentive to develop accurate projections of capital projects because, if they are wrong, they will typically bear the costs, and, if they are right, they can reap any profits from the wise stewardship of resources.

    Train officials and supporters have repeatedly told the public that the train will cover operating costs, will not require any operating subsidies, and “generate sufficient cash flow to attract private capital” for future construction—even the first leg from San Jose to Shafter will feature “non-subsidized operations,” according to CHSRA officials. If the project is as good of an investment as supporters claim, then taxpayer/government involvement to bankroll the construction and operation is unnecessary. Private investors and private operators can, and should, provide this transportation service.

    But the evidence indicates that the high-speed rail project will not be self-sustaining. As it will waste scare resources, the bullet train qualifies as a boondoggle and should not be undertaken.

    The Recommendation

    The serious discrepancies between the original plan for the high-speed rail project and current promises warrant a statewide ballot referendum on whether to proceed with the project and, if so, how. There is growing opposition to the project now that more information is known about the true cost, slower routes, and financing uncertainties.

    In February 2015, Gavin Newsom (D), California Lieutenant Governor and former mayor of San Francisco,said:

    We’re not even close to the timeline (for the project), we’re not close to the total cost estimates, and the private-sector money and the federal dollars are questionable. . . . I am not the only Democrat that feels this way. I am one of the few that just said it publicly. Most are now saying it privately.

    Following Newsom’s candid remarks, Assemblywoman Patty Lopez (D-San Fernando) said that she now opposes the project, and that five other legislative Democrats are also considering a switch to opposing it. Lopez supports a re-vote on the issue.

    A January 2016 poll found that 53 percent of Californians support killing the high-speed rail project and using the unspent money on water projects; only 31 percent do not. Dan Walters of the Sacramento Beeechoes this sentiment: “We should put at least as much effort into protecting our vital water supply as we are wasting on a bullet train that we neither want nor need.”

    A March 2016 survey found that only 26 percent of likely voters in California consider the high-speed train as “very important” for the future of California. More Californians, 27 percent, view it as “not at all important.” A majority of likely voters, 54 percent, now oppose building the high-speed rail system.

    Californians deserve a re-vote on the high-speed rail project. Voters should use the opportunity to kill this unnecessary and expensive boondoggle sold to the public using tricks and deceit.

    ******

    This piece was originally published by the Independent Institute.

    Written by Lawrence J. McQuillan, PhD, and Hayeon Carol Park, MA.

  • More Californian’s Continue to Drive Despite Policies to Discourage

    “California Commuters Continue to Choose Single Occupant Vehicles,” according to a report by the California Center for Jobs and the Economy. The Center indicated:

    “The recent release of the 2014 American Community Survey data provides an opportunity to gauge how California commuters have responded to this shifting policy. The data clearly reflects that even with the well-documented and rapidly rising costs of the state’s traffic congestion and costs associated with the deteriorating condition of the state’s roads, California workers continue to rely on single occupant vehicles for the primary mode of commuting.  Moreover, their reliance on this mode of travel continues to grow both in absolute and relative terms (emphasis in original).

    California has experienced substantial growth since 1980. There are approximately 7,000,000 more workers today than 35 years ago. The Census Bureau data shows that 83 percent of the new commuting has been by single-occupant automobile. Working at home accounted for 11 percent of the new commuting, while transit accounted for less than one half that figure, at 4.5 percent (Figure). In 1980, transit accounted for more than three times the volume as working at home. By 2014, the number of people working at home exceeded that of transit commuters.

    The Center noted that state policies to discourage single-occupant commuting had been of little effect:

    “The substantial investments in public transit, bike lanes, and other alternative modes have not produced major gains in commuter use.  Instead, these investments appear to have simply shifted the choices made by commuters who already are committed to getting to work through modes other than single occupant vehicles.   From 1980 to 2000, public transit use grew by 116,000 while “other” modes dropped by the same amount.  From 1980 to 2005, public transit use grew by 121,000 while “other” modes dropped by 113,000.  In the following years, 1/3 of the growth in public transit and “other” modes was offset by reductions in carpool use.”

    The report credited impressive public transit gains in the San Francisco Bay Area, but went on to say that:

    “even in the Bay Area, growth of public transit and the “other modes” has come largely from the shrinking relative use of carpooling.” 

    While improving transit ridership is a good thing, to the extent that it removes passengers from car pools, there is no gain in traffic, because the car and driver are still on the road.

    The report laid considerable blame on the cost of houses in California:

    “California, the growing body of land use, energy, CEQA, and other regulations affecting housing cost and supply has put both the cost of housing ownership and rents within traditional employment centers out of the reach of many households.” 

    California’s housing affordability is legendarily desperate. Since the imposition of strong land use regulations began in the early 1970s, the median house price has risen from three times (or less) times median household incomes in of the state’s metropolitan areas to over nine times today in the San Jose and San Francisco metropolitan areas, over eight times in the Los Angeles and San Diego areas and over five times in the Riverside-San Bernardino area (Inland Empire).

    Perhaps the most important “take-away” from the report was that: “The current de facto policy of trying to reduce commuting by increasing congestion and its associated costs to commuters has to date not shown itself to be successful.” Simply stated, the vast majority of jobs and destinations in all of California’s urban areas are not accessible by transit in a reasonable time. The question for most California commuters is, for example, not whether to drive or take transit to work, but whether to go to work at all, since most jobs are not readily accessible except by car.

  • Geography and the Minimum Wage

    Most commentary on California’s decision to increase the state minimum wage to $15 over time is either along the lines of it being a boon to minimum-wage workers and their families or a disaster for California’s economy.  Neither is accurate.  Different regions sill see different outcomes.  Central California, the great valley that runs from Bakersfield to Redding, once again, will bear a disproportionate burden. 

    Some workers’ income will increase, but hardly enough to afford a standard of living that most readers would find acceptable.  At 40 hours a week and working 52 weeks a year, the minimum-wage worker will earn $31,200 a year before taxes.  Try living on that in San Francisco or Santa Barbara.

    Then, there are the workers who will lose their job, or never get one in the first place.

    A $15 an hour wage would devastate some economies, but California is different.  Individuals and families may be devastated.  Regions may be devastated.  Coastal California, with the possible exception of Los Angeles and the far northern counties, will do just fine.  You will probably not be able to see an effect in their data.

    Central California is another story.

    California is in transition from a tradable goods and services producing economy to a consumption and non-tradable services producing economy.  Tradable goods and services are goods and services that can be consumed far from where they are produced.  Manufacturing is the classic example of tradable products, but thanks to the internet, services are also increasingly tradable. 

    These days, many services that were once non-tradable are tradable.  Tax preparation, legal research, accounting, and term-paper writing are examples of tradable services that were once non-tradable.  As a friend of mine says, anything done at a computer can be done anywhere in the world.

    Non-tradable services are those that must be consumed where they are produced.  Lawn care, haircuts, and home maintenance are some examples.

    The distinction is important because a minimum wage increase affects each differently.

    The initial impact of a minimum wage increase is to increase the cost of the goods or services, tradable or non-tradable.  It’s what happens after the increase in cost that makes the difference.

    Consider a minimum wage increase on one side of a street and not the other side.  You might consider walking across the street for a burrito, cup of coffee, or haircut, if the price is cheaper there.  This is the substitution effect.  It will be almost non-existent for non-tradable services with a statewide minimum wage increase.  No one will drive to Arizona for a haircut or cup of coffee. 

    Non-tradable services are left with only a price effect, to be discussed in a bit.

    Tradable producers, though, face a formidable substitution effect.  They are competing with producers worldwide.  If they raise their prices, it is likely that enough customers will switch to other producers that tradable producers will be forced to relocate for lower-wage workers of go out of business.  If they lack monopoly power, they are unlikely to be able to absorb the cost increase.

    One impact of California’s minimum-wage increase, then, will be an acceleration of California’s transformation to non-tradable services production and the permanent loss of tradable sector jobs, outside of fields like software.

    It is fundamental to economics that the higher the cost of any good or service, the less that will be consumed.  This is the price effect, and it affects tradable producers differently than non-tradable producers.

    Unless they have monopoly power, tradable producers will not see a price effect.  The world price will remain the same.  Total world consumption will stay the same.  The distribution of sellers, however, will change.  Agriculture is an excellent example of competitive world markets.  California will likely provide a smaller share of the world’s agricultural output.

    If the tradable producer has monopoly power, the price effect may be large or small.  If it is small, they will see a small decline in sales.  If it is large, they may have to absorb the increase, sacrificing some of their monopoly profits.

    Non-tradable producers will face a price effect.  How big that price effect is depends on the wealth of their customers and how essential the service is to the consumer.  A wealthy person will probably not change their behavior because of, say, a ten percent increase in the cost of haircuts.  A poor person may reduce the frequency of haircuts.

    Tradable sector and non-tradable sector businesses will attempt to minimize the cost increase of a minimum wage hike.  This is most easily achieved by replacing some labor with capital.  This is the production function effect.  Assembly line workers may be replaced with robots.  Waiters may be replaced with tablets at the table, as we’ve already seen in some restaurants.

    Some would argue that there is another effect, an income effect.  The idea is that the increased income, and spending of minimum-wage workers will more than offset the price and substitution effects.  This violates another fundamental economic principle, the one that asserts that there are no free lunches.  The minimum wage earner’s new income is not new wealth miraculously provided by the minimum-wage fairy.  For every new dollar the minimum-wage worker has to spend, someone else has one less dollar to spend. In fact, due to inefficiencies (distortions in product mix and markets resulting from non-market prices) created by the transfer, someone else must forego more than one dollar in order to create the dollar provided by wage increase.

    Analysis of price and substitution effects implies that different California regions will be affected differently by the minimum wage increase.

    Because wages are generally lower in Central California than in Coastal California, the minimum wage increase will be more impactful in Central California, amplifying both price and substitution effects relative to Coastal California.  Central California’s economy is also more dependent on tradable-goods production than is Coastal California, it will, therefore, be hurt more by the decline in tradable-goods producers.  Similarly, because Central California’s income is less than Coastal California’s, it will also see a greater price effect on its non-tradable producers.

    Central California is seemingly in perpetual recession.  Even in good times, many Central California counties see double-digit unemployment.  Colusa County’s unemployment rate was over 20 percent in the most recent data release.  The region also sees disparate impacts from California’s high energy costs, water policies, and regulatory infrastructure, all of which hit them much harder.

    Coastal Californians underestimate the economic differences between California’s regions.  They are huge.  California simultaneously has some of America’s wealthiest communities and some of its poorest.  It’s important that we remember that California, with about 12 percent of America’s population, has 35 percent of the nation’s welfare recipients.

    Most of California’s wealthy coastal citizens never see California’s poor inland communities.  Yet, wealthy Coastal Californians — particularly from San Francisco — dominate state policy.  They implement policy as if the entire state were as wealthy as the communities they live in.  The minimum wage increase is just the latest example.

    Decency would seem to require that California find ways to accommodate the circumstances and needs of our least advantaged citizens and regions.  We don’t though.  Instead we create policy that hurts our least advantaged and makes their challenging lives even more so.

    Bill Watkins is a professor at California Lutheran University and runs the Center for Economic Research and Forecasting, which can be found at clucerf.org.

    Unemployed woman photo by BigStockPhoto.com.