Tag: California

  • It’s Becoming Springtime for Dictators

    In a rare burst of independence and self-interest, the California Legislature, led by largely Latino and Inland Democrats, last month defeated Gov. Jerry Brown’s attempt to cut gasoline use in the state by 50 percent by 2030. These political leaders, backed by the leftovers of the once-powerful oil industry, scored points by suggesting that this goal would lead inevitably to much higher fuel prices and even state-imposed gas rationing.

    Days later, however, state regulators announced plans to impose similarly tough anti-fossil-fuel quotas anyway. This pronouncement, of course, brought out hosannas from the green lobby – as well as their most reliable media allies. Few progressives today appear concerned that an expanding, increasingly assertive regulatory state, as long as it errs on the “right side,” poses any long-term risks.

    Welcome to the new age of authority, in which voters’ mundane concerns are minimized, and the bureaucracy – backed by an elected executive – rules the roost, armed with full confidence that it knows best. Nor is this merely a California phenomenon. Rule by decree has become commonplace in Washington, D.C., as President Obama seems to dictate policies on everything from immigration to climate change without effective resistance from a weak Congress and a listless judiciary.

    While no modern leader since President Richard Nixon has been so bold in trying to consolidate power, this centralizing trend has been building for decades. Since 1910, the federal government has doubled its share of all government spending to 60 percent and grows ever more meddlesome in people’s daily lives. Its share of GDP has now grown to the highest level since the Second World War.

    Read the entire piece at The Orange County Register.

    Joel Kotkin is executive editor of NewGeography.com and Roger Hobbs Distinguished Fellow in Urban Studies at Chapman University, and a member of the editorial board of the Orange County Register. He is also executive director of the Houston-based Center for Opportunity Urbanism. His newest book, The New Class Conflict is now available at Amazon and Telos Press. He is also author of The City: A Global History and The Next Hundred Million: America in 2050. He lives in Orange County, CA.

    Flickr photo by Pranav Bhatt of drivers in Los Angeles.

  • Gas Tax Still a Tax

    Governor Jerry Brown recently released a plan to find funds to fix California’s roads. Infrastructure funding is one of the essential roles of government, so it’s refreshing to hear that our otherwise dysfunctional state government is taking action on this front. But who will be paying for it? Those who use the roads most, that is, California’s drivers, who disproportionately tend to be members of the middle and working classes.

    The Brown plan has two main components: a $65 highway user fee, and a lifting of the gas tax by 6 cents per gallon. The rise of the California state gas tax from 66 cents to 72 cents and the imposition of an additional registration fee are the products of a fairly standard view on infrastructure funding. The underlying thought is that the people who use infrastructure should contribute to its maintenance. After all, this is how private enterprises and public utilities from the Washington State Ferries system to the Los Angeles Department of Water and Power stay afloat. Tolls and fees for road use are nothing new, so why should anybody be concerned with small increases in California’s fees, especially when the funds go to so crucial a cause as infrastructure repair?

    Because although these new costs may seem to be a pittance, for middle and working-class families every rise in the cost of living eats away at social mobility by reducing the amount of cash individuals can invest in homeownership, education, and other middle-class privileges

    The service-fee model of infrastructure maintenance is theoretically sound. But every policy comes with unintended consequences. In California, the cost of living is driving middle and working-class families to cheaper climes like Texas and Florida in droves every year.

    The blue regulate-and-tax model does have its uses. It’s important that there are reasonable regulations addressing every area of economic activity, and for certain public goods like vehicle and firearm registration, slight fees are sensible. But regulations have a way of cropping up frequently and never going away, even once they’ve become irrelevant. One regulation turns to four, four to twelve, and taxes and fees proliferate as well. What was once a fair and reasonable system devolves into a tangled web of incomprehensible rules and restrictions, veritably stifling growth, innovation, and freedom.

    That’s where the regulate-and-tax model of Governor Brown’s infrastructure funding plan is leading us. California drivers already face a plethora of rules and fees, and adding a gas tax and registration fee only complicates the system more. Whatever the benefits are for the state’s coffers, the results are disastrous for those who will be most affected.

    And it’s not as if the proposed new fees revolutionize California’s infrastructure in any way. The funding plan won’t reduce congestion or improve the flow of people, goods or ideas around the state. The American Interest reports on some important trends in transportation which the money-grubbing Brown plan largely ignores, including smarter cars and busses and ultimately autonomous vehicles.

    This funding plan is a short-term fix to repair crumbling infrastructure that was built decades ago. Were it something more visionary and transformative, like a series of test courses for driverless electric vehicles, perhaps the added weight on the middle class could be justified. But, like all blue policies, it is merely an attempt to repair a system that was built in another time, for another world. There’s nothing imaginative in it at all.

    There must be a better way.

    Most sensible political observers would agree that investment in infrastructure funding is one of the state’s most important responsibilities. It pays for itself in time, and the upfront cost is too high for the private sector to take on. The government is the only actor that can adequately plan for and fund infrastructure on a mass scale, and it should do it well.

    But to pay for the repair of infrastructure, we shouldn’t soak the very people whom that repair is meant to help — the masses of middle-class and working-class California drivers. While service fees are justifiable at times, there are some things, like convenient transportation and quality education, that the government should strive to provide as a workable starting point for upward mobility.

    The money has to come from somewhere. In the $168 million 2015 California state budget, only $12 million went to transportation and infrastructure development. And of the funds that went to other areas, especially the $50 million apiece going to K-12 Education and Health and Human Services, not all of the money the state spends is going into teaching children or healing illnesses. Public employee pensions make up an estimated 19% of the state’s budget, and while pensions are important for government workers, they don’t particularly benefit the broader economy or the masses of California’s population. They also tend to drive polities into bankruptcy, as the fates of Stockton, Mammoth Lakes, and San Bernardino demonstrate.

    California’s misaligned spending priorities are as titanic as those of the federal government. Funds ought to be redistributed to investments in infrastructure. More importantly, funding to other areas should be more efficient, with more money going directly to services the government is pledged to provide, so that existing taxation could be better dedicated to crucial public investments without soaking the middle and working classes.

    Budget reform is the most pressing issue California faces today. That’s why the issue of Governor Brown’s gas tax proposal is so important this year. Only under a reformed budget system can the state make investments in infrastructure, education, and innovation, and run them properly, to promote broad-based economic growth and social mobility. Slapping taxes on the lower classes is a cheap, easy way out of making the uncomfortable steps necessary to realign the state budget.

    Flickr photo by Pranav Bhatt of drivers in Los Angeles

    Luke Phillips is a student studying International Relations at the University of Southern California. He has written for the magazine The American Interest and is a research associate at the Center for Opportunity Urbanism.

  • When Stocks Drop, California Suffers

    I recently made a couple of tweets/Facebook posts pointing out that market declines threaten California’s budget surplus. I referenced articles in the WSJ and Bloomberg, and I thought the observation was non-controversial—almost banal.

    So I was surprised at the feedback. One person asked why. Another said it doesn’t mean anything until holders of declining assets cash out. Yet another pointed out that the wealthy were back to where they were eight months ago. Finally, one said we wouldn’t know of the impact until after the end of the next budget year.

    Let’s answer the question “Why?” first: A decline in asset prices would have a detrimental impact on California’s budget because California’s tax system is extraordinarily progressive, with the result that a few really wealthy people pay a huge proportion of California’s taxes. California’s Legislative Analyst’s Office has estimated that the top one percent of California’s population paid half of the state’s income taxes in 2012. Income taxes are California’s major revenue source, comprising about 65 percent of the state’s income.

    Since much of wealthy people’s income is from increased asset values—capital gains—rather than from wages that have been paid to them, their income, and thus California’s tax revenue, is more volatile than the economy. California revenue tracks changes in asset values more closely than it tracks changes in economic growth. See the following chart:

    The increased revenues from the dot-com boom, the 2000s asset boom, and today’s boom are readily apparent in the chart. The declines that inevitably follow booms are also apparent.

    California goes through these repeating cycles like a bad dream. Asset prices increase. California’s revenues increase. Sacramento spends that windfall as if asset prices will continue to rise forever. Worse, legislators commit to future spending as if the boom will continue forever.

    Of course, booms don’t go on forever. Inevitably, prices fall. The gains that drive California’s revenue turn into losses, and California faces yet another budget crisis. Sacramento responds by raising taxes on the wealthy, and increasing the state’s reliance on the few wealthy. This pretty much guarantees that the problem will be even worse in the next cycle.

    It’s a self-reinforcing boom and bust cycle of ever increasing revenue volatility.

    It’s amazing to me that California’s leadership continues to do this, and that Californians allow it. It can only be possible because so few Californians understand the state’s finances. The people who responded to me are relatively well informed; far better informed than most Californians. Yet, even they don’t know how California’s revenues work.

    It appears that California’s susceptibility to asset volatility is California’s best kept secret. That needs to change.

    Governor Brown was hailed as a hero when proposition 30 was passed, raising taxes on those who earn over $250,000 a year. It was even retroactive. California’s revenues soared, a result of the combination of new taxes and a huge bull market on Wall Street. It was said that Brown had solved California’s deficit problem. What he really did was sow the seeds of California’s next budget crisis.

    What about the next response I heard, the objection that losses have to be realized before they impact California’s budget? Can we be realistic? The people who pay over half of California’s income taxes have resources that are unimaginable to most of us. You can bet your net worth that, for tax purposes, they recognize losses as quickly as possible and do their best to never realize gains. The gains we’ve seen were only reluctantly recognized. The losses will be enthusiastically recognized.

    The comment about retained wealth—that the wealthy were back to where they were eight months ago—is a red herring. Wealth is irrelevant. Income taxes are paid on changes to wealth, not wealth. And, we don’t have to wait until after the fact, or until the end of the fiscal year, to know what the story will be. We don’t even need a real bust to see California’s surplus slip away. The surplus is dependent on increasing asset values. It’s not necessary for asset prices to decline for the surplus to be eliminated. All that is required is that asset values cease increasing.

    I thought it was irresponsible for people to cheer California’s surplus without at least recognizing its fragility. Ignoring the fragility now, when asset prices are especially volatile, is foolhardy. Our governor and legislators know what will become of California’s surplus when asset prices decline. They should be developing a plan.

    Of course, California’s leadership is not working on a plan. Instead, the best of them (admittedly a low hurdle) continue to pat themselves on the back and hope for the best. Some do worse by attempting to increase California’s spending even more.

    Besides developing a plan to deal with the sure-to-come deficit, Sacramento should be working on a plan to make California’s revenues more closely track broad economic activity, instead of volatile asset prices. This would require a broader tax base and a less progressive income tax. Unfortunately, that’s not likely to happen.

    Bill Watkins is a professor at California Lutheran University and runs the Center for Economic Research and Forecasting, which can be found at clucerf.org.

    Flickr photo by Thomas Hawk: The Good Life; the Ritz Carlton, Laguna Niguel, California.

  • California: “Land of Poverty”

    For decades, California’s housing costs have been racing ahead of incomes, as counties and local governments have imposed restrictive land-use regulations that drove up the price of land and dwellings. This has been documented by both Dartmouth economist William A Fischel and the state Legislative Analyst’s Office.

    Middle income households have been forced to accept lower standards of living while less fortunate have been driven into poverty by the high cost of housing.Housing costs have risen in some markets compared to others that the federal government now publishes alternative poverty estimates (the Supplemental Poverty Measure), because the official poverty measure used for decades does not capture the resulting differentials. The latest figures, for 2013, show California’s housing cost adjusted poverty rate to be 23.4 percent, nearly half again as high as the national average of 15.9 percent.

    Back in the years when the nation had a "California Dream," it would have been inconceivable for things to have gotten so bad — particularly amidst what is widely hailed as a spectacular recovery. The 2013 data shows California to have the worst housing cost adjusted poverty rate among the 50 states and the District of Columbia. But it gets worse. California’s poverty rate is now more than 50 percent higher than Mississippi, which long has set the standard for extreme poverty in the United States (Figure 1).

    The size of the geographic samples used to estimate the housing adjusted poverty rates are not sufficient for the Supplemental Poverty Measure to produce local, county level or metropolitan area estimates. However, a new similar measure makes that possible.

    The California Poverty Measure                           

    The Public Policy Institute of California and the Stanford Center on Poverty and Inequality have collaborated to establish the "California Poverty Measure," which is similar to the Supplemental Poverty Measure adjusted for housing costs.

    The press release announcing release of the first edition (for 2011) said that: "California, often thought of as the land of plenty" in the words Center on Poverty and Inequality director Professor David Grusky, is "in fact the land of poverty."

    The latest California Poverty Measure estimate, for 2012, shows a statewide poverty rate of 21.8 percent, somewhat below the Supplemental Poverty Measure and well above the Official Poverty Measure that does not adjust for housing costs (16.5 percent).

    The California Poverty Measure also provides data for most of California’s 58 counties, with some smaller counties combined due to statistical limitations. This makes it possible to estimate the California Poverty Measure for metropolitan areas, using American Community Survey data.

    Metropolitan Area Estimates

    By far the worst metropolitan area poverty rate was in Los Angeles, at 25.3 percent. The Los Angeles County poverty rate was the highest in the state at 26.1 percent, well above that of Orange County (22.4 percent), which constitutes the balance of the Los Angeles metropolitan area. However, the Orange County rate was higher than that of any other metropolitan area or region in the state (Figure 2). San Diego’s poverty rate was 21.7 percent. Perhaps surprisingly, Riverside-San Bernardino (the Inland Empire), which is generally perceived to have greater poverty, but with lower housing costs, had a rate of 20.9 percent. The two counties, Riverside and San Bernardino had lower poverty rates than all Southern California counties except for Ventura (Oxnard) and Imperial.

    The San Francisco metropolitan area had a poverty rate of 19.4 percent, more than one-fifth below that of Los Angeles. San Jose has a somewhat lower poverty rated 18.3 percent (Note 1). The metropolitan areas making constituting the exurbs of the San Francisco Bay Area had a poverty rate of 18.7 percent. This includes Santa Cruz, Santa Rosa, Stockton and Vallejo. Sacramento had the lowest poverty rate of any major metropolitan area, at 18.2 percent.

    The San Joaquin Valley, stretching from Bakersfield through Fresno to Modesto (Stockton is excluded because it is now a San Francisco Bay Area exurb) had a poverty rate of 21.3 percent, slightly below the state wide average of 21.8 percent. The balance of the state, not included in the metropolitan areas and regions described above had a poverty rate of 21.2 percent.

    County Poverty Rates

    As was noted above, Los Angeles County had the highest 2012 poverty rate in the state (Note 2), according to the California Poverty Measure (26.1 percent). Tulare County, in the San Joaquin Valley had the second-highest rate at 25.2 percent. Somewhat surprisingly, San Francisco County with its reputation for high income had the third worst poverty rate in the state at 23.4 percent. This is driven, at least in part, by San Francisco’s extraordinarily high median house price to household income ratio (median multiple). In this grisly statistic, it trails only Hong Kong, Vancouver and Sydney in the latest Demographia International Housing Affordability Survey. Wealthy Santa Barbara County has the fourth worst poverty rate in the state, at 23.8 percent. The fifth highest poverty rate is in Stanislaus County, in the San Joaquin Valley (county seat Modesto), which is already receiving housing refugees from the San Francisco Bay Area, unable to pay the high prices (Figure 3).

    The two lowest poverty rates were in suburban Sacramento counties (Note 2). Placer County’s rate was 13.2 percent and El Dorado County’s rate was 13.3 percent. Another surprise is Imperial County, which borders Mexico and has generally lower income. Nonetheless, Imperial County has the third lowest poverty rate at 13.4 percent. Shasta County (county seat Redding), located at the north end of the Sacramento Valley is ranked fourth at 14.8 percent. Two counties are tied for the fifth lowest poverty rate (16.0 percent), Marin County in suburban San Francisco and Napa County, in the exurban San Francisco Bay Area (Figure 4).

    Weak Labor Market and Notoriously Expensive Housing

    The original Stanford Center on Poverty and Inequality press release cited California’s dismal poverty rate as resulting from "a weak labor market and California’s notoriously expensive housing." These are problems that can be moderated starting at the top, with the Governor and legislature. The notoriously expensive housing could be addressed by loosening regulations that allow more supply to be built at lower cost. True, the new supply would not be built in Santa Monica or Palo Alto. But additional, lower cost housing on the periphery, whether in Riverside County, the High Desert exurbs of Los Angeles and San Bernardino Counties, the San Francisco Bay Area exurbs or the San Joaquin Valley could begin to remedy the situation.

    The improvement in housing affordability could help to strengthen the weak job market, by attracting both new business investment and households moving from other states.

    Regrettably, Sacramento does not seem to be paying attention. Liberalizing land use regulations is not only absent from the public agenda, but restrictions are being strengthened (especially under the requirements of Senate Bill 375). In this environment, metropolitan areas like Los Angeles, San Francisco, San Jose and San Diego could become even more grotesquely unaffordable, and the already high price to income ratios in the Inland Empire and San Joaquin Valley could worsen. All of this could lead to slower economic growth and to even greater poverty, as more lower-middle-income households fall into poverty.

    Note 1: San Benito County is excluded from the San Jose metropolitan area data. The California Poverty Measure does not report a separate poverty rate for San Benito County.

    Note 2: Among the counties for which specific poverty rates are provided.

    Wendell Cox is Chair, Housing Affordability and Municipal Policy for the Frontier Centre for Public Policy (Canada), is a Senior Fellow of the Center for Opportunity Urbanism (US), a member of the Board of Advisors of the Center for Demographics and Policy at Chapman University (California) and principal of Demographia, an international public policy and demographics firm.

    He is co-author of the "Demographia International Housing Affordability Survey" and author of "Demographia World Urban Areas" and "War on the Dream: How Anti-Sprawl Policy Threatens the Quality of Life." He was appointed to three terms on the Los Angeles County Transportation Commission, where he served with the leading city and county leadership as the only non-elected member. He served as a visiting professor at the Conservatoire National des Arts et Metiers, a national university in Paris.

    Photograph: Great Seal of the State of California by Zscout370 at en.wikipedia [CC BY-SA 3.0], from Wikimedia Commons

  • Progressive Policies Drive More Into Poverty

    Across the nation, progressives increasingly look at California as a model state. This tendency has increased as climate change has emerged as the Democratic Party’s driving issue. To them, California’s recovery from a very tough recession is proof positive that you can impose ever greater regulation on everything from housing to electricity and still have a thriving economy.

    And to be sure, the state has finally recovered the jobs lost in the 2007-09 recession, largely a result of a boom in values of stocks and high- end real estate. Things, however, have not been so rosy in key blue-collar fields, such as construction, which is still more than 200,000 jobs below prerecession levels, or manufacturing, where the state has lost over one-third of its employment since 2000. Homelessness, which one would think should be in decline during a strong economy, is on the rise in Orange County and even more so in Los Angeles.

    The dirty secret here is that a large proportion of Californians, roughly one-third, or some 3.2 million households, as found by a recent United Way study, find it increasingly difficult to keep their heads above water. The United Way study, surprisingly, has drawn relatively little interest from a media that usually enjoys highlighting disparities, particularly racial gaps. Perhaps this reflects a need to maintain an illusion of blue state success. If Republican Pete Wilson were still governor, I suspect we might have heard much more about this study.

    Read the entire piece at The Orange County Register.

    Joel Kotkin is executive editor of NewGeography.com and Roger Hobbs Distinguished Fellow in Urban Studies at Chapman University, and a member of the editorial board of the Orange County Register. He is also executive director of the Houston-based Center for Opportunity Urbanism. His newest book, The New Class Conflict is now available at Amazon and Telos Press. He is also author of The City: A Global History and The Next Hundred Million: America in 2050. He lives in Orange County, CA.

  • Latino Politicians Putting Climate Change Ahead of Constituents

    Racial and economic inequality may be key issues facing America today, but the steps often pushed by progressives, including minority politicians, seem more likely to exacerbate these divisions than repair them. In a broad arc of policies affecting everything from housing to employment, the agenda being adopted serves to stunt upward mobility, self-sufficiency and property ownership.

    This great betrayal has many causes, but perhaps the largest one has been the abandonment of broad-based economic growth traditionally embraced by Democrats. Instead, they have opted for a policy agenda that stresses environmental puritanism and notions of racial redress, financed in large part by the windfall profits of Silicon Valley and California’s highly taxed upper-middle class.

    Nowhere in California is this agenda more clearly manifested than with state Senate President pro Tem Kevin de León, who represents impoverished East Los Angeles. De León has proclaimed addressing “climate change” as the Senate’s “top priority” and is calling for, among other things, disinvestment from fossil fuel companies. Rarely considered seem to be the actual impacts of these policies on the daily lives of millions of working- and middle-class Californians.

    War on Blue Collar Jobs

    Despite vastly exaggerated claims about the prospects for so-called green jobs since the passage of Assembly Bill 32, the landmark 2006 climate change law, California is adopting policies detrimental to growing the higher-wage blue-collar sector. Green policies favoring expensive alternative energy have fostered energy prices that, for industrial users, are an estimated 57 percent higher than the national average. No surprise, then, that California has produced barely half the rate of new manufacturing jobs as the rest of the nation.

    Read the entire piece at the Orange County Register.

    Joel Kotkin is executive editor of NewGeography.com and Roger Hobbs Distinguished Fellow in Urban Studies at Chapman University, and a member of the editorial board of the Orange County Register. He is also executive director of the Houston-based Center for Opportunity Urbanism. His newest book, The New Class Conflict is now available at Amazon and Telos Press. He is also author of The City: A Global History and The Next Hundred Million: America in 2050. He lives in Orange County, CA.

    By Neon Tommy (Senator Kevin De Leon) [CC BY-SA 2.0], via Wikimedia Commons

  • Homebuyers Confront China Syndrome

    China has hacked our government, devastated or severely challenged our industries and enjoyed one of the greatest wealth transfers in history – from our households to its. China also benefits from by far the largest trade surplus with the United States and also owns 11 percent of our national debt.

    Sometimes it seems to be increasingly China’s world, and we just happen to live in it. Some, such as columnist Thomas Friedman and Daniel A. Bell, author of the newly published “The China Model,” even suggest we adjust our political system to more closely resemble that of the Chinese.

    Yet, a funny thing has happened on the way to global domination – the Chinese are coming here with their money, and, often, with their families. Rather than seeing China as the land of opportunity, more Chinese have been establishing homes in America, particularly in California, where they account for roughly one-third of foreign homebuyers, with upward of 70 percent paying cash. Overall Chinese investment in U.S. real estate has grown from $50 million in 2000 to $14 billion in 2013, surpassing all other foreign investors.

    Read the entire piece at The Orange County Register.

    Joel Kotkin is executive editor of NewGeography.com and Roger Hobbs Distinguished Fellow in Urban Studies at Chapman University, and a member of the editorial board of the Orange County Register. He is also executive director of the Houston-based Center for Opportunity Urbanism. His newest book, The New Class Conflict is now available at Amazon and Telos Press. He is also author of The City: A Global History and The Next Hundred Million: America in 2050. He lives in Orange County, CA.

  • California in 2060?

    The California Department of Finance (DOF) has issued population projections for the state’s counties to 2060.  Forecasts are provided for every decade, from a 2010 base. The DOF projects that the the state will grow from 37.3 million residents in 2010 to 51.7 million in 2060. This is a 0.7 percent annual growth rate over the next 50 years. By contrast, California’s growth rate was 1.7 percent annually over the last 50 years (1960-2010), and a much higher 3.0 percent in the growth heyday of 1940 to 1990. However, even with this slower rate, California is expected to grow slightly more quickly than the nation (0.6 percent annually).

    The current projections are considerably more conservative than those made by DOF less than a decade ago. In 2007, DOF forecast that California would have 60 million residents in 2050. The current population project for 2050 is substantially smaller, at 49.8 million.

    Metropolitan Complexes

    To understand where this growth is projected to take place — and not — we look at CSA’s (consolidated statistical areas).  CSA’s are economically connected, adjacent metropolitan areas. CSA’s require a 15 percent employment interchange between the metropolitan areas. Metropolitan areas themselves are defined by a 25 percent commuting interchange between outlying counties and central counties, each of which must have at least one-half of its population in the core urban area.

    As Michael Barone pointed out in his analysis of the 2014 population estimates, sometimes it is not obvious when one metropolitan area changes into another, as in the cases of San Francisco/San Jose and Los Angeles/Riverside-San Bernardino, which are CSA’s. Another example is New York and the southwestern Connecticut suburbs in Fairfield and New Haven counties. This is because there is no break in the continuous urbanization.

    Metropolitan Complexes in 2060

    If the DOF has it right, in a half century, California will be home to eight major metropolitan complexes. which I am defining as combined statistical areas (CSA’s) or  "stand alone" metropolitan areas with more than 1,000,000 population (Figure 1).

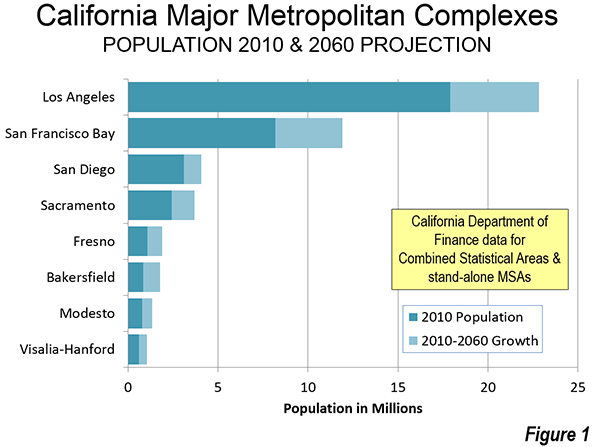
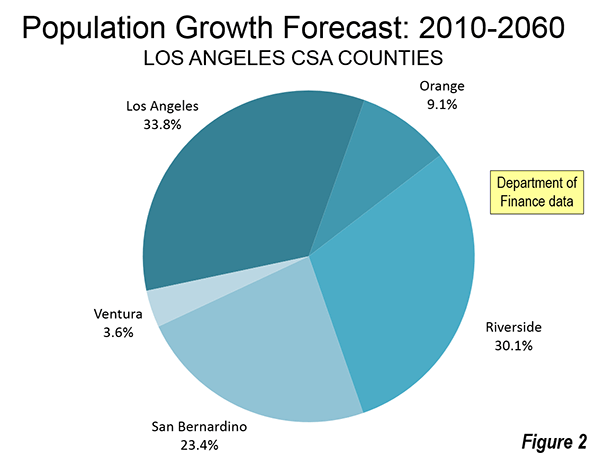
    The Los Angeles metropolitan complex (Los Angeles-Riverside, including Los Angeles, Orange, Riverside, San Bernardino and Ventura counties) would remain by far the largest, growing from 17.9 million to 22.8 million. One-third of the growth would be in Los Angeles County, and two-thirds outside. Riverside and San Bernardino counties would receive most of the growth (53 percent). Riverside County would grow the fastest, adding 68 percent to its population (Figure 2). Overall, the Los Angeles metropolitan complex would grow 27.3 percent, well below the projected state rate of 38.4 percent. This is quite a turnaround for a metropolitan complex that was once among the fastest growing in human history.

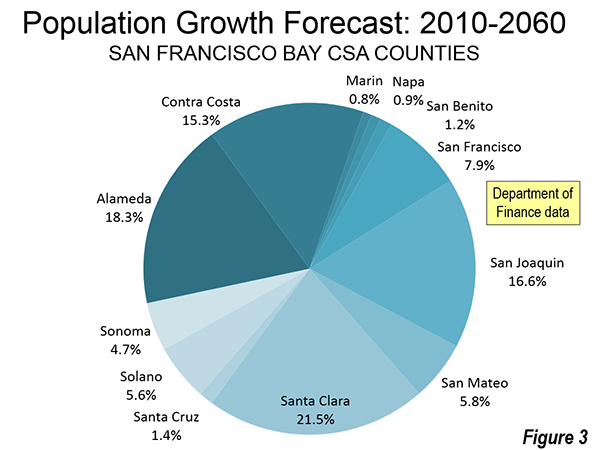
    The San Francisco Bay metropolitan complex, including the San Francisco, San Jose, Santa Cruz, Vallejo, Santa Rosa and Stockton metropolitan areas would grow a much faster 45.6 percent, from 8.1 million in 2010 to 11.9 million in 2060. The core city of San Francisco would add nearly 300,000, growing 36.3 percent to 1.1 million, (nearly the state rate). However, only 8 percent of the Bay Area growth would be in San Francisco, and 92 percent outside (Figure 3).  Four counties would add more than 500,000 residents, including Santa Clara (800,000), Alameda (680,000), Contra Costa (519,000), and newly added San Joaquin county, which is defined as the Stockton metropolitan area (620,000). San Joaquin County would also grow the fastest, at 90 percent, reaching 1.3 million. This growth is to be expected, since San Joaquin is one of the more peripheral counties, and where the metropolitan fringe (which includes the commuting shed) has been expanding the most.

    The San Diego metropolitan complex, a "stand alone" metropolitan area, would grow nearly as slowly as Los Angeles. San Diego’s population of 3.1 million in 2010 would rise to 4.1 million in 2060, an increase of 30.8 percent.

    Sacramento’s metropolitan complex includes the Sacramento, Truckee-Grass Valley and Yuba City metropolitan areas. Sacramento is projected to grow 52.8 percent, from 2.4 million in 2010 to 3.7 million in 2060.

    Four additional metropolitan complexes with more than 1 million population are projected, all in the San Joaquin Valley.

    Fresno, which includes Fresno County and Madera County, would grow from 1.1 million to 1.9 million, for a nearly 75 percent growth rate.

    Bakersfield (Kern County) would be the fastest growing among major metropolitan complexes. Bakersfield would grow from 840,000 in 2010 to 1.8 million in 2060, for a growth rate of 111 percent.

    Modesto (Stanislaus and Merced counties) would be the seventh largest metropolitan complex. From a 2010 population of 770,000, Modesto would grow 74 percent to 1,340,000. However, it is possible that by 2060 the commuting shed will reach the San Francisco Bay metropolitan complex, causing it to consume Modesto, as it already has Stockton.

    In 2060, California would get its eighth major metropolitan area, with Visalia-Hanford reaching 1,040,000, up 74 percent from 2010 (Tulare and Kings Counties).

    Outside of these areas, the largest metropolitan complex would be Salinas, which is projected to have 530,000 residents by 2060. However, Salinas is close enough to the San Francisco Bay Area that it could be added to that area’s commuting shed by 2040. The next largest metropolitan area would be El Centro (Imperial County), with a population projected to reach 340,000 by 2060. El Centro, however, could be included in the San Diego commuter shed by that time, making it a part of the San Diego metropolitan complex. The next largest metropolitan complexes would be in the northern Sacramento Valley, Redding and Chico, both approximately 300,000.

    Only 2.4 million Californians lived outside the 8 major metropolitan complexes, or 7 percent of the population. Growth in these areas is expected to be slow, with only a 27 percent increase to 2060.

    The Difficulty of Projections

    Of course, it is virtually impossible to accurately predict demographic trends 50 years into the future. California’s slower than expected growth in recent decades reflected general economic weakness since 1990, and the impact of ultra-high housing prices, particularly on the coast. However, the 2060 California projections provide an interesting view of the future from today’s perspective.

    Photo: Bakersfield: Fastest Growth Projected 2010 to 2060. “Bakersfield CA – sign” by nickchapman – originally posted to Flickr as P1000493. Licensed under CC BY 2.0 via Wikimedia Commons.

    Wendell Cox is principal of Demographia, an international public policy and demographics firm. He is co-author of the "Demographia International Housing Affordability Survey" and author of "Demographia World Urban Areas" and "War on the Dream: How Anti-Sprawl Policy Threatens the Quality of Life." He was appointed to three terms on the Los Angeles County Transportation Commission, where he served with the leading city and county leadership as the only non-elected member. He served as a visiting professor at the Conservatoire National des Arts et Metiers, a national university in Paris. Wendell Cox is Chair, Housing Affordability and Municipal Policy for the Frontier Centre for Public Policy (Canada), is a Senior Fellow of the Center for Opportunity Urbanism and is a member of the Board of Advisors of the Center for Demographics and Policy at Chapman University.

  • 21st Century California Careers

    California is undergoing profound change.  Most strikingly, people are leaving the Golden State, which was once the preferred destination of migrants worldwide.  California’s domestic migration has been net negative for over 20 years.  That is, for 20 years, more people have been leaving California for other states than have been arriving from other states.  The state’s population is only growing because of a relatively high birthrate, mostly among immigrants.

    Domestic migration is not a one-way street.  It may be net negative, but lots of people are coming to the state.  It’s just that more are leaving. Generally speaking, low and middle-income people are leaving.  Those coming tend to be wealthier and older than those leaving.  They are people who can afford California’s higher costs and limited opportunity.  These migratory trends are increasing income-inequality in America’s most unequal state.

    Businesses are leaving the state too, but not all businesses.  Tradable goods producers are leaving California, because the state has for ten years maintained the single worst business climate in America.  Tradable goods are goods that can be produced in one place and consumed in another.  Manufacturing is the classic example, but technology is changing what is a tradable good.

    Today, many jobs that used to be considered non-tradable services are now tradable services.  Back-office accounting functions can be done anywhere, as can legal research or title research.  Just about any job that is done at a computer is now a tradable service.

    Unless they have a monopoly, tradable goods and tradable service providers face relentless price competition.  California’s high-cost environment is forcing them to relocate to lower-cost communities to survive.  Tradable producers won’t be providing 21st Century California jobs.

    California, with its beaches, deserts, mountains, cosmopolitan cities and other attractions, is a major tourism destination.  These amenities also make California a wonderful place to live for those who can afford it.  So, wealthy people come to or stay in California, and then try to close the gate behind them.  Our cities become ever more divided between the older haves and the younger have-nots, between opulent consumption and not-so-much consumption.

    So who will provide jobs for 21st Century Californians?  In a single word the rich and upper middle class affluents. When they come as tourists, they spark demand for leisure and hospitality jobs.  Consequently, this sector has been California’s second most rapidly growing sector with over 15 percent (239,400 jobs) growth since the beginning of the recession in October 2007.  Only healthcare grew faster or created more California jobs.  Since it is hard to guide tourists or change bed sheets remotely, these are non-tradable services jobs. 

    The resident rich will also create jobs.  We see this already in places like Santa Barbara, where there are types of jobs that were unimaginable until recently.  People will come to your house to cook your gourmet meal, clean your house, bathe your dog, trim your toenails, and supervise your exercise. They’ll even bring an athletic gym in the back of a truck.  There are doggy day care centers, with web cams to watch your puppy while you’re separated.  There is a pet cremation center.  There is a dog bakery.  Some people make a living walking other people’s dogs, while some people make a living taking older, apparently poorly-motivated, people for exercise walks.   

    Huge amounts of money are spent on homes, and not just on the purchase.  Remodels are almost perpetual for some, and they are happy to pay huge sums for quality craftsmanship.  So it is with cars.  Car collectors used to be hands-on.  Today, many hire someone to restore their cars.

    The list of services that wealthy people are willing to pay for is unlimited.  Rich people, indeed all of us if we could afford it, enjoy paying someone else to do even mildly unpleasant chores. 

    This has resulted in rapid-for-California growth in non-tradable services jobs.  According to the California Employment Development Department, non-tradable services jobs grew 14 percent since 2000, while tradable-goods jobs declined by 24 percent.

    We’ve seen this before.  Domestic service was a large sector in Victorian England, peaking about 1891 when internal combustion engines and automobiles brought renewed economic growth.  This provided new opportunities for workers and raised the cost of service workers.

    California won’t see a new burst of economic or job growth in tradable sectors, particularly when the current tech boom evaporates. This is because California’s coastal elites will more successfully restrain growth than did their Victorian predecessors, perpetuating and increasing the state’s income inequality. 

    While the Irish Potato Famine and popular pressure forced the Corn Laws’ repeal, California’s elite face no such pressure.  In California’s one-party system, environmental purity easily trumps economic opportunity, and since California is only a state, it has a relief valve for disaffected citizens.  They can easily leave, and everyone that leaves increases the sustainability of the Coastal Elite’s no-growth, consumption based economy.

    California’s bureaucracy will provide plenty of jobs too.  When the bureaucracy decides everything, as it does in California, it’s a unique source of middle class jobs.  Working for California’s bureaucracy pays well, but other options can be more profitable.  Lobbying and fighting the bureaucracy can be big business.  As it is, every California community has people whose only job is to help businesses and people navigate the local bureaucracy.

    California’s formidable tech sector will diminish as a source of jobs and economic growth.  Venture capital’s changing economics and California’s ever-increasing costs will drive new growth to up-and-coming centers of innovation, places like Austin.  As it is, Austin, with 73.9 percent growth in tech-sector jobs between 2004 and 2014, saw more rapid growth in tech-sector jobs than San Jose, with 70.2 percent growth in tech-sector jobs over the same period.

    We’ll be left with a bunch of rich people and a big bureaucracy and the people who serve them.  California will still be a beautiful place, but it’ll hide an increasingly ugly social reality.

    Bill Watkins is a professor at California Lutheran University and runs the Center for Economic Research and Forecasting, which can be found at clucerf.org.

  • California Environmental Quality Act, Greenhouse Gas Regulation and Climate Change

    This is the introduction to a new report, California’s Social Priorties, from Chapman University’s Center for Demographics and Policy. The report is authored by David Friedman and Jennifer Hernandez. Read the full report (pdf).

    California has adopted the most significant climate change policies in the United States, including landmark legislation (AB 32)2 to lower state green- house gas (GHG) emissions to 1990 levels by 2020. Proposed new laws, and recent judicial decisions concerning the analysis of GHG impacts under the California Environmental Quality Act (CEQA), may soon increase the state’s legally mandat- ed GHG reduction target to 80% below 1990 levels by 2050.3 The purpose of California’s GHG policies is to reduce the concentration of human-generated GHGs in the atmosphere. The United Nations Intergovernmental Panel on Climate Change (IPCC) and many other scient.c organizations have predicted that higher GHG atmospheric concentra- tions generated by human activity could cause catastrophic climate changes.

    This paper demonstrates that even the complete elimination of state GHG emissions will have no measurable effect on climate change risks unless Cali- fornia-style policies are widely adopted throughout the United States, and particularly in other countries that now generate much larger GHG emissions. As California Governor Jerry Brown, a staunch proponent of climate change policies, recently observed, “We can do things in California, but if others don’t follow, it will be futile.”4 Similarly, the California legislature recognized at the time that AB 32 was enacted that at- mospheric GHG concentrations could only be stabilized through national and international actions, and that the state’s “far-reaching effects” would result from “encouraging other states, the federal government, and other countries to act.”5 Nevertheless, the extent to which California’s GHG policies have and may be likely to inspire similar measures in
    other locations, is rarely, if ever seri- ously evaluated by state lawmakers or the California judiciary. Absent such considerations, imposing much more substantial GHG mandates may not only fail to inspire complementary actions in other locations, but could even result in a net increase in GHG emissions should population and economic activity move to locations with much higher GHG emission rates than California.

    Key findings include the following:

    1. Most scientists agree that climate change risks are associated with the atmospheric accumulation of gases with high global warming potential includ- ing carbon dioxide and other gases attributed to human activity (collectively “carbon dioxide equivalent” or “CO2e” emissions). In 2011 California accounted for less than 1% of global CO2e emissions, and less than 0.065% of the worldwide annual CO2e emissions increase that occurred during 1990-2011. The state’s per capita CO2e emissions are much lower than in the rest of the United States, and comparable with relatively efficient advanced industrial countries like Germany and Japan.

    2. Despite its sizable population and economy, California generates a relatively minute, and falling, share of global CO2e emissions. The amount of global CO2e emissions and atmospheric concentrations would have been virtually unchanged, even if California’s GHG emissions were zero from 1990-2011, and remained at that level and assuming cur- rent emission trends in other locations continued through 2050.

    3. As recognized in AB 32 and by other state leaders, California’s ability to reduce climate change risks is not primarily a function of reducing state emissions. To have any measurable effect on global CO2e levels, the state must show that CO2e emissions can be reduced in a manner that also allows societies, such  as China and India, to improve the prospects for the vast majority of the population now living in or near poverty conditions. Over the last several decades, and especially since the mid-2000s, when climate change emerged as the state’s dominant environmental policy focus, California has failed to demonstrate that it can sustain a thriving middle and working class in addition to its most affluent  population.

    4. As sharply illustrated by Tesla’s recent decision to locate a $5 billion electric car facility, and 6,500 green jobs, in Nevada, California continues to suffer from a relatively poor global economic reputation as a place to do businesses outside high-end services and technology development. This drives even green energy manufacturing, let alone more traditional industries, from the state. State policies also reduce middle and working class employment opportunities, and increase housing and other key living expenses, such as energy costs.

    5. Ironically this has resulted in a mas- sive displacement of former state businesses and residents to other locations with higher per-capita CO2e emission levels. Since 1990, 3.8 million former residents, approximately the population of Oregon or Oklahoma, relocated to other states. Billions of dollars of  economic activity which might have remained in California have now been relocated to states and foreign countries with much higher emissions and weaker regulations. The cumulative net CO2e emission increases generated by the unprecedented movement of the state’s former residents and continuing loss of economic activity to higher GHG generating locations nearly offsets the GHG reductions that would  be achieved in California under AB 32.

    Section I of this paper provides background information about historical CO2e atmospheric concentrations, the extent of global CO2e emissions over time, climate change risks associated with these trends, and California’s relative contribution to worldwide CO2e emissions. This section demonstrates that California accounts for a minute and falling share of global GHG emissions.

    Section II discusses the development of California’s current climate change policies and shows that, in the past, California consistently recognized that CO2e emission reduction goals must be adopted in a measured, balanced man- ner to facilitate the concurrent need for economic growth and other important social objectives. Despite recent increases in corporate earnings by Silicon Valley corporations, increased home prices to pre-recession levels, and a decrease in reported unemployment rates, California also includes the nation’s largest number and highest percentage of people living in poverty. Nearly 24% of the state’s population is impoverished according to recently released U.S. Census Bureau statistics and faces enormous economic and social challenges.

    The state’s ability to meet its pressing social and economic challenges could be worsened by proposed legislation and judicial interpretations of CEQA mandating much more substantial GHG reductions than even sympathetic scientific assessments have found to be unachievable using any current technology.

    Sections III and IV show that, even assuming that California had zero CO2e emissions during 1990-2011, and for an additional four decades projected to 2050, global CO2e emission levels and atmospheric CO2e concentration would be virtually unaffected. In fact, unrealistic unilateral GHG reduction mandates can actually increase global CO2e levels and associated climate change risks by discouraging states and countries from adopting similar policies, and by displacing people and industries to locations with higher emissions.

    The achievement of significant, but more realistic GHG objectives and broad-based economic and social growth would have an immeasurably greater effect on atmospheric CO2e concentration levels if the state’s economic vitality proved a workable model that also allows for the achievement of critical social aims, such as reducing poverty and improving the standard of living for the middle class and those aspiring to join the middle class.

    Read the full report (pdf).