Tag: Canada

  • Ontario’s Labor & Housing Policies: US Midwest Opportunities?

    The Globe and Mail, a Canadian national newspaper, reports concerns raised by Magna International, Inc. that proposed provincial labor legislation (the “Fair Workplaces Better Jobs Act”) could result in seriously reduced economic competitiveness for Ontario, Canada’s most populous province (“Magna says new Ontario labour bill threatens jobs, investment”). Ontario accounts for about 40 percent of the Canadian economy and has approximately twice the gross domestic product of second ranking Québec. Magna is Canada’s largest employer in the automotive sector, which The Globe and Mail characterizes as “one of a handful of homegrown Canadian companies that have risen to the status of global giants.”

    Magna told the provincial parliamentary standing committee on finance that “For the first time in our 60 year history, we find ourselves in the very untenable position questioning whether we will be able to operate at historical levels in this province.” Stressing the need to remain competitive, the company added: “This is especially important when our main competitor to the south is working harder than ever to reduce costs, regulatory burdens and promote business efficiency and productivity. From our perspective, the province of Ontario seems to be moving in the opposite direction.”

    The proposed legislation would increase mandatory annual vacation and personal leave requirements and increase the minimum wage. The legislation would also reduce work scheduling flexibility. This would, according to Magna, make the “just in time” production “impossible,” in a North American industry that has used the practice to compete more effectively. According to Automotive News, Magna noted the difficulty of manufacturing where it calls the cost of electricity, payroll and pension costs and the provincial “cap and trade” policy are among the highest in the G-7. Magna said that the “Fair Workplaces Fair Jobs Act” is “extremely one-sided.

    At the same time that Ontario seems poised to make business investment more difficult, some key nearby US states are doing the opposite. Michigan, Indiana and Kentucky, all on the NAFTA Highway (Interstate 69) have enacted voluntary unionism laws (called “right to work”). Ohio has reduced taxes among the most of any state over the past five years. None of these states seems inclined to follow Ontario’s example. Another nearby regulation liberalizing state, Wisconsin (where voluntary unionism was also enacted), has just won the $10 billion first US plant to be built by China’s large electronics contractor Foxconn, edging out Ohio.

    Becoming Less Competitive: Ontario’s Housing Regulation

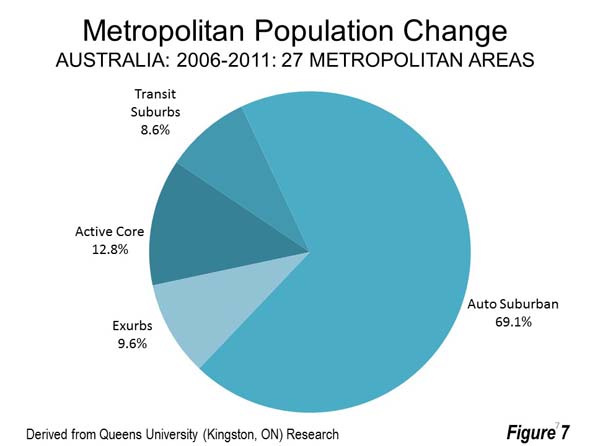
    Ontario’s competition threatening actions are not limited to business and labor policy. Land-use and housing policies are also making Ontario less competitive, first in the Toronto metropolitan area and now spreading across the province. About a decade ago, the province imposed its “Places to Grow” program that not one, but two urban containment boundaries. The highly publicized Greenbelt designates a huge swath of land on which development is not permitted.

    Then there is the second urban containment boundary, the “settlement boundary,” which largely ensures that new development is limited to a far smaller area around the urbanization, further intensifying the price-escalating impact of the Greenbelt. In this crazy quilt of regulation, land owners operate in a sellers’ market, able to drive prices up for their scarce holdings, to the detriment of home buyers. This environment is particularly welcome to speculators. Consistent with the fundamentals of economics, urban containment boundaries lead to higher land prices where new housing is permitted, and higher house prices.

    The procedures for supplying sufficient new greenfield development land require amendments of official community plans, a slow and cumbersome bureaucratic process. It is not surprising that Mattamy Homes Founder and CEO Peter Gilgin told Bloomberg that despite his largest homebuilding firm in the Toronto area having plenty of land for new houses, the necessary approvals are very difficult to obtain.

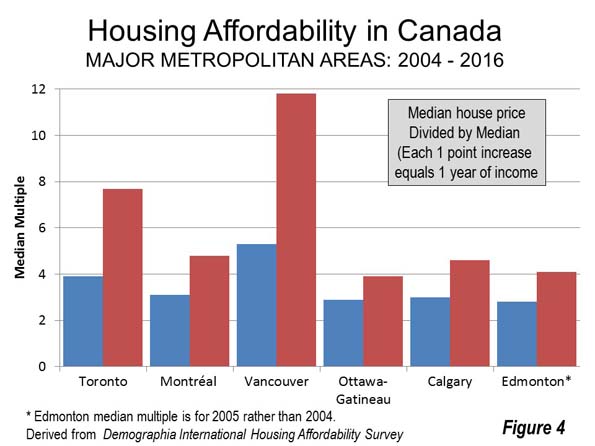
    The effects on house prices have been dramatic. In 2004, Toronto’s median house price was 3.9 times its median household income (median multiple). At that point, it had actually been reduced from 4.3 in 1971 and had hovered around 3.5 in the intervening years. According to the 13th Annual Demographia International Housing Affordability Survey, by 2016 house prices virtually doubled relative to incomes, with a median multiple of 7.7. This means a lower standard of living and greater relative poverty.

    Meanwhile, the house price increases are spreading from Toronto to nearby metropolitan areas. For example, house prices in Kitchener – Waterloo, Canada’s “Silicon Valley” rose 40 percent in the single year ended April 2017. This is nearly double the rate of Toronto that over the same period.

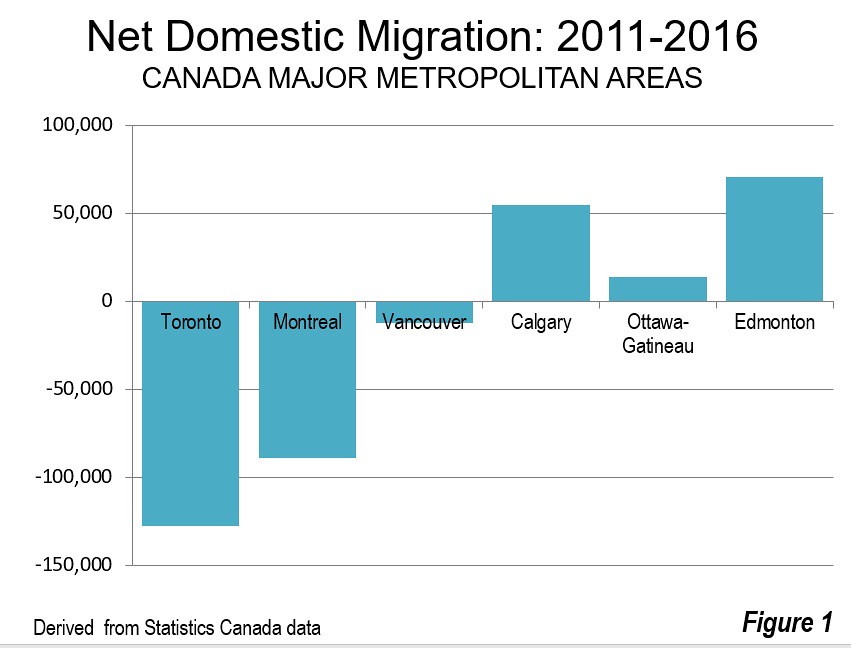
    The most recent domestic migration data indicates that people are moving out of the Toronto metropolitan area in droves. Since the 2011 census, more than 125,000 more people have left the Toronto area for other parts of Ontario that have moved in. This is the same dynamic apparent in the United States, where differentials in housing affordability have been cited as a principal reason for domestic migration gains and losses, as households flee from higher cost to lower-cost areas.

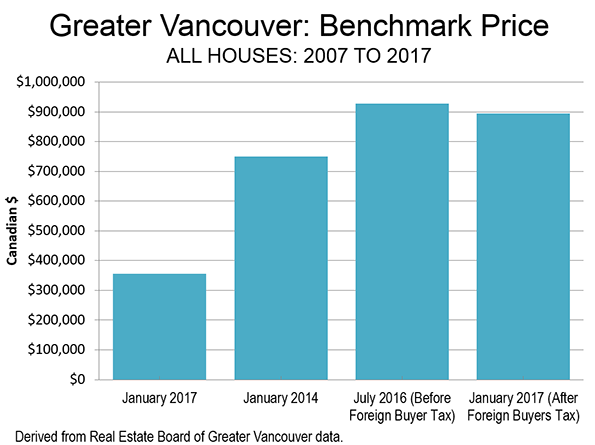
    A recently imposed foreign buyers tax led to somewhat lower prices in the Toronto area last year, but they are still 6.3 percent above a year ago and rising at a rate three times that of average earnings. Without restoring the competitive market for land on the periphery, it is likely that house prices will continue rising relative to incomes, to the detriment, in particular, of younger households.

    Meanwhile, house prices are substantially lower in US states nearby Ontario. As late as the mid-2000’s, there was little difference between the housing affordability across Ontario, including Toronto, and the Michigan, Ohio, Indiana and Kentucky. That is no longer the case.

    Immigration laws, however, do not permit the free movement of labor across the Canadian-US border, so there is no likelihood that Ontarians will move to the United States for lower cost housing. But capital is far more mobile. Companies that develop new business locations, especially manufacturing, often locate where they can maximize returns for their shareholders. Moreover, companies establishing new facilities are also interested in their employees being able to live close enough to commute to the plant.

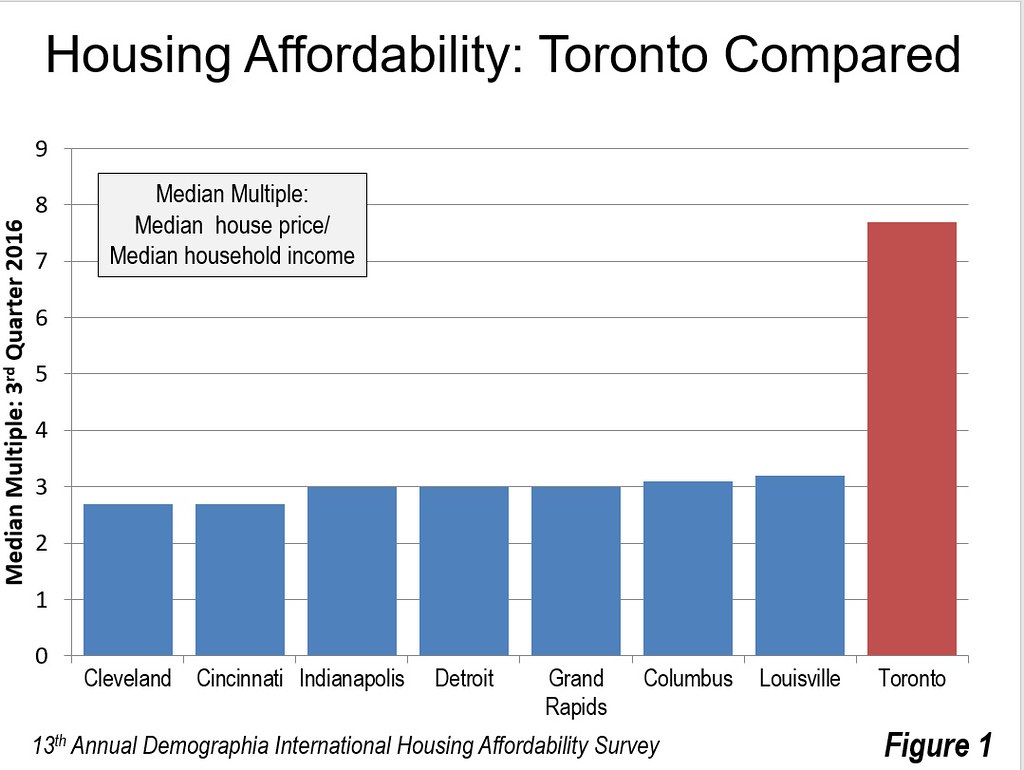
    Figure 1 shows the metropolitan area housing affordability, measured by the median multiple, for Toronto, as well as major metropolitan areas in the four nearby states. Residents of Cleveland and Cincinnati pay nearly two-thirds less of their income for their houses than do residents of Toronto. In Indianapolis, Detroit, Grand Rapids, Columbus and Louisville, residents pay approximately 60 percent less for their houses than in Toronto. Meanwhile, no one should confuse the sometimes characterized as decrepit city of Detroit, reeling from decades of misgovernance, with its leafy suburbs, where 85 percent of the metropolitan area’s people live.

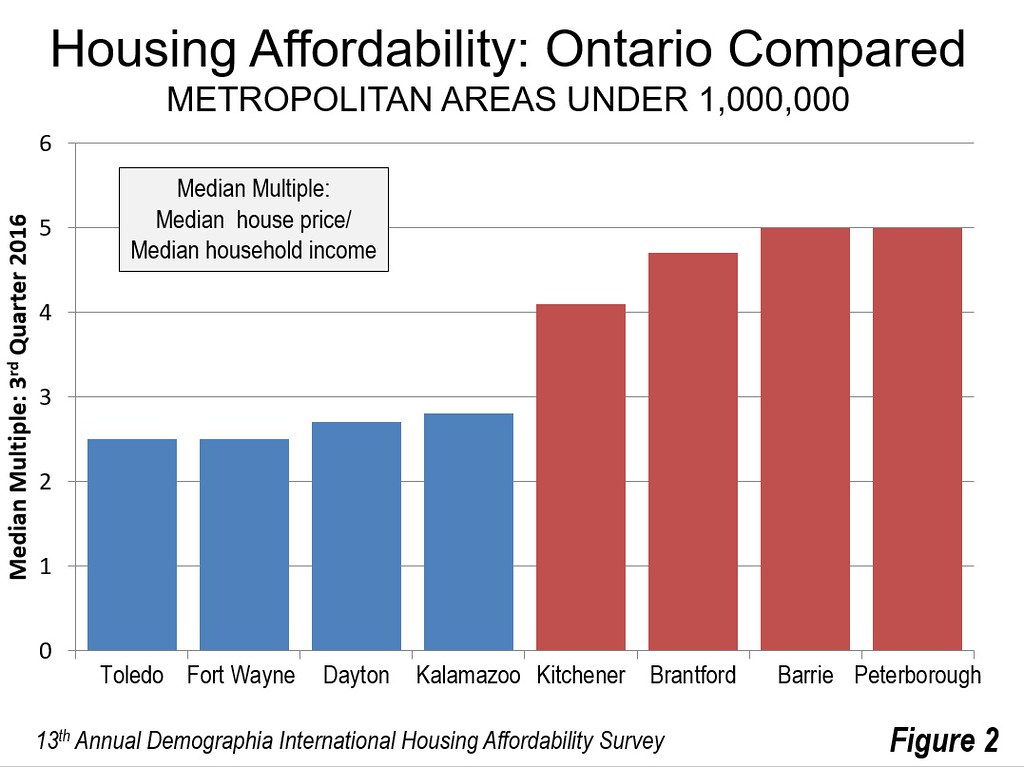
    Figure 2 indicates that things are a bit better among other Greater Golden Horseshoe metropolitan areas. Residents pay from 4.7 to 5.0 times their incomes in Brantford, Barrie and Peterborough. This is still up to double the 2.5 times incomes that residents pay in Toledo (Ohio) and Fort Wayne (Indiana). House prices are slightly higher in Dayton and Kalamazoo, but still at least than 40 percent below the three Ontario metropolitan areas.

    The Need for Competitive Policies

    Maintaining economic growth and the standard of living is important to Ontario’s 14 million people. At the same time, the world is becoming more competitive. Ontario needs to be careful, or economic development departments from across the increasingly competitive states of the Midwest could reap a harvest in business investment and jobs.

    Wendell Cox is principal of Demographia, an international public policy and demographics firm. He is a Senior Fellow of the Center for Opportunity Urbanism (US), Senior Fellow for Housing Affordability and Municipal Policy for the Frontier Centre for Public Policy (Canada), and a member of the Board of Advisors of the Center for Demographics and Policy at Chapman University (California). He is co-author of the “Demographia International Housing Affordability Survey” and author of “Demographia World Urban Areas” and “War on the Dream: How Anti-Sprawl Policy Threatens the Quality of Life.” He was appointed to three terms on the Los Angeles County Transportation Commission, where he served with the leading city and county leadership as the only non-elected member. He served as a visiting professor at the Conservatoire National des Arts et Metiers, a national university in Paris.

    Photograph: Pearson International Airport (Mississauga, Brampton and Toronto), Canada’s Largest employment centre (by author)

  • Moving Away from Toronto and Montréal

    The latest Statistics Canada data indicates that people are leaving Toronto and Montréal in large numbers since the 2011 census. Even so, both metropolitan areas continued to grow through the 2016 census as a result of net international migration and the natural increase of births over deaths (Figure 1). It turns out that Canada’s urban pattern is much more like that of the US, as well as other high-income countries, than many may suppose.

    Toronto

    Toronto lost 128,000 net domestic migrants, while Montréal lost 89,000 representing 2.3 percent of its total 2011 population.

    At the same time, the migration has been regional rather than national. In the case of Toronto, more than 90 percent of the net migration loss was to other areas of Ontario (118,000), as opposed to other provinces (10,000). The metropolitan area losses were concentrated in the city of Toronto, which lost a net 119,000 domestic migrants, while the suburbs lost 9,000. The city’s loss of 4.5 percent was nearly double that of the metropolitan area and 15 times that of the suburbs.

    Despite the late 1990s municipal amalgamation that increased the population of the city by three times, Toronto has become a majority suburban metropolitan area. The city of Toronto now has fallen to 46 percent of the population from 53 percent in 2001.

    Part of the metropolitan area loss is likely the result of Toronto’s higher house prices and shortage of single family homes that people prefer (see: Ryerson University Research Cites Urban Containment Policy as Major Factor in Toronto House Price Escalation), with nearby metropolitan areas experiencing strong net domestic migration gains. Up to one-half of Toronto’s loss may have been picked up by Oshawa (16,000), Hamilton (12,000), St. Catharine’s-Niagara (8,000), Barrie (7,000), Guelph (4,000), Brantford (4,000) Kitchener-Cambridge-Waterloo (1,000) and Peterborough (1,000), which are served by the commuter rail or bus services of Go Transit (Metrolinx).

    Moreover, with its highly dispersed employment patterns, commuters from exurban metropolitan areas can find employment much closer to home than downtown Toronto, with its less than 15 percent of metropolitan employment. A few years ago, it was reported that the largest employment center in Canada was the sprawling area around Pearson International Airport (Toronto-Missassauga-Brampton), rather than downtown Toronto. Meanwhile, the Kitchener-Cambridge-Waterloo area has emerged as Canada’s answer to Silicon Valley.

    Montréal

    Things were similar in Montréal, which lost 89,000 net domestic migrants, also representing 2.3 percent of its 2011 population. Unlike Toronto, Montréal’s loss was evenly split, with 45,000 moving out of Quebec and 44,000 moving to other parts of Québec.

    The concentration of net domestic migration losses were even more concentrated in the core than in Toronto. The ville de Montréal lost 117,000 net domestic migrants, while the suburbs gained 28,000. The ville’s loss of 7.0 percent was three times the rate of the total metropolitan area.

    Vancouver

    Vancouver, the third largest metropolitan area, also lost domestic migrants (12,000) at a rate of 0.5 percent relative to its 2011 population. Vancouver gained 10,000 net domestic migrants from other provinces, while losing 22,000 to other parts of British Columbia. Kelowna and Victoria appear to have prospered at Vancouver’s expense, both adding a 7,000 net intraprovincial migrants.

    Alberta: Calgary and Edmonton

    As has been the case for years, Alberta’s two largest metropolitan areas have led the national statistics. Calgary, the fourth largest metropolitan area added 55,000 net domestic migrants between 2011 and 2016. Much of this 4.6 percent gain was from other provinces (41,000). With the recent oil bust, which has hit Alberta hard, net interprovincial migration dropped from 7,000 in 2014-2015 to minus 1,000 in 2015-2016.

    Edmonton, Alberta’s second largest metropolitan area and Canada’s sixth largest, added even more net domestic migrants (72,000), for the strongest performance in the country. This 6.2 percent gain was also concentrated in people from outside the province (48,000). As in Calgary, net interprovincial migration fell strongly from 2014-2015 to 2015-2016, from 10,000 to 2,000.

    It remains to be seen how the recovering energy industry will impact the economy and migration trends in Alberta.

    Ottawa-Gatineau

    Ottawa-Gatineau (Ontario- Québec) has Canada’s capital and is the only major metropolitan area that spans two provinces. Ottawa-Gatineau is Canada’s fifth largest metropolitan area although likely to be overtaken almost at any time by faster growing Edmonton. Ottawa-Gatineau gained 14,000 net domestic migrants between 2011 and 2016 (1.1 percent). Most of the net domestic migration was from other parts of Ontario or Québec (10,000).

    Smaller Census Metropolitan Areas

    Among the other 27 census metropolitan areas that had been designated by the 2011 census, the largest percentage gain was in Kelowna, BC, at 8.4 percent. Saint John, New Brunswick had the largest net domestic migration loss at minus 3.5 percent.

    Overall Results

    Approximately two thirds of Canada’s population resides in the census metropolitan areas. Between 2011 and 2016, there was a net domestic migration of only 17,000 from outside the metropolitan areas (Table). Among the six major metropolitan areas, there was a net domestic migration loss of 89,000, probably driven in large measure by the “severely” or “seriously” unaffordability of housing virtually everywhere but Ottawa-Gatineau. While new metropolitan areas are likely to be designated (like Lethbridge, Alberta since 2011), it may be that there will be little additional net domestic migration to the largest metropolitan areas, and what will occur is largely in the suburbs.

    Net Domestic Migration: Canada Metropoltian Areas: 2011-2016
    Census Metropolitan Area 2016 Census Population Net Domestic Migration % of 2011 Population
    Toronto, Ontario      5,928,040         (128,432) -2.3%
    Montréal, Quebec      4,098,927           (88,913) -2.3%
    Vancouver, British Columbia      2,463,431           (11,928) -0.5%
    Calgary, Alberta      1,392,609             55,415 4.6%
    Ottawa-Gatineau, Ontario/Quebec      1,323,783             14,119 1.1%
    Edmonton, Alberta      1,321,426             71,620 6.2%
    Québec, Quebec         800,296               2,683 0.3%
    Winnipeg, Manitoba         778,489           (17,812) -2.4%
    Hamilton, Ontario         747,545             12,208 1.7%
    Kitchener-Cambridge-Waterloo, Ontario         523,894               1,390 0.3%
    London, Ontario         494,069               4,534 1.0%
    St. Catharines-Niagara, Ontario         406,074               8,030 2.0%
    Halifax, Nova Scotia         403,390               2,926 0.7%
    Oshawa, Ontario         379,848             16,028 4.5%
    Victoria, British Columbia         367,770             17,647 5.1%
    Windsor, Ontario         329,144                  (48) 0.0%
    Saskatoon, Saskatchewan         295,095               8,672 3.3%
    Regina, Saskatchewan         236,481               2,004 0.9%
    Sherbrooke, Quebec         212,105               1,792 0.9%
    St. John’s, Newfoundland and Labrador         205,955               7,949 4.0%
    Barrie, Ontario         197,059               6,943 3.7%
    Kelowna, British Columbia         194,882             15,171 8.4%
    Abbotsford-Mission, British Columbia         180,518               2,952 1.7%
    Greater Sudbury, Ontario         164,689             (1,285) -0.8%
    Kingston, Ontario         161,175               5,572 3.5%
    Saguenay, Quebec         160,980                (782) -0.5%
    Trois-Rivières, Quebec         156,042               2,721 1.8%
    Guelph, Ontario         151,984               3,384 2.4%
    Moncton, New Brunswick         144,810               2,425 1.7%
    Brantford, Ontario         134,203               3,603 2.7%
    Saint John, New Brunswick         126,202             (4,512) -3.5%
    Peterborough, Ontario         121,721               1,394 1.2%
    Thunder Bay, Ontario         121,621                (330) -0.3%
    Total    24,724,257             17,140 0.1%
    Derived from Statistics Canada data


    Wendell Cox is principal of Demographia, an international public policy and demographics firm. He is a Senior Fellow of the Center for Opportunity Urbanism (US), Senior Fellow for Housing Affordability and Municipal Policy for the Frontier Centre for Public Policy (Canada), and a member of the Board of Advisors of the Center for Demographics and Policy at Chapman University (California). He is co-author of the “Demographia International Housing Affordability Survey” and author of “Demographia World Urban Areas” and “War on the Dream: How Anti-Sprawl Policy Threatens the Quality of Life.” He was appointed to three terms on the Los Angeles County Transportation Commission, where he served with the leading city and county leadership as the only non-elected member. He served as a visiting professor at the Conservatoire National des Arts et Metiers, a national university in Paris.

    Photo: Photo: Old City Hall, Toronto (by author)

  • Canada Turns 150 – Time to Celebrate – But Only in Moderation

    Canada is one of the world’s most successful countries on quality of life and income indicators.  Among the reasons for its success are its foundation of laws, vast natural resources, access to the huge American market, and law abiding citizens.

    Canada was founded by the British Government at the height of the British Empire. French-speaking and English-speaking colonies agreed to join, and then spread west along the 49th parallel border with America.

    Britain bestowed two important advantages on Canada.  One being the rule of law. Canadians, while extremely law abiding, have common legal challenges: the length of time to reach trial, high court costs, and difficulties in prosecution of sophisticated white collar crimes. 

    Crime rates are a fraction of American levels and Canadian ‘no guns allowed’ cities are much safer than in America. Canada’s culture of respect is reflected in law abiding citizens and, outside of Quebec, very little real government corruption. Canada regularly scores among the least corrupt counties in Transparency International’s corruption rankings. 

    The British also left their wonderfully simple parliamentary system.  In Canada, once your party is elected with a majority of the seats in parliament, as Prime Minister you are effectively a benign dictator for 4 years.  The same goes with Canada’s equivalent of the State Governors – our Provincial Premiers.  Do a bad job and expect to lose the next election after 4 years – for the most part, almost all federal and provincial governments last two election cycles. 

    Unlike the USA, with its complex systems of checks and balances, the system in Canada affords its elected political leaders massive power, albeit subject to the robust rule of the English system of common law, which provides excellent and reliable property rights and contract enforcement. 

    After a federal election, the winning part’s leader picks his/her cabinet, senior bureaucrats, and appoints Senators and federal judges to vacancies in the upper house and the judiciary. Appointments are long term, generally outlast two election cycles except for judges and Senators, who serve to the mandatory retirement age.

    As in the US, Canada has three levels of government – federal, provincial and municipal.  Its British constitutional framework, based on “Peace, Order and Good Government”, has produced strong regional and provincial level governments which control major policy areas like healthcare, education and welfare. While the federal government has superior taxation powers, the provinces benefit enormously by owning and controlling all natural resources. 

    The second largest country by land mass, Canada has massive natural resources with large gold mines and the third largest proven oil reserves in the world. Its small population (12% of USA’s population) is made wealthy by vast amounts of oil and gas, minerals, water and forests. 

    Our proximity and close relationship with the USA – 90% of Canadians live within 100 miles of the border, has been vital to Canada’s success.  Not since 1812 have we had a major war with the USA. The 1812-1814 war and other occasions when America attempted to incorporate the northern part of North America helped drive the consolidation of separate British colonies into Canada in 1867.

    For the most part, Canada has recognized and lived peaceably with America. And, the USA has treated Canada better than it has any other country in the world, respecting its independence and providing Canada with massive military protection.  No other country would ever think of attacking Canada, for fear of the USA’s might and reprisal.  Our American relationship has brought great economic advantages – most importantly being almost unfettered access to the enormous US market.

    This reliance on American protection has allowed Canada to save massively on military expenditure.  The USA spends around 3.3% of its GDP on defense, while Canada spends well below 2%.  Although we do lose out on the amazing technologies and manufacturing jobs surrounding military expenditures, our lower costs allow a rich fabric of health and social programs.

    Both Canada and the USA lag well back in the most recent World Health Organization ranking of healthcare systems – Canada 30th in the world, the USA 37th.  The advantage for Canada is that our single payer universal health care system only costs us 11% of GDP, while in the USA the cost to the USA is 18% of its GDP. Canada’s universal – all Canadians are covered – public system is   preferred by Canadians over the American system which leaves many families unable to afford full health coverage that  system’s private insurers offer.

    Canada’s education system substantially outperforms its southern neighbor – scoring high in the top ten rankings in international math, science and reading. Canada’s strong knowledge economy is a great source of innovation and inventions.  The place that invented the telephone (inventor: Alexander Graham Bell) has a technological base that provides a valuable resource for the American tech sector. According to Canada’s National Post newspaper:

    “Silicon Valley technology companies continue to tap Canadian universities for talent. A 2014 report by Riviera Partners, a San Francisco  recruiting company, ranked the University of Waterloo (in Kitchener-Waterloo, Canada’s “Silicon Valley”) outside Toronto second behind only the University of California, Berkeley, in a list of schools that produce the most frequently hired students in the Bay area. Stanford, UCLA, and Cornell tied for third." (italics section added by author)

    We model ourselves as an European alternative to the USA – in terms of social programs and enterprise establishment – and that’s not always to the best.  Canada has opened its borders to an increasing flow of immigrants including refugees, putting pressure on government budgets called in to integrate the newcomers. As in the US, the public sector is a chattering class oasis of 1980s style social engineering.  High-priced and rules focused, our governments and media are increasingly fixated on gender and identity politics. Canada’s state funded broadcaster, the CBC, dwells obsessively on grievance, race and victim politics.

    Canada’s current Prime Minister, Justin Trudeau, seems to be more interested in politically-correct platitudes, gender balance in his Cabinet and fighting climate change than in building an economy.  For all its evident faults, the Trump Administration promotes job creation, economic growth by reversing Obama’s regulatory assaults on the conventional hydrocarbon sector. In contrast Trudeau’s Liberal federal government is thickening regulatory obstacles to more Canadian oil pipelines, banning oil tanker traffic along Canada’s west coast, and raising energy costs in a cold, widely-dispersed, resource based economy via a UN-approved carbon tax policy. 

    Like his father the late Pierre Trudeau, Canada’s Prime Minister from 1968-1984, before him, Justin Trudeau is trying to build a social legacy – not an economic one.

    Despite Canada’s leftish drift under young Trudeau, it will remain one of the safest, kindest, and peaceful greatest countries in the world. Canadians believe in service to society more than service to their country, while abiding by the rule of law, and enjoying the value of high-quality and affordable education. Forty-two per cent of Canadians have university degrees (33% in the USA), and unlike some European citizens, Canadians are not afraid of either work or our large and growing immigrant population, who work even harder.   

    Our current glamorous Prime Minister is strong on EQ  (emotional quotient) , excelling at selfies, platitudes and foreign relations.  Back home in Canada he professes that “budgets will balance themselves” and “root causes” are the reason for terrorism.  But, Canadians are patient, and avoid any and all forms of radical change. 

    No democracy on earth has a more stable political environment something that allows us to avoid the massive political swings found elsewhere.  Decades long debates in Canada center around social issues, such as whether to have our provinces solely fund child care or rely in part on the Federal Government. Recently, a debate raged about changing three words in our national anthem to make the anthem fully Gender Neutral.  While the rest of the world focuses on terrorism, immigration and youth unemployment – Canadians worry about rising  house prices, protecting and improving a ‘too slow’ health care system, and whether our civil servants get a small raise.

    On a global scale, these are good problems to have. 

    Peter Holle is president of the Frontier Centre for Public Policy, an independent western Canada based think tank, www.fcpp.org

    Photograph: Flag of Canada

  • Canada at 150: Perspectives

    Canada and the United States have lived together in peace for more than two centuries, since the War of 1812. Yet, it has not always been easy.

    Elephants provided one of the most graphic descriptions of the two nations living together. There are no elephants in Canada, at least not in the wild. But according to Canada’s third longest serving prime minister, Pierre Elliot Trudeau, there is a big one close by. The Prime Minister characterized Canada’s relationship with the United States in his March 25, 1969 speech to the Washington Press Club (at 1:40 in this Canadian Broadcasting Corporation video clip):

    “Living next to you is in some ways like sleeping with an elephant. No matter how friendly and even-tempered is the beast, if I can call it that, one is affected by every twitch and grunt.”

    Trudeau was the late father of Justin Trudeau, who today is Canada’s 23rd Prime Minister.

    I have always had great admiration for Canada. Perhaps that is because I lived there three years in my formative youth. This article contains some perspectives on Canada that may not be familiar to non-Canadians and perhaps to even some Canadians.

    Canada 150

    Canada is celebrating its 150th anniversary. Canada Day is July 1. On that day in 1867, the British North America Act came into effect. The Act created the Dominion of Canada, a union (confederation) between the province of Canada (which was divided into the provinces of Ontario and Québec) and the colonies of Nova Scotia and New Brunswick, which became provinces. All of this could be traced back to a 1864 conference in Charlottetown, now the capital of Prince Edward Island, which itself did not join the confederation until 1873.

    Like the United States, Canada is a former British colonial holding. Yet there are significant differences. For example, the manner of its separation from the “mother country” could not be more different.

    For the United States, the break was complete and relatively quick. After the July 4, 1776 Declaration of Independence and a war that lasted from 1775 to 1783, the separation was complete.

    When Did Canada Become Sovereignty?

    There is no question today of Canada’s sovereignty — it is a sovereign nation like the United States, China or Japan. Yet Canada seems to have evolved into sovereignty, over many years. Just when did Canada become independent? Opinions vary by 115 years.

    A poll by the Ottawa Citizen found considerable disagreement among Canadians. The majority, 74 percent said that it was 150 years ago, the effective date of the British North America Act (1867). The signing of the Canada Act by Prime Minister Pierre Trudeau and Queen Elizabeth in 1982 got the second most mentions, at 14 percent. And, other dates were mentioned.

    But both dates are unconvincing, according to Professor Jack Jebwab, formerly at one of Canada’s most prestigious universities (McGill University in Montréal) and now president of the Association for Canadian Studies, cites a 1967 Supreme Court decision of Canada, which stated that “sovereignty was acquired in the period between its separate signature of the Treaty of Versailles in 1919 and the Statute of Westminster” (1931).

    Jebwab says that Canada became neither independent nor sovereign in 1867, noting that the meaning of “dominion” was a British Empire term for “semi-independent entities.” The British Parliament, he says, could legislate on Canadian affairs and “override” any local legislation.

    He says that “Identifying the precise date when Canada achieved its independence is not easy.” Jebwab cites a leading constitutional expert Frank Scott to the effect that “at no time prior to the Second World War was the full international personality of the Dominion, as distinct from Great Britain, established beyond equivocation.”

    The Statute of Westminster (1931), which was a “British law clarifying the powers of Canada’s Parliament and those of the other Commonwealth Dominions. It granted these former colonies full legal freedom except in those areas where they chose to remain subordinate to Britain,” according to The Canadian Encyclopedia. This certainly seems to suggest that Canada could have been independent in 1931 if it chose to be. The Statute covered not only the Dominion of Canada, but also the Dominions of Australia, New Zealand, the Irish Free State, South Africa and Newfoundland (now Newfoundland and Labrador, one of Canada’s provinces).

    With respect to the 1982 act, Professor Jebwab notes: “Only with that act was a process introduced that permitted the amending of Canada’s basic constitutional laws without action by the British Parliament, and it declared that no British law passed thereafter would apply to Canada.”

    The Expansion of Canada

    From its beginnings with four provinces (Ontario, Quebec, New Brunswick and Nova Scotia), Canada expanded to 10 provinces and three territories. Manitoba joined as a province in 1870. British Columbia, on the Pacific Coast, joined in 1871, with the promise of a transcontinental railway, which was completed in 1885 (the Canadian Pacific). Prince Edward Island, home to the founding Charlottetown conference, did not join until 1873. Saskatchewan and Alberta became provinces in 1905, bringing the count to nine.

    The province of Newfoundland and Labrador is a special case. Never before a part of Canada, Newfoundland became a dominion of the British Empire in 1907, with equal status with Canada and the other dominions. It, like the other dominions, received a substantial push toward sovereignty with the 1931 Statute of Westminster. Yet, by 1933, the Dominion of Newfoundland found itself in considerable financial difficulty and its legislature disbanded. This may have been the only instance of a former colony voluntarily returning to colonial status. Newfoundland was governed for a decade and a half directly from London. After referendums, Newfoundland became a province of Canada in 1949.

    Canada also assumed the huge territories of the North, now the Yukon, Northwest Territories and Nunavut.

    Prince Albert, Saskatchewan

    Then there is the city of Prince Albert, Saskatchewan, which is not among Canada’s largest, with only 36,000 residents. No one from Prince Albert was at Charlottetown in 1864. Yet Prince Albert has been, in some ways, a cradle of Canadian leadership. The House of Commons (lower house of parliament) constituency of Prince Albert has been represented by a disproportionately large three of Canada’s 23 prime ministers. John A. Diefenbaker (1957-1963) grew up in the area and served Prince Albert during his premiership. William Lyon MacKenzie King, Canada’s longest serving prime minister (1921-1926, 1926-1930 and 1935-1948) represented Prince Albert through four of his six governments. Before he became Canada’s seventh prime minister, Wilfred Laurier held its provisional seat before Saskatchewan became a province in 1905 (when it was a part of the Northwest Territories). St. Albert has been represented by Prime Ministers for 30 of Canada’s 150 years, quite an accomplishment for such a small place.

    Celebrating Canada

    On the complex issue of sovereignty, Professor Jebwab concludes: “We’ve evolved enormously since 1867 and there is much to commemorate in the sovereign nation that we’ve become and that is today widely respected in so many parts of the world.”

    Indeed. Canada has emerged as one of the world’s most successful nations. According to the New York Times, Canada now has the richest middle class in the world. There is much in Canada to be celebrated, and enthusiastically.

    Wendell Cox is principal of Demographia, an international public policy and demographics firm. He is a Senior Fellow of the Center for Opportunity Urbanism (US), Senior Fellow for Housing Affordability and Municipal Policy for the Frontier Centre for Public Policy (Canada), and a member of the Board of Advisors of the Center for Demographics and Policy at Chapman University (California). He is co-author of the "Demographia International Housing Affordability Survey" and author of "Demographia World Urban Areas" and "War on the Dream: How Anti-Sprawl Policy Threatens the Quality of Life." He was appointed to three terms on the Los Angeles County Transportation Commission, where he served with the leading city and county leadership as the only non-elected member. He served as a visiting professor at the Conservatoire National des Arts et Metiers, a national university in Paris.

    Photograph: Centre Block, Parliament of Canada (by author)

  • The 37 Megacities and Largest Cities: Demographia World Urban Areas: 2017

    Many of the world’s biggest cities are getting bigger still. In 2017, the number of megacities — urban areas with better than ten million people —   increased to 37 in 2017, as the Chennai urban area entered their ranks. Chennai becomes India’s fourth megacity, along with Delhi, Mumbai and Kolkota. These are among the major findings in the just released 13th annual edition of Demographia World Urban Areas, which provides population, land area and population density estimates for the 1,040 identified built-up urban areas (cities) in the world. Built-up urban areas are the physical form of the city, a definition which separates out the urban, or constructed form of the city from the rural and smaller town areas with which they form a metropolitan area or labor market (Figure 1).

    The World’s Largest Cities

    Asia increasingly dominates the ranks of the world’s most populous cities. Tokyo-Yokohama continues to be the largest urban area in the world (Figure 2), a ranking it has held for more than six decades. It is estimated the Tokyo Yokohama house a population of 37.9 million, living in approximately 3300 square miles (8,500 square kilometers) with a population density of 11,500 per square mile (4,400 per square kilometer).

    Jakarta is the second largest urban area, with a population of 31.8 million 9,600 per square kilometer). Delhi, India’s capital held onto third position, with a population of 26.5 million. Delhi has now opened up a more than 3.5 million lead on 8th ranked Mumbai, which had been India’s largest urban area before and which some experts had considered likely to become the world’s largest city. This prediction, like a similar ones made with respect to Mexico City in the 1980s has not come to fruition and it seems unlikely that either urban area will ever be, the world’s largest.

    Manila moved up from fifth position to fourth position, passing Seoul-Incheon (Figure 3). Manila’s population is estimated at 24.3 million, in an area of 690 square miles (1,790 square kilometers) in a population density of 35,100 per square mile (13,600 per square kilometer), the highest density among the top five built-up urban areas.

    Seoul-Incheon remains the only high income city, besides Tokyo,  in the top five. Seoul-Incheon is estimated to have a population of 24.1 million and an urban population density of 22,700 per square mile (8800 per square kilometer).

    The second five includes Karachi, Shanghai, Mumbai, New York and Sao Paulo, with only New York in the high income world. Thus, seven  of the largest 10 cities in the world are now outside the high income world. New York was the largest city in the world from the 1920s until the mid-1950s. London, which was the largest city in the world from the early 19th century to the 1920s is now ranked 34th, while Beijing, which preceded London as largest ranks 11th. Among the next ten largest urban areas, only two — Osaka-Kobe-Kyoto, at 14th and Los Angeles, at 19th are in the high-income world.  Formerly rapidly growing Los Angeles seems likely to drop out of the top 20 before long.

    Dhaka’s High Density

    Dhaka (Figure 4) remains far and away the highest density built-up urban area in the world (Figure 5), Dhaka has an urban density of 118,500 per square mile (45,700 per square kilometer). No other urban area exceeds 70,000 per square mile (27,000 per square kilometer). Yet, Dhaka is not dense enough for some critics, who perceive it to sprawl too much. Notably, Dhaka is about 50 percent denser than Mumbai or Hong Kong (the high income world’s densest city) and more than 30 times as dense as international densification model Portland, Oregon. Portland ranks 963rd in population density out of the 1040 built-up urban areas.

    A Half Urban World?

    In recent years, the population of the world has become majority urban for the first time. Yet, most people do not live in the largest urban areas. For example, only 15 percent of the urban population resides  in the 37 megacities. The middle of the urban population distribution is at a population of approximately 680,000. People who live in urban areas such as Shizuoka (Japan), Mangalore (India), not to be confused with Bangalore, Qitaihe (China) and Allentown (United States) are the average. The population of the urban areas that are larger have half of the urban population, while the smaller includes the other half.

    Distribution of the Population

    World urbanization is dominated by Asia, which has a majority (54 percent) of the built-up urban areas with at least 500,000 population. Asia’s dominance is even greater in population, with 58 percent of the residents in urban areas of 500,000 or more. North America has the second largest share of urban area population, at 12.5 percent, followed by Africa (11.2 percent) and Europe (9.9 percent). By contrast, Europe has the second largest number of urban areas of 500,000 population or more, reflecting the generally smaller population of its cities (Figures 6 and 7).

    Concentration of Future Growth in Asia and Africa

    The latest data underscores the substantial changes that have occurred in urbanization in recent decades. In 1950, 11 of the 20 largest cities were in the high income world, according to the United Nations. On average these cities had 5 million population. Today, only five of the 20 largest cities are in the high income world and their average population is 21.5 million.

    In the decades to come, Asia  seems likely to continue its dominance, while Africa will capture an increasing share of urban population growth. By 2050, the United Nations projects that approximately 1.2 billion residents will be added to Asian urban areas, while nearly 900 million will be added to the urban areas of Africa. This would leave only about 125 million, or five percent of total urban growth for the rest of the world. Of course, projections can be wrong, but the strength of current trends make these forecasts all the more credible.

    Note: Demographia World Urban Areas uses base population figures, derived from official census and estimates data, to develop basic year population estimates within the confines of built-up urban areas. These figures are then adjusted to account for population change forecasts, principally from the United Nations or national statistics bureaus for a 2016 estimate.

    Built-up urban areas are continuously built-up development that excludes rural lands. Built-Up urban areas are the city in its physical form, as opposed to metropolitan areas, which are the city in its economic or functional form. Metropolitan areas include rural areas and secondary built-up urban areas that are outside the primary built-up urban area. These concepts are illustrated in Figure 1 (above), which uses the Paris built-up urban area (unité urbaine) and metropolitan area ("aire urbaine") as an example.

    Wendell Cox is principal of Demographia, an international public policy and demographics firm. He is a Senior Fellow of the Center for Opportunity Urbanism (US), Senior Fellow for Housing Affordability and Municipal Policy for the Frontier Centre for Public Policy (Canada), and a member of the Board of Advisors of the Center for Demographics and Policy at Chapman University (California). He is co-author of the “Demographia International Housing Affordability Survey” and author of “Demographia World Urban Areas” and “War on the Dream: How Anti-Sprawl Policy Threatens the Quality of Life.” He was appointed to three terms on the Los Angeles County Transportation Commission, where he served with the leading city and county leadership as the only non-elected member. He served as a visiting professor at the Conservatoire National des Arts et Metiers, a national university in Paris.

    Photo: Cover of Demographia World Urban Areas: 13th Annual Edition.

  • Common Sense on Immigration

    No issue divides the United States more than immigration. Many Americans are resentful of the estimated 11 million undocumented immigrants, worry about their own job security, and fear the arrival of more refugees from Islamic countries could pose the greatest terrorist threat. At the other end of the spectrum are those who believe the welcoming words on the Statue of Liberty represent a national value that supersedes traditional norms of citizenship and national culture.

    What has been largely missing has been a sharp focus on the purpose of immigration. In the past, immigration was critical in meeting the demographic and economic needs of a rapidly growing nation. Simply put, the country required lots of bodies to develop its vast expanses of land and natural resources and to work in its factories.    

    The need for foreign workers remains important, but the conditions have changed. No longer a largely rural, empty country, more than 80 percent of Americans cluster in urban and suburban areas. Many routine jobs have been automated; factories, farms and offices function more efficiently with smaller workforces. Since at least 2000, notes demographer Nicholas Eberstadt, the “Great American Escalator” has stopped working.

    These changes suggest the need to rethink national immigration policies. In a country where wages for the poorest workers have been dropping for decades and incomes have stagnated for the middle class, allowing large numbers of even poorer people into the country seems more burden than balm. They often work hard, but largely in low-income service jobs and in the low end of the health care field. In California, home to an estimated 2.7 million largely Latino undocumented immigrants, approximately three in four Latino non-citizens struggle to make ends meet, as do about half of naturalized Latino citizens, according to a recent United Way study.

    Overall, our current immigrants, legal and illegal, have not advanced as quickly as in previous generations. This, along with the crisis in much of Middle America, should be our primary national concern. This doesn’t necessarily translate to mass deportations or even severe cutbacks in legal immigration, as some, including Attorney General Jeff Sessions and several congressional Republicans, have said. But it certainly does suggest taking a fresh look at how we view immigration.    

    Learning From Abroad

    So, what kind of immigration is best for America?

    Models to consider are those that put premiums on marketable skills and language proficiency rather than family reunification. The Canadian and Australian systems, as President Trump correctly noted, are more attuned to their own national needs, compared with the U.S approach, which emphasizes family re-unification. Canadian authorities allow some 60 to 70 percent of their immigrants to come for economic purposes, notes Carter Labor Secretary Ray Marshall, supporting their system mainly by “filling vacancies that are measured and demonstrated in the Canadian economy.”    

    Such a needs-based program would be a better, and fairer, way of addressing skills shortages than the odious H-IB program, which allows temporary indentured tech workers to replace American citizens. Instead, talented newcomers would be welcomed as future citizens and given the right to negotiate their own labor rates and conditions.

    This emphasis on admitting immigrants with needed skills leaves Canadians and Australians with generally more positive views about immigration than Americans. Australia is one of only three countries in the world where children of migrants do better at school than children of non-migrants. Canadian support for immigration is particularly high in Toronto, which has been transformed from a sleepy Anglo enclave to a vibrant, diverse global capital.

    But such hospitality is not limitless. A former Canadian immigration judge told me recently, in a tone of alarm, that his country’s invitation to 25,000 Syrian refugees could incubate the same sort of disorder that we see across Europe. There, in many heavily immigrant communities, poverty and isolation has persisted, sometimes for generations.    

    I doubt many Americans would want to see the kind of social unrest we see across once peaceful places like Sweden, where women now complain of being perpetually harassed, even as supposedly feminist politicians look the other way. In France, Muslims make up about 7.5 percent of the French population compared to 1 percent in the U.S., but France has been ravaged by Islamic terrorism, Muslim-fueled anti-Semitism, and a widening cultural gap between the immigrants and the indigenous French population. In France and many other European countries, we see the rise of nativist politicians that make Donald Trump seem like Mother Theresa.

    Citizenship and National Culture

    The United States could be headed to a similar devolution. America’s ideals may be universal, but our political community has always been based on U.S. citizenship. You should not have to be an Anglo to admire the Founders, or to embrace the importance of the Constitution. Yet it’s now fashionable among some progressive activists to reject established American political traditions, which constitute a fundamental reason people have come here for the last two centuries.

    Yet the “open borders” lobby on the progressive left increasingly demeans the very idea of citizenship. In some cases, they see immigration as way to achieve their desired end of “white America.” Some advocates for the undocumented, such as Jorge Bonilla of Univision, assert that America is “our county, not theirs” referring to Trump supporters. Others, like New York Mayor Bill di Blasio, refuse to differentiate between legal and illegal immigrants.

    As usual, California leads the lunacy. Gov. Jerry Brown, who famously laid out a “welcome” sign to Mexican illegal and legal immigrants, has also given them drivers’ licenses and provides financial aid for college, even while cutting aid for middle-class residents. Some Sacramento lawmakers are pressing to give undocumented immigrants’ access to state health insurance. Senate President Pro Tem Kevin de Leon recently boasted, “Half of my family would be eligible for deportation under the executive order, because they got a false Social Security card, they got a false identification.”

    The “open borders” ideology has reached its apotheosis in “sanctuary” cities which extend legal protection from deportation to criminal aliens, including those who have committed felonies. Donald Trump opportunistically emphasized this absurd and inappropriate situation—sometimes invoking the names of murdered Americans—during his 2016 campaign. The only mystery is why it would surprise the chattering class that many voters responded to his message.

    Most Americans are more practical about immigration than politicians in either party. The vast majority of us, including Republicans, oppose massive deportations of undocumented individuals with no serious criminal record. Limiting Muslim immigration appeals to barely half of Americans. Only a minority favor Trump’s famous “big beautiful wall” on the Mexico-U.S. border.

    Yet even in California, three-quarters of the population, according to a recent U.C.-Berkeley survey, oppose “sanctuary cities.” Overall, more Americans favor less immigration than more. According to a recent Pew study, most also generally approve tougher border controls and increased deportations. They also want newcomers to come legally and learn English, notes Gallup. This is not just an Anglo issue. In Texas, by some accounts roughly one-third of all Latino voters supported Trump.

    Sadly, immigration as an issue has been totally politicized. Obama deported far more undocumented aliens than his Republican predecessor, or any previous president, for that matter, without inciting mass hysteria. To be sure, Republicans face severe challenges with new generations that are more heavily Latino and Asian and generally more positive about immigration. The undocumented account for roughly one in five Mexicans and upwards of half of those from Central American countries, meaning that overly brutal approaches to their residency would be eventual political suicide for Republicans in many key states, including Arizona, Florida, Nevada, Colorado and even Georgia.

    Any new immigration policy has to be widely acceptable — both where immigrants are common as well as those generally less diverse areas where opposition to immigration is strongest. Unlike many issues, immigration cannot be devolved to local areas to accommodate differing cultural climates; it is, and will remain, a federal issue. A policy that melds a skills-based orientation, compassion, strong border enforcement, expulsion of criminals, and forcing the undocumented to the back of the citizenship line seems eminently fair.

    Economic Growth: The Secret Sauce of Immigration Policy

    Strong, broad-based economic growth remains the key to making immigration work. A weak economy, unemployment, population density, or sudden uncontrolled surges in migration, notes a recent Economic Policy Institute, drives most anti-immigration sentiment. The labor-backed think tank suggests it would be far better to bring in migrants with skills that are in short supply and avoid temporary workers, such as H-1B visa holders, who are paid lower wages, undercutting the employment prospects for Americans.

    Given the demands of competition and changes in technology, it seems foolish to allow many additional lower-skilled people enter our country. This is not elitism: Industry needs machinists, carpenters and nurses as well as computer programmers and biomedical engineers. What we don’t need to do is flood the bottom of the labor market. Again, this reality is race-neutral. Economist George Borjas suggests that the influx of low-skilled, poorly educated immigrants has reduced wages for our indigenous poor, particularly African-Americans, but also for the recent waves of immigrants, including Mexican Americans, over the past three decades.

    Like most high-income countries, America’s fertility rate is below that needed to replace the current generation. This constitutes one rationale for continued legal immigration. But our demographic shortcomings are also entwined with lack of economic opportunity, crippling student debt, and the high cost of family-friendly housing stock. In other words, one reason Millennials are putting off having children is because they can’t afford them.

    Overall immigration is a net benefit, if the economic conditions are right. An overly broad cutback in immigration would deprive the country of the labor of millions of hard-working people, many of whom are highly entrepreneurial. The foreign-born, notes the Kaufmann Foundation, are also twice as likely to start a business as native-born Americans. It’s always been thus—and these aren’t just small, ethnic, family-owned restaurants we’re talking about. More than 40 percent of Fortune 500 companies were founded by immigrants or their offspring.    

    American immigration has succeeded in the past largely due to economic expansion. The historical lesson is clear: a growing economy, more wealth and opportunity, as well as a sensible policy, are the true prerequisites for the successful integration of newcomers into our society.

    Joel Kotkin is executive editor of NewGeography.com. He is the Roger Hobbs Distinguished Fellow in Urban Studies at Chapman University and executive director of the Houston-based Center for Opportunity Urbanism. His newest book, The Human City: Urbanism for the rest of us, was published in April by Agate. He is also author of The New Class ConflictThe City: A Global History, and The Next Hundred Million: America in 2050. He lives in Orange County, CA.

    Photo: Jonathan McIntosh

  • Canada’s Urban Areas: Descent from Affordability

    Canada is a nation of wide open spaces, yet it has high urban area densities recently driven higher by a redefinition of urban area criteria (Note 1). Canada’s largest urban area (population centre) is Toronto, with a population of 5.4 million continues to be the densest of the 59 with more than 50,000 residents. Toronto has a population of 3,028 per square kilometer (7,843 per square mile), approximately five percent above the European Union average. Montréal (population of 3.5 million) has a density of 2,720 per square kilometer (7,045 per square mile), followed by third ranked Vancouver (2,584/6,693), which has a population of 2.2 million.  The top ten is rounded out by Milton, a fast growing Toronto exurb with a density of 2,520 per square kilometer or 6.527 per square mile, Calgary (2,112/5,470), Regina, the capital of Saskatchewan (2,082/5,391) and Winnipeg, which has seen renewed recent growth (2,070/5,360).

    Four other population centres have densities greater than 1,950 per square kilometer (5,000 per square mile , including  Oshawa and Hamilton, which are adjacent to Toronto, as well as Saskatoon, Saskatchewan and Kanata, an exurb of Ottawa (Figure 2).

    Comparisons to the United States

    The new, higher density figures are not surprising considering the especially compact suburbs in view when landing at Pearson Airport in Toronto, or even in Calgary or Edmonton. A combined Canada-US urban area density list illustrates the higher density of Canadian urban areas relative to those in the United States.  Among the five densest urban areas in Canada and the United States, four are in Canada. Los Angeles, the densest large urban area in the United States for the last three censuses, ranks third behind Toronto and Montréal. Vancouver and Milton rank fourth and fifth, just ahead of 6th ranked San Francisco. Immediately behind San Francisco is virtually all post-World War II suburban San Jose. Delano, California, an exurb of Bakersfield in the San Joaquin Valley has about 55,000 residents and ranks 8th on the combined list.

    Residents of Calgary, Regina and Winnipeg, where densification advocates repeatedly condemn their perceived local urban sprawl (a pejorative term for urban dispersion) will doubtless be surprised to know that their population density exceeds that of New York. Only one more US urban area makes the top 20, Sacramento exurb Davis, at 14th, with a population of 73,000 (Figure 3).

    Where’s Portland?

    To those inclined to venerate Portland’s internationally famous densification policies, this list may be disconcerting. Calgarians who bemoan the inferiority of their city in relation to Portland should be heartened to find out that Calgary’s density is more than 50 percent higher than Portland’s (Calgary’s transit market share is more than double Portland’s).

    Portland is not among the densest 20 urban areas , but ranks 72nd, just behind all-suburban Riverside-San Bernardino and a bit ahead of Halifax. If Portland were in Canada, it would rank 38th in population density out of the largest 59 urban areas.

    And Boston?

    Boston has a reputation as one of the densest cities in the United States. Yet, Boston’s huge urban area  is denser than only three of Canada’s urban areas on the list, Belleville, ON, North Bay, ON and Fredericton, NB. Each is smaller than Boston suburb Somerville, which has about 75,000 residents. Among the urban areas of  Canada and the US Boston is 218th in density. (Note 3).

    Urban Containment Not Density Associated with Unaffordability

    Canada’s urban areas illustrate that density does not have to mean unaffordable housing. There has been some densification since 2000, but Canada’s urban areas were nearly as dense even then. For example, in the last 15 years, the completely developed city of Toronto, with all its new residential towers, has added only 10 percent to its population. Five of Canada’s six major metropolitan areas Toronto, Montréal, Ottawa-Gatineau, Calgary and Edmonton were affordable at the beginning of the new century, hovering around a median multiple 3.0.

    All that has changed, however, with the imposition of urban growth boundaries and equivalent policies. Ailin He and I showed in a Frontier Centre study (Canada’s Middle Income Housing Affordability Crisis) that house prices had “exploded” relative to household incomes between 2000 and 2015. This cannot be attributed to the modestly higher densities. The big change took place in land use policy, with, for example, Toronto and Calgary adopting urban containment policy that has been strongly associated with the destruction of housing affordability. Residents of Vancouver  — an urban area widely praised among planners —  have been paying the price for urban containment for much longer (Figure 4).

    Canada’s experience up to the end of the 20th century proves that dense and affordable urban areas can be achieved. But since that time, as house prices have risen relative to incomes, Canada’s experience shows that all that can be reversed in an environment of binding urban containment policy.

    Note 1: Between 2011 and 2016, Canada’s urban areas increased more than 40 percent in population density, according to Statistics Canada data. This, however, was not a miracle of urban containment policy or smart growth, it was rather an improved method adopted by Statistics Canada for measuring urbanization. Urban areas are the "physical city," which unlike the metropolitan area has only urban land. Canada now calls its urban areas "population centres," having changed to the new label in 2011, when the United Kingdom labeled them "built up urban areas."

    In 2011 and before, the Census had used municipalities as building blocks for urban areas. Often, those municipalities included large swaths of rural land (as did Los Angeles until well into the 1950s). Now, the building blocks for urban areas in Canada are "blocks", the lowest enumeration geography of the Census (the same revision was implemented by the US Census in 2000). Under the old definition, Canada’s urban areas had a density of 1,180 per square kilometer (3,057 per square mile) in 2011. Now it is 1,698 per square kilometer (4,397 per square mile), a 44 percent increase.

    Note 2: The comparisons are between the 2016 Census of Canada data and the 2010 US Census data, since urban area (population centre) data is only developed in the censuses (the next US census will be in 2020). The list is developed from the 59 urban areas in Canada and the 499 in the United States with 50,000-plus residents in the last censuses.

    Note 3:  A recent article found Boston to be almost five times as dense as Houston. However, this was in municipal (inside the city limits) density. City limits are artificial, political constructs that have nothing to with the organic city (the physical city , also called urban area or the economic city, or the metropolitan area , which is the labor market).  The Houston urban area, with its reputation for "sprawl" is actually one-third denser (1150/2979 ) than Boston’s (856 /2,278). At the physical city level, the urban area is the best indication of urban density. Using metropolitan density as an indicator of urban density is nonsensical, since all metropolitan areas include substantial rural territory.

    Wendell Cox is principal of Demographia, an international public policy and demographics firm. He is a Senior Fellow of the Center for Opportunity Urbanism (US), Senior Fellow for Housing Affordability and Municipal Policy for the Frontier Centre for Public Policy (Canada), and a member of the Board of Advisors of the Center for Demographics and Policy at Chapman University (California). He is co-author of the “Demographia International Housing Affordability Survey” and author of “Demographia World Urban Areas” and “War on the Dream: How Anti-Sprawl Policy Threatens the Quality of Life.” He was appointed to three terms on the Los Angeles County Transportation Commission, where he served with the leading city and county leadership as the only non-elected member. He served as a visiting professor at the Conservatoire National des Arts et Metiers, a national university in Paris.

    Photo: Suburban density in Toronto (Markham) by IDuke – English Wikipedia, CC BY-SA 2.5

  • Vancouverizing Seattle?

    A recent Wall Street Journal article (“For Chinese buyers, Seattle is the new Vancouver”) reported that Seattle was replacing Vancouver as the most popular destination for Chinese buyers in North America. For years, there has been considerable concern about foreign investment in the Vancouver housing market, especially Chinese investment. This   demand is widely believed to have driven Vancouver house prices “through the roof.” In response, the British Columbia government recently imposed a 15 percent foreign buyers tax that has had the impact of significantly reducing new foreign investment in Vancouver’s housing market.

    Yet the impact of the tax has still been muted. Houses remain just about as unaffordable as before. The Real Estate Board of Greater Vancouver benchmark price has dropped less than four percent from six months ago, before the foreign buyers tax was imposed. This compares to an 80 percent increase over the last 10 years and 47 percent increase over just the last three years (Figure).

    Clearly there is something other than Chinese investment driving up Vancouver house prices. Since 2004, Vancouver’s median multiple (median house price divided by median household income) has risen from 5.3 to 11.8. This means that that the median house has increased in price more than six times the annual median household income.

    The primary cause of Vancouver’s difficulties is a rigged housing market. For decades, Vancouver has had some of the strongest urban containment policy in the world. Regional land-use authorities have prohibited  housing development from being built on a large agricultural reserve. This land is hardly needed for such use in a nation that has increased its gross agricultural output more than 150 percent since 1961, while reducing its land in farms by three times as many acres as is occupied by all urban settlements combined, according to the 2016 Canadian census. Of course, urban containment restrictions on new housing have driven up house prices, just as Middle East oil supply reductions used to drive up gasoline prices, before the recent supply increases from Canadian and US oil production.

    Vancouver has literally become the third most unaffordable city (metropolitan area) in the nine nations covered by the Demographia International Housing Affordability Survey. This makes a mockery of the Vancouver’s frequent citation as one of the most livable cities in the world. The first principle of livability is affordability — you cannot live where you cannot afford. Most young families of normal economic means cannot hope to ever buy a modest detached house with a yard as their parents or grandparents did decades ago in the Vancouver area. Only Hong Kong and Sydney are less affordable.

    In a recent column (“Not much can or will be done to make Vancouver housing more affordable”) by Gordon Clark in The Province (Vancouver newspaper) describes how things have changed, in a story similar to what you will hear in Sydney, San Francisco and others of the world’s most unaffordable cities. In 1941, his postal supervisor grandfather purchased a house on Oak Street (a main central arterial leading toward downtown) for 1.5 years of income. In 1979 his teacher mother purchased a house in the city of Vancouver for 2.5 times her income. Now with houses costing nearly 12 times incomes, Clark regretfully concludes that nothing can be done: “because the solutions are unacceptable to most people.”

    This illustrates what is perhaps the most powerful characteristic of urban containment regulation — that it creates a strong lobby of support among those who have seen their house values irrationally escalate as a result of unwise government policy. In this environment, public officials simply wring their hands, decry the problem and implement nothing of substance to change the essentially flawed policies. 

    With this rigged market, it should not be surprising that people with money from outside Vancouver, and abroad, would seek to buy houses in Vancouver. After all, the policies all but guaranteed strong returns to anyone with enough capital to enter the market.   It is as if a “Speculators Welcome” banner has been hung from Lion’s Gate Bridge. Not so welcome are those middle-income households being driven out of the market

    Lessons for Seattle

    All of this is a cautionary tale for the Seattle metropolitan area, which also has urban containment policy, but of more recent vintage. Just 140 miles or 225 kilometers south of Vancouver, Seattle’s has housing affordability that already as bad as Vancouver’s  only 12 years ago.

    Seattle has a severely unaffordable median multiple of 5.5, slightly worse than Vancouver’s 5.3 in 2004. In the late 1980s, before Seattle imposed its metropolitan- urban containment policy, the median multiple was as low as 2.4 (Table). Today, a Seattle household with the median income must pay three additional years of income for the median priced house.

    Rising housing demand with severely constricted supply is associated with higher house prices compared to incomes. In this regard, Seattle has multiple risks, from households escaping California to escape from the even higher prices, Seattle is a bargain compared to the “dogs breakfast” of unaffordable housing associated with California where median multiples now exceed 8.0 in all of the major coastal metropolitan areas (Los Angeles, San Francisco, San Diego and San Jose). Prices are so high in California that a seller can buy a comparable house in Seattle for hundreds of thousands less. There may not be as much sun in Seattle, but there’s plenty of money left over for umbrellas and other goods and services.

    Now the pressure is likely to increase as foreign investors who shop the world for rigged housing markets promise quick profits now turn their attention to the Puget Sound. In this environment, it would not be surprising for additional serious house price escalation to be in the offing, and Seattle to indeed become the new Vancouver in the next decade or two.

    Given these forces, we can expect Seattle housing prices   will continue to increase disproportionately to incomes unless there is land use policy reform. Sufficient supply must be allowed on greenfield land to keep house prices from rising farther. And “building to the sky”— which is very expensive and not very family friendly —  is not likely to restore housing affordability in Seattle any more than it has anywhere else. For example, the Manhattanization of central Toronto, with its many new residential towers, has not prevented its median multiple from doubling from 3.9 to 7.7 in the last 12 years. Nor has it prevented a far less obvious (at least to the press) 80 percent share of population growth to be in the suburbs between 2011 and 2016.

    Lost in all of this are ordinary middle and working class people, who routinely take a back seat in public policy to planning obsessions over urban form, and a “sense of place.” Middle-income households are far more in need of a “decent place” to live at a reasonable price. Architectural marvels or sleek streetscapes are no substitute. The issue is not ideological, it is rather practical and human. Nor is it about property rights, or free markets. The issue is that people are being denied the housing they desire by urban containment policy and its distorted priorities. As Paul Cheshire, Max Nathan and Henry G. Overman of the London School of Economics have pointed out, “people rather than places” should be the focus of urban policy.

    It is ironic that progressive metropolitan areas, like Vancouver, where inclusionary zoning drip feeds housing to lower income households, have become, large exclusionary zones where average income households cannot afford houses. Seattle is headed down the same path.  Soon it may be time to hang a “Speculators Welcome” banner from the Space Needle.

    Photograph: Downtown Seattle (by author)            

    Wendell Cox is principal of Demographia, an international public policy and demographics firm. He is a Senior Fellow of the Center for Opportunity Urbanism (US), Senior Fellow for Housing Affordability and Municipal Policy for the Frontier Centre for Public Policy (Canada), and a member of the Board of Advisors of the Center for Demographics and Policy at Chapman University (California). He is co-author of the "Demographia International Housing Affordability Survey" and author of "Demographia World Urban Areas" and "War on the Dream: How Anti-Sprawl Policy Threatens the Quality of Life." He was appointed to three terms on the Los Angeles County Transportation Commission, where he served with the leading city and county leadership as the only non-elected member. He served as a visiting professor at the Conservatoire National des Arts et Metiers, a national university in Paris.

  • The 2016 Census of Canada: All About the Prairies

    Statistics Canada has just announced population counts from the 2016 census and the narrative is all about the Prairie Provinces. Alberta, Saskatchewan and Manitoba (yes, Manitoba) were the three fastest growing provinces. Metropolitan area growth was dominated by the Prairies, along with metropolitan areas outside the largest in Ontario and British Columbia.

    Provincial Results

    An analysis in the Globe and Mail indicates that Canada has been the fastest growing among the G7 nations. Since the last census (2011), Canada grew at a rate of 1.0 percent. This is above the 0.8 percent rate of the United States (which fell to 0.7 percent in 2015-2016). Canada’s growth rate was also well above that of the United Kingdom (0.7 percent) and five times the rate of the European Union (0.2 percent) and 10 times that of Germany (0.1 percent).

    Perhaps most astoundingly, British Columbia, which had shared growth leadership with Alberta since 1951 was pushed to fourth place in growth (5.6 percent).

    Leader Alberta grew 11.6 percent, while perennial slow growers Saskatchewan (6.3 percent) and Manitoba (5.8 percent), took the second and third positions. British Columbia grew only 5.6 percent, down from 7.0 percent between 2006 and 2011. The last time that Manitoba grew faster than British Columbia was in the 10 years before 1911, when Sir Wilfred Laurier was Prime Minister, William Howard Taft was President of the United States and eventual war leader H. H. Asquith was British Prime Minister.

    Usually strong growth Ontario, which accounts for nearly 40 percent of the national population, grew slower than Canada (5.0 percent), at 4.6 percent. This repeats the less than stellar performance of 2006 to 2011 and is the first time this has happened since World War II.

    Canada has three territories, all in the far north. Two grew rapidly, including Nunavut (12.7 percent) and Yukon (5.8 percent). Their populations, however, are very small, approximately 35,000 each. Nunavut covers a land area three times that of Texas, while Yukon is larger than California.

    Growth in Metropolitan Areas

    The same pattern can be seen in metropolitan areas (Table). Fastest growth among the 34 census metropolitan areas (CMA) was centered in the Prairie Provinces. Six of the fastest growing 10 metropolitan areas were in Alberta, Saskatchewan and Manitoba. Calgary grew the fastest, adding 14.6 percent to its population. Edmonton, Calgary’s neighbor to the north, and the capital of Alberta was the second fastest growing, at a 13.9 percent rate over the five years. These two metropolitan areas had seen some stalling of their prodigious growth due to oil industry reverses, however with petroleum prospects improving, could well see even greater growth in the years to come.

    More surprising has been the growth in the historically slow growing plains provinces just to the east. Saskatchewan’s two metropolitan areas were the next fastest growing. Saskatoon grew 12.5 percent. Regina, the provincial capital, grew 11.8 percent. These are strong growth rates for the Saskatchewan metropolitan areas, which until a decade ago had experienced a long period of slow growth.

    Lethbridge, Alberta’s third metropolitan area grew 10.8 percent, rounding out a top five in which all were from the Prairie Provinces.

    The next four positions were occupied by metropolitan areas near the largest (Toronto) and the third largest (Vancouver). Kelowna and Victoria, in British Columbia grew 8.4 percent and 6.7 percent respectively. In Ontario, Guelph and Oshawa grew 7.7 percent and 6.6 percent, respectively. This represented a shift in growth from the two larger metropolitan areas, which experienced an approximately one-third drop in their growth rates from the previous intercensal period (2006-2011), when they ranked in the top 10 in growth. Part of the reason for the greater growth in the metropolitan areas outside Vancouver and Toronto is their lower house prices. Vancouver’s housing affordability was the third worst out of 92 major metropolitan areas in the 2017 Demographia International Housing Affordability Survey, while Toronto was 14th worst.

    Winnipeg, the capital of Manitoba, was the 10th fastest growing, at 6.6 percent, and rounded out the six fast growing Prairie province metropolitan areas. Winnipeg’s growth over the last decade, like that of Saskatoon and Regina, is an important turnaround from its previous slower pace. Winnipeg grew faster than Toronto, Vancouver and Ottawa-Gatineau.

    The slowest growing metropolitan area was Saint John, New Brunswick lost 2.0 percent of its population. Six of the slowest growing (and losing) metropolitan areas were in Ontario. Brantford lost 1.0 percent of its population, while Thunder Bay had virtually no change. The other Ontario metropolitan areas in the bottom ten included Sudbury, Kingston, Peterborough and Windsor (just across the Detroit River from Detroit). Two Québec metropolitan areas were among the slowest growing, Saguenay and Trois-Rivières. Halifax, the capital of Nova Scotia was the 10th slowest growing, at 3.3 percent (Figure 2).

    As has been the case for the 45 years since it displaced Montréal, Toronto was Canada’s largest metropolitan area according to the 2016 Census, with a population of 5.9 million. Montréal held on to second place, with a population of 4.1 million. Vancouver was third, with a population nearing 2.5 million.

    Three metropolitan areas were bunched within a range of little more than 70,000. Calgary had a population of 1,393,000. The federal capital, Ottawa-Gatineau, which stretches across the Ottawa River, located on  the border between Quebec and Ontario, had a population of 1,324,000 and had led Calgary in 2011. Edmonton nearly duplicated the Ottawa-Gatineau number, at 1,321,000. Estimates in 2015 had placed Edmonton higher than Ottawa-Gatineau, but were not confirmed by the new Census numbers.

    The remaining four top ten gainers maintained their 2011 positions. Québec ranked 7th, followed by Winnipeg, Hamilton (in the greater Toronto area) and Kitchener-Waterloo, Canada’s Silicon Valley.

    Canada Metropolitan Areas: Population
    2011 to 2016 Census
    Rank Metropolitan Area 2011 2016 Change % % Rank
    1 Toronto   5,583,064   5,928,040   344,976 6.2% 12
    2 Montréal   3,934,078   4,098,927   164,849 4.2% 20
    3 Vancouver   2,313,328   2,463,431   150,103 6.5% 11
    4 Calgary   1,214,839   1,392,609   177,770 14.6% 1
    5 Ottawa – Gatineau   1,254,919   1,323,783     68,864 5.5% 15
    6 Edmonton   1,159,869   1,321,426   161,557 13.9% 2
    7 Québec      767,310      800,296     32,986 4.3% 19
    8 Winnipeg      730,018      778,489     48,471 6.6% 10
    9 Hamilton      721,053      747,545     26,492 3.7% 23
    10 Kitchener – Waterloo      496,383      523,894     27,511 5.5% 14
    11 London      474,786      494,069     19,283 4.1% 21
    12 St. Catharines – Niagara      392,184      406,074     13,890 3.5% 24
    13 Halifax      390,328      403,390     13,062 3.3% 25
    14 Oshawa      356,177      379,848     23,671 6.6% 9
    15 Victoria      344,580      367,770     23,190 6.7% 8
    16 Windsor      319,246      329,144       9,898 3.1% 26
    17 Saskatoon      262,215      295,095     32,880 12.5% 3
    18 Regina      211,519      236,481     24,962 11.8% 4
    19 Sherbrooke      202,261      212,105       9,844 4.9% 17
    20 St. John’s      196,954      205,955       9,001 4.6% 18
    21 Barrie      187,013      197,059     10,046 5.4% 16
    22 Kelowna      179,839      194,882     15,043 8.4% 6
    23 Abbotsford – Mission      170,191      180,518     10,327 6.1% 13
    24 Sudbury      163,067      164,689       1,622 1.0% 31
    25 Kingston      159,561      161,175       1,614 1.0% 30
    26 Saguenay      158,658      160,980       2,322 1.5% 29
    27 Trois-Rivières      151,773      156,042       4,269 2.8% 27
    28 Guelph      141,097      151,984     10,887 7.7% 7
    29 Moncton      139,287      144,810       5,523 4.0% 22
    30 Brantford      135,501      134,203     (1,298) -1.0% 33
    31 Saint John      129,057      126,202     (2,855) -2.2% 34
    32 Peterborough      118,975      121,721       2,746 2.3% 28
    33 Thunder Bay      121,596      121,621            25 0.0% 32
    34 Lethbridge      105,999      117,394     11,395 10.8% 5
    Source: Statistics Canada

    Photograph: Flag of Canada

    Wendell Cox is principal of Demographia, an international public policy and demographics firm. He is a Senior Fellow of the Center for Opportunity Urbanism (US), Senior Fellow for Housing Affordability and Municipal Policy for the Frontier Centre for Public Policy (Canada), and a member of the Board of Advisors of the Center for Demographics and Policy at Chapman University (California). He is co-author of the “Demographia International Housing Affordability Survey” and author of “Demographia World Urban Areas” and “War on the Dream: How Anti-Sprawl Policy Threatens the Quality of Life.” He was appointed to three terms on the Los Angeles County Transportation Commission, where he served with the leading city and county leadership as the only non-elected member. He served as a visiting professor at the Conservatoire National des Arts et Metiers, a national university in Paris.

  • Suburban Nations: Canada, Australia and the United States

    Professors David L. A. Gordon of Queens University (Canada) and Paul Maginn and Sharon Biermann of the University of Western Australia have now shown Australia to be a largely suburban nation. This follows on Professor Gordon’s work with colleagues in 2013 that came to the same conclusion on Canada based upon 2006 census data. By using census tract data, rather than municipality data, Gordon, et al were able to avoid the misleading but readily accessible jurisdictional analysis (central city versus suburbs) that equated large low-density central municipalities like Calgary and Edmonton, with more compact and dense municipalities like Vancouver and Montreal (or New York with Phoenix). The Gordon, et al criteria is illustrated in Figure 1.

    Broadly following the Gordon et al research, in the Spring of 2014, I published a similar “City Sector Model” using postal code tabulation areas (zip codes) for the major metropolitan areas of the United States. That criteria is illustrated in Figure 2.

    This article compares the Gordon findings in Canada and Australia and contrasts them with my findings in the United States.

    The Gordon Research: Canada and Australia

    In Australia, as in Canada, Professors Gordon, Maginn and Biermann divided metropolitan areas into four classifications at a small area level. The research called the urban core classification "active core," to note the greater dependence of residents on walking and cycling for commuting to work. They divided suburban areas into transit and auto suburban areas, and designated the more rural areas of metropolitan areas as exurban. In both countries, they used the functional or economic definition of cities, which is metropolitan areas or labor market areas (Note 1).

    Gordon, Maginn and Biermann’s analysis shows that Australia’s 27 metropolitan areas are 13 percent “active core”, nine percent transit suburbs, 69 percent auto suburbs and 10 percent exurban. This is nearly the same as the previous research on the 2011 Census of Canada which revealed 12 percent active core, 11 percent transit suburbs, 69 percent auto suburbs and eight percent exurban for all 33 metropolitan areas.

    The Major Metropolitan Areas (Over 1,000,000 Population) In the smaller number of Australian metropolitan areas with more than 1,000,000 population, the “active cores” are only slightly larger than those in Canada (12.4 percent of the metropolitan population versus 11.8 percent). But Canada’s major metropolitan areas has larger “transit suburbs” by a 12.2 percent to 10.0 percent margin. The “auto suburban” figures are virtually the same, with Australia at 70.5 percent and Canada at 70.7 percent. Finally, Australia has a slightly larger “exurbs,” at 7.2 percent compared to Canada’s 5.2 percent (Figures 3 and 4).

    Comparing to the United States

    In the United States, the City Sector Model uses somewhat different criteria. Gordon’s central classifications (“active core” and “transit suburb”) parallel the City Sector Model’s “urban core: CBD” and “urban core: inner ring.” Gordon’s “auto suburban” and “exurban” also roughly parallel the two “suburban” and the exurban City Sector Model classifications.

    Perhaps the largest difference between the two models is in the treatment of commuting. Professor Gordon’s approach is to classify the two central areas based on 50 percent higher than each metropolitan’s area average shares of walking, cycling and transit journey to work travel. The City Sector Model uses an across-the-board minimum 20 percent market share (transit, cycling and walking combined), to replicate a division between more dense pre-World War II development and the automobile oriented suburbs that followed.

    Comparing to the United States

    Of course, it is to be expected that the United States, with the lowest density built-up urban areas (called population centers in Canada and urban centres in Australia) would be even more suburban than Australia and Canada . This is indicated by the data (see Demographia World Urban Areas).

    There are large differences in the two more central classifications. In Australia, the two central areas have 22.4 percent of the metropolitan area population, somewhat less than Canada’s 24.0 percent. In the United States the two central areas have a smaller 14.8 percent of the metropolitan area population (Figure 5).

    Various factors account for this difference. There were, for example, huge urban core population losses   in the United States, but not in Canada and Australia. Another cause is the much earlier motorization of the United States, which by 1929, according to economist Robert Gordon, had achieved 0.9 vehicles per household and had 90 percent of the world’s registered vehicles (Note 2). With this unparalleled market penetration, the U.S. had a several decade long head start in automobile oriented suburbanization. Canada equaled the 1929 U.S. automobile market penetration in the middle 1950s and Australia in the middle 1960s.However, in the suburban classification, the metropolitan areas of the three nations were very similar. The US automobile suburb share of the population, at 68.8 percent was within two percentage points of both Canada and Australia. However, like the urban core, the suburbs showed considerably different results, with the United States having a 16.4 percentage exurban share, compared to approximately 10 percentage point lower shares in both Canada and Australia.

    Part of difference in the exurbs is the larger geographic size of U.S. metropolitan areas, which are far less representative in capturing the genuine labor market. The building geographical blocks used by the U.S. Office of Management and Budget are simply too large for sufficient preciseness. This is illustrated by the Riverside-San Bernardino metropolitan area, which covers an area about the same size as the Canadian province of New Brunswick or the Australian state of Tasmania. By contrast, in Canada, Statistics Canada uses municipalities to construct metropolitan areas, while Australia uses “Statistical Areas Level 4,” which are generally smaller than US counties (Note 3). When the boundaries of a metropolitan area are far larger than the actual commuting shed (as often happens in the United States), more people will be in the metropolitan area.

    At the same time, these results must be interpreted carefully, since there are differences in the criteria and geographical building blocks of metropolitan areas in all three nations.

    Comparison of Population Growth

    Professor Gordon’s research in both nations shows suburban growth   far out stripping growth in the central areas. In Canada, nearly 84 percent of major metropolitan area population growth between 2006 and 2011 was in the “auto suburbs” and “exurbs” (Figure 6). In Australia (27 metropolitan areas), the “auto suburbs” and “exurbs accounted” for nearly 78 percent of population growth (Figure 7). In the United States, the suburbs and exurbs accounted for over 85 percent   (Figure 8).

    Suburban World

    Contrary to planning preference for dense urbanization, suburbanization has occurred virtually wherever people can afford cars. This is even true in Europe, Japan and China. For example, the municipality of Paris continues to languish with a population a quarter below its level of 135 years ago (1881). The 8 million resident urban area growth since that time has been in the suburbs , which now cover more than 25 times the area of the ville de Paris (the central municipality). Other examples, such as the core municipalities of Copenhagen (from 1950), Barcelona and Milan (from 1970) have suffered significant population losses while all metropolitan area growth has been in the suburbs. There are many similar examples around the world.

    Even with the differing definitions, the data in Canada, Australia and the United States is remarkably similar. Of course, not all suburbs are the same, but it should not be surprising that the organic growth of cities continues on their edges.

    Note 1: For further information see: Paul Cheshire, Max Nathan and Henry G. Overman of the London School of Economics in their recent book, Urban Economics and Urban Policy: Challenging Conventional Policy Wisdom.

    Note 2: See Robert J. Gordon, The Rise and Fall of American Growth: The U.S. Standard of Living Since the Civil War, page 374, reviewed at http://www.newgeography.com/content/005364-robert-gordons-notable-history-economics-and-living-standards.  

    Note 3: The larger size of US exurbs is illustrated by the 11,400 square kilometer average areas outside the principal urban areas (exurbs) of US metropolitan areas. In Australia, the average outside the principal urban centres is 6,500 square kilometers, while in Canada the average area outside the principal population centres is 4,600 square kilometers (data based on metropolitan areas with more than 1,000,000 population).

    Wendell Cox is principal of Demographia, an international public policy and demographics firm. He is a Senior Fellow of the Center for Opportunity Urbanism (US), Senior Fellow for Housing Affordability and Municipal Policy for the Frontier Centre for Public Policy (Canada), and a member of the Board of Advisors of the Center for Demographics and Policy at Chapman University (California). He is co-author of the “Demographia International Housing Affordability Survey” and author of “Demographia World Urban Areas” and “War on the Dream: How Anti-Sprawl Policy Threatens the Quality of Life.” He was appointed to three terms on the Los Angeles County Transportation Commission, where he served with the leading city and county leadership as the only non-elected member. He served as a visiting professor at the Conservatoire National des Arts et Metiers, a national university in Paris.

    Photo: Brisbane, Australia Inner Suburbs (by author)