Tag: Canada

  • A Canadian Autobahn

    Canada is the largest high-income nation in the world without a comprehensive national freeway (autobahn, expressway or autoroute) system. Motorways are entirely grade separated roadways (no cross traffic), with four or more lanes (two or more in each direction) allowing travel that is unimpeded by traffic signals or stop signs.

    The Economic Advantages of Motorways: Motorways have been associated with positive economic and safety impacts. For example, a synthesis of research by the American Association of State Highway and Transportation Officials (AASHTO) noted the positive impact of US motorway system:

    The Interstate Highway System represented an investment in a new, higher speed, safer, lower cost per mile technology which fundamentally altered relationships between time, cost, and space in a manner which allowed new economic opportunities to emerge that would never have emerged under previous technologies.

    In particular, the AASHTO synthesis indicated that motorway

    …investments have lowered production and distribution costs in virtually every industry sector.

    It is a well known fact that motorways are by far the safest roads. We estimated that 187,000 fatalities had been averted due to the transfer of traffic from other roads to motorways between 1956 and 1996.

    A World of Motorways: Truckers in Japan, Europe (the EU-15) and the United States can travel between virtually all major metropolitan areas on high quality motorways.

    Further, motorway systems have and are being built in developing nations. By far the most impressive is China, which now has approximately 65,000 kilometers of motorway, not including motorways administered at the municipal level (as in Shanghai and Beijing). Only the United States has more, at approximately 85,000 kilometers. China’s plans call for the US figure to be exceeded within a decade. These roads are being built not only throughout populous eastern and central China, but also to the Pamirs at the Kazakh border and to Lhasa, in Tibet, across some of the most desolate and sparsely populated territory in the world. Mexico, a partner with Canada and the United States in the North American Free Trade Agreement also has an extensive motorway system.

    Motorways in Canada: Canada, however, is an exception. Only a quarter of metropolitan areas are connected to one another by motorways. Edmonton and Calgary are among the few metropolitan areas in the developed world that are not connected to comprehensive motorway systems (Vancouver is connected to the US system, but not to the rest of Canada).

    For many trips between Canadian metropolitan areas, it takes less time to travel through the United States on its motorways than on the Canadian roads (such as between Winnipeg or Calgary and Toronto). The principal problem is the long, crowded, slow, two-lane stretch of roadway through the northern Great Lakes region between the Manitoba-Ontario border and between Sudbury and Parry Sound. There is also a long section of roadway in the British Columbia interior that a Calgary talk show host referred to as a “stagecoach” trail. Canada pays an economic price for this lack of a world-class highway system, both in terms of manufacturing and tourism.

    However, parts of Canada are well served by motorways. Much of central and eastern Canada is connected by motorways, with routes from Windsor, Ontario, through Toronto, Ottawa, Montreal, Quebec to Halifax. This route includes only a short segment that is not motorway standard in the province of Quebec as it approaches the New Brunswick border.

    Moreover, despite its reputation to the contrary, the largest Canadian urban areas have world class freeway systems. Few, if any, urban areas in the United States or the developed world have more kilometers of motorway or motorway lanes in relation to their urban area size as Toronto and Montreal.

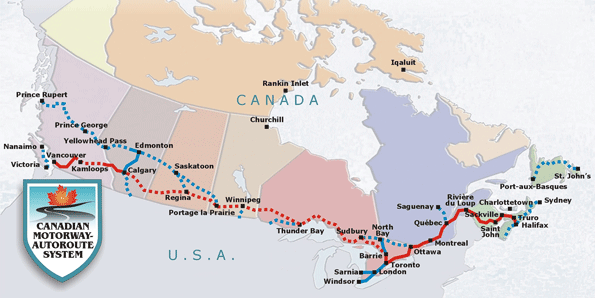
    A Canadian Autobahn: In cooperation with the Frontier Centre for Public Policy, we proposed a world class highway system for Canada. In a report entitled “A Canadian Autobahn: Creating a World Class Highway System for the Nation” we proposed:

    1. Upgrading the entire transcontinental route from Halifax, through Toronto to Vancouver to motorway standards. These improvements should be completed within 10 years and would cost approximately $28 billion (2009$).
    2. Upgrading other principal routes to at least pre-motorway standard, which would require “twinning” (four-lanes) and minimizing the number of grade crossings. The longest of these additional highways is the Yellowhead route: Edmonton and Calgary to the Canada-U.S. border; Ottawa to Sudbury; and across the island of Newfoundland. These improvements should be completed within 15 years and would cost approximately $33.5 billion).

The transcontinental route would provide a long overdue economic stimulus to urban areas such as Thunder Bay and Sault Ste. Marie. The improved Yellowhead route would provide far better access to the new deepwater, superport at Prince Rupert (British Columbia), which is the closest North American port with connections to major Asian markets. This could materially improve Prince Rupert’s competitiveness relative to larger ports on the US West Coast, such as Los Angeles and Long Beach (which have become much less competitive themselves in the last decade). The improved roadway would make it possible to effectively serve the markets of the US Midwest, South and East through a connection to I-29 in North Dakota.

The report was unveiled at a Calgary event on October 29 and was covered by media across the nation.

What About Greenhouse Gas Emissions: A question was raised about the advisability of expanding highways at a time that the world is attempting to reduce greenhouse gas (GHG) emissions. Such a strategy would seem to be at odds with the popular perception that we shall all have to abandon our cars and move into flats in the central city. This perception presumes that people are prepared to return to the standards of living and lifestyles of 1980, 1950 or even 1750. In all of my presentations on similar issues I am yet to uncover any groundswell of support for the lifestyles of yesterday.

It needs to be recognized that the international commitment to reducing GHGs is based upon an assumption of minimal impact on the economy. GHG reductions will be achieved only if they are acceptable to people, which requires acceptable costs (research by the United Nations International Panel on Climate Change suggests an upper bound of $50 per ton). Cost effectiveness is necessary to not only prevent a huge increase in poverty, but also to allow continued progress toward poverty alleviation and upward mobility. In fact, as recent US research indicates, there is scant real world potential to reduce GHGs from reduced levels of driving.

Given the strong association between economic growth and personal mobility, there is a single realistic path to substantial GHG emission reduction: better technology. Fortunately, developments suggest that technology is, indeed, the answer.

The question, thus, comes down to whether jobs in the northern Great Lakes region (and elsewhere) are more important than strategies that are politically correct, but comparatively ineffectual with respect to materially reducing GHG emissions. It seems likely that people will place a priority on jobs.

Finance: Because of the importance of tying the nation together, it would be appropriate to spend federal and provincial funds on the Canadian Autobahn. User fees, such as a dedicated gasoline tax (as in the United States) or tolls (as in France, China and Mexico) could finance the expansions, using public-private partnerships or “arms-length” government corporations.

Wendell Cox is a Visiting Professor, Conservatoire National des Arts et Metiers, Paris. He was born in Los Angeles and was appointed to three terms on the Los Angeles County Transportation Commission by Mayor Tom Bradley. He is the author of “War on the Dream: How Anti-Sprawl Policy Threatens the Quality of Life.

  • Lost City

    We agreed, last time, to meet at the corner of Yonge & Bloor – Toronto’s busiest subway stop.

    Presumably you’ll arrive by subway. There are two main lines: one east-west along Bloor-Danforth, from Kipling Ave. in Etobicoke to Scarborough Town Centre. The intersecting north-south line is actually double. One branch runs almost the entire length of Yonge St., from Finch to Union Station. From there it doubles back, heading north again under University Ave and Avenue Road, finally ending near Downsview Airport. They intersect at three stations, all along Bloor Street: Bloor & Spadina, Bloor & Avenue Road (St. George), and Bloor & Yonge. The latter is where you want to get off.

    The Toronto subway is clean, quiet, convenient and runs on time. It is also very slow; I doubt top speed is much over 30 mph. You can get most places you need to go, but you won’t get there quickly.

    Another way to get close to Yonge & Bloor is by street car. Actually, the best you’ll do is Yonge and College, and then you’ve got a few blocks to walk. Tourists and Americans love the street cars – they are fun. For the commuter they are a pain. Mostly they share right-of-way with cars. This slows down the street car, and worse, slows vehicle traffic to the same pace (they’re almost impossible to pass). The result: traffic down Queen St. rolls by at a solid 15 mph. This is not an efficient mass transit method, but tourists love it.

    Metro Toronto consists of six boroughs: Toronto, Scarborough, North York, Etobicoke, York, and East York. The latter two are very small – I have never actually “been” to either; I’ve just driven through. I’ve stayed over night in all of the others. Metro Toronto resulted from city-county consolidation of York County in 1954. (Toronto was originally founded as York, but changed the name shortly after, presumably to avoid confusion with New York.)

    Skipping the two little ones (directly adjacent to Toronto proper), Toronto City is the original city. It is bounded by the lake to the south and very roughly Eglinton Ave. in the north, the Don Valley to the east, and the Humber River in the West. Scarborough is east of the Don Valley, Etobicoke is west of the Humber, and North York is north of Eglinton.

    So here we are at Yonge and Bloor Streets. Let’s go east. Bloor ends within a mile at Parliament St. and then becomes Danforth. Danforth crosses over the Don Valley in a most dramatic way. Given that Toronto cannot effectively use its lakefront, the most prominent natural landmark in the city is the Don Valley. This is a deep gorge cut by the Don River, which flows south to Lake Ontario, east of the city centre. The gorge is a park traversed by the Don Valley Parkway – an expressway that runs along the bottom of the gorge from the Gardiner Expwy to the northern city limit. The Don Valley also marks the approximate boundary between Toronto City and Scarborough (the actual boundary lies to the east at Victoria Park Ave.).

    Crossing the Don Valley, especially near the southern end where the gorge is deepest, requires a significant bridge. And this is what happens on Danforth – probably the most spectacular view in the whole city. It’s even nice on the subway, which crosses the same bridge on a lower level. Across the bridge (not yet in Scarborough) is Toronto’s vibrant Greek community. Once in Scarborough, Danforth veers northeast so as to parallel the lake. It will eventually take you to Scarborough Town Centre.

    My first impression of Scarborough was British. The place is full of typical Toronto bungalows that look very much like typical suburban London bungalows (think Keeping Up Appearances). But in the meantime appearances don’t mean much: Scarborough has become one gigantic Chinatown. The predominant language at the corner of Midland and Finch (where I have spent a lot of time) is Chinese. The primary commercial street, Kingston Road (the continuation of the Gardiner Expwy along the lake) is mostly Chinese. Now Chinese are likely a bigger share of commercial life than population, but without a doubt, Scarborough has a large Chinese community. It’s very vibrant, and it makes for good food.

    The main street of North York, on the other hand, is the 401 expressway. This is the longest expressway in Canada, going from Windsor to Montreal. In Toronto it runs from Pearson Airport in the west through Etobicoke, North York, Scarborough and points east, roughly along Lawrence Ave. On my most recent visits, North York struck me as at best lower middle class – it is definitely the poorest of the six boroughs (at least the bigger ones). Immigrants are from all over: Russia, India, Africa, Latin America, the Caribbean. It is not as lively as Scarborough, but it still has very good food.

    I haven’t been to Etobicoke since the early eighties. Then it was mostly Italian and solidly middle class. The eastern boundary of the borough is the Humber River, a much less dramatic counterpoint to the Don Valley.

    Starting at Bloor and heading north on Yonge, one comes first to St. Clair – about a mile away. Yonge & St. Clair is called Midtown, and is an elegant residential neighborhood. A mile north of St. Clair brings you to Eglinton, which (apart from the expressways) is the major E-W traffic thoroughfare. It is the first street north of Danforth to cross the Don Valley; it spans the entire city from Pearson Airport to eastern Scarborough.

    Continuing north puts one in North York – Wilson (which doesn’t go through), the 401, Lawrence (a shopping street in North York), Sheppard, Finch and Steeles (the northern city limit). The latter three cross the Don Valley, which is much smaller that far north. All of these are about a mile apart.

    Recall the history of Toronto: founded as the cultural capital of British North America, dedicated to British rule, Good Government & Good Order. When I first visited Toronto in the 1970s it lived up to that ideal. Since then the city has become one of immigrants, lots of good food, but not very British. What does that mean for British North America? Is Good Government & Good Order a sufficiently stirring rallying cry to create a civic life from all the ethnic groups? Where is the unum amidst all that pluribus? Canada is betting its future on multiculturalism. They really have no other choice, but will the city maintain its original soul throughout these changes?

    Daniel Jelski is Dean of Science & Engineering State University of New York at New Paltz.

  • Let Freedom Ring: Democracy and Prosperity are Inextricably Linked

    With autocratic states like China and Russia looking poised for economic recovery, it’s often hard to make the case for ideals such as democracy and rule of law. To some, like Martin Jacques, author of When China Rules, autocrats seem destined to rule the world economy.

    A columnist for the Guardian, Jacques predicted that by 2050 China will easily surpass America economically, militarily and politically. The belief in the power of autocracy even extends to such leading American capitalists as Warren Buffett and Bill Gates, who have nothing but high praise for what Gates enthusiastically describes as a “brand-new form of capitalism.”

    Fortunately a new study released Monday by my colleagues at the Legatum Institute refutes the notion that the road to worldly riches lies in autocracy and repression. In a careful study of everything from economic opportunity, education and health to security, freedom of expression and societal contentment, the Legatum “Prosperity Index” makes a powerful case for the long-term benefits of democracy, free speech and the rule of law.

    Some of this stems from how Legatum measures prosperity. The survey takes into account both wealth and well-being, and finds that the most prosperous nations in the world are not necessarily those that just have a high GDP, but that also have happy, healthy, free citizens.

    The top of the list, which ranks 104 countries, is dominated by flourishing democracies. The only exception in the top 20 is No. 18’s Hong Kong, which ranks first in economic fundamentals and continues to be ruled, if not quite democratically, under a far more permissive system than the rest of mainland China. The next semi-autocratic state on the list is Singapore, at No. 23 – another Confucian-style autocracy with great economic and human capital fundamentals.

    This linking of democracy and prosperity with well-being is by far the most significant aspect of the study. But what else determines the success of nations in the modern world?

    1. Small democracies do best.

    The denizens of the Greek city-states or their Renaissance counterparts would have recognized something of themselves in the small, well-managed countries that dominate the top of the list. The top five, Finland, Switzerland, Sweden, Denmark and Norway – as well as the Netherlands at No. 8 – certainly fit this description. These countries rank highly on the quality of life measurements, and, not surprisingly, their main cities also tend to dominate the most-livable-cities lists. With the exception of Switzerland and the Netherlands, these places do not perform as well in terms of basic economics, scoring between 10th and 18th. Although some might ascribe these rankings to successful social democratic policies, virtually all these mini-states have instated significant market-oriented reforms in recent years.

    Other top players Australia (No. 6) and Canada (No. 7) are far larger than their European rivals. And though their citizens are not as socially coddled as in Scandinavia, they enjoy strong democratic institutions, high levels of social well-being and good governance and education.

    And in purely economic terms Australia and Canada boast better economic fundamentals than the Scandinavian countries. One reason may be their enormous stockpiles of natural resources, now in high demand from countries like China and India. These countries also benefit by a large and often skilled migration from these and other Asian countries.

    2. Among the mega-countries, the U.S. is still way ahead

    Don’t cry for me, America. In terms of the large countries, both in population and size, no one comes close to the No. 9-ranked U.S. Indeed there’s not another country with over 100 million people on the list until you get to Japan at No. 16.

    Like all big countries, America is a complicated place, with distinct areas of strength as well as disturbing weaknesses. The U.S. leads all countries in entrepreneurship and innovation and ranks second in the stability of its democratic institutions – the Swiss are No. 1. Less than optimal health and safety rankings, however, push America from the top. Its economic fundamentals are also sub-prime, ranking only 14th, which isn’t surprising in light of persistent current account and now government deficits.

    Despite its problems, the U.S. still outperforms its other large rivals, not only Japan but also the U.K. (No. 12), Germany (No. 14) and France (No. 17). Yet judged within the ranks, all four of these economies have to be considered successful in terms of delivering prosperity and a reasonably high quality of life to their citizens.

    3. Breaking down the BRICs

    The Index’s most fascinating findings can be found a bit further down. The focus of the world’s economy has been shifting to countries that have been – and in some cases remain – governed by Communist, military or single-party dictatorships.

    Democracy’s efficacy can be seen clearly in success enjoyed by the former European Communist states – the Czech Republic, Poland, Latvia, Estonia, Slovakia and Hungary – all of which land in the first third of the ratings. Similarly, Taiwan (ranked 24th) and South Korea (26th), long ruled by military-dominated dictatorships, show how democratization and rising prosperity can flourish together.

    This pattern can also be seen among the “big boys” of the economic upstarts – the so-called BRIC countries. Here the leaders of the pack are both functioning democracies, Brazil (No. 41) and India (No. 45). These rapidly growing economies are kept out of the top tier by significant shortcomings in vital fields such as education, health and public safety.

    The other two BRIC powers, China and Russia, neither of which can be considered anything close to open societies, lag behind. Russia’s mineral wealth gets it a respectable 39th in economic fundamentals, but a lack of democracy, personal freedom and personal safety – as well as poor governance and corruption – drags it down to a paltry 69th. China, ranked a disappointing No. 75, also performs admirably on economic fundamentals, clocking in at No. 29, but is hammered for glaring shortfalls in democracy, personal freedom and governance as well as health and education.

    4. Autocracy may seem to pay, but not in the long run

    Throughout modern history, autocracy has proved effective in sparking fast growth, but a pervasive democratic deficit, poor governance and lack of personal freedom seem likely to constrain long-term progress. For one thing, the ruling elite in the dictatorship is under no strong compulsion to adjust to the needs of its population. Short of forestalling outright rebellion, nest-feathering tends to gain the upper hand.

    As you get to the bottom of the list, the price of dictatorship rises higher still. In this nether-region, there is nary a democratic state. Some of the low-ranking Third World countries are obvious – like Cameroon (No. 100) or Yemen (No. 101) – but some potentially rich but despotically ruled nations do poorly as well.

    Take, for example, No. 94 Iran, a country with enormous natural resources, a well-educated population and a rich cultural heritage. A reasonably enlightened Iran would likely sit in the top third of the list instead of skipping toward the bottom.

    Even the bottom-ranked country, Zimbabwe, left its colonial period with a thriving agriculture sector and great mineral wealth. Here again despotic rule has shown itself an adept destroyer of economic promise.

    In these times of acute self-doubt not only in America but across the democratic world, the Legatum ratings validate the idea that if democracy is not the inevitable wave of the future it represents by far the most efficient way to manage a society. In the end, democracy and prosperity prove not two distinct elements, but, in fact, inextricably linked to each other.

    This article originally appeared at Forbes.com.

    Joel Kotkin is executive editor of NewGeography.com and is a distinguished presidential fellow in urban futures at Chapman University. He is author of The City: A Global History. His next book, The Next Hundred Million: America in 2050, will be published by Penguin Press early next year.

  • The Compromise by the Lake

    Toronto is a nice city.

    If that seems like faint praise, then so be it; I’m not a great Toronto fan. Don’t get me wrong. It is a wonderful city for the tourist, and temporary residents I know swear by the place. But it’s not my kind of town.

    I spent much time in Toronto in the 1980s and 90s. My first visit must have been in 1970 or so, and I was last there on a very cold, January day in 2003.

    The city used to be known as “Tidy Toronto.” Indeed, that was the impression I got from my first visit – it all seemed very British, very clean, very orderly. In the 1970’s the Blue Laws were strict – it wasn’t possible to buy a cup of coffee on a Sunday morning. For the tourist (as I was then) it made for an unpleasant stay. These rules have weakened over the years, but as far as I know, many shopping malls and large stores are still closed on Sunday.

    In contrast to the United States (Life, Liberty & the Pursuit of Happiness), Canada was founded as British North America on the principles of Good Government & Good Order. The Blue Laws are of a piece. There are some nice things about this: Canadian parks, including Toronto city parks, are much nicer and better maintained than their American counterparts. Toronto supports one of the largest public library systems in North America (an expensive anachronism?). They have street cars. The streets are (or at least were) cleaner. Canadian hotels and motels are fantastic – and apart from boring Sundays, Canada surely is one of the best countries in the world for the tourist. By all means, visit Toronto.

    But compared to American cities of comparable size – Boston, Atlanta, Seattle – Toronto is stifling, provincial, and culturally unimportant. This, I believe, is why.

    The city is situated on the northwest shore of Lake Ontario. The street system is oriented by the lake, which means E-W streets roughly parallel the shore. Thus, going east on Bloor will put you on a 75 degree heading. North-south streets are perpendicular – Yonge Street heads north at 345 degrees.

    The lake is the city’s geographical feature of note, and serves as a transportation artery. Both the railroad and the Gardiner Expressway run right along the lakefront, thus cutting the city off from the water. City planners have tried mightily to rectify this fundamental error in design: they have built as many urban attractions as they can on the water side of the tracks, beginning with Queen’s Quay. This is nice enough, but is not easily accessible for pedestrians (one has to cross both the expressway and the tracks to get there). And then it is a synthetic cityscape, such as Manhattan’s South Street Seaport or Chicago’s Navy Pier: seen one, you’ve seen them all. Off shore are the Toronto Islands, now mostly used as park space. I’m ashamed to admit I’ve never been there.

    I’ve always thought of the center of town being the corner of Yonge and Bloor Streets, for that surely is the busiest subway stop. It is an impressive corner, similar to Chicago’s Michigan Ave (though on a much smaller scale).

    South of Bloor, Yonge Street is the city’s major promenade, where young people go to see and be seen. They strut by on wheels and on foot, in hot rods and hot clothes. It’s a great place to walk on a Summer evening.

    A half mile (Toronto’s streets were designed long before Canada went metric) south of Bloor is Dundas Street, a street that doesn’t follow the grid (probably an old Indian trail). Yet another half mile south is Queen Street, the main E-W pedestrian thoroughfare and location of Eaton Centre – a huge, indoor shopping mall (apparently now open on Sunday). Further south are King Street, Front Street, Union Station, and then the Gardiner Expressway at the foot of Yonge Street. Yonge St. becomes less lively south of Queen St.

    Walking west on Queen Street (highly recommended) one comes first to Nathan Phillips Square, location of the justly famous Toronto City Hall. The old city Hall, a beautiful red brick building to the east, is just as impressive. In the summer there are fountains, and in the winter ice skating. Beyond this is Osgood Hall, a judicial institution and a lovely building surrounded by a marvelous garden. Go inside if you can. En route you will cross Bay Street, Canada’s financial center. The heart of the financial district is Bay & King Streets.

    Continuing west brings one to University Avenue, a broad, visually spectacular boulevard. It is full of institutions: Ontario Hydro has its headquarters here, as do large insurance companies. It is not a shopping street. About a mile north, University Ave. divides to surround Queen’s Park, the location of the Ontario Provincial Legislature. It is a beautiful park and an interesting building. “At Queen’s Park today,” begins many a news cast, “Premier McGuinty announced…” North of Queen’s Park, University Avenue turns into the redundantly named Avenue Road.

    Continuing west on Queen brings one to Spadina Avenue, a major N-S traffic thoroughfare. Spadina and Dundas is the center of the traditional Chinatown. North of that, between Spadina and Queen’s Park, is the University of Toronto – the center of the campus is surrounded by King’s College Circle, and a pleasant walk.

    Beyond Spadina, Queen Street is Toronto’s version of Greenwich Village, known as the Gallery District. Here are nice cafes, bookstores, small shops. I believe this used to be the center of the Italian district, and Italians still live on the West End and in Etobicoke. But West Queen St. has outgrown the ethnic identity.

    Bathhurst, about a mile west of Spadina, forms the outer edge of the city center. Beyond this Queen Street looked like a slum, at least when I was last there.

    East Queen Street, east of Jarvis, is skid row.

    North of Bloor, between Yonge and Avenue Road, is an area called Yorktown – a mostly pedestrian area with narrow streets, small shops, and sidewalk cafes. Just to the east of Yorktown is Rosedale, a very elegant neighborhood of beautiful homes. Both are worth exploring on foot.

    So that brings us back to the corner of Yonge & Bloor. Next time we’ll start again from there.

    And what happens if you go east on Bloor?

    Daniel Jelski is Dean of Science & Engineering State University of New York at New Paltz.

  • Rating World Metropolitan Areas: When Money is an Object

    American metropolitan areas have been the subject of considerable derision. Often characterized as inferior to those of Australia, Canada, Europe and even of Japan by planners and politicians who travel abroad, there has long been a desire to reshape American cities along the lines of foreign models. Yet, despite this, American metropolitan areas generally provide a standard of living to their residents unmatched anywhere in the world. This is based upon the latest comparative economic data for the world’s most affluent metropolitan areas.

    International Rankings: American metropolitan areas never seem to place near the top of “quality of living” or “livability” indexes, such as those published by The Economist and the Mercer consulting group. On the other hand European, Australian and Canadian metropolitan areas usually grab the honors, frequently led by the likes of Vancouver, Melbourne, Zurich or Vienna.

    The media routinely reports these rankings without serious analytical analysis, which can lead to misunderstanding or even misrepresentation in comparing metropolitan areas on issues of living standards (Note 1). As Owen McShane pointed out on this site before, these ratings serve their purpose, which is to rank metropolitan areas based upon their “attractiveness to expatriate executives”. Not only do these lists fail to consider housing affordability, as McShane indicates, they also do not consider the overall economic performance of metropolitan areas in regard to their residents, which is not an insignificant matter. These highly publicized international listings might be thought of as “money is no object” ratings.

    When Money is an Object: The problem here: money is an object for the great majority of people living in the world’s metropolitan areas. This is true in Kinshasa, Seattle, Vancouver or Vienna.

    When the available measures of affluence or the standard of living are considered, the picture for US cities drastically improves. Here the US metropolitan areas dominate the list. The best available data is gross domestic product (GDP) per capita, adjusted for national level purchasing power (Note 2). Metropolitan area GDP data is now produced by the Bureau of the Census in the United States and regional data generally conforming to most metropolitan areas is available for the European Union by Eurostat (Note 3). Data for other metropolitan areas can be estimated from other national and regional sources.

    In 2005 (the latest available data), The Economist top ten averaged 57th in GDP per capita in the world. Mercer’s top ten did even worse, averaging 62nd. None of The Economist or Mercer top 10 ranked was among the 25 metropolitan areas with the highest GDP per capita. Vienna ranked best, at 27th. Perennial favorites Vancouver and Melbourne ranked 71st and 72nd (Table 1). Zurich, another rating champion, ranks 74th, just ahead of Oklahoma City. In contrast, only 5 of the 51 large metropolitan areas in the United States ranked behind Vancouver, Melbourne and Zurich.

    Table 1
    Top 10 Economist & Mercer "Cities"
    Ranked by Affluence
    (GDP per Capita, Purchasing Power Parity)
    Metropolitan Areas over 1,000,000 Population
    City or Metropolitan Area GDP per Capita: Rank among Top 100 World Metropolitan Areas The Economist Mercer
    Vienna 27 2 1
    Perth 28 5
    Munich 40 7
    Calgary 46 6
    Frankfurt 51 8
    Sydney 62 9 10
    Toronto 67 4
    Vancouver 71 1 4
    Melbourne 72 3
    Zurich 74 10 2
    Helsinki 84 7
    Auckland 84 5
    Dusseldorf 99 6

    100 Most Affluent World Metropolitan Areas: GDP per capita estimates for 2005 are provided for the 100 most affluent metropolitan areas in the world with more than 1,000,000 residents (Table 2).

    Dominance of the United States: It is perhaps not surprising that San Jose, California ranks as the richest major metropolitan area in the world, with a 2005 GDP per capita of $78,700. Number 2, however, is a surprise: Charlotte, NC-SC, which not only pirated away San Francisco’s largest bank some years ago and has now displaced the tony city by the Bay in the runner-up position. San Francisco and Washington, DC rank third and fourth most affluent in the world. Brussels, grown fat on the largesse of its European Union taxpayers, ranks 5th.

    The dominance of the United States is illustrated below.

    • The US has 8 of the 10 richest metropolitan areas in the world. Only Stockholm, at number 9, joins Brussels in the top 10 from outside the United States.
    • The US has 22 of the top 25 metropolitan areas (Figure)
    • 37 of the most affluent 50 metropolitan areas are in the United States. By contrast, Mercer ranks only seven US “cities” in the top 50.
    • 46 of the 70 richest metropolitan areas are in the United States

    Only one of the 51 US metropolitan areas with more than 1,000,000 fails to make the top 100 in the world, Riverside-San Bernardino ($25,800), which could just as easily be considered a part of the Los Angeles metropolitan area, just as San Jose could be considered a part of the San Francisco metropolitan area.

    Outside the United States: Outside the United States, the metropolitan areas of Australia and Canada perform best relative to their size. All five of Australia’s largest metropolitan areas placed in the top 100, with one in the top 50. Five of Canada’s six top metropolitan areas made the top 100, with one in the top 50. Europe placed 33 of its metropolitan areas in the top 100, with 11 in the top 50 and 22 in the second 50.

    The top 100 list provides some surprises.

    • One eastern European metropolitan area has already entered the top 100. Prague ranks 48th, with a GDP per capita of $42,400, which is more than Frankfurt or Phoenix.
    • London, arguably the world’s financial capital, ranks 44th, at $42,700. Some listings show London much higher, however such rankings exclude the outer portion of the metropolitan area, which these estimates include.
    • Tokyo-Yokohama ranks 79th, at $35,700. This ranking is lower than others, which either ignore purchasing power or exclude most of the metropolitan area by focusing only on the high income core (the prefecture of Tokyo).
    • The world’s two large “city-states,” Singapore and Hong Kong also make the list. Singapore ties Louisville and Sacramento at 53rd, with a GDP per capita of $41,500. Hong Kong ranks 79th, at $35,700. Moreover, it would not be surprising if other Chinese metropolitan areas begin to break into the top 100 over the next decade.

    Ranking Metropolitan Areas for People: American metropolitan areas provide their residents a superior standard of living. True enough, the mountains and water features of Vancouver or Zurich are superior to those of Oklahoma City or Charlotte. However, the average resident does not have enough money to spend much time boating in Vancouver or Zurich or taking in what may be a better cultural life. The standard of living may well be better for those with money in Vancouver, Vienna, Melbourne or Zurich than it is in an American metropolitan area. However, most people cannot afford to live like financiers and other “jet-setters.” For everyday people, the American metropolitan area remains the best place in the world to live.

    Table 2
    Top 100 World Metropolitan Regions 
    Gross Domestic Product per Capita: 2005 Estimates
    Purchasing Power Parity
    Metropolitan Areas over 1,000,000 Population
           
    Rank Nation Metropolitan Area GDP per Capita
    1 United States San Jose $78,700
    2 United States Charlotte $67,900
    3 United States San Francisco $65,400
    4 United States Washington $65,300
    5 Belgium Brussels $63,700
    6 United States Boston $59,000
    7 United States Seattle $57,600
    8 United States New York $56,200
    9 Sweden Stockholm $55,100
    10 United States Hartford $55,000
    11 United States Denver $54,700
    12 United States Minneapolis-St. Paul $54,600
    13 Germany Hamburg $53,500
    14 United States Dallas-Fort Worth $53,000
    15 United States Houston $51,900
    16 United States Indianapolis $51,800
    17 United States Philadelphia $50,100
    18 United States San Diego $50,000
    19 United States Atlanta $49,600
    20 United States Los Angeles $49,100
    21 United States Chicago $48,400
    22 United States Salt Lake City $48,200
    23 United States Milwaukee $47,800
    24 United States Nashville $47,700
    24 United States Columbus (Ohio) $47,700
    26 United States Las Vegas $47,400
    27 Austria Vienna $47,000
    28 Australia Perth $46,700
    29 United States Portland (Oregon) $46,600
    30 United States Kansas City $46,400
    31 United States Richmond $46,200
    32 United States Orlando $45,900
    32 United States Cleveland $45,900
    34 France Paris $45,700
    35 United States Memphis $45,500
    35 United States Detroit $45,500
    37 United States Austin $45,300
    37 United States Raleigh $45,300
    39 Ireland Dublin $44,300
    40 Germany Munich $43,800
    40 United States Baltimore $43,800
    42 United States Birmingham $43,500
    43 United States Miami $42,900
    44 United Kingdom London $42,700
    44 Denmark Copenhagen $42,700
    46 Canada Calgary $42,600
    46 United States Cincinnati $42,600
    48 Czech Republic Prague $42,400
    48 United States Phoenix $42,400
    50 Netherlands Utrecht $41,900
    51 Germany Frankfurt $41,800
    52 United States New Orleans $41,600
    53 United States Sacramento $41,500
    53 United States Louisville $41,500
    53 Singapore Singapore $41,500
    56 United States Pittsburgh $41,400
    57 Canada Ottawa $41,200
    57 United States Jacksonville $41,200
    59 Netherlands Amsterdam $41,000
    60 United States St. Louis $40,900
    61 France Lyon $40,400
    62 Australia Sydney $40,100
    63 Norway Oslo $40,000
    64 United States Rochester $39,900
    65 Italy Milan  $39,100
    66 United States Virginia Beach $39,000
    67 Canada Toronto $38,200
    68 Belgium Antwerp $37,900
    68 United States Tampa-St. Petersburg $37,900
    68 Australia Brisbane $37,900
    71 Canada Vancouver $37,600
    72 Australia Melbourne $37,100
    73 Japan Nagoya $37,000
    74 Switzerland Zurich $36,900
    75 United States Oklahoma City $36,800
    76 Germany Stuttgart $36,700
    77 United States Providence $36,100
    78 Germany Nuremburg $35,900
    79 Japan Tokyo-Yokohama $35,700
    79 China Hong Kong $35,700
    81 Netherlands Rotterdam-Hague $35,600
    82 Spain Madrid $35,500
    83 Italy Rome $35,400
    84 New Zealand Auckland $35,300
    84 Finland Helsinki $35,300
    86 Canada Edmonton $35,200
    87 Greece Athens $34,700
    88 Spain Bilbao $34,600
    89 France Toulouse $34,500
    90 Italy Turin $34,200
    90 United States San Antonio $34,200
    92 Australia Adelaide $33,500
    93 United States Buffalo $33,400
    94 Japan Shizuoka-Hamamatsu $32,500
    95 Spain Barcelona $32,300
    96 Japan Fukuoka-Kitakyushu $31,300
    97 Germany Cologne $31,000
    98 France Marseille $30,400
    99 Germany Essen-Dusseldorf $30,200
    100 Germany Hannover $29,900
    (1) Purchasing power parity. Metropolitan areas over 1,000,000 population for which data is available. Based upon data from Eurostat, US Bureau of Economic Analysis and Japan Statistics Bureau. 
    (2) US data for metropolitan areas from Bureau of Economic Analysis. Scaled to World Bank 2005 GDP PPP figure.
    (3) European data for metropolitan regions from Eurostat regional data. There is no generally accepted metropolitan area definition in Europe. Scaled to World Bank 2005 GDP PPP figure.
    (4) Japan data from Japan Statistics Bureau Scaled to World Bank 2005 GDP PPP figure.
    (5) London metropolitan area is Greater London plus the historic counties of Berkshire, Buckinghamshire, Essex, Herfordshire, Kent and Sussex (including unitary authorities), which are adjacent to the London green belt. Some London metropolitan region GDP estimates exclude suburban areas outside the Greater London Authority. This analysis includes these suburban areas, using GVA scaling from UK National Statistics to estimate non-metropolitan contribution included in Eurostat data (Bedfordshire, Oxfordshire, East Sussex and West Sussex).
    (6) Estimates for the following metropolitan areas scaled to 2005 from 2002 estimates using the closest available change estimate (metropolitan, state/provincial or nation) of the change in GDP per capita (http://www.demographia.com/db-gdp-metro.pdf): Metropolitan areas in Australia and Italy as well as Essen-Dusseldorf, Lyon, Marseille, Dublin, Auckland, Oslo, Zurich, Vancouver, Toronto and Ottawa.
    (7) Metropolitan area data for Calgary and Edmonton estimated from local sources.

    Note 1: Another problem with these kinds of rankings is that can be misleadingly unrepresentative. For example, Mercer ranks more than 200 “cities,” which sounds like a significant number. By cities, Mercer appears to mean municipalities (the website is unclear and Mercer has not responded to our request for clarification of what they mean by “city”), of which there are many in all first world metropolitan areas. Some have as few as 50,000 to 100,000 residents. Mercer ranks White Plains, New York (population: 57,000), in the New York metropolitan area, but has no ranking for the many larger cities in the metropolitan area, except for New York itself. Considering that the United States alone has nearly 275 municipalities of more than 100,000 population, the Mercer list appears to be far from comprehensive.

    Note 2: The national purchasing power parity conversion factor does not permit comparison of standards of living within nations. For example, anecdotal data would indicate that the cost of living is considerably higher in the San Jose, San Francisco and New York metropolitan areas than in the rest of the country. While not generally available, a purchasing power parity analysis within the United States could show metropolitan areas with lower GDPs per capita to have superior standards of living.

    Note 3: The European Union does not formally delineate metropolitan areas, however provides regional data that in most cases is a rough approximation of metropolitan areas.


    Wendell Cox is a Visiting Professor, Conservatoire National des Arts et Metiers, Paris. He was born in Los Angeles and was appointed to three terms on the Los Angeles County Transportation Commission by Mayor Tom Bradley. He is the author of “War on the Dream: How Anti-Sprawl Policy Threatens the Quality of Life.

  • Borderline Reality

    For years, economic and social observers have taken to redrawing our borders to better define our situation and to attempt to predict the future. Maybe you thought the global financial meltdown has raised anxiety levels in the United States quite enough. But a Russian professor’s decade old prediction of national disintegration suggests much worse on the way.

    Prof. Igor Panarin, a 50-year-old former KGB analyst and a dean of the Russian Foreign Ministry’s academy for future diplomats, estimates there’s a 45-55% chance that the United States will disintegrate like the Soviet Union did sometime in 2010. Mass immigration, economic decline and moral degradation will trigger civil war, the collapse of the dollar and massive social unrest. This in turn will lead to the U.S. breaking into six blocs — with Alaska reverting to Russian control – and other foreign powers grabbing other pieces.

    Panarin’s new map of the United States puts the “Californian Republic” under China’s influence, “the Texas region” under Mexico’s. Hawaii will come under Japanese or Chinese rule, East Coast states will join the European Union, while central northern parts of the US will gradually come under Canada’s influence.

    A less sinister revision of the states that comprise the republic occurred in the 1970s when geography professor C. Etzel Pearcy proposed redrawing the borders of the US states, reducing them from 50 to 38. Pearcy’s framework casts aside the convenience of determining boundaries by using the land’s physical features, such as rivers and mountain ranges, or by the simple usage of latitude and longitude. Instead, his realignment gives high priority to contemporary population density, location of cities, lines of transportation, land relief, and size and shape of individual States.

    In the current fiscal climate some see the new 38 state map as inspired. According to Pearcy, 25% of the expenditures by states can be attributed to the fixed costs associated with the support and maintenance of state governments themselves. For at least some states this kind of savings could be very appealing right now.

    Rethinking, reimagining and then redrawing the borders of maps is by no means a new or even fruitless endeavor. That some if not many borders are where they are for seemingly meaningless or irrational reasons is obvious. Mark Stein’s How the States Got Their Shapes, for example, documents how natural features like rivers come together with the dreams and schemes of people to create today’s jigsaw puzzle of states. Gerrymandering borders for political, economic or religious reasons is both a historical and contemporary reality.

    Any economic planner or strategist worth their salt understands, of course, that borders on a map seldom represent or hold sway over how the real economy operates. Sure there are tangible differences in taxes, regulation and all the things that make up a business environment. But like water, economic activity goes where it wants and finds its own level. This has lead to an increasing amount of policy attention being given to cross-border territories of regions, zones, corridors, clusters, networks and the like.

    North America Re-Imagined
    One of the more reasoned, enduring efforts to make sense of a borderless economic and cultural landscape is Joel Garreau’s landmark work on the The Nine Nations of North America. My 27 year-old copy’s dust jacket asks the reader to forget the traditional map and consider the way North America really works because new realities of power and people are remaking the continent.

    A recent conference on USA/Canada cross-border economies in the Great Plains confirmed that Garreau’s analysis continues to influence thinking on regionalism. The longevity of his regions lies not only on their basis in actual data but also tied to the distinct “prisms” though which each nation sees the world.

    What could have been in North America, instead of how things really are, is the subject of Matthew White’s 1997 map of a balkanized continent. Here the basic premise is that, in an alternate history beginning in 1787, the westward expansion of the Anglo-American people proceeded pretty much as it did, but the United States government just couldn’t hold the country together against separatists.

    How North America really works and how that is manifested spatially has generated growing interest of late and is reflected in the emergence of cross-border networks and organizations. The government of Canada recently issued an exhaustive report titled The Emergence of Cross-Border Regions Between Canada and the United States: Reaping the Promise and Public Value of Cross-Border Regional Relationships. Here the interest is certainly not on redrawing the borders but on recognizing and building on shared socio-cultural values and furthering relationships between businesses, first and foremost, and universities.

    Mostly a bottom-up phenomenon, these cross-border regional relationships are evidenced by the growth of both informal relationships and formal networks and a rise in cross-border regional co-operative mechanisms. From a policy standpoint the existence of cross-border regions requires new ways of thinking about development, going well beyond our parochial perspective. And this sort of thinking is important because regions – like economic fields of activity – represent the primary theatre in which most activities of international trade and economic integration actually take place.

    Map Forth
    Thematic maps that reconfigure our geography can intrigue and fascinate us. They are really, as some have said, graphic essays that portray spatial variations and interrelationships of geographical distributions. As noted by Norman Joseph William Thrower in Maps and Civilization: Cartography in Culture and Society, thematic maps use the base data of coastlines, boundaries and places, only as point of reference for the phenomenon being explained.

    Sometimes maps can inspire and motivate us by helping to more fully understand the geography of our economic and demographic challenges and opportunities. Perhaps most importantly thematic maps tell a story about places. Some describe the way things really are now while others express a vision of the future. In both cases they can be a graphical point of departure for plans and actions that help us to make the places we inhabit better places to live and work.

    Delore Zimmerman is president and CEO of and publisher of Newgeography.com

  • Oh, Canada? A Safe-Haven for Banking Investments

    Looking for a safe haven for your banking investments? The Royal Bank of Canada is about three times the size of Citigroup, Royal Bank of Scotland or Deutsche Bank – and they haven’t cut their dividend in more than 70 years. Although Canadian banking profits declined double-digits last year, they actually had profits. Pretty much the rest of the world’s banks are reporting massive losses.

    It seems the folks above the 49th parallel have been fiscally responsible. According to a story on Bloomberg.com “not one government penny” has been needed to support any Canadian bank “from British Columbia to Quebec” since the financial meltdown began in 2007. Not that the Canadian government left them out in the cold, either. A $C218 billion fund was set up last October – ostensibly to be sure Canadian banks could compete in international markets with all the government-backed banks in the rest of the world – but none of the banks took any of it.

    According to Bloomberg, European governments “committed more than 1.2 trillion Euros ($1.5 trillion) to save their banking systems from collapse.” As close as I can tell, between the Federal Reserve and Treasury, the US has poured over $3 trillion down the drain of financial institutions.

    (To understand the complications in calculating an exact U.S. amount, see my earlier articles for more information on how the Federal Reserve Bank of New York, under now-Secretary of the Treasury Tim Geithner, funneled money through Delaware limited liability companies to non-bank entities.)

    Only 7 banks in the world have triple-A credit ratings – 2 of them are Canadian. While the rest of the developed, industrial nations are pouring hundreds of billions each down the black hole that is their financial systems, our Neighbors to the North were engaging in “solid funding and conservative consumer lending.”

    Canada is the only member of the G-7 to have balanced their budget 11 years in a row. Immigrating to Canada is looking like a better idea all the time.

  • New Survey: Improving Housing Affordability – But Still a Way to Go

    The 5th Annual Demographia International Housing Affordability Survey covers 265 metropolitan markets in six nations (US, UK, Canada, Australia, Ireland and New Zealand), up from 88 in 4 nations in the first edition (see note below). This year’s edition includes a preface by Dr. Shlomo Angel of Princeton University and New York University, one of the world’s leading urban planning experts. Needless to say, there have been significant developments in housing affordability and house prices over the past year. In some parts of the United States, the landscape has been radically changed by rapidly dropping house prices.

    Our measure of housing affordability is the “Median Multiple,” which is the annual pre-tax median house price divided by the median household income. Over the decades since World War II, this measure has typically been 3.0 or below in all of the surveyed nations and virtually all of their metropolitan areas, until at least the mid-1990s. There were bubbles before that time in some markets, but during the “troughs” most markets returned to the 3.0 or below norm.

    Unfortunately, the most recent bubble was and continues to be the most severe since records have been kept. The Demographia International Housing Affordability Survey rates housing affordability using five categories, indicated in the table below.

    Demographia
    Housing Affordability Ratings

    Rating

    Median Multiple

    Severely Unaffordable

    5.1 & Over

    Seriously Unaffordable

    4.1 to 5.0

    Moderately Unaffordable

    3.1 to 4.0

    Affordable

    3.0 or Less

    Median Multiple: Median House Price divided by Median Household Income

    At the height of the current bubble, some markets saw remarkable declines in housing affordability. In some Median Multiples exceeded three times the historic norm. Among major markets (metropolitan markets with more than 1,000,000 population), Los Angeles, San Francisco, San Jose and San Diego all reached or exceeded a Median Multiple of 10. Many other markets saw their Median Multiples rise to double the historic norm and beyond, such as New York, Miami, Boston, Seattle, Sacramento and Riverside-San Bernardino. Other major US markets – such as Portland, Orlando, Las Vegas, Providence and Washington, DC – rose to above 5, a figure rarely seen in any market before the currently deflating bubble.

    America has hardly been an exception. Outside the United States, virtually all major markets in Australia were well over 6.0, as well as London and Auckland in New Zealand. Vancouver was the most unaffordable major market, with a Median Multiple of 8.4. Of particular note is barely growing Adelaide, which nonetheless has seen its Median Multiple rise to 7.1.
    But, at least in the US, the unaffordability wave has crested. Generally, the house prices peaked in the United States in mid-2007. Since then the markets with the biggest bubbles took the lead in bursting. By the third quarter of 2008 (the Survey reports on the third quarter each year), the Median Multiple in San Francisco had dropped to 8.0, San Jose to 7.4, Los Angeles to 7.2 and San Diego to 5.9. Of course, even at these levels, housing affordability in these metropolitan areas remained worse than ever before. History would suggest that housing prices in these markets have a long way to go before they hit bottom.

    Other markets have improved affordability more substantially. Inland California markets like Sacramento and Riverside-San Bernardino have gone from the “seriously” to only the “moderately unaffordable” category, with rates now in the mid-3.0s. Data for the fourth quarter is likely to indicate that Sacramento will be the first major housing market in California to return to a Median Multiple of 3.0, a rather large fall from its peak of 6.6 in 2005.

    Outside California, other markets have experienced significant price declines. But some, like Miami still at 5.6, have a long way to go before they reach the historic norm of 3.0. Las Vegas and Phoenix (which nearly reached 5) may be closer, falling to the “moderately unaffordable ” category with Median Multiples of between 3.1 and 4.0. Seattle and Portland have fallen 10 percent or more as of the third quarter but remain severely overpriced, suggesting they, like Miami, have more price declines in the offing.

    Much of the blame for the bubble has been placed at the feet of a mortgage finance industry that passed out money as if it was not its own. Not surprisingly, the ready availability of money had its effect on the market. Demand rose sharply and included many who couldn’t afford to pay.

    But profligate lending practices represent only a relatively minor cause of the bubble. This was missed by all but a few economists, notably Dr. Angel’s Princeton colleague and Nobel Laureate Paul Krugmann. He could see that there was not one “national bubble” but a series of localized ones. The real villain, he noted, lay in land use regulations.

    In reality the bubble missed much of the country – from Atlanta to El Paso to Omaha and Albany. There were house price increases, of course, but they were generally within the Median Multiple ceiling norm of 3.0. There were a few exceptions, but even they did not exceed 3.0 by much.

    Rising demand was not the big problem. Housing affordability remained at virtually the same Median Multiple level in Atlanta, Dallas-Fort Worth and Houston, the three fastest growing metropolitan areas of more than 5,000,000 population in the developed world. Many other major markets across the South and Midwest experienced little price increase and maintained their affordability. Indianapolis, which has a Median Multiple of 2.2, continued to gain domestic migration from other areas and has a near Sun Belt growth rate. Kansas City, Louisville and Columbus remain affordable and are attracting people from elsewhere.

    Although there are signs of a correction in parts of California, Nevada and Arizona, some bubbles in high-regulation markets are still in the early stage of deflating. New York, Boston, Portland and Seattle particularly may be in danger; the worst consequences of their bubbles lie ahead.

    The longer-term question remains whether these and other still highly over-valued markets in California, the Pacific Northwest, Florida and the Northeast will return to affordability, at or near a Median Multiple of 3.0. The necessary price drops would be bad news for regional economies because of the losses homeowners and financial institutions would sustain.

    At the same time maintenance of the currently elevated prices would also be bad news. In the past 7 years, 4.5 million people have moved from higher-cost markets to lower-cost markets in the United States. The formerly attractive markets of the California coast alone have seen more than two million people depart for other places since 2000. For these areas, a return to historic levels of housing affordability may be a prime pre-requisite to restoring economic health.

    HOUSING AFFORDABILITY RATINGS UNITED STATES METROPOLITAN MARKETS OVER 1,000,000
    Rank Metropolitan Area Median Multiple
    AFFORDABLE  
    1 Indianapolis 2.2
    2 Cleveland 2.3
    2 Detroit 2.3
    4 Rochester 2.4
    5 Buffalo 2.5
    5 Cincinnati 2.5
    7 Atlanta 2.6
    7 Pittsburgh 2.6
    7 St. Louis 2.6
    10 Columbus 2.7
    10 Dallas-Fort Worth 2.7
    10 Kansas City 2.7
    10 Mem[hios 2.7
    14 Oklahoma City 2.8
    15 Houston 2.9
    15 Louisville 2.9
    15 Nashville 2.9
    MODERATELY UNAFFORDABLE  
    18 Minneapolis-St. Paul 3.1
    18 New Orleans 3.1
    20 Birmingham 3.2
    20 San Antonio 3.2
    22 Austin 3.3
    22 Jacksonville 3.3
    24 Phoenix 3.4
    25 Sacramento 3.5
    26 Tampa-St. Petersburg 3.6
    27 Denver 3.7
    27 Hartford 3.7
    27 Las Vegas 3.7
    27 Raleigh 3.7
    27 Richmond 3.7
    32 Salt Lake City 3.8
    33 Charlotte 3.9
    33 Riverside-San Bernardino 3.9
    33 Washington (DC) 3.9
    36 Milwaukee 4.0
    36 Philadelphia 4.0
    SERIOUSLY UNAFFORDABLE  
    38 Chicago 4.1
    38 Orlando 4.1
    40 Baltimore 4.2
    41 Virginia Beach-Norfolk 4.3
    42 Providence 4.4
    43 Portland (OR) 4.9
    SEVERELY UNAFFORDABLE  
    44 Seattle 5.2
    45 Boston 5.3
    46 Miami-West Palm Beach 5.6
    47 San Diego 5.9
    48 New York 7.0
    49 Los Angeles 7.2
    50 San Jose 7.4
    51 San Francisco 8.0
    2008: 3rd Quarter  
    Median Multiple: Median House Price divided by Median Household Income
    Source: http://www.demographia.com/dhi.pdf

    Note: The Demographia International Housing Affordability Survey is a joint effort of Wendell Cox of Demographia (United States) and Hugh Pavletich of Performance Urban Planning (New Zealand).

    Wendell Cox is a Visiting Professor, Conservatoire National des Arts et Metiers, Paris. He was born in Los Angeles and was appointed to three terms on the Los Angeles County Transportation Commission by Mayor Tom Bradley. He is the author of “War on the Dream: How Anti-Sprawl Policy Threatens the Quality of Life.

  • Go North Young Man

    With his foreign policy team now in place, President-elect Barack Obama certainly will be urged to make his first forays into high profile places like Pakistan, Israel and Palestine, as well as to greet his devoted fan base in Europe.

    But before heading off on the diplomatic grand tour, he might do well to turn his attention first to the country with which we have the closest political, economic and environmental ties: Canada. Although not as momentous or sexy a locale as Paris or Jerusalem, Ottawa could well hold the key to developing a bold new strategy for America in an increasingly incoherent and multi-polar world.

    A focus on Canada and to some extent Mexico as well, would require a reversal of the kind of wide-ranging foreign policy focus that has dominated the country since the 1940s. In that period, the United States has extended – one might increasingly say overextended — its economic and political reach ever further from its continental base.

    In the process, the country has become ever more intertwined with unreliable and often malicious regimes on the Asian continent and subservient to the interests of an often jealous and uncomprehending Europe. As a result, the country has sacrificed its own economic health, becoming ever more dependent on fuel, manufactured goods and even its self-esteem from countries with which we often share distressingly little.

    Instead, the new President should place greater emphasis on the fundamental basis of our uniqueness and economic strength: the enormous continent we share with our Canadian as well as Mexican neighbors. This would represent a return to a version of the politics – so important in our 19th Century emergence – that understood resources, natural and human, constitute the true foundation of national greatness.

    This shift also would help us establish significant psychological distance between the United States and Europe. Although there are segments of the country, notably in the Northeast, who would prefer America become a clone of the Old Continent, our demographic and physical realities are diverging every day from those of a rapidly aging and resource-poor Europe.

    In contrast, Canada shares with America a somewhat more vibrant demography. This is driven largely by immigrants who are rapidly integrating and invigorating both countries. With Australia, the two countries have emerged as the preferred location for immigrants in part because they are where they are – in sharp contrast with that of Europe – most likely to succeed.

    Being a country of immigrant aspiration represents just one aspect of our close cultural ties with Canada. Our northern neighbor ranks among the largest senders of immigrants as well; roughly 840,000 Canadian citizens now have established themselves south of the border. On a familial level millions of Canadians have relations with Americans; in fact, places like Los Angeles, if current and former Canadians were counted, would constitute among the largest cities in that country.

    Canada is also our country’s largest source of visitors – there are parts of Florida where French is the second language – and a major player in our national real estate and financial market. Whole sections of the northern Great Plains depend on consumers coming from over the border. (Full disclosure: Joel Kotkin’s wife is a native of Montreal, Quebec and the Schills live in Grand Forks, an icy spit from the Manitoba border).

    Most critically our economic ties to Canada represent the largest bilateral relationship in the world while Mexico has emerged as our third largest trading partner. And unlike our chronically poor terms of engagement with countries like China and Japan, our trade with Canada and Mexico also includes healthy transactions in basic manufactured goods, technology and farm products.

    At the same time, Canada and United States together share a critical interest in agricultural commodities, a market where they are the undisputed world leaders. In a world that is likely to get too crowded and short of basic resources, a strong North America should be well-positioned in comparison with relatively resource-poor competitors such as Western Europe and East Asia.

    But perhaps the most critical relationship lies in the energy arena. The globally Saudi-centered energy policy of recent years, particularly during the Bush-Cheney era, has fueled our deadliest enemies and also threatens both our environment and long-term economic viability.

    A U.S.-Canada energy consortium — with the eventual involvement of Mexico — provides an out from our fundamental geopolitical dilemma: how to grow our economy while reducing our dependence on imported energy and, over time, carbon-emitting fuels. This could take the form of something like a North American Energy Community, which would help coordinate research, development and environmental resources across the continent.

    This approach would offer a way to shift our economic interests away from unreliable and unfriendly regimes towards countries with whom we have far better personal, political and economic ties. Current estimates indicate we will increase oil imports from 12.6 million barrels a day today to 16.4 million in 2030. More than half of that is expected to come from OPEC suppliers, with much of the rest from Russia and the Central Asia autocracies.

    A continental strategy would halt this dangerous slide. Taken together, the resources of our three countries are both immense and extraordinarily diverse. Overall, North America ranks second only to the Middle East in proven oil reserves. Canada, for example, has the world’s second largest proven crude oil reserves, outpaced only by Saudi Arabia; the United States ranks 11th and Mexico 14th. The three North American states rank in the top fifteen in natural gas production, as well.

    This alliance can work both in the short run on fossil fuels and will, over time, blossom with the shift to renewables. Canada, well known for its surplus of fossil fuels, also possesses promising potential in hydroelectric and wind energy. Wind alone, Canadian researchers believe, could provide 20 percent of that nation’s power. Prince Edward Island, on the country’s east coast, is already conducting a major experiment to shift its primary energy dependence towards wind and biomass.

    Mexico, long an oil exporter, needs new technology both to upgrade its current energy industry and to exploit its potential in renewable fuels. Over time, experts say, Mexican production of fossil fuels will drop, but the nation has an almost totally unexploited potential in solar and sugar-based ethanol fuel, following the Brazilian model. For its part, the United States also has considerable solar, wind, and biofuels, of which we are already the world’s second largest producer.

    This energy alliance would also help spark employment and growth across the continent. Money spent on development and importation of energy from Russia, Saudi Arabia, or Iran offers few benefits for our economy. We conduct pathetically little export trade with these nations; we constitute less than 5 percent of Russia’s imports, less than 14 percent of Saudi Arabia’s, and virtually none of Iran’s. Europe, Japan, and, increasingly, China – not the United States – are the growing and primary beneficiaries of the energy-producers’ wealth.

    The same dollars spent within North America have a very different effect. Canada and Mexico together constitute by far the largest export market for the United States. Over one third of our exports now go to our North American allies, compared to less than 5 percent to OPEC and less than one percent to the Russian Federation.

    Investment in Mexico’s Peninsula de Atasta, an ethanol plant in Iowa, or a hydroelectric plant in Quebec enriches customers for whom the United States is a primary source of both manufactured goods and of services, including tourism. A wealthier Mexico also means more visitors to the parks of Orlando, Anaheim or to Houston’s Galleria. Canadians, for their part, flock first to New York, Seattle, Chicago, Los Angeles or Florida when they have extra change to spend.

    So as he considers his options, President-elect Obama may want to consider this continental strategy as a means to create new wealth here and to strengthen our hand abroad. We know these proposals are radical, and will be subject to all sorts of opposition by well-organized pressure groups.

    But by focusing on our continental economy, the United States can begin facing the world not as another slowly declining European descended power but once again as a youthful, defiantly multi-racial and ascendant one.

    This piece originally appeared at Politico.com

    Joel Kotkin is a presidential fellow at Chapman University and is finishing a book on the American future. He is executive editor of www.newgeography.com. Mark Schill is the site’s managing editor and an associate at the Praxis Strategy Group.

  • The Financial Crisis: Bubbles Deflating Worldwide

    The mortgage meltdown is much more than an American affair. Real estate bubbles have developed in all major English speaking countries – US, Canada, UK, Ireland, Australia and New Zealand.

    Over the past year, house prices have dropped 12 percent in the United Kingdom. The annual decline is approaching 10 percent in Ireland, while median house prices have dropped six percent in New Zealand. In each of these countries, the price declines started after the United States. Further, each of these nations has experienced massive nationwide housing inflation, in part, I believe, as a result of highly restrictive land use policies. These policies, often known as ‘smart growth’ have made it virtually impossible to build new housing on the fringe of urban areas inexpensively.

    Where prices will finally settle, no one knows. Some analysts soothe the market claiming that the bottom is near. But many, including The International Monetary Fund, predict the worst of the mortgage crisis is yet to come in the United States. Similarly, former chairman of the council of economic advisors, Martin Feldstein suggested last week that prices would fall to their pre-bubble levels, as did I in this space as well. That’s what bursting bubbles is all about – prices that drop to pre-bubble levels.

    Canada is another story. Like the United States, housing costs remain within historic norms where there is traditional land use regulation, while restrictive land use regulation has led to a housing bubble in some markets. This is especially true in Vancouver, where there has been some minor price softening in recent months. Bank of Nova Scotia officials have indicated that they do not expect the kind of bubble bursting in overpriced Canadian markets that has occurred in the United States, at least partially because there was a lower volume of profligate lending (subprime, etc.) in Canada.

    Janet Albrechtsen, a columnist for The Australian writes in The Wall Street Journal that the Australian financial system also is healthier than America’s, at least in part because of more stringent mortgage regulation. If her analysis is right, Australia could be spared the mortgage meltdown that is engulfing America, the United Kingdom, Ireland and New Zealand. Thus, far, there is little indication of declining house prices in Australia.

    That does not mean there is no bubble. Even with strong banks, Australia has a problem. A housing bubble as pervasive as the United Kingdom has developed in Australia, despite its wiser financial regulation, House prices have risen to from two to three times the historic Median Multiple (median house price divided by median household income) norm of 3.0.

    The Australian bubble, like in the United Kingdom, Ireland and New Zealand (as well as parts of the US) has been spurred by overly restrictive land use regulation, which forces land prices up and causes them to explode even with moderate increases in demand. In response, the Median Multiple has increased to more than double the historic norm in all major capital cities. As a result, younger and future Australians have to pay far more of their income for housing than those who came before. So, while superior regulation may have kept Australia’s banks healthy, the prospects of many younger members of society have been greatly diminished. They will have been the victims of the largest inter-generational transfer of wealth in the nation’s history.

    Despite Ms. Albrechtsen’s optimism, it is not yet clear that Australia’s bubble will not eventually burst. Certainly falling commodity prices could hurt the employment situation, particularly for middle and working class Australians who are now struggling to pay ever higher percentages of their incomes for housing. Australia may have remained ‘the lucky country’ so far in terms of real estate. But whether that will persist in the coming months is still open to question.

    Note 1: http://www.demographia.com/dhi.pdf.

    Wendell Cox is a Visiting Professor, Conservatoire National des Arts et Metiers, Paris and the author of “War on the Dream: How Anti-Sprawl Policy Threatens the Quality of Life.”