Tag: Census 2010

  • Census 2010: A Texas Perspective

    If you want to get a glimpse of the future of the U.S., check out Fort Worth, TX. Never mind the cowboy boots, but you might want to practice your Spanish.

    Texas is growing explosively and much of that growth is among Latinos.   The latest Census Bureau figures show the Lone Star State grew by 20%, to over 25 million people, recording about a quarter of the nation’s overall growth. The rate of growth was twice the national average. The implications are huge politically, as Texas stands to gain 4 new Congressional seats from this expansion, and Hispanic leaders want in.

    A majority of the Hispanic growth came from births to families already living here. While migration from other states and countries contributed about 45%.  

    The Texas story stands in contrast to the Rust Belt states and the Northeast, where overall growth is minimal.   Texas’s Hispanic-fueled growth spurt out-paced the entire countries, helped brace our housing market and our economy.

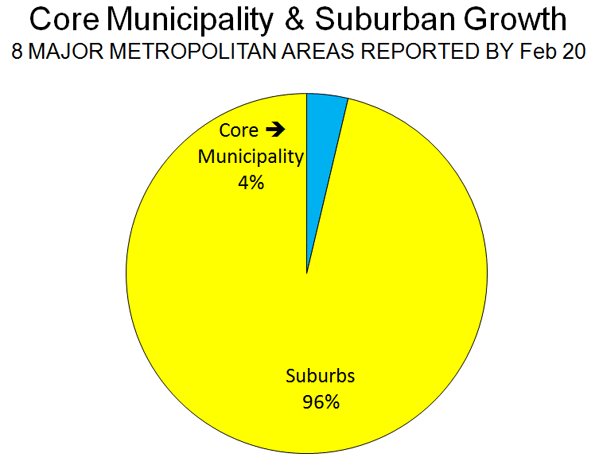
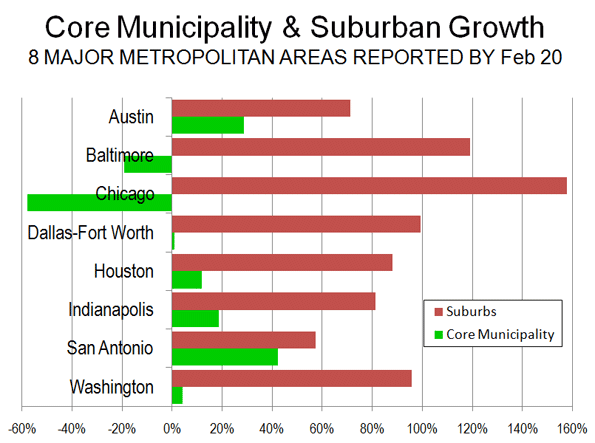
    A close look at Texas growth reveals much about   American’s home-buying habits. Rural areas got smaller – few want to live in the boonies of far west Texas while it appears suburban areas won over the most transplants.

    But arguably the biggest winner was Ft. Worth, or Cow Town as we call it. Fort Worth grew by a whopping 38.6%, the largest increase in the state, followed by Laredo’s 33%, Austin at 20.4%, and San Antonio at 16%. In contrast the city of Dallas, my home, grew by a scant .8% – a bit deflating to a city all puffed up about a $354 million arts center, a downtown park and greenway, and the $185 million Perot Museum of Nature & Science underway.

    Houston remains the state’s largest metropolitan area but sustained growth of only 7.5%, though Harris County – mostly due to growth in the suburbs – grew by 20%. As in Ft. Worth and elsewhere, Hispanics have been the driver, and now comprise 41% of the Harris County population. The biggest growth took place in formerly rural towns just outside the big cities, one-shop stop farmer’s crossings or granaries.  

    Curtis Tally shakes his head at how fast little Justin, north of Fort Worth, has grown. Subdivisions sprouted up on what was once farmland around his Justin Feed Co. in southern Denton County. From 1891 residents in 2000, Justin has 3,246 today.  

    "We were selling seed for pastures; now we’re selling seeds for lawns," Tally, 74, who has been in business in Justin since 1958, told the Fort Worth Star Telegram.

    If you think that’s amazing, wait ‘till you get to Fate, Texas, 25 minutes east of Dallas on Interstate 30. Ten years ago you would have missed Fate, a town of 500 so small the utility invoicing was done on postcards if you blinked while driving. Today, Fate is the fastest-growing town in the state, with 6,357 residents – an increase of 1,179%!  Residents who live there say it’s far enough away from Dallas to be in the country, but still close to the big city. Fate draws many first time homebuyers who are starting families (home prices range from $50,000 to $300,000) Here’s what Fate resident Tina Nelson told The Dallas Morning News:

    “My kids can go ride bikes all day long and I don’t have to worry too much about where they are,” said Tina. “It’s like the 1950s (here) the sun goes down and everyone’s porch light comes on.”

    On the western side of Lake Ray Hubbard, a few minutes from Fate and slightly closer to Dallas is Sunnyvale, another fast-growing little hick town where professionals are building $2 million dollar homes on a 124 acre family ranch turned into home sites called St James Park. They send their children to a two-year old, $50 million public school with the highest ratings in the state.

    The young man building homes on the 49 two acre estate sites is Jojy Koshy of Atrium Fine Homes. At 31, Jojy holds a masters in business from the University of Texas and tells me, with pride, how his parents immigrated to the Dallas suburb of Plano in 1986 from India.

    “My parents instilled a strong work ethic in us,” he says. “I know this market is challenging, but I believe that if I work longer, harder, and keep our clients completely satisfied, we will have a great business.”  

    It’s the same story across the state. The Interstate 35 corridor between Austin and San Antonio filled in with development as the cities merged closer to becoming one big schizophrenic metropolis. The string of counties along the Rio Grande, anchored by Brownsville and McAllen have been growing, and may be beneficiaries of the crime wave south of the border.   A sharp Dallas Realtor took out an ad in the Monterrey newspaper advertising homes for sale in Dallas and snagged several buyers. Even the wife of the Monterrey mayor moved to a Dallas suburb, escaping the cartel and seeking to be closer to her family here.

    Aside from escaping death in Mexico, what is driving people to Texas? Start with our rising star, Fort Worth. The city has both a cowboy pizzazz personality and a lower crime rate than Dallas. Fort Worth’s arts district has overshadowed Dallas’s for years, and the neighborhoods offer true community – places where the kids can still walk, not be bussed, to school. Rose Bowl winner Texas Christian University is on the upswing, downtown is charmingly vibrant, and an urban renaissance is taking hold on the city’s western edge called West 7th.   

    What are people seeking in Texas? I’d call it quality of life with room for upward mobility: affordable homes with mortgage payments that leave some money for recreation, good public schools for their kids and generally less onerous tax regime.

    Yet with our many gains, Texas faces great challenges. The state has the third-highest teenage pregnancy rate in the nation, which is actually an improvement from last year, when we were number two. There are a rising number of children are living in poverty in Texas. Many of these children may be anchor babies born to illegal immigrants who cross the border to ensure their children and ultimately, themselves, citizenship. In 2006, 70% of the women who gave birth at Dallas County’s Parkland Memorial Hospital were illegal immigrants.  

    Increasingly, Latinos, illegal or not, take those babies home to the suburbs. Texas suburbs are no longer lily-white.  This is true in working class places like Bedford, Texas, outside Fort Worth, where the black population has almost doubled. In affluent Southlake, the population this decade shifted from 95 percent Anglo down to 88 percent.   Looking for a great selection of Asian food? You’ll starve (or go broke) in downtown Dallas. Go north to Carrollton, Texas where you’ll find a 78,000 square foot Super H Mart in what was once a Mervyns department store. Inside you’ll find seven types of gray, fuzzy, Chinese long, acorn, spaghetti, butternut, and kombucha squash eight food stalls said to rival any of those found in Seoul and Singapore, two cities known for their gourmet street food. Manduguk, anyone?

    The new Texans are coming here not just to live, but to dig in economically.  

    In the end, we are seeing the birth of a Texas that is neither the white bread, big hair idyll of the cultural conservatives or the free market dystopia imagined by liberals. It is becoming more diverse, without losing its capitalist energy. With all its blemishes,  the emerging Texas may well become the model for how America evolves in the coming decades.

    Candy Evans is an independent journalist based in Dallas, Texas, She covers Texas for AOL’s HousingWatch and blogs at secondshelters.com.

    Photo by Rick

  • City of St. Louis Suffers Huge Population Loss

    According to just-released 2010 Census results, the city of St. Louis experienced an unexpected loss in population from 348,000 in 2000 to 319,000 in 2010. This was surprising since the latest population estimate was 357,000 (2009). The new population figure however provided exoneration for the Census Bureau, which had been challenged six separate times during the decade on its city of St. Louis population estimates. The higher 2009 population estimate was the cumulative effect of those six successful challenges. In fact however, without the challenges the city of St. Louis population would have been 311,000, much closer to the final count of 319,000 people.

    Among the world’s municipalities that have ever achieved 500,000 population non-have lost so much as the city of St. Louis. The new figure of 319,000 people is 63 percent below the 1950 Census peak of 857,000 people. Indeed, the 2010 population is nearly as low as the population in the 1870 census.

    Even so, the population loss of the last decade belies the progress that has been made in converting warehouse buildings, office buildings and other disused structures into urban residential areas, especially along Washington Avenue. These developments, among the largest in the United States, however, fell far short of preventing the population loss.

    The St. Louis Metropolitan area did much better. In 2010, the metropolitan area had a population of 2,813,000, up from 2,699,000 in 2000, a gain of four percent. The loss in the city was eight percent, while the suburbs gained six percent.

  • The Millennial Mosaic

    Esperanza Spalding, winner of the best new artist award at this year’s Grammys, personifies the ethnic trends reshaping America.  She is a fresh-faced 27-year old jazz bassist whose very name portrays her mixed ethnic and racial heritage as the daughter of an African-American father and a Hispanic, Welsh, Native American mother. Spalding first gained her deep interest in music watching French-born Chinese American classical cellist Yo Yo Ma on “Sesame Street,” a TV program that has perhaps contributed to ethnic acculturation in the U.S. as much as any other institution. Spalding’s formal musical training was originally classical, but at age 15 she decided that her passion was jazz, itself a quintessentially American 20th Century fusion of black rhythms and the melodies of European immigrants.

    The United States has gradually been becoming more diverse for decades, but Esperanza Spalding’s Millennial Generation (born 1982-2003) is most radically altering the nature of that diversity.  The entirely senior citizen Silent Generation (born 1925-1945) is 90% white. Baby Boomers (born 1946-1964) and Generation X (born 1965-1981) are a bit more diverse: 17% and 25% non-white respectively.  In contrast, four in ten adult Millennials are either African-American, Hispanic, Asian, or of mixed race. Among all Millennials of high school age or younger, about half now come from what was once called a minority group. Moreover, according to the 2009 Census population estimates, the under 18 population of Arizona, California, Hawaii, Maryland, Nevada, New Mexico, and Texas is majority-minority with Florida, Georgia, Mississippi, New Jersey, and New York poised on the brink of that benchmark.

    In 2008 the Census Bureau made these demographic trends “official” by forecasting that the United States will become a majority-minority country around 2040. By 2050, with an estimated 46% of the population, non-Hispanic whites will still remain the country’s single largest racial group, but Hispanics (30%), African-Americans (15%) and Asians (9%) will together comprise a majority of the U.S. population.

    Generational theory, first developed by William Strauss and Neil Howe, offers important historical insights on what this new majority-minority America might look like.    As we point out in our forthcoming book, Millennial Momentum: How a New Generation is Remaking America, we are in the midst of what Strauss and Howe have defined as a “fourth turning.” These periods have invariably been associated with the most intense social and political stress in US history: the American Revolution, the Civil War, and the Great Depression. Civic generations, heavily populated by the children of large waves of immigrants, are more ethnically diverse than older generations, contributing to the ethnic and racial tensions that have existed during each of these time periods. At the same time, because civic generations are comprised of group- and team-oriented, conventional and institution building individuals, ethnic absorption and acculturation also increases during and just after fourth turnings as each civic generation matures. This is in sharp contrast to “idealist” generations, such as the Baby Boomers, that reject the mainstream culture and often form movements promoting ethnic separatism.

    Ethnic tensions during previous similar generational changes rivaled those the country is experiencing today.  In the run-up to the Civil War, the rabidly anti-immigrant and anti-Catholic American or Know-Nothing Party captured close to a quarter of the national popular vote in the 1856 presidential election,and more than a third of the vote that year in all of the states that eventually comprised the Confederacy. In the 1930s, as the civic GI Generation children of the Eastern, Central, and Southern Europeans who comprised America’s last previous great wave of immigrants came of age to help elect Franklin D. Roosevelt, his most virulent opponents claimed that the president was really a Jew named “Rosenfeld” and derided his program as the “Jew Deal.”

    We see similar language in today’s discourse, at least on the fringes. Some extreme opponents of President Barack Obama accuse him of being foreign-born and a crypto-Muslim. In a more obscure way, if one searches Google for the seemingly innocuous phrase, “US majority nonwhite 2040,” two of the first three listings are from racist groups decrying this change and the third is from a liberal group advising the need to “understand” the fears of white people in a rapidly changing America.

    Fortunately civic generation Millennials have many characteristics that lead to ethnic acculturation and absorption The Civil War generation was critical to absorbing the Irish into the American mainstream, in part through the role played by Irish detachments in the Union Army, something that helped the Irish overcome the charge that they were an alien Papist force set on undermining a free Protestant nation.  Similarly, the GI Generation’s Poles, Italians, and Jews became acculturated during and after World War II, in part through their service in the armed forces or in the domestic war effort.  In sharp contrast to the anti-Semitic charges leveled against FDR, commentators on all sides of the political spectrum describe America as a “Judeo-Christian Nation.” Foods like bagels and pizza, once available only in urban ethnic enclaves, became commonplace, sold by pizza chains started by Irishmen and Greeks, or bagels marketed by brands such as Pepperidge Farm.

    In the current fourth turning, America’s newest ethnic minorities will also become acculturated and, in turn, shape the nation’s culture. A 2007 Pew survey indicates that while only 23% of first generation Hispanics speaks English “very well,” that percentage rises to 88% among those in the second generation and 94% within the third. At the same time, researchers at the University of California-Irvine and Princeton found that Latinos tend to “lose” their Spanish the longer they are in this country. This research indicates that although first generation Hispanics bring Spanish with them, by the second generation only a third of Latinos speak Spanish “very well.” By the third generation, that number drops to 17% among those with three or four foreign-born grandparents and to only 5% among those with just one or two foreign-born grandparents. ()  

    And, so as the United States endures the tensions and rancor of another generational fourth turning, it is important to realize that this too shall pass.  Millennials will, as have other civic generations before them, redefine what it means to be an American in ways both more diverse and inclusive than older generations may be able to imagine or appreciate.

    Morley Winograd and Michael D. Hais are fellows of NDN and the New Policy Institute and co-authors of “Millennial Makeover: MySpace, YouTube, and the Future of American Politics” and the upcoming “Millennial Momentum: How a New Generation is Remaking America.”

    Esperanza Spaulding photo by Andrea Mancini.

  • Seattle, Denver & Portland: Slowing Growth Rates & Convergence

    Just released 2010 Census data indicates that the growth rates of the Seattle, Denver and Portland metropolitan areas fell significantly in the 2000s compared to the 1990s.

    Seattle: Seattle metropolitan area population growth fell to 13 percent in the 2000s compared to 19 percent in the 1990s. The metropolitan area population in 2010 was 3,439,000, up from 3,041,000 in 2000. The historical core municipality of Seattle grew eight percent between 2000 and 2010 (from 563,000 to 608,000), while the suburbs grew 14 percent. The suburbs attracted 89 percent of the metropolitan population growth.

    Denver: The Denver metropolitan area experienced a decline in growth rate from 32 percent to 17 percent, while the population increased from 2,179,000 to 2,543,000. The historical core municipality of Denver grew eight percent, from 554,000 to 600,000. The suburbs grew 20 percent and accounted for 83 percent of the metropolitan area population growth.

    Portland: In the Portland Metropolitan area growth declined to 15 percent from 27 percent, with a population rising from 1,928,000 to 2,226,000. The historical core municipality of Portland grew 10 percent (from 529,002 583,000), while the suburbs gained 17 percent. The suburbs attracted 82 percent of the metropolitan population growth.

    Convergence: These slower population growth rates indicate a convergence with the growth rates achieved by middle American metropolitan areas for which data is available. Indianapolis grew 15 percent and Oklahoma City grew 14 percent, more than Seattle and slightly less than Denver and Portland.

  • Census 2010: Urbanizing Indiana

    The first Census results for Indiana were recently released, painting a picture of an increasingly metropolitan state.  Indianapolis continues to be the growth champion as its strong economy attracted people from the rest of the state, as well as increasingly diverse populations.  Although  the core of Indianapolis fell well below expectations, its population did not fall like that of Chicago. In a switch from some other regions, the outer suburbs also lagged expectations while inner suburbs boasted a robust performance.

    Population Change in Indiana

    The map below shows how Indiana’s counties faired between Census 2000 and 2010, with counties gaining population in black, and those losing population it in red.

    Many rural and small industrial counties either shrank or posted anemic population growth while most metro counties, especially suburban ones, were standouts.  This is particularly illustrated by this map highlighting only those counties that grew faster than the statewide average:


    This list features heavily counties in suburban Indianapolis, Cincinnati, Louisville, and Chicago, as well as areas near midsized cities like Fort Wayne and Evansville.  Big Ten college towns Bloomington and Lafayette also did well.

    Metro Indianapolis: Indiana’s Growth Champion

    But the clear population winner was metro Indianapolis, which grew at a rate 15.2%, nearly double the US average and well above that of the state:

    The growth even extended even to the central city/county, with Marion County breaking the 900,000 barrier.   The 231,137 people added by metro Indy was fully 57% of total statewide growth, even though that region only contained 25% of the state’s population in 2000.  Unsurprisingly, metro Indy added 15,000 jobs during the last decade  while the rest of the state shed nearly 200,000 of them.

    Indy Suburban Migration Missed Expectations, But No Core Renaissance Either

    Indianapolis showed some of the same urban core patterns as Chicago, which bodes ill for the back to the city story at the national level.  There is a city-county consolidation in effect which muddies the waters here, but the old township boundaries that are still reported by the Census Bureau as minor civil divisions can serve as a proxy for old boundaries.  Center Township covers most of what used to be the old City of Indianapolis, while the remaining townships constitute the Inner Suburbs and the collar counties the Outer Suburbs.

    Those of us who are urban boosters were excited that the Census Bureau estimates showed Center Township’s decades long population slide ending and even hitting an inflection point during the 2000s. Alas, these Census results demolished that notion as Center Township was shown to have lost 24,268 people, falling well short of estimated population in 2009.  Like Chicago, the inner city also featured a large black exodus.

    But the Outer Suburbs didn’t fare that well either, especially Hamilton County.  Long ranked among the fastest growing in the entire United States, I had been waiting to see if growth there might have been slightly above trend as in the past and put them over the 300,000 mark. It turns out to be a very different story, as Hamilton County’s 2010 population was 274,659, actually coming in below the 279,287 the Census Bureau had estimated in 2009. Still, the majority of regional growth was still in the Outer Suburbs, although less than estimated.

    This of course means that the Inner Suburbs did better than expected, particularly the southern ones of Perry and Franklin Townships, which still have some greenfield development opportunities left.  As in cities across the US, older Inner Suburbs of Indy have been experiencing their own problems as they aged. But this shows that the problems may not be as bad as feared.  Though the economy doubtlessly affected this, nevertheless it still buys additional time for transformations driven by demographic growth and entrepreneurship among immigrants and a burgeoning black middle class to take root.

    More Diversity, But Still Not That Diverse

    Indianapolis and Indiana grew more diverse during the 2000s particularly with Hispanic immigration. But again the changes were concentrated in metro areas.  And Indianapolis, long a very white city with a black minority, showed very strong growth in diversity, but still not enough to make this a truly diverse place in the manner of New York or Los Angeles.

    As in Chicago, the core lost black-only population, but other than that it was a very different story.  Metro Indy added 48,824 new blacks, a growth rate of 22.8% that outpaced overall growth.  This boosted black population share by nearly one percentage point.   Unlike Chicago, where local journalists are asking what happened to the city’s incredible shrinking black population, leading Indy black talk show host Amos Brown issued a press related titled “Blacks Fueled Indy’s Growth in 2010 Census Reports” to trumpet the black numbers there. One big reason might be: in contrast to Chicago, Indianapolis’ African-Americans did not have to flee south for jobs or affordable housing.

    The black core population decline in Indy seems less driven by gentrification than the prosaic concerns that generally drive suburbanization, such as safer streets,  better housing and schools.  This migration pattern is very evident in places like the Inner Suburban Lafayette Square area, which in addition to becoming a thriving immigrant business district is also home to large numbers of black owned businesses that are helping to transform this once decaying area.

    The state’s black population as a whole remains heavily concentrated in large urban areas, with Marion and Lake Counties accounting for 62% of the state’s total black population.

    Indy’s Hispanic growth surged as well, with 66,715 new Hispanics representing a 161% increase, though this is less than some expected. Hispanic population growth was more evenly spread, though from a total numbers perspective Indy and northern Indiana dominated the growth, as illustrated by the following chart of total Hispanic population growth in the last decade:

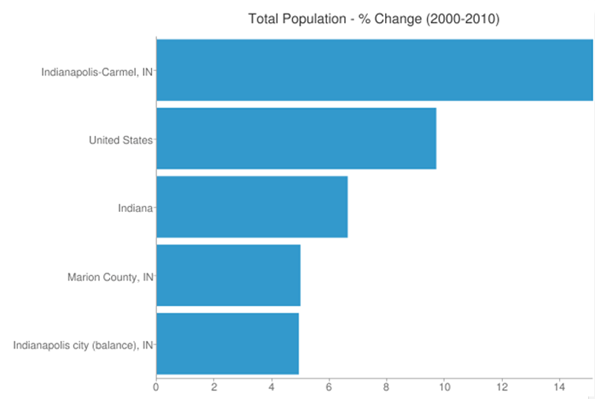
    Indy’s Asian population also more than doubled to almost 40,000..  Add this all up and the metro area non-Hispanic white-only population share dropped by six percentage points, but remains at 74.6%.  The city of Indianapolis itself is pushing 40% minority, however.  Regardless, this is still a material change and shows that metro Indy is a strong magnet not just for whites, but for pretty much everybody.  Its challenge is to continue building on this for the future, while the state’s challenge will be to  pull itself up to Indy’s level of demographic and economic performance.

    Aaron M. Renn is an independent writer on urban affairs based in the Midwest. His writings appear at The Urbanophile.

    Photo by Carl Van Rooy

  • The Still Elusive “Return to the City”

    Metropolitan area results are beginning to trickle in from the 2010 census. They reveal that, at least for the major metropolitan areas so far, there is little evidence to support the often repeated claim by think tanks and the media that people are moving from suburbs to the historical core municipalities. This was effectively brought to light in a detailed analysis of Chicago metropolitan area results by New Geography’s Aaron Renn. This article analyzes data available for the eight metropolitan areas with more than 1 million population for which data had been released by February 20.

    Summary: Summarized, the results are as follows. A detailed analysis of the individual metropolitan areas follows (Table 1).

    • In each of the eight metropolitan areas, the preponderance of growth between 2000 and 2010 was in the suburbs, as has been the case for decades. This has occurred even though two events – the energy price spike in mid-decade and the mortgage meltdown – were widely held to have changed this trajectory. On average, 4 percent of the growth was in the historical core municipalities, and 96 percent of the growth was in the suburbs (Figure 1).
    • In each of the eight metropolitan areas, the suburbs grew at a rate substantially greater than that of the core municipality. The core municipalities had an average growth from 2000 to 2010 of 3.2 percent. Suburban growth was 21.7 percent, nearly 7 times as great.  Overall, the number of people added to the suburbs was 14 times that added to the core municipalities.
    Table 1:
    Metropolitan Area Population: 2000-2010
    2000 Population
    Historical Core Municipality Suburbs Metropolitan Area
    Austin              656,562            593,201         1,249,763
    Baltimore              651,154         1,901,840         2,552,994
    Chicago           2,895,671         6,053,068         8,948,739
    Dallas-Fort Worth           1,188,580         3,972,964         5,161,544
    Houston           1,953,631         2,761,776         4,715,407
    Indianapolis              860,454            664,650         1,525,104
    San Antonio           1,144,646            567,057         1,711,703
    Washington              572,059         4,181,934         4,753,993
    Total           9,922,757       20,696,490       30,619,247
    2010 Population
    Austin              790,390            925,899         1,716,289
    Baltimore              620,961         2,089,528         2,710,489
    Chicago           2,695,598         6,599,081         9,294,679
    Dallas-Fort Worth           1,197,816         5,173,957         6,371,773
    Houston           2,099,451         3,846,449         5,945,900
    Indianapolis              903,393            852,848         1,756,241
    San Antonio           1,327,407            815,101         2,142,508
    Washington              601,723         4,883,034         5,484,757
    Total         10,236,739       25,185,897       35,422,636
    Change: 2000-2010
    Austin              133,828            332,698           466,526
    Baltimore              (30,193)            187,688           157,495
    Chicago             (200,073)            546,013           345,940
    Dallas-Fort Worth                 9,236         1,200,993         1,210,229
    Houston              145,820         1,084,673         1,230,493
    Indianapolis               42,939            188,198           231,137
    San Antonio              182,761            248,044           430,805
    Washington               29,664            701,100           730,764
    Total              313,982         4,489,407         4,803,389
    Percentage Change: 2000-2010
    Austin 20.4% 56.1% 37.3%
    Baltimore -4.6% 9.9% 6.2%
    Chicago -6.9% 9.0% 3.9%
    Dallas-Fort Worth 0.8% 30.2% 23.4%
    Houston 7.5% 39.3% 26.1%
    Indianapolis 5.0% 28.3% 15.2%
    San Antonio 16.0% 43.7% 25.2%
    Washington 5.2% 16.8% 15.4%
    Total 3.2% 21.7% 15.7%
    Chicago excludes Kenosha County, WI
    Washington excludes Jefferson County, WV
    Indianapolis core municipality: Indianapolis & Marion County

    Analysis of Individual Metropolitan Areas: The major metropolitan areas for which data is available are described below in order of their population size (Figure 2 and Table 1).

    Chicago:The core municipality of Chicago lost 200,000 residents between 2000 and 2010. Suburban growth was 546,000, adding up to total metropolitan area growth of 346,000 people. The suburbs accounted for 158 percent of the metropolitan area growth. The core municipality decline was stunning in the face of the much ballyhooed urban renaissance in that great city. Yet this renaissance was limited enough as to not lead to an expanding population.

    The decline in the core municipality population represents a major departure from the 2009 Bureau of the Census estimates, which would have implied a 2010 population at least 170,000 higher (assumes the growth rate of 2008 two 2009).

    Instead all of the growth was in the outer suburbs, beyond the inner suburbs of Cook County.

    Dallas-Fort Worth: The historical core municipality of Dallas had a modest population increase of 9000, or less than 1 percent between 2000 and 2010. In contrast, the suburbs experienced an increase of 1.2 million, or 30 percent. Thus, approximately 1 percent of the metropolitan area growth was in the core municipality, while 99 percent was in the suburbs, most of it in the outer suburbs. The inner suburbs added 14 percent to their 2000 population, while the outer suburbs added 36 percent.

    The population figure for the core municipality of Dallas – consistently among the strong core areas –  was surprisingly low, at 9 percent below (117,000) the expected level. The suburban population was 1 percent (71,000) below expectations.

    Houston: The historical core municipality of Houston had comparatively strong population growth, adding 146,000 and 8 percent to its 2000 population. However this figure was 8 percent, or 174,000 below the expected figure. By contrast, the suburban growth was 39 percent, more than five times that of the central jurisdiction. The suburban population growth was 1,085,000, more than six times that of the core jurisdiction. The suburban population was 4 percent or 144,000 higher than expected.

    The core jurisdiction of Houston accounted for 12 percent of the metropolitan area growth while the suburbs s accounted for 88 percent. This was evenly distributed between the inner suburbs of Harris County and the outer suburbs. The inner suburbs added 38 percent to their population while the outer suburbs added 41 percent.

    Washington:Reversing a decade’s long trend, the historical core jurisdiction of Washington (DC) had a small population gain between 2000 and 2010. But the Washington, DC gain of 30,000 pales by comparison to the suburban gain, which was more than 20 times greater, at 700,000. The core jurisdiction accounted for 4 percent of the population gain, while the suburbs accounted for 96 percent.

    More than 60 percent of the growth in the metropolitan area was outside the inner suburban jurisdictions that border Washington, DC (Arlington County and Alexandria in Virginia, together with Montgomery County and Prince George’s County in Maryland), while the inner suburbs accounted for 36 percent of the growth. The population increase in the inner suburbs was 9 percent, compared to 37 percent in the outer suburbs.

    Jefferson County in West Virginia was not included in the analysis because data is not yet available.

    Baltimore: The historical core municipality of Baltimore, the site of another ballyhooed urban comeback, lost 30,000 people, or 5 percent of its 2000 population. Baltimore’s 2010 population was 4 percent or 16,000 below the expected level. The suburbs experienced a 10 percent or 188,000 person increase.  The region’s population increase was roughly equal in numbers between the inner suburbs and the outer suburbs, although the exurban percentage increase was nearly twice as large.

    San Antonio:The historical core municipality of San Antonio experienced the largest population increase among the eight metropolitan areas, at 183,000, a roughly 16 percent population jump. The city of San Antonio accounted 43 percent of the growth while suburbs in Bexar County and further out accounted for a larger 57 percent. However, the suburban population increase was 248,000 or 44 percent. This is something of a turnaround in trends that favored the city of San Antonio in the past because of its vast sprawl and predominant share of the metropolitan population.

    The city of San Antonio population was 5 percent or 65,000 people short of the expected 2010 level. The suburban population was 15 percent more or 104,000 more than the expected level.

    Indianapolis:The historical core area of Indianapolis and Marion County (including enclaves within Indianapolis) grew 5 percent and accounted for 19 percent of the metropolitan area growth. In contrast, the surrounding suburbs grew 28 percent, representing r 81 percent of the metropolitan area growth. Overall, the core municipality added 44,000 people, while the suburbs added more than four times as many, at 188,000.

    Austin:The historical core municipality of Austin experienced the greatest growth of any core jurisdiction in the eight metropolitan areas, at 20 percent. Even so, growth in the suburban areas was nearly 3 times as high at 56 percent. The city of Austin accounted for 29 percent of the metropolitan area population growth, while the suburbs accounted for 71 percent. Overall, the central municipality grew 134,000, while the suburbs grew 2.5 times as much, at 333,000.

    Generally it is fair to say that, so far, suburban areas are growing far faster than urban cores. In addition, most of the fastest growing core municipalities are those areas that are themselves largely suburban, particularly in relatively young cities like San Antonio, Houston and Austin.
     
    Among the eight metropolitan areas analyzed, the older core jurisdictions (with median house construction dates preceding 1960) tended to either lose population or grow modestly. This is illustrated by the city of Chicago, with a median house construction date of 1945, Baltimore with a median house construction date of 1946 and Washington with a median house construction date of 1949 (Table 2). Generally, the central jurisdictions with greater suburbanization (with median house construction dates of 1960 or later) grew more quickly. For example, highly suburban central jurisdictions like Austin with a median house construction date of 1983 and San Antonio, with a median house construction date of 1970, grew fastest. So much for the long forecast, and apparently still elusive, “return to the city”.

    Table 2:
    Historical Core Municipalities: Growth & Median House Age
    Historical Core Municipality
    Growth: 2000-2010 Share of Metropolitan Growth Median House Construction Year
    Austin 20.4% 28.7% 1983
    Baltimore -4.6% -19.2% 1946
    Chicago -6.9% -57.8% 1945
    Dallas-Fort Worth 0.8% 0.8% 1974
    Houston 7.5% 11.9% 1975
    Indianapolis 5.0% 18.6% 1967
    San Antonio 16.0% 42.4% 1979
    Washington 5.2% 4.1% 1949
    Average 3.2% 3.7%

    Wendell Cox is a Visiting Professor, Conservatoire National des Arts et Metiers, Paris and the author of “War on the Dream: How Anti-Sprawl Policy Threatens the Quality of Life

  • Chicago Takes a Census Shellacking

    The Census results are out for Illinois, and it’s bad news for the city of Chicago, whose population plunged by over 200,000 people to 2,695,598, its lowest population since before 1920.  This fell far short of what would have been predicted given the 2009 estimate of 2,851,268. It’s a huge negative surprise of over 150,000, though perhaps one that should have been anticipated given the unexpectedly weak numbers for the state as a whole that were released in December.

    The American Community Survey data from last year show a clear improvement in items like college degree attainment (up 7.6 percentage points since the 2000 Census) and median household income (up 18%, which trailed the nation slightly, but beat Cook County and the state).  These data points show the very real improvements that have swept over a portion of the city, the visible gentrification that envelops the greater core area has now been shown to have been unable to power overall population growth, or to restrain the rampant exurbanization in the region.

    White and Black Flight

    The non-Hispanic White Only population of the city actually declined by 52,449, or 5.78%.  The “minority” population declined even further, -147,969 or 7.44%, meaning the city actually grew its white population share by 0.38 percentage points, perhaps indicating the early stages of the “Europeanization” of Chicago as the core gentrifies and disadvantaged groups and the white working class are pushed further to the fringe.

    Indeed, the Black Only population plunged by 177,401 as blacks increasingly moved to suburbs, especially southern ones  like Matteson, Lansing, Calumet City, Park Forest, and Richton Park, each of which added thousands of new black residents.  Some indications are that a significant number of black residents left the region altogether.  The traditional black magnet of Atlanta – which struggled through much of the decade – was a top five destination for people leaving Chicagoland over the past decade, and Chicago was the #2 source of in-migrants to Memphis, another black hub, according to IRS data.

    Hispanic population was the bright spot for Chicago, as the city added Hispanic residents to the tune of 25,218, or 3.35%.  Hispanics boosted their population share in the city by nearly 3 percentage points.  But even this growth isn’t that impressive.  The city of Indianapolis, at less than a third Chicago’s population, added over 45,000 Hispanics on a much smaller base.

    Demographic Reality: Massive Exurbanization

    Much has been made of Chicago’s legitimate and real urban core renaissance, but the cold reality remains that this is one of America’s most sprawling regions. Regional growth continued to be heavily focused not in the city or established inner suburbs, but the exurbs.  Kendall County more than doubled in population, and counties like Grundy, Boone, and Kane also made the top five in the state. Cook County, which is about half made up of the city of Chicago, as a whole actually lost population. And traditional suburban powerhouse DuPage has flattened, while Lake County, Illinois fell just short of the national average in growth. During the last decade, a net of over 25,000 people moved from metro Chicago to metro Rockford, making that city the #2 destination for those leaving Chicagoland. Given that Rockford is hardly an economic mecca, clearly exurbanization is spreading far beyond traditional metro boundaries. Sprawl of the most intense kind is alive and well in Chicagoland.

    The following map illustrates this, with a five bucket sort of 2000-2010 population percentage change, growing counties in black, shrinking in red:


    The raw data on regional growth speaks for itself:

    Core+Suburb vs. Exurb

    2000

    2010

    Total Change

    Pct Change

    Core + Established Suburb (Cook, DuPage, Lake Counties)

    6,925,258

    6,815,061

    -110,197

    -1.6%

    Exurb (Other IL Metro Chicago Counties)

    1,347,510

    1,771,548

    424,038

    31.5%

    This sprawl might be more understandable in rapidly growing cities like Atlanta and Houston that can both densify the core and grow outwards simultaneously.  But the Chicago-Joliet-Naperville-IL Metropolitan Division (the full MSA is not yet available since Wisconsin hasn’t been released yet) grew at less than half the national average. This means that the exurbanization trend in Chicagoland is almost entirely loss of population share by the core to the fringe.

    To put an even starker view on the concentration of growth in Illinois as a whole, this map highlights only those counties that grew faster than the already anemic statewide average:


    Other than a handful of counties, the group of fastest growing counties in the state is dominated by suburban and especially exurban Chicago and St. Louis counties.

    For those of us who’ve chosen to plant our flag in the city, these results are most unwelcome news, no two ways about it. This is especially true as underfunded pensions and city budget gaps loom large, and where the per capita load only goes up as the population goes down.  This report should be a call to arms to the next mayor and the city as a whole to make the promise of revitalization a reality, and bring growth and prosperity to the city as a whole, not just a the upscale core. Cities like Chicago have to become more aspirational; places of upward mobility to broad sections of the middle and working classes. The city and Cook County can’t afford another decade like this one.

    Aaron M. Renn is an independent writer on urban affairs based in the Midwest. His writings appear at The Urbanophile.

    Photo by Gravitywave

  • 2010 Census: South and West Advance (Without California)

    For a hundred years, Americans have been moving south and west. This, with an occasional hiccup, has continued, according to the 2010 Census.

    During the 2000s, 84 percent of the nation’s population growth was in the states of the South and West (see Census region and division map below), while growth has been far slower in the Northeast and Midwest. This follows a pattern now four decades old, in which more than 75 percent of the nation’s population growth has been in the South and West. Indeed in every census period since the 1920s the South and West attracted a majority of the population growth.

    In the first census after World War II, in 1950, the East and the Midwest accounted for 58 percent of the nation’s population, with the South and West making up 42 percent. Since that time, the East and the Midwest have added less than 40 million people, while the South and West added nearly 120 million. Today, the ratios are nearly reversed, with 60 percent of the population living in the South and West and only 40 percent in the East and Midwest.

    The dominance of the South and West was overwhelming. The 24 fastest growing states were all in the South and West. The fastest growing state outside the West and South, surprisingly, was South Dakota, which added a second decade of unprecedented growth, after having gained almost no population between 1930 and 1990.

    Fastest and Slowest Growing States: The fastest growing states were the adjacent Mountain states of Nevada (35.1%), Arizona (24.6%), Utah (23.8%) and Idaho (21.1%). The only large state among the top five growing states was Texas, at 20.1%. These all greatly exceeded the national average growth rate of 9.7%

    Michigan was the only state to lose population (-0.6%) and became the first state in American history to ever exceed 10 million population (earlier in the decade) and then to fall back below that figure. Rhode Island grew only 0.4%. Louisiana grew only 1.4%, which in itself is an accomplishment given the 5 % loss that occurred between 2005 and 2006 after Hurricanes Katrina and Rita. Ohio ranked fourth lowest, gaining only 1.6%. New York continued its laggard performance, gaining only 2.1%. Since the late 1960s, New York (long the largest state) has added little more than one million people, while California added 19 million and has nearly doubled New York’s population.

    California: But all was not well in California. In every 10 year period after the 1920s, California added more people than any other state, until now. Between 2000 and 2010, Texas added 4.1 million people, nearly one million more than California.

    In no decade following the Depression (1930s) has California added so few new residents as in the 2000s. In the 1940s, California’s population rose by 3.7 million, starting from a 1940 base of 6.9 million. During the 2000s, the population increase was 3.4 million, on a 2000 base of 33.8 million.

    California still grew little faster than the national rate (10.0 percent compared to 9.7 percent). Yet this remains the lowest population growth rate for the state since its first Census, in 1850.

    Regional Analysis: The data, both state and regional, that is the basis of the regional analysis below is shown in Tables 1 and 2.

    The South: The South has had the largest share of the nation’s population since the 1940 census and it is now home to nearly 115 million people. The growth has been substantial, with 73 million new residents from 1950 to 2010, expanding 143%, more than twice the national growth rate of 104%. Overall, the South led national growth in the last decade, with a 14.3% rate and adding 14.2 million people. After Texas, the fastest growing states were North Carolina (18.5%), Georgia (18.3%) and Florida (17.6%), which had seen its growth reduced during the housing collapse. South Carolina (15.3%) also grew strongly. Outside of Louisiana, the slowest growth was in West Virginia (2.5%) and Mississippi (4.3%).

    The West: Since 1950, the West has added 58 million people, growing 256%. The West grew the second fastest among the regions, at 13.8% and added 8.7 million residents. As noted above, four of the five fastest growing states were in the Mountain West. In addition, Colorado grew 16.9%.

    The Midwest: Until the emergence of the South in 1940, the Midwest had been the nation’s largest region. Growth has been very slow. Since 1950, the Midwest has added 22.5 million people, but grown only 50 percent, or one-half the national rate of 104 percent. The Midwest had no states that grew above the national rate and had two of the states with the least growth (Michigan and Ohio). Perhaps signaling the rise of the upper Midwest, both North and South Dakota are growing faster than many Eastern or Midwestern states. After decades of population loss, South Dakota experienced unusual growth for the second decade in a row, while North Dakota, grew enough this decade to recover from decades of population loss dating to 1930.

    The Northeast: The nation’s former commercial heartland, the Northeast, has for its third census placed as the nation’s least populated region. A prediction in 1950 that the region housing New York, Philadelphia and Boston would fall so much in relative terms would have been considered absurd. Yet, from 1950 to 2010, the region added 16 million people, for the lowest regional growth rate (40%). The region added less than 2,000,000 population between 2000 and 2010, for a growth rate of 3.2%. The fastest growing state was New Hampshire, at 6.5%, reflecting the growth of its Boston suburbs and exurbs. All other states had growth rates less than one-half of the national rate.

    “Kudos” to the Bureau of the Census: Finally, congratulations are due the Bureau of the Census. In 2000, the Bureau was embarrassed by its under-estimation of the population during the previous decade. At the 1990 to 1999 estimation rate, the 2000 population would have been nearly 7,000,000 below the number of people actually counted in the census. The improvement during the decade of the 2000s was substantial. At the 2000 to 2009 estimate rate, the nation would have had 500,000 more people than were counted in 2010. Missing by less than 0.2 percent is pretty impressive.

    Table 1
    Regional Population: 1950-2010 (Census)
    Division/REGION 1950 1960 1970 1980 1990 2000 2010
    New England 9,314,453 10,509,367 11,841,663 12,348,493 13,206,943 13,922,517 14,444,865
    Middle Atlantic 30,163,533 34,168,452 37,199,040 36,786,790 37,602,286 39,671,861 40,872,375
    NORTHEAST 39,477,986 44,677,819 49,040,703 49,135,283 50,809,229 53,594,378 55,317,240
    East North Central 30,399,368 36,225,024 40,252,476 41,682,217 42,008,942 45,155,037 46,421,564
    West North Central 14,061,394 15,394,115 16,319,187 17,183,453 17,659,690 19,237,739 20,505,437
    MIDWEST 44,460,762 51,619,139 56,571,663 58,865,670 59,668,632 64,392,776 66,927,001
    NORTHEAST & MIDWEST 83,938,748 96,296,958 105,612,366 108,000,953 110,477,861 117,987,154 122,244,241
    Southeast 21,182,335 25,971,732 30,671,337 36,959,123 43,566,853 51,769,160 59,777,037
    East South Central 11,477,181 12,050,126 12,803,470 14,666,423 15,176,284 17,022,810 18,432,505
    West South Central 14,537,572 16,951,255 19,320,560 23,746,816 26,702,793 31,444,850 36,346,202
    SOUTH 47,197,088 54,973,113 62,795,367 75,372,362 85,445,930 100,236,820 114,555,744
    Mountain 5,074,998 6,855,060 8,281,562 11,372,785 13,658,776 18,172,295 22,065,451
    Pacific 15,114,964 21,198,044 26,522,631 31,799,705 39,127,306 45,025,637 49,880,102
    WEST 20,189,962 28,053,104 34,804,193 43,172,490 52,786,082 63,197,932 71,945,553
    SOUTH & WEST 67,387,050 83,026,217 97,599,560 118,544,852 138,232,012 163,434,752 186,501,297
    UNITED STATES 151,325,798 179,323,175 203,211,926 226,545,805 248,709,873 281,421,906 308,745,538


    Table 2              
    States and DC: Population 1950-2010 (Census)  
       
    State 1950 1960 1970 1980 1990 2000 2010
                   
    Alabama 3,061,743 3,266,740 3,444,165 3,893,888 4,040,587 4,447,100 4,779,736
    Alaska 128,643 226,167 300,382 401,851 550,043 626,932 710,231
    Arizona 749,587 1,302,161 1,770,900 2,718,215 3,665,228 5,130,632 6,392,017
    Arkansas 1,909,511 1,786,272 1,923,295 2,286,435 2,350,725 2,673,400 2,915,918
    California 10,586,223 15,717,204 19,953,134 23,667,902 29,760,021 33,871,648 37,253,956
    Colorado 1,325,089 1,753,947 2,207,259 2,889,964 3,294,394 4,301,261 5,029,196
    Connecticut 2,007,280 2,535,234 3,031,709 3,107,576 3,287,116 3,405,565 3,574,097
    Delaware 318,085 446,292 548,104 594,338 666,168 783,600 897,934
    District of Columbia 802,178 763,956 756,510 638,333 606,900 572,059 601,723
    Florida 2,771,305 4,951,560 6,789,443 9,746,324 12,937,926 15,982,378 18,801,310
    Georgia 3,444,578 3,943,116 4,589,575 5,463,105 6,478,216 8,186,453 9,687,653
    Hawaii 499,794 632,772 768,561 964,691 1,108,229 1,211,537 1,360,301
    Idaho 588,637 667,191 712,567 943,935 1,006,749 1,293,953 1,567,582
    Illinois 8,712,176 10,081,158 11,113,976 11,426,518 11,430,602 12,419,293 12,830,632
    Indiana 3,934,224 4,662,498 5,193,669 5,490,224 5,544,159 6,080,485 6,483,802
    Iowa 2,621,073 2,757,537 2,824,376 2,913,808 2,776,755 2,926,324 3,046,355
    Kansas 1,905,299 2,178,611 2,246,578 2,363,679 2,477,574 2,688,418 2,853,118
    Kentucky 2,944,806 3,038,156 3,218,706 3,660,777 3,685,296 4,041,769 4,339,367
    Louisiana 2,683,516 3,257,022 3,641,306 4,205,900 4,219,973 4,468,976 4,533,372
    Maine 913,774 969,265 992,048 1,124,660 1,227,928 1,274,923 1,328,361
    Maryland 2,343,001 3,100,689 3,922,399 4,216,975 4,781,468 5,296,486 5,773,552
    Massachusetts 4,690,514 5,148,578 5,689,170 5,737,037 6,016,425 6,349,097 6,547,629
    Michigan 6,371,766 7,823,194 8,875,083 9,262,078 9,295,297 9,938,444 9,883,640
    Minnesota 2,982,483 3,413,864 3,804,971 4,075,970 4,375,099 4,919,479 5,303,925
    Mississippi 2,178,914 2,178,141 2,216,912 2,520,638 2,573,216 2,844,658 2,967,297
    Missouri 3,954,653 4,319,813 4,676,501 4,916,686 5,117,073 5,595,211 5,988,927
    Montana 591,024 674,767 694,409 786,690 799,065 902,195 989,415
    Nebraska 1,325,510 1,411,330 1,483,493 1,569,825 1,578,385 1,711,263 1,826,341
    Nevada 160,083 285,278 488,738 800,493 1,201,833 1,998,257 2,700,551
    New Hampshire 533,242 606,921 737,681 920,610 1,109,252 1,235,786 1,316,470
    New Jersey 4,835,329 6,066,782 7,168,164 7,364,823 7,730,188 8,414,350 8,791,894
    New Mexico 681,187 951,023 1,016,000 1,302,894 1,515,069 1,819,046 2,059,179
    New York 14,830,192 16,782,304 18,236,967 17,558,072 17,990,455 18,976,457 19,378,102
    North Carolina 4,061,929 4,556,155 5,082,059 5,881,766 6,628,637 8,049,313 9,535,483
    North Dakota 619,636 632,446 617,761 652,717 638,800 642,200 672,591
    Ohio 7,946,627 9,706,397 10,652,017 10,797,630 10,847,115 11,353,140 11,536,504
    Oklahoma 2,233,351 2,328,284 2,559,229 3,025,290 3,145,585 3,450,654 3,751,351
    Oregon 1,521,341 1,768,687 2,091,385 2,633,105 2,842,321 3,421,399 3,831,074
    Pennsylvania 10,498,012 11,319,366 11,793,909 11,863,895 11,881,643 12,281,054 12,702,379
    Rhode Island 791,896 859,488 946,725 947,154 1,003,464 1,048,319 1,052,567
    South Carolina 2,117,027 2,382,594 2,590,516 3,121,820 3,486,703 4,012,012 4,625,364
    South Dakota 652,740 680,514 665,507 690,768 696,004 754,844 814,180
    Tennessee 3,291,718 3,567,089 3,923,687 4,591,120 4,877,185 5,689,283 6,346,105
    Texas 7,711,194 9,579,677 11,196,730 14,229,191 16,986,510 20,851,820 25,145,561
    Utah 688,862 890,627 1,059,273 1,461,037 1,722,850 2,233,169 2,763,885
    Vermont 377,747 389,881 444,330 511,456 562,758 608,827 625,741
    Virginia 3,318,680 3,966,949 4,648,494 5,346,818 6,187,358 7,078,515 8,001,024
    Washington 2,378,963 2,853,214 3,409,169 4,132,156 4,866,692 5,894,121 6,724,540
    West Virginia 2,005,552 1,860,421 1,744,237 1,949,644 1,793,477 1,808,344 1,852,994
    Wisconsin 3,434,575 3,951,777 4,417,731 4,705,767 4,891,769 5,363,675 5,686,986
    Wyoming 290,529 330,066 332,416 469,557 453,588 493,782 563,626
                   
    United States 151,325,798 179,323,175 203,211,926 226,545,805 248,709,873 281,421,906 308,745,538

    Wendell Cox is a Visiting Professor, Conservatoire National des Arts et Metiers, Paris and the author of “War on the Dream: How Anti-Sprawl Policy Threatens the Quality of Life

    Photo by Travelin’ Librarian – Michael Sauers