Tag: Chicago

  • Chicago: Out of the Loop

    The “global city” is one of the dominant themes related to  urban success today.  In this model, cities serve both as huge agglomerations of top specialized talent and also as “control nodes” of the global economy serving as key sites for the production of financial and producer services demanded by the new globalized economy. In her seminal book on the subject, Saskia Sassen noted New York, London, and Tokyo as the paradigmatic examples of the global city.

    The status of global cities, however, is protean, and not all “global cities” are created equal or occupy a similar status. Tokyo, for example, is clearly fading in the face of the shift of economic power from Japan to the Chinese sphere of influence – Shanghai, Beijing, Hong Kong and Singapore.

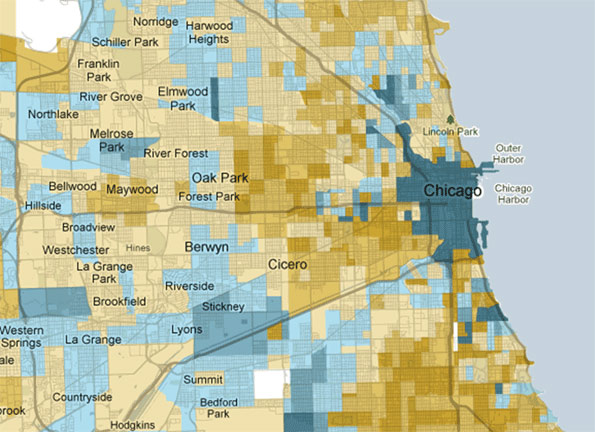
    Chicago has long prided itself as one of those cities, and consistently rated in the top ten global cities in various surveys. It’s a huge business services hub, financial hub, transport hub, cultural center, and massive draw for talent. The greater Loop area is clearly a classic global city area, densely packed with knowledge workers, with gleaming towers all around – over a hundred of which went up in the last decade. The transformation of the Loop and the surrounding neighborhoods in the last 20 years has been nothing short of stunning and remains a testament to the record of both Mayor Daleys.

    Even at its best, the global city model has its weaknesses, such as extreme income inequality, but at least it seems to provide a model that works in an era when so many urban formulas have failed.  Chicago, for example, has used its global city status to avoid the rot that has hit so many Midwestern cities.

    But for Chicago, though its global city side is running strong, there’s a serious problem. Although impressive both economically and awe-inspiring in its physical form, the greater Loop economy is just too small – especially relative to the size of the region. This suggests that the Chicago region cannot rely primarily on the global city to carry its economy.

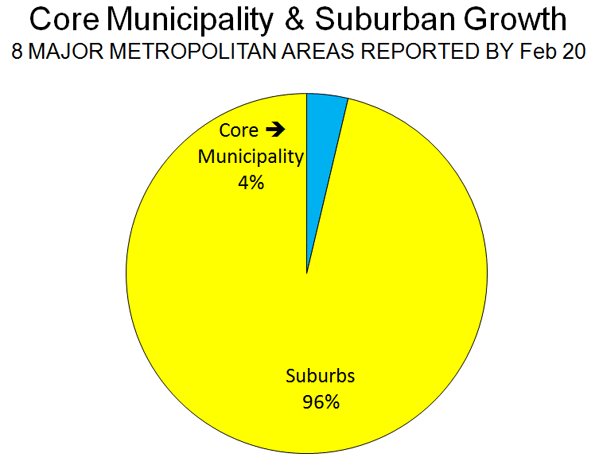
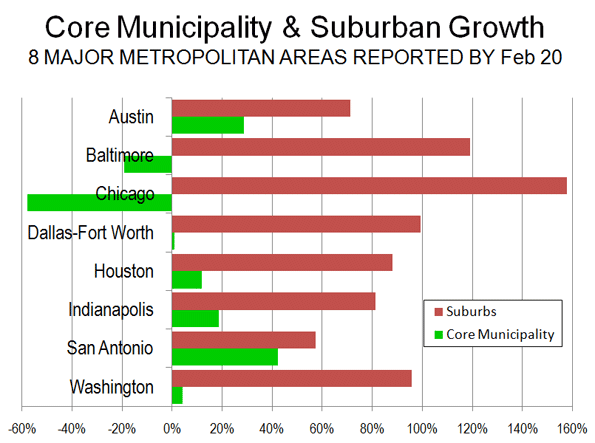
    This might seem difficult to believe given that the greater Loop is the second largest business district in the United States and home to over half the region’s office space. But it can be easily illustrated by comparing Chicago employment to that in Manhattan.  Here’s a comparison of total jobs in Manhattan vs. all of Cook County, Illinois.


    Source: Quarterly Census of Employment and Wages

    As you can see, Manhattan has almost as many jobs as all of Cook County, and the two are converging. Given trends in both cities, it doesn’t seem unreasonable to think that in the near future Manhattan may actually have more jobs than Cook County.  Not only are there more jobs in Manhattan, but they pay significantly higher wages.  Here is a comparison of the average weekly wage between the two:


    Source: Quarterly Census of Employment and Wages

    Manhattan wages dropped as a result of the financial crash, but still remain 70% higher than Cook County – and until the crash had been pulling away.  They may be surging again as Wall Street has been a notable beneficiary of the bailouts. But the difference in scale is significant under any circumstances. Manhattan, with a mere tenth of the regional population, has about as many jobs as Cook County, which has over half the regional population. The wealth and income engine of Manhattan is simply of a different order and power than any other US city. As a result, the global city side of New York for which Manhattan is a proxy really can pay the freight for not just the outer boroughs, but also the greater region and the budgets of not only New York but to some extent New Jersey and Connecticut as well.

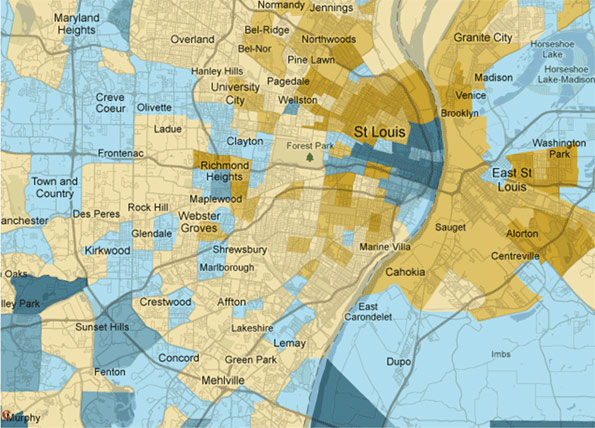
    By contrast, Chicago’s global city side, strong as it is, simply cannot perform the same role in powering its region and state. Though estimates are that it encompasses something like 600,000 people participate in it, and though the Loop along with select suburban business districts are legitimately thriving, this economy is just too small to support the entire region. In fact it can’t pay the bills even for the rest of Chicago itself, much less the region or state, especially considering that the non-global city parts are basically Rust Belt in character.  That’s one reason local government finance is in such rough shape.  The city is facing a deficit of about $650 million and the state’s unfunded future liabilities are upwards of $160 billion.

    Clearly, Chicago needs to continue focusing on expanding the size of its Loop economy and ensuring that it remains a top global city destination in the future. But unlike some other places that can hang their hat on that if they want, Chicago has to go beyond just being a global city and also be something more. After all, Chicago does not enjoy a “lock” on any industry, like New York with finance and media, or even Houston in energy, the Bay Area in technology or Los Angeles in entertainment. In almost every major business category it is not the lead player, which allows for greater economies of agglomeration and, perhaps even more importantly, a powerful and enduring global signature.

    But bluntly, the world city economy is too diffused and small to offer much to the 90% of its people who aren’t a part of that.  In short, Chicago needs more “outside the Loop” thinking.

    A critical aspect of the challenge here lies with improving  the state and local business climate, recently rated as one of the worst in the country by Chief Executive magazine. If you’re a hedge fund partner, architect, or celebrity chef, things are great. But for bread and butter type businesses and workers, which constitute the vast majority of the economy, things are quite different. That’s why everyone from the CEO of Caterpillar,based three hours from the city, on down is publicly complaining and threatening to move.

    Fixing this means finally rooting out the corruption that undermines confidence in local government, restructuring state and local finances to provide more certainty to investors, continuing to focus on education, addressing the infrastructure investment deficit, and radically reducing the red tape that plagues small and medium sized businesses.

    None of these are sexy or easy. In fact, the CEO of the Chicagoland Chamber of Commerce recently said he’s not putting any faith in claims by Rahm Emanuel, the new mayor  that red tape relief is on the way, reflecting the level of skepticism in the local business community right now. Today businesses in the city literally need a city ordinance passed in order to do seemingly simple things like add an awning or get a sidewalk café permit – something that is totally at the discretion of the alderman.  The Chicago Reader recently reported that this sort of “ward housekeeping” accounts for over 95% of city council legislation. Clearly this approach is toxic to business.  That’s why these items are absolutely mission critical items to creating a regional economy that can actually generate employment and pay the bills going forward. Glamor jobs and prestige employers downtown just aren’t going to cut it by themselves anymore.

    Aaron M. Renn is an independent writer on urban affairs based in the Midwest. His writings appear at The Urbanophile.

    Photo by Doug Siefken

  • World Urbanization Update: Delhi 2nd in a World of Smaller Urbanization

    Perhaps the most surprising development in urban areas over the past year was the ascendancy of Delhi to rank second in the world in population, following only Tokyo – Yokohama. Based upon the new United Nations population estimate, the 7th annual edition of Demographia World Urban Areas places Delhi’s population at 22.6 million. Tokyo – Yokohama, however, is in no immediate jeopardy of losing its number one status, with a population estimated at 36.7 million, approximately 70 percent greater than that of Delhi (Note 1). Demographia World Urban Areas includes population estimates  for all identified urban areas in the world with 500,000 or more residents. Among these 796 urban areas, 169 are in higher income nations and 627 are in lower income nations.

    The Largest Urban Areas: For years, demographers have been watching Mumbai on the assumption that it might eventually emerge as the largest urban area outside Tokyo – Yokohama. However, Mumbai, at 21.3 million, has fallen behind faster growing Delhi and now ranks as the sixth largest urban area in the world. Seoul-Incheon, in Korea, has emerged as the number three urban area, based upon higher than anticipated  suburban growth registered in the 2010 census and now shows a population of 22.5 million. Jakarta, Indonesia’s capital, now stands as number four, with a population of 22.2 million, followed by number five Manila at 21.3 million (Note 2). The next three largest world urban areas are in the Americas with New York at 20.7 million, Sao Paulo at 20.4 million and Mexico City at 19.6 million. The world’s 10th largest urban area is Shanghai (18.7 million), which experienced larger than anticipated growth toward the end of the decade (Table).

    10 Largest Urban Areas in the World: 2011
    Rank
    Geography Urban Area
    Current Year Population Estimate
    Land Area: Square Miles
    Density
    Land Area: Km2
    Density
    Density Year
    1 Japan Tokyo-Yokohama
    36,690,000
    3,500
    10,500
    9,065
    4,000
    2011
    2 India Delhi, DL-HAR-UP
    22,630,000
    605
    37,000
    1,567
    14,300
    2011
    3 South Korea Seoul-Incheon
    22,525,000
    835
    27,000
    2,163
    10,400
    2011
    4 Indonesia Jakarta
    22,245,000
    1,075
    20,400
    2,784
    7,900
    2011
    5 Philippines Manila
    21,295,000
    550
    37,000
    1,425
    14,300
    2009
    6 India Mumbai, MAH
    21,290,000
    300
    70,300
    777
    27,100
    2011
    7 United States New York, NY-NJ-CT
    20,710,000
    4,349
    4,500
    11,264
    1,800
    2000
    8 Brazil Sao Paulo
    20,395,000
    1,125
    18,100
    2,914
    7,000
    2011
    9 Mexico Mexico City
    19,565,000
    780
    25,000
    2,020
    9,700
    2011
    10 China Shanghai
    18,665,000
    1,125
    16,500
    2,914
    6,400
    2011


    Among the top ten urban areas, New York is by far the least dense, followed by Tokyo-Yokohama. They are also the most affluent, with seven of the remaining 10 far more dense and located in lower income countries, while Seoul-Incheon is more dense, but in a nation that is among the latest entrants to higher income status (Figures 1 & 2).


    Highest Population Densities: Dhaka, the capital of Bangladesh is the most dense with 90,600 persons per square mile or 35,000 per square kilometer. Dhaka ranks 24th in population in the world and crowds its approximately 11.5 million residents into 125 square miles or 325 square kilometers (less than the land area of the municipality of Portland, Oregon). Mumbai ranks second in population density, with 70,300 per square mile or 27,100 percent per square kilometer. Among high income urban areas, Macau is the most dense, at 70,000 per square mile or 27,000 per square kilometer, slightly ahead of its neighbor across the Pearl River, Hong Kong, which is estimated to have 66,100 residents per square mile or 25,500 per square kilometer. Of course, both Hong Kong and Macau have artificially high densities, driven by their enclave status. Comparatively few urban areas in the high income world exceed 15,000 per square mile (6,000 per square kilometer).

    Largest Urban Land Area: Although we commonly identify Gotham with the density of high-rise Manhattan, New York sprawls more than any of the top urban areas. Its urban area contains far the largest  land area, stretching to cover 4,350 square miles or 11,300 square kilometers. Los Angeles, more noted for its physical expanse, has approximately one-half the land area of New York and it extends less than both Tokyo – Yokohama and Chicago. Perhaps astonishingly, the Boston urban area covers approximately 95 percent of the land area of Los Angeles, though with only one-third the population.

    Larger Urban Areas, Higher Density: As urban areas become larger, their population densities also increase. Moreover, as in the top 10 urban areas, lower income nations tend to have far higher densities than the urban areas located in the higher income nations(Figures 3 & 4).


    • Overall urban densities are approximately 9,000 per square mile (3,500 per square kilometer) in urban areas with between 500,000 and 1 million population and rise to 15,500 per square mile (6,000 per square kilometer) among urban areas with more than 10 million population.
    • Urban areas in higher income nations range from a population density of 3,800 per square mile (1,500 per square kilometer) among urban areas with from 500,000 to 1,000,000 population. Larger urban areas with more than 10 million population average o 8,900 per square mile (3,400 per square kilometer).
    • The urban areas located in lower income nations have far higher densities densities, ranging from 15,100 per square mile (6,000 per square kilometer) in the 500,000 to 1,000,000 population category and up to 22,100 residents per square mile (8,500 per square kilometer) in the over 10 million population category.           


    Population Density by  Region: There is also considerable variation in urban population densities between the regions of the world (Figures 5 & 6).


    The lowest densities are in affluent areas. The United States and Canada, at 3,600 per square mile (1,400 per square kilometer), Oceania at 4,100 per square mile (1,600 per square kilometer) and Europe at 8,400 per square mile (3,200 per square kilometer). Latin American urban densities are 15,900 per square mile (6,200 per square kilometer), followed by Africa at 18,600 per square mile (7,200 per square kilometer) and Asia, at 18,800 per square mile (7,300 per square kilometer).

    The overall population density of urban areas with more than 500,000 residents in India is estimated at 37,000 per square mile (14,400 per square kilometer), which is more than double that of China, at 17,000 per square mile (6,700 per square kilometer).

    A Smaller Urban World? A review of the size of the world urban areas shows the planet to be made up principally of rural areas and towns and cities with less than 500,000 population. In 2011, approximately 51 percent of the world is urban and 49 percent is rural. Urban areas ranging from just a few thousand residents to under 500,000 residents account for 27 percent of the world’s population, which constitutes a majority of its urban population. Among the larger urban areas, megacities (10,000,000 and larger) and the urban areas with between 1 million people and 2.5 million people each for approximately 6 percent of the world population. The other larger categories of urban areas each account for approximately 4 percent of the world’s population (Figure 5).

    The McKinsey Global Institute recently reported that the world’s megacities were growing less quickly than the other large urban areas. This development, along with the distribution of world urban population may indicate that world’s largest urban areas, especially the megacities, may not be the wave of the future; instead it may be smaller urbanized regions between 500,000 and 10 million.  These regions, with three times the population of the megacities, will likely shape urbanity over the next few decades.

    —————-

    Note 1: An urban area is an urban agglomeration or an urban footprint (area of continuous development). An urban area is the organism of the “city” in its spatial dimension. Census authorities in a number of nations have adopted similar definitions for urban areas (Examples are United States, Canada, United Kingdom, France, Norway, Sweden and Australia). Demographia World Urban Areas uses national census bureau data for both population and land area estimates where it is available and estimates urban land area from satellite imagery for all others.

    Note 2: for the purposes of this analysis, higher income urban areas are generally in nations with a gross domestic product of $20,000 per capita, purchasing power parity.

    Note 3: The urban area population estimates of Seoul-Incheon, Jakarta and Manila are considerably of love those reported by the United Nations. The United Nations data for these urban areas is based upon a far smaller definition of urbanization than is used in other urban areas. As additional explanatory notes are found in Demographia World Urban Areas.

    Photo: India Gate, Delhi (by author)

    Wendell Cox is a Visiting Professor, Conservatoire National des Arts et Metiers, Paris and the author of “War on the Dream: How Anti-Sprawl Policy Threatens the Quality of Life

  • Rethinking Urban Dynamics: Lessons from the Census

    Much has been made of the vaunted “back to the city” movement by “the young and restless,” young professionals, the creative class, empty nesters and others were voting with their feet in favor of cities over suburbs.  Although there were bright spots, the Census 2010 results show that the trend was very overblown, affecting mostly downtown and near downtown areas, while outlying ones bled population.  One culprit for this discrepancy seems to be that the intra-census estimates supplied by the Census Bureau were inflated – in some cases very inflated.

    Looking at selected core cities for major US metropolitan areas, many of them were materially over-estimated:


    One particularly egregious case relates to Atlanta. Its huge projected population increase in the 2000s led me to describe it as “one of America’s top urban success stories.”  The reality proved to be quite different. Rather than strong population growth in the city, the population growth turned out to be basically flat, quite a different story.  Other declines might be more predictable, such as Detroit, or those who had previously challenged estimates like Cincinnati and St. Louis.  Still, even urban cores in rapidly growing regions like Dallas and Houston were not immune from this trend.

    There were some exceptions. Cities like Indianapolis, Columbus, and Oklahoma City came in slightly ahead of expectations, but the number of cities with misses and the sizes of the positive and negative misses tilted towards the down direction.

    It seems clear now that the justification for much of the “back to the city” story reflected bad estimates. People can’t be faulted for relying on the official government numbers – I did. But the reality of the 2010 Census, as demonstrated by Wendell Cox and others, is that the 1990s were actually better for urban population growth in America than the 2000s in many respects.

    One legitimate bright spot for cities lay in the growth of downtown and near downtown areas.  Though often starting from low bases, these areas often showed impressive increases.  For example, St. Louis showed good growth downtown despite a very disappointing decline in total city population:

    The poster child for this phenomenon was Chicago, where a fairly expansive area in the greater core showed large population growth.  Areas that were formerly almost all commercial, such as the Loop, added significant residential population, while areas that were nearly derelict like the near South Side have blossomed into thriving upscale neighborhoods.


    The problem, from places ranging from Chicago to Cleveland, is that the gains in the “core of the core” have been more than offset by losses elsewhere, especially the flight of blacks and other minorities – many of them immigrants – to the increasingly diverse suburbs.

    Cities across America have invested enormous sums into downtown redevelopment and major projects in selected districts.  The good news: these investments have shown some ability to move the needle in terms of attracting young professionals downtown.  The bad news lies with the fact that these developments have been extremely costly, and have not transformed the overall demographic or economic climates of the cities that tried them.  This demonstrates the limits of the policies.  Those who aren’t in the young professional, empty nester, or creative class demographic have rightly figured out that they are no longer the target market of city leadership. No surprise then that many of them    have decided to vote with their feet.

    Given the resulting overall negative swings, cities may want to revisit their strategy of putting all their chips in the downtown redevelopment basket in favor of less glamorous improvements in basic neighborhood safety, services, schools and other critical elements.  A handful of elite enclaves and talent hubs may be able to thrive on a “favored demographic quarter” strategy, but for most places there just aren’t enough young professionals and artists to go around.

    Aaron M. Renn is an independent writer on urban affairs based in the Midwest. His writings appear at The Urbanophile.

    * Actual population minus projected population as of 4/1/2010 using a run rate projection based on the 2008-2009 estimated population growth.
    ** Base is the projected 4/1/2010 population above.

    Photo by Ian Freimuth

  • Chicago’s Unique Population Loss of the 1 Million Plus Cities

    There are only 9 cities in the United States with populations over 1 million. The list includes New York, Los Angeles, San Diego, Philadelphia, Chicago, Phoenix, Houston, San Antonio, and Dallas. With this afternoon’s release of Census 2010 numbers for New York City, the final 2010 data is in.

    Of these 1 million or more cities, only Chicago lost population over the last decade, yet the media seems to be in love with Mayor Daley.  The New Yorker called Mayor Daley “America’s most successful mayor.” Newsweek is equally “impressed” with Daley’s performance, saying “Daley also leaves behind a glittering metropolis that Chicagoans rightly love and outsiders can only envy.”

    Chicago’s 200,000 person loss shows Mayor Daley’s failed legacy as Mayor. Daley leaves office with a smaller population than when he took office in 1989. Numbers are stubborn things. There was no Chicago comeback of the middle class to experience bad public schools, high taxes, and corruption.  Almost no one predicted Philadelphia would gain population while Chicago declined. Mayor Daley’s legacy appears to be built on smoke and mirrors. A fawning media of urban reporters puffed up Daley for years. According to the numbers, Mayor Daley is America’s worst Mayor leaving Rahm Emanuel with intractable problems. Is it more accurate to call Mayor Daley the white man’s Coleman Young?

  • The Protean Future Of American Cities

    The ongoing Census reveals the continuing evolution of America’s cities from small urban cores to dispersed, multi-polar regions that includes the city’s surrounding areas and suburbs. This is not exactly what most urban pundits, and journalists covering cities, would like to see, but the reality is there for anyone who reads the numbers.

    To date the Census shows that  growth in America’s large core cities has slowed, and in some cases even reversed. This has happened both in great urban centers such as Chicago and in the long-distressed inner cities of St. Louis, Baltimore, Wilmington, Del., and Birmingham, Ala.

    This would surely come as a surprise to many reporters infatuated with growth in downtown districts, notably in Chicago, Los Angeles, Denver and elsewhere. For them, good restaurants, bars and clubs trump everything. A recent Newsweek article, for example, recently acknowledged Chicago’s demographic and fiscal decline but then lavishly praised the city, and its inner city for becoming “finally hip.”

    Sure, being cool is nice, but the obsession with hipness often means missing a bigger story: the gradual diminution of the urban core as engines for job creation. For example, while Chicago’s Loop has doubled its population to 20,000, it has also experienced a large drop in private-sector employment, which now constitutes a considerably smaller share of regional employment than a decade ago. The same goes for the new urbanist mecca of Portland as well as the heavily hyped Los Angeles downtown area.

    None of this suggests, however, that the American urban core is in a state of permanent decline. The urban option will continue to appeal to small but growing segment of the population, and certain highly paid professionals, notably in finance, will continue to cluster there.

    But the bigger story — all but ignored by the mainstream media — is the continued evolution of urban regions toward a more dispersed, multi-centered form. Brookings’ Robert Lang has gone even further, using the term “edgeless cities” to describe what he calls an increasingly “elusive metropolis” with highly dispersed employment.

    Rather than a cause for alarm, this form of  development  simply reflects  the protean vitality of American urban forms.  Two regions, whose results were released last week, reveal these changing patterns. One is the Raleigh region, which has experienced a growth rate of 42%, likely the highest of the nation’s regions with a population over 1 million. This metropolitan area, anchored by universities and technology-oriented industries, is among the lowest-density regions in the country, with under 1,700 persons per square mile, slightly less than Charlotte, Nashville and Atlanta.

    Unlike the geographically constrained older urban areas, Raleigh’s historical core municipality experienced strong growth, from 288,000 to 404,000, a gain of 40%. This gain was aided by annexations that added nearly 30% to the area of the municipality (from 113 to 143 square miles). The annexations of recent decades have left the city of Raleigh with an overwhelmingly suburban urban form. In 1950, at the beginning of the post-World War II suburban boom, the city of Raleigh had a population of 66,000, living in a land area of only 11 square miles.

    Even here, however, the suburbs (the area outside the city of Raleigh) gained nearly two-thirds of the metropolitan area growth (65%) and now have 64% of the region’s population. Over the last ten years, the suburbs have grown 43%. It is here that much of the economic growth of the Research Triangle has taken place, as companies concentrate in predominately suburban communities such as Cary.

    Yet in most demographically healthy urban regions, the growth continues to be primarily in the suburban centers. One particularly relevant example is the Kansas City area, a dynamic region anchoring what we have identified as “the zone of sanity.” Like most American regions, the Kansas City area is growing, but in ways that often do not resemble the fantasies of urban density boosters.

    KC’s growth pattern is important and could be a harbinger of what’s to come in this decade. Along with Indianapolis, this resurgent Heartland region is expanding faster than the national average. It is also attracting many talented people, ranking in our top ten list of the country’s “brain magnets,” a performance better than such long-standing talent attractors as Seattle, Portland, San Francisco, and Boston. Between 2007 and 2009, the Kansas City region’s growth in college-educated residents was more than twice the rate of our putative intellectual meccas of New York, Chicago or Los Angeles.

    But despite the wishes of some  in Kansas City’s traditional establishment, this cannot be interpreted as meaning that  the “hip and cool” are being lured en masse to the city’s inner core. Over the past decade, as in most American regions, Kansas City has expanded far more outward than inward. Despite a modest increase in the city’s population of some 18,000 — much of it in the city’s furthest urban boundaries — the city’s population remains below its 1950 high. On the other hand, some 91% of its 200,000 population increase occurred in the suburban periphery.

    Critically, it is important to note that this expansion reflects not so much the growth of “bedroom” communities, but a dramatic shift of employment to the periphery. By far the most important center for this new suburban growth in jobs and people lies across the river in Johnson County, Kan.. Over the past decade, Johnson County has accounted for roughly half of the region’s total growth.

    Johnson County  – which boasts among the highest levels of educated people in the country — also has become the primary locale for many technology and business service firms, with more people commuting into the area than out. This reflects an increasingly suburbanized economic base. Over the past decade the urban core of Jackson County has lost 42,000 jobs, while the surrounding suburbs have grown by 20,000, with the biggest growth in largely exurban Platte County.

    So what does this tell us about the future of the American urban region?  Certainly the expansion of relatively low-density peripheral areas negates the notion of a  ”triumphant” urban core. Dispersion is continuing virtually everywhere, and with it, a movement of the economic center of gravity away from the city centers in most regions.

    But in another way these patterns augur a bright future for an expansive American metropolis that, while not hostile to the urban center, recognizes that most businesses and families continue to prefer lower-density, decentralized settings.  The sooner urbanists and planners can accommodate themselves to this fact, the sooner we can work on making these new dynamic patterns of residence and employment more sustainable and livable for the people and companies who will continue to gravitate there.

    This piece originally appeared at Forbes.com

    Joel Kotkin is executive editor of NewGeography.com and is a distinguished presidential fellow in urban futures at Chapman University, and an adjunct fellow of the Legatum Institute in London. He is author of The City: A Global History. His newest book is The Next Hundred Million: America in 2050, released in February, 2010.

    Kansas City skyline photo by Tim Samoff

  • Chicago, Portland: Employment Dispersion from Downtown Continues

    New data shows that the downtown areas of both Chicago and Portland (Oregon) are modestly dispersing and losing market share in relation to metropolitan area employment.

    Chicago: The Chicago Loop Alliance reports that private sector employment in the Loop, the core of the Chicago downtown area, fell from 338,000 to 275,000 between 2000 and 2010. An additional 30,000 government workers are employed in the Loop, however 2000 data was not provided for the government sector. As a result of the loss, the Loop private sector share of total Chicago metropolitan area employment fell 13 percent, from 7.7 percent in 2000 to 6.7 percent in 2010.

    The larger downtown area, including areas to the north (North Michigan Avenue area) and to the south had total private sector employment of 480,000. Chicago had the second largest downtown (central business district) in the nation in 2000, with an employment density of more than 160,000 per square mile and a transit work trip market share of 55 percent, trailing only the Manhattan business district (south of 59 Street) and the Brooklyn central business district).

    Portland: The Portland Business Alliance reported that downtown Portland employment had fallen from 86,800 in 2001 to 83,400 in 2009. This represents a four percent market share loss in comparison to the metropolitan area over the period. All of Portland’s growth over the period has been in suburban Clark and Skamania counties in Washington, which added 12,700 jobs, while the Oregon portion of the metropolitan area was losing 4,500 jobs.

    In 2000, Portland had the nation’s 22nd largest central business district, and the 12th highest transit work trip market share, at 30 percent (Brooklyn included).

  • Rahm Emanuel Wins The Right to Confront Chicago’s Problems

    Rahm Emanuel has won Chicago’s Mayoral election. He now must confront Chicago’s massive problems. The Chicago Sun-Times is already grim:

    Rahm Emanuel’s Round One victory gives him a running start on confronting problems so severe, the painful solutions could seal his fate as a one-termer.

    Whether Emanuel can avoid a one-and-done scenario — assuming he even wants to serve more than four years — will largely depend on how he tackles the biggest financial crisis in Chicago history.
    The city is literally on the brink of bankruptcy with a structural deficit approaching $1 billion when under-funded employee pensions are factored in.

    Mayor Daley borrowed to the hilt, sold off revenue-generating assets and spent most of the money to hold the line on taxes in his last two budgets. The city even borrowed $254 million to cover back pay raises long anticipated for police officers and firefighters.

    Last night’s election results could be a preview of Emanuel’s coming conflict with Chicago’s city workforce. Emanuel lost in some important wards where powerful city workers live. The government unions feel Emanuel might be too willing to cut their benefits and pensions. Alderman Ed Burke, Chairman of Chicago’s Finance Committee, will now be Emanuel’s biggest short-term problem (Burke’s 14th Ward didn’t support Emanuel). Does Emanuel have the votes in City Council to remove Alderman Ed Burke from his committee post? It’s too early to tell. Will Emanuel and Burke cut a deal?

    The new census numbers showed Chicago with population loss of 200,000 from 2000 to 2010. These Detroit style numbers show Rahm Emanuel will need all the help he can get. Chicago is in decline.

  • The Still Elusive “Return to the City”

    Metropolitan area results are beginning to trickle in from the 2010 census. They reveal that, at least for the major metropolitan areas so far, there is little evidence to support the often repeated claim by think tanks and the media that people are moving from suburbs to the historical core municipalities. This was effectively brought to light in a detailed analysis of Chicago metropolitan area results by New Geography’s Aaron Renn. This article analyzes data available for the eight metropolitan areas with more than 1 million population for which data had been released by February 20.

    Summary: Summarized, the results are as follows. A detailed analysis of the individual metropolitan areas follows (Table 1).

    • In each of the eight metropolitan areas, the preponderance of growth between 2000 and 2010 was in the suburbs, as has been the case for decades. This has occurred even though two events – the energy price spike in mid-decade and the mortgage meltdown – were widely held to have changed this trajectory. On average, 4 percent of the growth was in the historical core municipalities, and 96 percent of the growth was in the suburbs (Figure 1).
    • In each of the eight metropolitan areas, the suburbs grew at a rate substantially greater than that of the core municipality. The core municipalities had an average growth from 2000 to 2010 of 3.2 percent. Suburban growth was 21.7 percent, nearly 7 times as great.  Overall, the number of people added to the suburbs was 14 times that added to the core municipalities.
    Table 1:
    Metropolitan Area Population: 2000-2010
    2000 Population
    Historical Core Municipality Suburbs Metropolitan Area
    Austin              656,562            593,201         1,249,763
    Baltimore              651,154         1,901,840         2,552,994
    Chicago           2,895,671         6,053,068         8,948,739
    Dallas-Fort Worth           1,188,580         3,972,964         5,161,544
    Houston           1,953,631         2,761,776         4,715,407
    Indianapolis              860,454            664,650         1,525,104
    San Antonio           1,144,646            567,057         1,711,703
    Washington              572,059         4,181,934         4,753,993
    Total           9,922,757       20,696,490       30,619,247
    2010 Population
    Austin              790,390            925,899         1,716,289
    Baltimore              620,961         2,089,528         2,710,489
    Chicago           2,695,598         6,599,081         9,294,679
    Dallas-Fort Worth           1,197,816         5,173,957         6,371,773
    Houston           2,099,451         3,846,449         5,945,900
    Indianapolis              903,393            852,848         1,756,241
    San Antonio           1,327,407            815,101         2,142,508
    Washington              601,723         4,883,034         5,484,757
    Total         10,236,739       25,185,897       35,422,636
    Change: 2000-2010
    Austin              133,828            332,698           466,526
    Baltimore              (30,193)            187,688           157,495
    Chicago             (200,073)            546,013           345,940
    Dallas-Fort Worth                 9,236         1,200,993         1,210,229
    Houston              145,820         1,084,673         1,230,493
    Indianapolis               42,939            188,198           231,137
    San Antonio              182,761            248,044           430,805
    Washington               29,664            701,100           730,764
    Total              313,982         4,489,407         4,803,389
    Percentage Change: 2000-2010
    Austin 20.4% 56.1% 37.3%
    Baltimore -4.6% 9.9% 6.2%
    Chicago -6.9% 9.0% 3.9%
    Dallas-Fort Worth 0.8% 30.2% 23.4%
    Houston 7.5% 39.3% 26.1%
    Indianapolis 5.0% 28.3% 15.2%
    San Antonio 16.0% 43.7% 25.2%
    Washington 5.2% 16.8% 15.4%
    Total 3.2% 21.7% 15.7%
    Chicago excludes Kenosha County, WI
    Washington excludes Jefferson County, WV
    Indianapolis core municipality: Indianapolis & Marion County

    Analysis of Individual Metropolitan Areas: The major metropolitan areas for which data is available are described below in order of their population size (Figure 2 and Table 1).

    Chicago:The core municipality of Chicago lost 200,000 residents between 2000 and 2010. Suburban growth was 546,000, adding up to total metropolitan area growth of 346,000 people. The suburbs accounted for 158 percent of the metropolitan area growth. The core municipality decline was stunning in the face of the much ballyhooed urban renaissance in that great city. Yet this renaissance was limited enough as to not lead to an expanding population.

    The decline in the core municipality population represents a major departure from the 2009 Bureau of the Census estimates, which would have implied a 2010 population at least 170,000 higher (assumes the growth rate of 2008 two 2009).

    Instead all of the growth was in the outer suburbs, beyond the inner suburbs of Cook County.

    Dallas-Fort Worth: The historical core municipality of Dallas had a modest population increase of 9000, or less than 1 percent between 2000 and 2010. In contrast, the suburbs experienced an increase of 1.2 million, or 30 percent. Thus, approximately 1 percent of the metropolitan area growth was in the core municipality, while 99 percent was in the suburbs, most of it in the outer suburbs. The inner suburbs added 14 percent to their 2000 population, while the outer suburbs added 36 percent.

    The population figure for the core municipality of Dallas – consistently among the strong core areas –  was surprisingly low, at 9 percent below (117,000) the expected level. The suburban population was 1 percent (71,000) below expectations.

    Houston: The historical core municipality of Houston had comparatively strong population growth, adding 146,000 and 8 percent to its 2000 population. However this figure was 8 percent, or 174,000 below the expected figure. By contrast, the suburban growth was 39 percent, more than five times that of the central jurisdiction. The suburban population growth was 1,085,000, more than six times that of the core jurisdiction. The suburban population was 4 percent or 144,000 higher than expected.

    The core jurisdiction of Houston accounted for 12 percent of the metropolitan area growth while the suburbs s accounted for 88 percent. This was evenly distributed between the inner suburbs of Harris County and the outer suburbs. The inner suburbs added 38 percent to their population while the outer suburbs added 41 percent.

    Washington:Reversing a decade’s long trend, the historical core jurisdiction of Washington (DC) had a small population gain between 2000 and 2010. But the Washington, DC gain of 30,000 pales by comparison to the suburban gain, which was more than 20 times greater, at 700,000. The core jurisdiction accounted for 4 percent of the population gain, while the suburbs accounted for 96 percent.

    More than 60 percent of the growth in the metropolitan area was outside the inner suburban jurisdictions that border Washington, DC (Arlington County and Alexandria in Virginia, together with Montgomery County and Prince George’s County in Maryland), while the inner suburbs accounted for 36 percent of the growth. The population increase in the inner suburbs was 9 percent, compared to 37 percent in the outer suburbs.

    Jefferson County in West Virginia was not included in the analysis because data is not yet available.

    Baltimore: The historical core municipality of Baltimore, the site of another ballyhooed urban comeback, lost 30,000 people, or 5 percent of its 2000 population. Baltimore’s 2010 population was 4 percent or 16,000 below the expected level. The suburbs experienced a 10 percent or 188,000 person increase.  The region’s population increase was roughly equal in numbers between the inner suburbs and the outer suburbs, although the exurban percentage increase was nearly twice as large.

    San Antonio:The historical core municipality of San Antonio experienced the largest population increase among the eight metropolitan areas, at 183,000, a roughly 16 percent population jump. The city of San Antonio accounted 43 percent of the growth while suburbs in Bexar County and further out accounted for a larger 57 percent. However, the suburban population increase was 248,000 or 44 percent. This is something of a turnaround in trends that favored the city of San Antonio in the past because of its vast sprawl and predominant share of the metropolitan population.

    The city of San Antonio population was 5 percent or 65,000 people short of the expected 2010 level. The suburban population was 15 percent more or 104,000 more than the expected level.

    Indianapolis:The historical core area of Indianapolis and Marion County (including enclaves within Indianapolis) grew 5 percent and accounted for 19 percent of the metropolitan area growth. In contrast, the surrounding suburbs grew 28 percent, representing r 81 percent of the metropolitan area growth. Overall, the core municipality added 44,000 people, while the suburbs added more than four times as many, at 188,000.

    Austin:The historical core municipality of Austin experienced the greatest growth of any core jurisdiction in the eight metropolitan areas, at 20 percent. Even so, growth in the suburban areas was nearly 3 times as high at 56 percent. The city of Austin accounted for 29 percent of the metropolitan area population growth, while the suburbs accounted for 71 percent. Overall, the central municipality grew 134,000, while the suburbs grew 2.5 times as much, at 333,000.

    Generally it is fair to say that, so far, suburban areas are growing far faster than urban cores. In addition, most of the fastest growing core municipalities are those areas that are themselves largely suburban, particularly in relatively young cities like San Antonio, Houston and Austin.
     
    Among the eight metropolitan areas analyzed, the older core jurisdictions (with median house construction dates preceding 1960) tended to either lose population or grow modestly. This is illustrated by the city of Chicago, with a median house construction date of 1945, Baltimore with a median house construction date of 1946 and Washington with a median house construction date of 1949 (Table 2). Generally, the central jurisdictions with greater suburbanization (with median house construction dates of 1960 or later) grew more quickly. For example, highly suburban central jurisdictions like Austin with a median house construction date of 1983 and San Antonio, with a median house construction date of 1970, grew fastest. So much for the long forecast, and apparently still elusive, “return to the city”.

    Table 2:
    Historical Core Municipalities: Growth & Median House Age
    Historical Core Municipality
    Growth: 2000-2010 Share of Metropolitan Growth Median House Construction Year
    Austin 20.4% 28.7% 1983
    Baltimore -4.6% -19.2% 1946
    Chicago -6.9% -57.8% 1945
    Dallas-Fort Worth 0.8% 0.8% 1974
    Houston 7.5% 11.9% 1975
    Indianapolis 5.0% 18.6% 1967
    San Antonio 16.0% 42.4% 1979
    Washington 5.2% 4.1% 1949
    Average 3.2% 3.7%

    Wendell Cox is a Visiting Professor, Conservatoire National des Arts et Metiers, Paris and the author of “War on the Dream: How Anti-Sprawl Policy Threatens the Quality of Life

  • Chicago Takes a Census Shellacking

    The Census results are out for Illinois, and it’s bad news for the city of Chicago, whose population plunged by over 200,000 people to 2,695,598, its lowest population since before 1920.  This fell far short of what would have been predicted given the 2009 estimate of 2,851,268. It’s a huge negative surprise of over 150,000, though perhaps one that should have been anticipated given the unexpectedly weak numbers for the state as a whole that were released in December.

    The American Community Survey data from last year show a clear improvement in items like college degree attainment (up 7.6 percentage points since the 2000 Census) and median household income (up 18%, which trailed the nation slightly, but beat Cook County and the state).  These data points show the very real improvements that have swept over a portion of the city, the visible gentrification that envelops the greater core area has now been shown to have been unable to power overall population growth, or to restrain the rampant exurbanization in the region.

    White and Black Flight

    The non-Hispanic White Only population of the city actually declined by 52,449, or 5.78%.  The “minority” population declined even further, -147,969 or 7.44%, meaning the city actually grew its white population share by 0.38 percentage points, perhaps indicating the early stages of the “Europeanization” of Chicago as the core gentrifies and disadvantaged groups and the white working class are pushed further to the fringe.

    Indeed, the Black Only population plunged by 177,401 as blacks increasingly moved to suburbs, especially southern ones  like Matteson, Lansing, Calumet City, Park Forest, and Richton Park, each of which added thousands of new black residents.  Some indications are that a significant number of black residents left the region altogether.  The traditional black magnet of Atlanta – which struggled through much of the decade – was a top five destination for people leaving Chicagoland over the past decade, and Chicago was the #2 source of in-migrants to Memphis, another black hub, according to IRS data.

    Hispanic population was the bright spot for Chicago, as the city added Hispanic residents to the tune of 25,218, or 3.35%.  Hispanics boosted their population share in the city by nearly 3 percentage points.  But even this growth isn’t that impressive.  The city of Indianapolis, at less than a third Chicago’s population, added over 45,000 Hispanics on a much smaller base.

    Demographic Reality: Massive Exurbanization

    Much has been made of Chicago’s legitimate and real urban core renaissance, but the cold reality remains that this is one of America’s most sprawling regions. Regional growth continued to be heavily focused not in the city or established inner suburbs, but the exurbs.  Kendall County more than doubled in population, and counties like Grundy, Boone, and Kane also made the top five in the state. Cook County, which is about half made up of the city of Chicago, as a whole actually lost population. And traditional suburban powerhouse DuPage has flattened, while Lake County, Illinois fell just short of the national average in growth. During the last decade, a net of over 25,000 people moved from metro Chicago to metro Rockford, making that city the #2 destination for those leaving Chicagoland. Given that Rockford is hardly an economic mecca, clearly exurbanization is spreading far beyond traditional metro boundaries. Sprawl of the most intense kind is alive and well in Chicagoland.

    The following map illustrates this, with a five bucket sort of 2000-2010 population percentage change, growing counties in black, shrinking in red:


    The raw data on regional growth speaks for itself:

    Core+Suburb vs. Exurb

    2000

    2010

    Total Change

    Pct Change

    Core + Established Suburb (Cook, DuPage, Lake Counties)

    6,925,258

    6,815,061

    -110,197

    -1.6%

    Exurb (Other IL Metro Chicago Counties)

    1,347,510

    1,771,548

    424,038

    31.5%

    This sprawl might be more understandable in rapidly growing cities like Atlanta and Houston that can both densify the core and grow outwards simultaneously.  But the Chicago-Joliet-Naperville-IL Metropolitan Division (the full MSA is not yet available since Wisconsin hasn’t been released yet) grew at less than half the national average. This means that the exurbanization trend in Chicagoland is almost entirely loss of population share by the core to the fringe.

    To put an even starker view on the concentration of growth in Illinois as a whole, this map highlights only those counties that grew faster than the already anemic statewide average:


    Other than a handful of counties, the group of fastest growing counties in the state is dominated by suburban and especially exurban Chicago and St. Louis counties.

    For those of us who’ve chosen to plant our flag in the city, these results are most unwelcome news, no two ways about it. This is especially true as underfunded pensions and city budget gaps loom large, and where the per capita load only goes up as the population goes down.  This report should be a call to arms to the next mayor and the city as a whole to make the promise of revitalization a reality, and bring growth and prosperity to the city as a whole, not just a the upscale core. Cities like Chicago have to become more aspirational; places of upward mobility to broad sections of the middle and working classes. The city and Cook County can’t afford another decade like this one.

    Aaron M. Renn is an independent writer on urban affairs based in the Midwest. His writings appear at The Urbanophile.

    Photo by Gravitywave

  • City of Chicago Falls to 1910 Population Level.

    The Bureau of the Census has just reported that the city of Chicago lost more than 200,000 people between 2000 and 2010. At 2,696,000, this takes Chicago to its lowest population since 1910, and nearly 1,000,000 fewer than its census population peak of 3,621,000 in 1950. In 1910, the city had a population of 2,185,000, and increased in 1920 to 2,702,000.

    The Bureau of the Census had estimated Chicago’s population at 2,851,000 in 2009, down from the 2000 census count of 2,897,000. Chicago is the seat of Cook County, which lost 180,000 between 2000 and 2010, though outside the city of Chicago, Cook County gained approximately 20,000 residents.