Surprisingly, the modern focal point for postfamilial urbanism comes from eastern Asia, where family traditionally exercised a powerful, even dominant influence over society. The shift toward post-familialism arose first in Japan, the region’s most economically and technologically advanced country. As early as the 1990s sociologist Muriel Jolivet unearthed a trend of growing hostility toward motherhood in her book Japan: The Childless Society? –a trend that stemmed in part from male reluctance to take responsibility for raising children.
The trend has only accelerated since then. By 2010 a third of Japanese women entering their 30s were single, as were roughly one in five of those entering their 40s – that is roughly eight times the percentage seen in 1960 and twice that seen in 2000. By 2030, according to sociologist Mika Toyota, almost one in three Japanese males may be unmarried by age 50.
In Japan, the direct tie between low birth rates and dense urbanization is most expressed in Tokyo, which now has a fertility rate of around one child per family, below the already depressed national average. Some of the lowest rates on earth can be seen elsewhere in eastern Asia, including those in Seoul, Singapore and Hong Kong, which are now roughly the same as the rate in Tokyo.
As more of Asia becomes highly urbanized like Japan, this kind of ultra-low fertility will spread to other parts of the continent. Most critically, this dynamic has already spread to mainland China, or at least to its larger cities, where fertility rates have dropped well below 1.0. In 2013, Shanghai’s fertility rate of 0.7 was among the lowest ever reported – well below the “one child” mandate removed in 2015 and only one-third the rate required to simply replace the current population. Beijing and Tianjin suffer similarly dismal fertility rates.
This pattern of low fertility, notes demographer Gavin Jones, suggests that rapid urbanization has already made the notion of the one-child policy antiquated. Now, even with fertility policies being loosened, many Chinese families are opting not to take advantage, largely due to the same reasons cited in other parts of the world: the high cost of living and high housing costs.
Perhaps no city better reflects Asia’s emerging urban paradigm than Seoul, the densest of the high-income world’s megacities outside of Hong Kong. The Korean capital is more than 2.5 times as crowded as Tokyo, twice as dense as London and 5 times as crowded as New York. No surprise then that self-styled urban pundits love the place, as epitomized by a glowing report in Smithsonian magazine that painted Seoul as “the city of the future.” Architects, naturally, joined the chorus. In 2010 the International Council of Societies of Industrial Design named Seoul the “world design capital.”
Ultimately, Seoul epitomizes the retro-urbanist fantasy: a city that is dense and dominating, rapidly turning the rest of the country into depopulating backwaters. Seoul has monopolized population growth in Korea, accounting for nearly 90% of total growth since 1970. Seoul also currently holds nearly 50% of the country’s population, up from 20% in 1960.
Seoul’s development has come at the expense of not just its own hinterlands but also its own humanity. Its formerly human-scaled form of housing, known as a hanok , which was one story tall and featured an interior courtyard, has been largely replaced with tall, often repetitive towers that stretch even into the suburbs. While architects and planners celebrate this shift, they rarely consider whether this form of urbanization creates a good place for people, particularly families.
When you consider the trends in similar cities, it’s unsurprising that Korean sociologists have noted the shift to high-density housing as being unsuitable for families with children.
Over time the impact of these housing policies will be profound. By 2040 Korea’s population will join those of Japan and Germany as one of the world’s oldest. This will occur despite determined government efforts to encourage childbearing, efforts that may well be doomed by the government’s similar commitment to a dense, centralized urban form.
What will happen to societies that are likely to retain extremely low rates of fertility? Japan, notes Canadian demographer Vaclav Smil, represents “an involuntary global pioneer of a new society.” Japan certainly exemplifies one way societies may evolve under diminishing birth rates.
Projecting population and fertility rates is difficult, but the trajectory for Japan is unprecedented. The UN projects Japan’s 2100 population to be 91 million, down from 2015′s 127 million, but Japan’s own National Institute of Population & Social Security Research projects a population of 48 million, nearly 50% lower than the UN’s projection.
Japan’s urban centralization both feeds and accelerates this trend. Rather than disperse, Japan’s population is “recentralizing.” A country with a great tradition of regional rivalries, home to an impressive archipelago of venerable cities, is becoming, in effect, a city-nation, with an increased concentration on just one massive urban agglomeration: Tokyo. This has, for the time being, allowed Tokyo to escape the worst of Japan’s demographic decline, drawing heavily on the countryside and smaller cities, both of which are losing population. From 2000 to 2013 the Tokyo metropolitan area added 2.4 million residents, while the rest of the nation declined by 2 million.
Tokyo is now home to almost one in three Japanese. But its growth is likely to be constrained, as the last reservoir of rural and small-city residents seems certain to dry up dramatically. A projection for the core prefecture of Tokyo indicates a 50% population cut by 2100 to a number smaller than it was at the beginning of World War II; 46% of that reduced population will be over 65.
This suggests it is time, in high-income countries at least, to shift our focus from concerns about overpopulation to a set of new and quite unique challenges presented by rapid aging and a steadily diminishing workforce. Even birth rates in developing countries are tumbling toward those of wealthy countries. As British environmental journalist Fred Pearce puts it, “the population bomb’ is being defused over the medium and long term.”
Some, like Pearce, see the Japanese model as an exemplar of a world dominated by seniors – with very slow and even negative population growth – that will be “older, wiser, greener.” Following the adolescent ferment of the 20th century, Pearce looks forward to “the age of the old” that he claims “could be the salvation of the planet.”
Yet, if the environmental benefits of a smaller, older and less consumptive population may be positive, there may be other negative ramifications of a rapidly aging society. For one thing, there will be increasingly fewer children to take care of elderly parents. This has led to a rising incidence of what the Japanese call kodokushi , or “lonely death,” among the aged, unmarried and childless. In Korea, Kyung-sook Shin’s highly praised bestseller, Please Look After Mom, which sold 2 million copies, focused on “filial guilt” in children who fail to look after their aging parents and hit a particular nerve in the highly competitive eastern Asian society that seems to be drifting from its familial roots.
Additionally, an aging population will certainly diminish demand for both goods and services and likely would not promote a vibrant entrepreneurial economy.
China will face its own version of “demographic winter,” although sometime later than Japan or the Asian Tiger states. The U.S. Census Bureau estimates that China’s population will peak in 2026 and then will age faster than any country in the world besides Japan. Its rapid urbanization, expansion of education and rising housing costs all will contribute to this trend. China’s population of children and young workers between 15 and 19 will decline 20% from 2015 to 2050, while that of the world will increase nearly 10%.
In China the consequences of the rising number of elderly will be profound. Demographer Nicholas Eberstadt, for example, sees the prospect of a fiscal crisis caused by an aging and ultimately diminishing population. China, he notes, faces “this coming tsunami of senior citizens” with a smaller workforce, greater pension obligations and generally slower economic growth.
It seems likely, as has occurred in Japan already, that rising costs associated with an aging population, and a dearth of new workers and consumers, will hamper wealth creation and income growth. Societies dominated by the old likely will become inherently backward-looking, seeking to preserve the existing wealth of seniors as opposed to creating new opportunities for the increasingly politically marginalized younger population.
The shift to an aging population also creates, particularly in Asia where urbanization is most rapid, the segregation of generations, with the elderly in rural areas and the younger people in cities. Around the world, the results of this shift are likely to resemble those seen in Japan, with cities becoming home to an ever expanding part of the population, while people in the countryside are destined to grow older and ever more isolated. It is not clear how the expanding senior population, which was traditionally cared for by younger generations, will fare with fewer children to support them and in the absence of a well-developed welfare state.
Later this century these same challenges will even be felt in many parts of the developing world. In rapidly urbanizing, relatively poor countries such as Vietnam, the fertility rate is already below replacement levels, and it is rapidly declining in other poorer countries such as Myanmar, Indonesia and even Bangladesh. In parts of Latin America, especially Brazil, fertility rates are plunging to below those seen in the United States. Brazil’s birth rate (4.3 in the late 1970s and now 1.9) has dropped not only among the professional classes but also in the countryside and among those living in the favelas. As one account reports, women in Brazil now say, “Afábrica está fechada”–the factory is closed.
Excerpted from The Human City: Urbanism for the Rest of Us, by Joel Kotkin (B2 Books, 2016)
This piece first appeared in Forbes.
Joel Kotkin is executive editor of NewGeography.com. He is the Roger Hobbs Distinguished Fellow in Urban Studies at Chapman University and executive director of the Houston-based Center for Opportunity Urbanism. His newest book, The Human City: Urbanism for the rest of us, was published in April by Agate. He is also author of The New Class Conflict, The City: A Global History, and The Next Hundred Million: America in 2050. He lives in Orange County, CA.
Photo: John Gillespie, CC License
 Photo: Zhou En Lai’s Buick, Zhou En Lai Museum, Nanjing
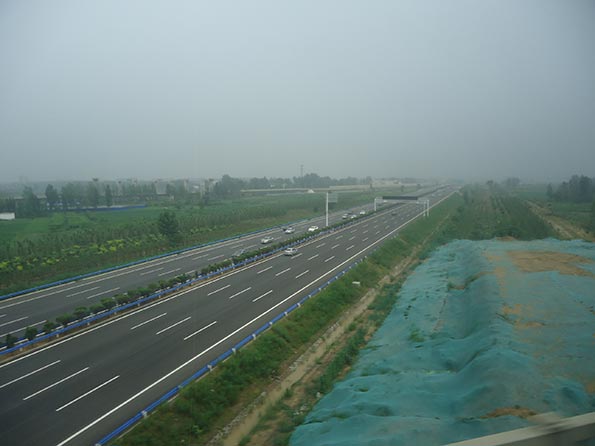 Photo: G4 Expressway between Zhengzhou, Henan and Wuhan, Hubei
 Photo: Ford F-150 (2017 model)


.jpg)
.jpg)