Tag: China

  • How A Baby Bust Will Turn Asia’s Tigers Toothless

    For the last two decades, America’s pundit class has been looking for models to correct our numerous national deficiencies. Some of the more deluded have settled on Europe, which, given its persistent low economic growth over the past 20 years and minuscule birth rates, amounts to something like looking for love in all the wrong places.

    More rational and understandable have been those who have looked for role models instead in East Asia. After all, East Asia has been the world’s ascendant power for the better part of past 30 years. It is home to both China and Japan, the world’s second and third largest economies, as well as the dynamic “tiger” economies of Korea, Taiwan, Hong Kong and Singapore.

    Thomas Friedman, long enamored by authoritarian leviathan China, recently praised the tiger countries as exemplars of forward thinking. He traces their strong emphasis on “highly effective teachers, involved parents and committed students” as keys to turning their resource-poor countries into first world successes.

    Yet for all their laudably good school test scores, these tigers could turn somewhat toothless in the future. Already Japan, which fashioned the first great Asian model, is beset by a series of massive challenges including a lack of technological competitiveness and disastrously declining demographics. They also face competition from places like China and India, behemoths which may not equal the Tigers’ spectacular per-capita education numbers, but which can marshal overwhelming numbers of ambitious, educated and skilled people.

    Many in the tiger nations recognize this competitive plight far more than their western cheerleaders. Some even wonder if they may even have been too rational and credential-obsessed for their own good. Like Japan after the Second World War, they invested heavily in educating their young people to excel on tests and work long hours . But this also fostered high levels of stress and hyper-competition that discourages both family formation and child bearing .

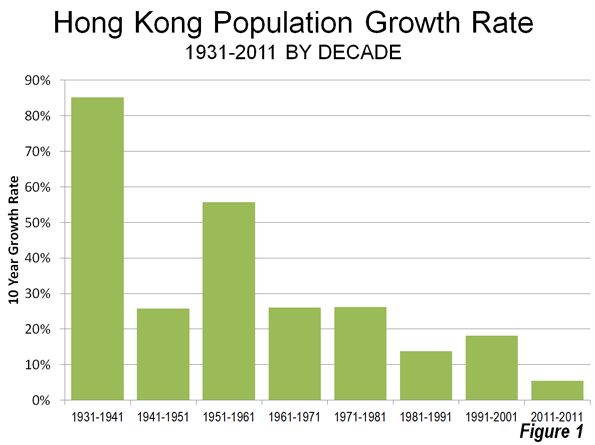
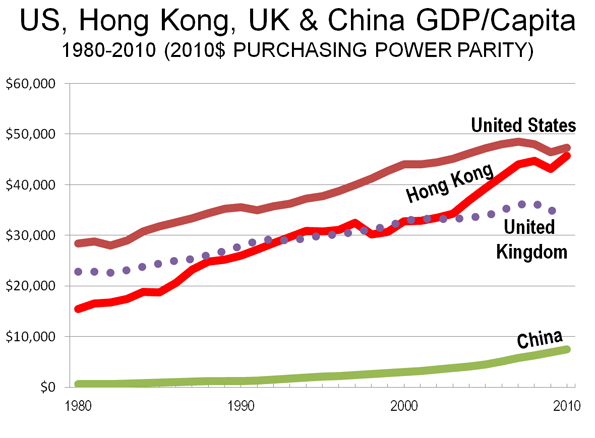
    Singapore (where I serve as Senior Visiting Fellow at the Civil Service College) is arguably the best planned and most cleverly conceived of all the Tigers. Singaporeans live well — their per-capita incomes surpass those of Americans — but this edge is largely blunted by extremely high costs. As in all the Tiger countries, consumer goods like cars are extraordinarily expensive (a modest Korean model can run upwards of $75,000 or more in Singapore) and housing costs far higher than experienced by most Americans. In Hong Kong, notes researcher Wendell Cox, an average apartment, usually quite small, costs roughly twice as much as one  in New York or San Francisco, two most elite metro U.S. markets, relative to income.

    These conditions, observes Vatsala Pant, a former Nielsen executive and long-time Singapore resident, create what amounts to an accounting-like mentality about their lives. “Singaporeans seem to be born with a calculator in their heads,” she notes. “Every decision seems to weighed in a cost and benefit analysis, including such things as family. If it’s not perfect, they don’t want it.”

    This turn from family represents a sharp break in these countries. All the “tiger” economies flourished based on a Confucian culture that places kinship at the top of the value pyramid. Parents are still widely revered, but Li Lin Chang, an associate director of the Lee Kuan Yew School of Public Policy, suggests that Singapore’s “Confucian roots may not be as evident and some may argue that it may have disappeared.”

    Certainly increasing number of Singaporeans and others from Tiger countries are opting out of marriage. In 2000, 14% of women between age 30-39 chose to remain childless, according to demographer Gavin Jones of the National University of Singapore. By 2009, this figure has gone up to 20%. Jones estimates in some east Asian societies up to a third of all women will remain childless.

    Japan, the original model for all these countries, is now leading the way off the demographic cliff. In Japan, notes researcher Mika Toyota, 20% of 50-year-old males have never married, up from 12 percent just a decade ago. By 2030, she estimates nearly 30% of 50-year-old males will have never wedded. And unlike the U.S. and Europe, very few people have children out of wedlock in East Asia, so no marriage means no children.

    This plunge in marriage and family formation is not entirely voluntary. Few of the 40 or more Singaporean younger adults I have interviewed in recent months celebrated singleness like some of their Western counterparts. Most still wanted children and linked their reluctance to wed or to have babies on the high cost of living, intense competition in their workplace and even increasingly crowded mass transit.

    “Most of my friends are not married,” one 35-year-old female civil servant told me. “They don’t want to be single but they are too busy with their work commitment. My friends are consumed by work. Money, status, prestige, climbing the ladder. You expect things to change when you get older but it doesn’t. The calculation just doesn’t work out”

    For many of these people, not having offspring makes sense in terms of concentrating on career goals and reducing financial pressure. But it could prove a social disaster in the long run. All Tiger nations now suffer fertility rates roughly half the 2.1 children per household needed to replace the current population. By 2030 these countries could have fewer people under 15 than over 60.

    Not surprisingly, many Tiger country policymakers place a priority on producing more cubs. Most offer highly generous packages of support offered to those willing to take the nativity plunge. Some who have children cope with entrenched male reluctance to share in child-raising by relying on low-cost maids, often from the Philippines and other poorer countries. A recent move by the Singapore government to require giving maids the day off elicited howls of protests from female professionals, who, as authors Teo You Yenn and Vivienne Wee put it, regard “care of one’s own offspring as tedious, beneath oneself and rightfully the responsibility of a hired woman.”

    Some professionals who desire children consider taking their finely honed skills elsewhere. A recent survey by the MRI China Group showed that a majority of professionals surveyed in Taiwan and some forty percent in Singapore, as well as roughly one-third of those in Hong Kong, were actively looking to relocate to another city. Most covet a move to less high-pressure, lower-density Australia or New Zealand. Others, particularly from Taiwan, are attracted to greater opportunities in China.

    There may not be too much the bureaucracies can do immediately to address these problems. Clearly adding more degrees per capita or bringing in more foreign expertise, as is common in Singapore and Hong Kong, has not addressed looming baby shortage. Instead, as one one young University researcher put it, “we need a new mindset.”

    Most particularly, these countries need to change the incentives that, albeit unintentionally, create unsustainable levels of singleness, childlessness and the prospect of massive, rapid aging of their societies. They may have to consider more flexible work-styles, the promotion of home based business and better use of their limited space. Individual entrepreneurship, more rooted in each country and able to meld with family life, could be stressed as a counterbalance to employment in often fickle multinational corporations who can always move to greener, or at least cheaper, locales.

    More difficult still will be shaping attitudes that restore the primacy of family that propelled these societies in the first place. This is an existential challenge that would have seemed unimaginable 40 years ago when these countries fretted about overpopulation and widespread poverty. But success in the future can not be purchased by simply continuing what has worked so well for a generation. To avoid a toothless future, the Tigers need to unlearn some of the secrets of their past success.

    This piece originally appeared in Forbes.com.

    Joel Kotkin is executive editor of NewGeography.com and is a distinguished presidential fellow in urban futures at Chapman University, and contributing editor to the City Journal in New York. He is author of The City: A Global History. His newest book is The Next Hundred Million: America in 2050, released in February, 2010.

    Singapore skyline photo by Bigstockphoto.com.

  • What Apple’s Supply Chain Says About US Manufacturing and Middle-Skill Training

    In January, The New York Times released a front-page report on the iEconomy, Apple’s vast and rapidly growing empire built on the production of tech devices almost exclusively overseas. The fascinating story created a wave of attention when it was published, and it’s back in the news after NPR’s “This American Life” retracted its story about working conditions at Foxconn, one of Apple’s key suppliers of iPhones and iPads.

    The end of the “This American Life” episode includes a discussion (audio | transcript) between host Ira Glass and Charles Duhigg, the NYT reporter who wrote the iEconomy piece, on Apple’s supply chain and the reason the tech giant doesn’t produce its insanely popular devices in the U.S. Perhaps you thought the main reason was labor costs; Apple would have to pay American workers much more than the estimated $17 a day (or less) many Chinese workers at Foxconn make. That’s part of it, but “an enormously small part,” Duhigg told Glass.

    Duhigg explained that, in terms of labor costs, producing the iPhone domestically would cost Apple an additional $10 (on the low end) to $65 (on the high end) more per phone. “Since Apple’s profits are often hundreds of dollars per phone, building domestically, in theory, would still give the company a healthy reward,” he wrote in the NYT piece.

    Instead, what matters is Apple’s intricate Chinese supply chain. Duhigg went into detail in his conversation with Glass:

    Compared to the cost of buying chips or making sure that you have a plant that can turn out thousands of these things a day or being able to get strengthened glass cut exactly right within, you know, two days of this thing being due, that’s what’s important. Labor is almost insignificant. What is really important are supply chains and flexibility of factories. You want to be able to be located right next to the plant that makes the screws so that when you need a small change to that screw factory, you can go next door and say, “Give it to me in six hours,” and they can say, “Here you go.” Because if that factory was in another state or on another continent, it would take two weeks. It’s the flexibility within the Chinese manufacturing system, that’s what you can do in Asia that you can’t do in the United States.

    Another major reason why Apple produces the iPhone and iPad abroad is the huge (and available) skilled workforce in China. When Apple needed 8,700 industrial engineers to oversee 200,000 assembly-line workers involved in making the iPhone, the firm looked at how long it would take to find that many workers in the U.S. Its answer: as long as nine months — compared to 15 days in China.

    This boils down, according to Duhigg’s report, to the lack of American workers with “mid-level skills that factories need, executives say.”

    Companies like Apple “say the challenge in setting up U.S. plants is finding a technical work force,” said Martin Schmidt, associate provost at the Massachusetts Institute of Technology. In particular, companies say they need engineers with more than high school, but not necessarily a bachelor’s degree. Americans at that skill level are hard to find, executives contend. “They’re good jobs, but the country doesn’t have enough to feed the demand,” Mr. Schmidt said.

    From Whose Bourn No Manufacturing Returns

    So, what does this mean for manufacturing in the U.S.?  For the most part there are no surprises here. These are known, core issues in the U.S. We’re well aware of the skilled worker drought. We’re aware that we’ve shipped much of our production process off-shore. But, we keep saying to ourselves, we’ve increased our productivity. We’re innovating and we’re keeping the profits, right? To answer that we can say “maybe” and “sorta.”

    There’s currently a debate raging about how we calculate our productivity. It’s a complex issue that we won’t get deep into here (check out this recent article in the Washington Post for more), but the gist is that our methodology for calculating productivity might be overstated. Like, a lot. Biases within this methodology have tended to convert a factory’s price savings through outsourcing into an increase in output. As Peter Whoriskey of the Post puts it:

    For example, suppose a U.S. factory decides to offshore the production of a part for which it used to pay $1. With the switch to an overseas supplier, it might pay 50 cents for the part. If U.S. statistics do not capture this drop in price, the savings by the U.S. factory can show up as a gain in output and productivity.

    Changes like these aren’t an increase in output due to innovation and greater productivity per worker. These are savings, which are certainly great for that factory, and certainly mean better profit margins, but which aren’t productivity increases that we get to point to as the silver-lining of our inky manufacturing cloud.

    That’s one element. The other element sits very near and dear to our heart here at EMSI. There’s a very basic theory at work in our impact studies and I/O model, and it’s that tight supply chains are good. The goal of any regional economy should be to develop complete supply chains. The less that an industry has to bring goods and services into the region from outside, the greater effects we see from increases in those industries. In other words, “Great job, China.” But this leaves the US at a disadvantage. Yes, low-cost Chinese manufacturing has facilitated growth in the US economy. However, this has happened at the expense of the US developing these complete supply chains.

    Maybe If We Ask Real Nice

    Now, this is an extremely complicated issue, and things have developed as they have for a reason. However, when we ask the question, “what would it take to manufacture iPhones in the US?” — a question tantamount to “what would it take to get all of those manufacturing jobs over here?” — if the supply chain is the deciding factor, then the answer might be something along the lines of “too late.” At this point, manufacturing supply chains are so thoroughly concentrated in China that bringing them back to US soil seems more or less impossible. There may be little we can do about manufacturing jobs leaving the US.

    The Data

    However, instead of simply offering some sound — albeit pessimistic — reasoning on the issue, let’s look at some data on manufacturing. Since jobs are in the spotlight, and productivity measures have received some heat, we’ll simplify the issue a little and just look at job growth in manufacturing.

    In terms of industry performance, 74 manufacturing industries saw growth from 2001-2006; 65 saw growth from 2006-2009; and 210 saw growth from 2009-2011. This is, of course, growth of any amount. This indicates a slight, recent uptick in the variety of industries experiencing some amount of growth.

    Typically, we look at net growth for industries. We combine growth and decline to show the overall growth and decline. Here’s net decline for manufacturing for three different periods:

    Net Change Average Annual Net
    2001-2006
    -2,211,513
    -368,586
    2006-2009
    -2,193,021
    -548,255
    2009-2011
    -99,250
    -33,083

    Job loss seems to slow in that 2009-2011 period.

    We’ll look at one more series of data, before we wrap up. What if we look at decline and growth separately instead of simply the net of both? This will allow us a discrete view of whether decline has slowed or growth has quickened, or perhaps a combination of both.

    First, decline:

    Decline Average Annual Decline
    2001-2006
    -2,481,385
    -413,564
    2006-2009
    -2,321,862
    -580,466
    2009-2011
    -300,690
    -100,230

    Manufacturing decline considered on its own appears to have slowed in the past few years.

    Now, growth:

    Growth Average Annual Growth
    2001-2006
    269,872
    44,979
    2006-2009
    128,841
    32,210
    2009-2011
    201,440
    67,147

    Gain in the manufacturing sector seems to have picked up pretty noticeably.

    This analysis is not nuanced. As other sources have made plain, this is a complex issue. However, it remains true here that job growth in manufacturing has picked up somewhat, and that decline has slowed. We’re still seeing net losses, so this isn’t evidence of recovery. However, it does mean that not absolutely every manufacturing job is moving offshore. At least not yet.

    Not to mention that there’s some support for the idea that we’re seeing some “reshoring” — manufacturing jobs coming back to the US. A recent report from The Boston Consulting Group claims that by the end of the decade we could see a reshoring of 600,000 to 1 million jobs. The report explores the seven broad industry sectors “most likely to reach a ‘tipping point’ over the next five years—a point at which China’s shrinking cost advantage should prompt companies to rethink where they produce certain goods meant for sale in North America.” Are we seeing the beginnings of this in our more recent industry data? Or do we stand to lose more manufacturing jobs to China? We’ll have to wait and see.

    Stevenson has worked at EMSI, an Idaho-based economics firm, since 2006. He’s a regular contributor to the EMSI blog. Contact him at josh@economicmodeling.com.

  • The Evolving Urban Form: Hong Kong

    Hong Kong has experienced its slowest decadal growth in at least 70 years, according to the results of the recently released 2011 census. Between 2001 and 2011, Hong Kong added only 5.4 percent to its population, a decline of more than two-thirds from its 1991-2001 rate. Hong Kong’s slowest growth rate since 1921-1931 was between 1981 and 1991, when 13.8 percent was added to its population. In previous decades growth had been much greater (Figure 1).

    Further, despite Hong Kong’s much larger population base today, the numeric growth from 2001 to 2011 was also the smallest since the 1921-1931 decade. Hong Kong added 363,000 residents for a total of 7,072,000 in 2011. The increase is barely one-third of the 1,034,000 residents added between 1991 and 2001. Much of Hong Kong’s population growth in the last 60 years had been driven by its better standard of living relative to mainland China. It seems likely that the growing prosperity of the past decade on the mainland has made Hong Kong less attractive for migrants.

    High Income World’s Most Dense Urban Area: Hong Kong continues to be the densest major urban area in the high-income world. The present density is estimated at 67,000 per square mile (26,000 per square kilometer). At least one small area of Hong Kong has a population density exceeding 1 million per square mile (400,000 per square kilometer), though the much more dense Kowloon Walled City (estimated at up to 5,000,000 per square mile or 2,000,000 per square kilometer) was demolished in the 1990s. Even so, there are now detached housing developments, as Hong Kongers who can afford it choose these much more expensive accommodations, as Witold Rybczynski relates in a recent commentary (detached housing photo).

    Detached Housing

    Subdivisions of Hong Kong: The Hong Kong Special Administrative Region (HKSAR) is a unified government, with no local jurisdictions (such as cities or towns).  However, there are four broad regions and within each there are districts, are designated for statistical purposes.

    Hong Kong’s growth — like that of most major metropolitan areas — has been shifting to the periphery for decades (Table 1). Between 1981 and 2011, all of the population growth was in the New Territories, the new (greenfield and high density) suburban areas beyond the Hong Kong Island-Kowloon core. While all of Hong Kong was adding 2.1 million residents in total between 1981 and 2011, the New Territories added 2.4 million (Table 2). This suburban dominance continued in the last census period, with 96 percent of growth in the New Territories. Before that, the bulk of the growth was in the outer areas of Kowloon, which were then the suburbs (Figure 2).

    Table 1
    Hong Kong Population by District: 1911-2011
    Year Total Hong Kong Kowloon New Territories Marine
    1911 456,700 244,300 69,400 81,200 61,800
    1921 625,200 347,400 123,400 83,200 71,200
    1931 840,500 409,200 263,000 98,200 70,100
    1941 1,600,000 Estimate: No complete census
    1951 2,013,000 Estimate: Census cancelled
    1961 3,129,600 1,004,900 1,578,000 409,900 136,800
    1971 3,936,600 996,200 2,194,800 665,700 79,900
    1981 4,986,600 1,183,600 2,449,100 1,304,100 49,700
    1991 5,674,100 1,251,000 2,030,700 2,374,800 17,600
    2001 6,708,400 1,335,500 2,024,000 3,343,000 5,900
    2011 7,071,600 1,270,900 2,108,400 3,691,100 1,200
    Sources:
    Government of Hong Kong
    www.cicred.org/Eng/Publications/pdf/c-c21.pdf
    Table 2
    Hong Kong Population by District: 1991-2011
    Region & District Population: 1991 Population: 2001 Population: 2011 % 2001-2011 Land Area KM2 Land Area MI2 Density KM2 Density MI2
    HONG KONG 5,674,114 6,708,389 7,071,576 5.4% 1,098 424 6,440 16,680
    HONG KONG ISLAND 1,250,993 1,335,469 1,270,876 -4.8% 80 31 15,827 40,991
      Central and Western 253,383 261,884 251,519 -4.0% 13 5 20,089 52,031
      Wan Chai 180,309 167,146 152,608 -8.7% 10 4 15,230 39,447
      Eastern 560,200 616,199 588,094 -4.6% 19 7 31,265 80,976
      Southern 257,101 290,240 278,655 -4.0% 39 15 7,154 18,529
    KOWLOON 2,030,683 2,023,979 2,108,419 4.2% 47 18 45,138 116,909
      Yau Tsim Mong 282,060 282,020 307,878 9.2% 7 3 44,946 116,409
      Sham Shui Po 380,615 353,550 380,855 7.7% 9 4 40,175 104,052
      Kowloon City 402,934 381,352 377,351 -1.0% 10 4 37,849 98,028
      Wong Tai Sin 386,572 444,630 420,183 -5.5% 9 4 44,891 116,268
      Kwun Tong 578,502 562,427 622,152 10.6% 11 4 56,303 145,826
    NEW TERRITORIES 2,374,818 3,343,046 3,691,093 10.4% 971 375 3,801 9,845
      Kwai Tsing 440,807 477,092 511,167 7.1% 22 8 23,427 60,675
      Tsuen Wan 271,576 275,527 304,637 10.6% 61 23 5,019 12,999
      Tuen Mun 380,683 488,831 487,546 -0.3% 84 33 5,773 14,953
      Yuen Long 229,724 449,070 578,529 28.8% 138 53 4,179 10,824
      North 165,666 298,657 304,134 1.8% 137 53 2,215 5,737
      Tai Po 202,117 310,879 296,853 -4.5% 147 57 2,014 5,215
      Sha Tin 506,368 628,634 630,273 0.3% 69 27 9,074 23,501
      Sai Kung 130,418 327,689 436,627 33.2% 136 53 3,201 8,291
      Islands 47,459 86,667 141,327 63.1% 175 68 807 2,091
    MARINE 17,620 5,895 1,188 -79.8% 0 0 0 0
    Data from Government of Hong Kong Special Administrative Region


    The Core: Hong Kong Island: Hong Kong Island, home to one of the world’s most dense central business districts (Central, Western and Wan Chai districts) lost 4.8 percent of its population. All five of the districts on Hong Kong Island lost population, with Wan Chi (of "The World of Suzy Wong" movie fame) suffering the greatest loss, at 8.7 percent).

    The Core: Kowloon: Across Hong Kong harbor (see Star Ferry photograph, top), Kowloon, also a part of the core, gained 4.2 percent, adding nearly 75,000 residents (photo). Even so, Kowloon’s population remains more than 10 percent below its 1981 population. Three of Kowloon’s  five districts gained population, including Yau Sim Mong and Sham Shui Po, which along with the north shore districts of Hong Kong Island are the most intensely developed in the HKSAR.

    Suburban: The New Territories: The New Territories added 10.4 percent to their population (348,000), with seven of the nine districts gaining. The largest gain (63 percent) was in the Islands district, which includes Hong Kong International Airport. Sia Kung, also grew strongly, at 33 percent (see photo). Sia Kung, like nearly built-out Sha-Tin, is conveniently located just over a narrow mountain range from Kowloon and contains considerable amounts of greenfield land for development.

    Kowloon

    Sia Kung

    Yuen Long, home of the new Shenzhen Bridge had the third highest growth rate, at 29 percent. The Islands, Sia Kung and Yuen Long all have all experienced much improved access from extensions to the Mass Transit Railway (MTR) and the former Kowloon-Canton Railway (KCR), which have now merged into the MTR.

    Transportation in Hong Kong: Hong Kong is the most transit dependent major metropolitan area in the high-income world. Mass transit carries 72 percent of motorized trips. Even with the high residential and employment density, the average work trip is approximately five miles each way. Moreover, despite having one of the most effective mass transit systems in the world and extraordinarily high densities, the average one-way work trip travel time is 46 minutes, 18 minutes longer than Los Angeles or Houston. With the highest transit market share in the world and an automobile market share only 1/70th that of Houston, Hong Kong’s density still  produces among the highest levels of traffic congestion in the world — 1.5 times the traffic density of Los Angeles and three times that of Houston (photo).

    Hong Kong Traffic Congestion

    Economic Growth: Hong Kong has experienced strong economic growth for  the last three decades. In 1981, Hong Kong’s gross domestic product (GDP) per capita was one-third below that of the United Kingdom, its then colonial master. Even by this time, Chinese leader Deng Xiao Ping had been so impressed by Hong Kong’s market based economic advance, that he had designated adjacent Shenzhen as a special economic zone. That area has since grown from a fishing village to a population exceeding 10 million, according to the 2010 census. In the intervening years, the Pearl River Delta has emerged as the most populous extent of urbanization in the world, stretching from Hong Kong, through Shenzhen, Dongguan, Guangzhou, Jiangmen, Zhongshan and Zhuhai to Macao. However, because of border controls and the low level of commuting, these remain separate metropolitan areas and  urban areas.

    Hong Kong’s economic growth continued strongly in the middle 1990s, when its GDP per capita exceeded that of the United Kingdom. Hong Kong fell behind in the late 1990s Asian economic crisis, but soon recovered. By 2010, Hong Kong’s GDP per capita had risen to 27 percent above that of the United Kingdom.

    Hong Kong’s economic performance relative to the United States may be even more impressive. In 1980, Hong Kong’s GDP per capital trailed that of the United States by 45 percent. As of 2010, Hong Kong trailed the US by only three percent and according to International Monetary Fund data should pass the United States early in the present decade. Between 2000 and 2010, Hong Kong’s per capita GDP (PPP-2010$) rose more than one-third — only South Korea and Singapore did better among high-income areas, according to International Monetary Fund data. China’s percentage growth rate was  nearly five times Hong Kong’s but in actual dollars Hong Kong’s GDP per capita rose at triple China’s rate. However, should China’s economy slow down, as some analysts suggest, it could be difficult for Hong Kong to sustain this strong growth rate (Figure 3).

    The People’s Republic of China has maintained Hong Kong’s free market economic system, helping assure strong growth. It seems unlikely that either Deng Xiao Ping or Margaret Thatcher imagined that such economic progress would be made when they signed the historic agreement to restore Hong Kong to China in 1984. Nor is it likely they imagined China’s meteoric rise.

    Unique Hong Kong: Hong Kong is the living model of compact development and transit dependence toward which urban planning wisdom strives. However, Hong Kong itself is the outlier of outliers. Hong Kong’s population density — double that of any other high-income world urban area of similar size or larger — would never have approached this level if it had not been separated from China itself by colonization and then the historical complexities of the post-World War II period. Even in its prosperity, the growing urban areas of mainland China are being built at densities averaging no more than one-quarter that of Hong Kong. Hong Kong may be more an accident of history than an exemplar.

    Wendell Cox is a Visiting Professor, Conservatoire National des Arts et Metiers, Paris and the author of “War on the Dream: How Anti-Sprawl Policy Threatens the Quality of Life

    —-

    Photo: Star Ferry, operating between Hong Kong Island (Central) and Kowloon (Yau Tsim Mong). All photos by author.

    Hong Kong district map by Wikipedia user Moddlyg.

  • China’s Expanding Motorways

    In some ways, it has been an "annus horribilis" for transport in China (Note). There was the tragic high-speed rail accident in Wenzhou (Zhejiang), the fastest trains were slowed, construction was slowed or, in some cases stopped, and a top railway official was removed for misappropriation of at least a billion Yuan (more than $150 million).

    However, China’s freeway (motorway) system has achieved a milestone even Deng Xiaoping might have dreamed. In 2011, The Beijing Review reports that China’s intercity freeway system became the longest in the world, longer that of the United States, which had been the undisputed leader for at least 50 years.

    China added 11,000 kilometers (7,000 miles) of freeway (grade separated and dual carriage expressway) to its national interstate expressway system (National Trunk Highway System) in 2011. With a length of 85,000 kilometers (53,000 miles), China’s intercity freeway system exceeds that of the US interstate highway system by 10,000 kilometers (6,000 miles). At the end of 2008, the US interstate highway system was 75,000 miles long.

    China has built 83,000 kilometers (52,000 miles) of interstate freeway in just 11 years. Much of the US interstate construction was completed over a period of 25 years, from 1956 to the early 1980s.

    It is unclear whether the total length of freeways in China is greater than that in the United States. In China, many urban freeways are not included in the National Trunk Highway System. There are also non-interstate freeways in the United States.  Complete data on these roadways is not available.

    —–

    Note: This characterization of a "horrible year" was made famous by Queen Elizabeth II in a major speech in 1992.

    See also: China Expressway System to Exceed US Interstates, January 21, 2011.

  • The Evolving Urban Form: Guangzhou-Foshan

    The Pearl River Delta of China is home to the largest extent of continuous urbanization in the world. The Pearl River Delta has 55 million people in the jurisdictions of Hong Kong, Shenzhen, Dongguan, Guangzhou, Foshan, Zhongshan, Jiangmen, Zhuhai and Macau. Moreover, the urban population is confined to barely 10 percent of the land area. These urban areas are the largest export engine of China and reflect the successful legacy of Deng Xiaoping’s reforms which had their start with the special economic zone in Shenzhen and spread to the rest of the Delta and then much of the nation.

    Adjacent Metropolitan Areas: However, the Pearl River Delta today is not a metropolitan area, as is often asserted. Instead it is rather a collection of adjacent metropolitan areas or labor markets (Figure 1). Metropolitan areas are not created by a large number of people living close to one another. Metropolitan areas are labor markets, crudely delineating the geography of the jobs-housing balance. There is little commuting between the Pearl River jurisdictions. Moreover, as labor markets, metropolitan areas cannot be international unless there is virtual free movement of labor (Note). In the case of Hong Kong and Macau, commuting between the neighboring jurisdictions of Shenzhen and Zhuhai requires crossing the equivalent of an international border.


    Integrating Guangzhou and Foshan: Transportation integration has already come to two of the jurisdictions, Guangzhou and Foshan. The adjacent prefectures (confusingly interpreted into English as "cities") are now linked by a subway and unlike the other Pearl River Delta jurisdictions, the continuous urbanization does not narrow at the border (Figure 1). There are even proposals to merge the adjacent prefectures.

    Guangzhou and Foshan are separated by a tributary of the Pearl River, with a number of bridges that provide similar crossing capacity as exists in cross-river metropolitan areas like Portland (Willamette River), Cincinnati (Ohio River) and St. Louis (Mississippi River).

    Guangzhou itself is the capital of Guangdong, the largest province of China, with approximately 105 million people. Guangdong is the third largest state or province (sub-national jurisdiction) in the world, trailing the states of Uttar Pradesh (contains the eastern suburbs of Delhi) and Maharashtra (capital Mumbai) in India.

    Guangzhou is larger than Foshan. It is better known to many Westerners as Canton, and for many years served as China’s “window” on the west. Even in China, the alternative name is still used, for example in the annual Canton Fair, one of the largest trade fairs in the world.

    Canton was also a principal flashpoint of 19th century hostilities between the British and Chinese. The First Opium War (1839-42) began at Canton and led to the cession of Hong Kong to Great Britain and the establishment of British treaty ports at Fuzhou, Xiamen, Ningbo, Shanghai and Canton (Guangzhou). After the Second Opium War (1856-60), other treat ports were established and France, the United States, Russia, Germany, Japan and others gained similar rights to the British from a weakened Chinese government.

    In 2010, the metropolitan area county and district level jurisdictions of Guangzhou-Foshan had 18.3 million people. This is an increase of 4.4 million from 2000 and 11.6 million from 1982. This is surely a rapid rate of growth, but Shanghai and Beijing grew even faster over the last decade, each adding more than 6 million people.

    Distribution of Population Growth: In contrast to Shanghai and Beijing, where virtually all of the growth has been outside the core, the Guangzhou-Foshan core is growing robustly. From 2000 to 2010, the core districts increased from a population of 4,040,000 to 5,050,000. With a land area of 107 square miles (279 square kilometers), the core is similar in size to the city (municipality) of Sacramento, which has less than one-tenth the population. The core density is 46,800 per square mile (18,100 per square kilometer), up from 37,500 per square mile (14,500 per square kilometer) in 2000. This is about one-third less dense than Manhattan or the ville de Paris (the central city).

    However, as is typical for metropolitan areas around the world, Guangzhou-Foshan’s growth has been most concentrated in suburban areas. The core accounted for 23% of the population growth over the past decade, while the suburbs accounted for 77%.

    The inner suburbs grew from a population of 6,670,000 to 8,400,000. The density rose from 5,000 to 6,300 per square mile (1,900 to 2,500 per square kilometer), similar to that of the San Francisco urban area. The inner suburbs accounted for 39% of the growth and grew 26%.

    The outer suburbs grew from a population of 3,150,000 to 8,200,000 over the past decade. The population density rose from 2,000 to 3,100 per square mile (800 to 1,200 per square kilometer), slightly more dense than the Philadelphia urban area and slightly less dense than the Portland urban area. The outer suburbs accounted for 38% of the growth and grew at the greatest rate, 53% (Figures 2 & 3, Table).


    Guangzhou-Foshan Metropolitan Area & Urban Area
    2000 & 2010 Census
    Metropolitan Area Core Inner Suburbs Outer Suburbs Total
    2000         4,040,000        6,670,000            3,150,000         13,860,000
    2010         5,050,000        8,400,000            4,820,000         18,270,000
    Change         1,010,000        1,730,000            1,670,000           4,410,000
    % 25% 26% 53% 32%
    Share of Growth 23% 39% 38% 100%
    Area (KM2)                   279               3,429                   4,003                  7,711
    Area (Square Miles)                   108               1,324                   1,546                  2,977
    Density (KM2)              18,100               2,400                   1,200                  2,400
    Density (Square Miles)              46,800               6,300                   3,100                  6,100
    Urban Area  Core   Suburbs   Total 
    2010         5,050,000          11,225,000         16,275,000
    Area (KM2)                   279                   2,894                  3,173
    Area (Square Miles)                   108                   1,117                  1,225
    Density (KM2)              18,100                   3,900                  5,100
    Density (Square Miles)              46,800                 10,000                13,300
    Notes
    Boundary changes render district area data incomplete.
    Core: Yuexiu, Liwan, Haizhu, Tianhe 
    Inner Suburbs: Baiyun, Huangpu, Panyu, Nansha, Nanhai, Changcheng
    Outer Suburbs: Huadu, Luogang, Gaoming, Shunde, Shanshi 
    Nansha is in the inner suburbs because 2000 data is combined with Panyu (should be in the outer suburbs)

    Earlier data shows this suburban pattern has been a long term trend.  Between 1982 and 2010, the suburbs accounted for 57% of the growth outside the city of Guangzhou as then defined (Figure 4). District boundary changes limit a more precise analysis based upon a core that did not include large areas without development.

    The Guangzhou-Foshan Urban Area: The soon to be released 8th Annual Demographia World Urban Areas will show the Guangzhou urban area (area of continuous development within the metropolitan area) to have a population of approximately 16.275 million, with a land area of approximately 1,225 square miles (3,173 square kilometers). Barring later data from the multiple national censuses that will soon be reporting data, Guangzhou-Foshan is likely to be ranked the 14th largest urban area in the world. The population density is approximately 13,300 per square mile (5,100 per square kilometer), roughly comparable to the London or Barcelona urban areas. The suburbs of the urban area have a density of approximately 10,000 per square mile (3,900 per square kilometer). Most of the new residential development is multi-unit, such as high rise condominium buildings and work related housing, including dormitories. However, there is some detached housing, which is very expensive.

    A Larger Metropolitan Area: In the longer run a much larger metropolitan (and urban) area could result, if Chinese residents begin traveling to work over much longer distances between these jurisdictions and should the border restrictions at Hong Kong and Macau be eliminated. To achieve this end, there will need to be important local transportation improvements between the jurisdictions, such as more urban railways (which are planned) and wider automobile ownership, to use the already comprehensive (toll) freeway system.

    Wendell Cox is a Visiting Professor, Conservatoire National des Arts et Metiers, Paris and the author of “War on the Dream: How Anti-Sprawl Policy Threatens the Quality of Life

    ——

    Note: International metropolitan areas can now exist in the European Union, where there is free movement of labor across national borders. For example, the Lille metropolitan area is located in both France and Belgium. France and Switzerland (not a member of the European Union) provide another example, where treaty provisions permit international movement of labor with little difficulty in the resulting international metropolitan areas of Geneva (Switzerland-France) and Basel (Switzerland-France).

    Photo (top): Pagoda: Temple of the Six Banyan Trees, Guangzhou (all photos by author)

  • This Is America’s Moment, If Washington Doesn’t Blow It

    The vast majority of Americans believe the country is heading in the wrong direction, and, according to a 2011 Pew Survey, close to a majority feel that China has already surpassed the U.S. as an economic power.

    These views echo those of the punditry, right and left, who see the U.S. on the road to inevitable decline.  Yet the reality is quite different. A confluence of largely unnoticed economic, demographic and political trends has put the U.S. in a far more favorable position than its rivals. Rather than the end of preeminence, America may well be entering  a renaissance.

    Just survey the globe. The European Union’s prolonged crisis will likely end in further decline. Aging Japan has long passed its prime, its market share receding in everything from autos to high tech.  China’s impressive economic juggernaut has slowed down, and the Middle Kingdom faces increased social instability, environmental degradation and a creaky one-party dictatorship.

    While the U.S. has its challenges, it is positioned to achieve a more solid long-term   trajectory than its European and Asian rivals. What it lacks, however, is a strong political leadership capable of seizing this opportunity.

    Resources

    Energy constitutes the biggest ace in the hole for the U.S. For almost half a century, an enormous fossil fuel bill that still accounts for 40% of the nation’s trade deficit has hampered economic growth. Now that situation is changing rapidly.

    Due to vast new finds and improved technology to exploit them, the U.S. is now the world’s largest producer of natural gas and could emerge as the leading oil producer by 2017. Reserves of natural gas — a clean-burning fuel — are estimated at 100 years supply and could generate more than 1.5 million new jobs over the next two decades.

    The U.S. agricultural sector is also booming, with exports reaching a record $135.5 billion in 2011. With global demand increasing, sustained growth  will continue across America’s fertile agricultural regions.

    Manufacturing

    The other big game changer is manufacturing. As President Barack Obama recently acknowledged, this is America’s “moment” to seize the industrial initiative. U.S. manufacturers have expanded their payrolls for two straight years, and they have increased production while Japan, Germany, China and Brazil have scaled back.

    A recent survey of manufacturing CEOs revealed that 85% believed production could shift soon from overseas. Both foreign and domestic manufacturers are alarmed about rising wages and labor unrest in China. Some important Japanese, German and Korean companies also have concerns about China’s policies that favor local firms and abscond with investor’s technology.

    Foreign Investment

    Rising foreign investment reflects the new American competitiveness. Since 2008 foreign direct investment to Germany, France, Japan and Korea has stagnated; in 2009 overall investment in the E.U. dropped 36%.

    In contrast, in 2010 foreign investment in the U.S. rose 49%, mostly coming from Canada, Europe, and Japan. Industrial investment rose $30 billion just between 2009 and 2010, while investment in the energy sector more than tripled to $20 billion.

    The Information Sector

    In the information sector, American domination continues to mount, contrary to predictions of decline over the past two decades. Although high-tech manufacturing has shifted largely to Asia, Americans rule the increasingly strategic software sector.   American-based companies, who constitute more than two-thirds of the world’s 500 largest software companies, including  nine of the top ten.

    Outside the U.S., there are no significant equivalents of Apple, Google, Microsoft, Amazon and Facebook. Hollywood, for its part, rules the entertainment world, producing 40% of world’s audiovisual exports, a dominion that troubles China’s President Hu Jintao, who recently complained  that the “cultural fields” represent “the focal area” for Western “infiltration”.

    Demographics

    The Great Recessionhas slowed population growth everywhere, but the U.S. maintains the   youngest and most vibrant demographic profile of any advanced country. Between 1980 and 2010, the U.S population expanded by 75 million to over 300 million. In contrast many European countries, including Germany, have suffered stagnant growth, while in Russia and Japan populations have already started declining.

    The disastrous fiscal implications of slow or negative population growth are evident in Greece, Spain and Italy, all of which suffer among the world’s lowest fertility rates. Rapid aging also will soon catch up with Germany. By 2030, Germany will have 48 retirees for every 100 workers — that’s barely two workers per retiree. The numbers are even worse in Japan: 53 retirees for every 100 workers by 2030.

    Political Factors

    Given the ineptitude of the last two administrations, enthusiasm about America’s political system is hard to justify. But our constitutional systems of laws and checks on central power remain a critical advantage. Immigration has declined with the recession, but the U.S. can expect to welcome religious and political exiles — such as Middle Eastern Christians displaced by   the “Arab Spring” — as well as Greeks and Irish fleeing Europe’s economic decline.

    Many from Russia and China are seeking to immigrate to the United States, Canada or Australia in order to protect property or just live a freer life. Indeed, among the 20,000 Chinese with incomes over 100 million Yuan ($15 million), 27% have already emigrated and another 47% have said they were considering it, according to a report by China Merchants Bank and U.S. consultants Bain & Co. published in April.

    Needed from Washington: A New American Strategy

    Sadly no leading politician or political party seems ready to   embrace the country’s new strategic advantages.  Many on the left may find the very notion distasteful, having    swallowed declinism with their academic mother’s milk. The president himself dislikes the notion of American “exceptionalism.” Many key Obama backers like SEIU boss Andy Stern and former auto czar Steven Rattner, embrace the superiority of China’s authoritarian system. Others embrace Europe and even Japan as models for an aging superpower.

    Worse still: Some Obama policies work against the well springs of national resurgence.   Threats to raise income taxes on families making over $250,000 directly threatens the aspiring entrepreneurial class more than the real “rich” whose fortunes are protected by low capital gains taxes and family trusts. Most critical: The administration’s hostility to fossil fuel represents a direct threat to the country’s greatest new source of advantage and threatens to strangle America’s recovery in its infancy.

    Not that the Republicans are any less clueless. Many reject the infrastructure needed by an expanding economy — ports, roads, bridges as well as worker training and support for basic research — as mere “pork.” Budget restraint and fiscal discipline are important, but preparing the country for more rapid economic growth requires an active, supportive government.

    Republicans also tend to view immigration as something akin to a hostile invasion. Yet many key industries — notably manufacturing and high tech — rely heavily on immigrant entrepreneurship, intelligence and work values. Running against immigration constitutes an assault on the nation’s increasingly diverse demographics.

    So this is where we now sit.  With all the essential elements for a strong, sustained recovery place, the big question is whether we will find political leaders capable of tapping this country’s phenomenal potential.

    This piece originally appeared at Forbes.com.

    Joel Kotkin is executive editor of NewGeography.com and is a distinguished presidential fellow in urban futures at Chapman University, and contributing editor to the City Journal in New York. He is author of The City: A Global History. His newest book is The Next Hundred Million: America in 2050, released in February, 2010.

    Photo from BigStockPhoto.com.

  • The U.S. Needs to Look Inward to Solve Its Economy

    Over the past months as the global economy heads for another recession, U.S. lawmakers have done their best to deflect blame by focusing on various external forces including the most popular straw-man of the day: China’s currency.

    Almost every year for the last few years, Congress and the White House have pressed China to revalue its currency, the renminbi. And every time this happens, China responds that it will do what it always does: let it appreciate gradually, at about 5% per year as it has done for the last several years.

    With the APEC Summit in Honolulu last month, Obama and the White House strategically — and perhaps with an eye to the coming re-election campaign —prodded at China and also managed to further deflect America’s problems by focusing attention on the Eurozone Crisis. Timothy Geithner, tailoring his speech for the Asia-Pacific audience, said Europe needs to “move quickly as instability hurts the U.S. and Asia.”

    Geithner, the godfather of “too big to fail” from his days at the New York Fed, is an expert at delivering economic policy speeches that do not address America’s problems head-on. He is the mouthpiece of American weakness and misdirection, and has been recently seen so not only in China, but in Europe where people scoff, understandably, at the very idea of his giving advice to the bedraggled Eurozone.

    The fact is that, right now, the US cannot dictate the conditions of economic gain. Although still the world’s largest economy by far, the US can no longer impose its mantra of ‘free-trade’ on the rest of the world.  Instead it needs to take an honest look at the reality of the 21st Century global marketplace to better assess what it can do to improve its situation. The following suggestions might be a good start:

    Forget About Economic and Political Ideologies

    Many Americans, including politicians, are under the impression that certain ‘isms’ are magic bullets for prosperity while other ‘isms’ hold prosperity back. For instance, conservatives like to use the talking point that ‘socialism’ will destroy America. Similarly, many of those on the left protest against as what they see as ‘capitalism’ leading to widening inequality. Being for or against a particular ‘ism’ does nothing to improve the economic situation but only serves to inflame rhetoric and kill policies that could potentially help the U.S. economy.

    One example is domestic government investment. Conservatives detest any kind of public spending proposal as ‘socialism’, even if public funds would be used for practical things like improving roads or public schools. On the other side, those on the left confuse high-level collusion between the financial sector and federal government with free-enterprise, which it is not.  Geitner is not a capitalist, but a collusionist. He is no more a free-market capitalist than he is a Maoist.

    Stop Blaming China

    Nothing else debunks the validity of mainstream political and economic ideologies better than China’s rise to economic prominence. Still considered a ‘communist’ state by Cold-War minded individuals, China’s development would be best described as a gradual evolution in policy decisions rather than a static, ideologically-based approach. To be sure, the Communist Party desire to stay in power remains paramount. But this leads to policies designed to keep the economic engine humming as a way to maximize social stability.

    Despite its advances, China still has tremendous obstacles to overcome including a still very low per-capita GDP and an environment polluted from industrial development. Yet it is the height of hypocrisy for the U.S. government to call out China on its currency manipulation and intellectual property theft when U.S. companies have benefited enormously from China’s opening up of the past three decades. This also has allowed U.S. consumers buy coveted products at low prices.

    Of course, politicians at the Federal level (and even some Republican Presidential candidates) talk tough on China to score brownie points with voters. But meanwhile local state and city governments as well as prominent business leaders continue to send delegations to China in droves to promote cooperation and trade. Yes, China’s competitive cost of labor and lack of regulations has had a direct impact on the loss of jobs in the U.S. Unfortunately forcing China to float its currency will not reverse this trend as manufacturing jobs move to lower cost locales, and will continue to do so, perhaps to other countries.

    Acknowledge That Not All Regulation Is Created Equally

    Conservatives love to point the blame for economic malaise on government regulation. This argument is only half correct. For one thing there is not enough regulation on large banks in terms of how they divert investments when huge recent profits can be traced largely to fiscal largesse from Washington. Large banks received huge stimulus injections from the Federal Reserve during QE I and II, but did not invest enough of that money into the domestic economy. Instead, investment banks were free to take that money wherever maximum returns were to be had. That’s fine for an investor who has made his own way, but when the bank profits have stemmed from taxpayer largesse, some other priorities should creep in.

    At the state and local municipal levels, regulation is perhaps the greatest roadblock to restoring economic prosperity. Crippling state and local taxes, along with outdated zoning regulations – such as restrictions on something as simple as running a business from one’s own home – slow enterprise formation. This is not to mention the cost of obtaining permits from various authorities and the constant threat of lawsuits. Clearly the pendulum – at least in some states such as California – has swung too far in the wrong direction. Unfortunately, given ubiquitous budget shortfalls across state and local levels, it is unlikely that local governments will be willing to decrease taxes and fees when they are in desperate need of revenue generation.

    Reassess the American Social Contract

    Conservatives balk at any mention of social programs, yet they fail to acknowledge that American corporate institutions no longer play the role they once did in promoting social stability. Across the board, businesses are understandably cutting retirement and healthcare benefits just in order to survive. America’s broken social contract is perhaps the greatest obstacle to restoring prosperity and economic growth.

    Politicians are under the impression that high-taxes and runaway government spending are the primary cause for economic malaise. The reality is that America’s economy lags because individual spending is paralyzed due to increased costs of living across the board. The costs of housing, healthcare, and higher education have all increased in the past 10 years while wages and job opportunities have stagnated. This paralyzes risk-taking and investment in new businesses. Not only that, the presence of large oligopolies in everything from high-tech and cellular phones to food processing work to reduce competition from  entrepreneurial upstarts.

    Conclusion

    The U.S. needs to stop looking at external factors as the source of its problems. Instead, American leaders should look inwards and take an honest assessment of the current problems resulting from the changes in the world over the past 20 years.

    Unfortunately, no one on either side of the political aisle seems willing to step forward and lead the country out of its predicament. The Republican presidential contenders continue to waste time bickering about irrelevant social issues while President Obama jet sets around the world trying to allay doubts about the country’s decline.

    America needs a concrete plan to get up and running again. This will mean more regulation at the macro level and less regulation at the lower levels. It will mean that Americans need to be confident that basic needs like housing and healthcare are taken care of so they can get on with starting businesses and creating employment. Education needs to promote trade skills and remove the stigma that expensive college degrees are mandatory for future prosperity.

    Until these things happen, the U.S. economy will be stuck in its rut.

    Adam Nathaniel Mayer is an American architectural design professional currently living in China. In addition to his job designing buildings he writes the China Urban Development Blog.

    Photo courtesy of Bigstockphoto.com

    .

  • New Geography’s Most Popular Stories of 2011

    As our third full calendar year at New Geography comes to a close, here’s a look at the ten most popular stories in 2011. It’s been another year of steady growth in readership and reach for the site.  Thanks for reading and happy new year.

    10.  The Other China: Life on the Streets, A Photo Essay Argentinean architect and photographer Nicolas Marino offers a set of stunning photographs from the streets of Chengdu and Shanghai.

    9.  Six Adults and One Child in China Emma Chen and Wendell Cox outline the rising numbers of elderly and increasing age dependency ratios in China and across the globe.  Chen and Cox outline a number of solutions, including “extending work and careers into the 70s; means tested benefits; greater incentives for having children; and measures to keep housing more affordable and family friendly,” but conclude “the ultimate issue will be maintaining economic growth.”

    8.  The Texas Story is Real Aaron Renn takes a look at a number of broad-based economic measures of Texas over the past decade. He finds that “While every statistic isn’t a winner for Texas, most of them are, notably on the jobs front. And if nothing else, it does not appear that Texas purchased job growth at the expense of job quality, at least not at the aggregate level.”

    7.  Let’s Face it High Speed Rail is Dead and Obama’s High Speed Rail Obsession Aaron Renn and Joel Kotkin look at high speed rail in America from two angles, Renn from the practical and Kotkin from the political.  According to Renn: “In short, it’s time to stop pretending we are going to get a massive nationwide HSR rail network any time soon.  Advocates should instead focus on building a serious system in a demonstration corridor that can built credibility for American high speed rail, then built incrementally from there.” Kotkin’s piece also appeared at Forbes.com.

    6.  America’s Biggest Brain Magnets Joel Kotkin and Wendell Cox use American Community Survey data to estimate the biggest gainers of bachelor’s degree holders in U.S. regions.  The big winners:  New Orleans, Raleigh, Austin, Nashville, and Kansas City. This piece also appeared at Forbes.com.

    5.  The Next Boom Towns in the U.S. Joel Kotkin examines the U.S. regions most primed for future growth, based on my analysis of six forward-looking metrics.  “People create economies and they tend to vote with their feet when they choose to locate their families as well as their businesses.  This will prove   more decisive in shaping future growth than the hip imagery and big city-oriented PR flackery that dominate media coverage of America’s changing regions.” The piece also appeared at Forbes.com.

    4.  The Decline and Fall of the French Language Gary Girod wonders if the French language is declining in worldwide significance.

    3.  Census 2010 Offers a Portrait of America in Transition Aaron Renn’s summary of this spring’s new Census 2010 results includes eight county and metropolitan area level maps showing population change and shifts in racial group concentrations.

    2.  The Golden State is Crumbling In this piece, also appearing at The Daily Beast, Joel Kotkin blames California’s stagnancy on self-imposed policy decisions.  While the state has many assets and is rich in promise “the state will never return until the success of the current crop of puerile billionaires can be extended to enrich the wider citizenry. Until the current regime is toppled, California’s decline—in moral as well as economic terms—will continue, to the consternation of those of us who embraced it as our home for so many years.”

    1.  Best Cities for Jobs 2011 Our best cities rankings measure one thing: job growth.  This purposefully simple approach leaves out other less tangible measures of such as quality of life or other amenity indicators, leaving you with a tool to use creating policy for your region.

  • The Evolving Urban Form: Quanzhou

    Quanzhou? Quanzhou (pronounced "CHWEN-JOE"), despite its urban population that is approaching 5 million this urban area is so unfamiliar to Westerners and the rest of the world as to require an introduction. Quanzhou is a prefecture ("shi") in China’s Fujian province. Fujian is just to the north of Guangdong, home of Guangzhou, Shenzhen and Hong Kong’s former province (before the British) and just to the south of Zhejiang, the large rich province at the south flank of the Yangtze Delta (which abuts Shanghai). Quanzhou is also adjacent to Xiamen, one of the original special economic zones established by the legendary reformer Deng Xiao Ping.

    Quanzhou has more than 8 million people in an area similar in size to that of Los Angeles County (4,400 square miles or 11,200 square kilometers). Continuous urbanization spreads through 8 of Quanzhou’s 11 political subdivisions.  

    In Situ Urbanization: Quanzhou has experienced an unusual urban development pattern. Yu Zhu, Xinhua Qi, Huaiyou Shao and Kaijing He at Fujian Normal University have documented an "in situ" urbanization (or urbanization in place, rather than by expansion from a core) that involves conversion of rural areas in place to urban areas, with agricultural employment being replaced by non-agricultural employment. A similar process has been identified in the Indian state of Kerala and some other prefectures in south China. These could be the first natural examples that defy the expansion of urban areas from a core to the periphery that has been the rule since human kind gathered in settlements.

    Quanzhou: The Ultimate: Quanzhou appears to be the most extensive case of in situ urbanization in the world. The older multistoried and single family detached farm houses have become integrated into an urban fabric, though many are falling victim to demolition. Like the economic dynamos of Shenzhen, Dongguan and Guangzhou in Guangdong to the south, Quanzhou has become a major manufacturing center for exports and urbanization is intensifying.

    A Low Density Urban Area for China: The result of in situ urbanization has been a very low density urban area by Chinese standards- something more akin to what some Western planners decry as “sprawl”. Currently, the continuous urbanization of Quanzhou covers an area of more than 500 square miles (1,300 square kilometers) with an estimated population of more than 4.5 million people. At more than 9000 persons per square mile (3,500 per square kilometer), Quanzhou is a quarter more dense than Los Angeles, similar in density to Paris but slightly more than half as dense as Shanghai. Even at its   core, Quanzhou has comparatively low density compared to other Chinese urban areas. For example, the highest density local jurisdiction (Licheng) has a population density similar to that of the city of San Francisco (approximately 18,000 per square mile or 7000 per square kilometer). The three central jurisdictions of Shanghai are 8 times as dense.

    This low density pattern does not extend to nearby urban areas. For example, the core areas of Fuzhou, (Fujian’s capital), just 100 miles up the 8-lane freeway are four times as dense as the core of Quanzhou and the urban area more than double the density.

    Balanced Population Growth: Because it is urbanizing in place, Quanzhou’s population density is increasing throughout the large urban divisions. There is plenty of vacant land throughout the urban area for development, while redevelopment is also taking place at the usually hectic Chinese pace.

    The historic core jurisdictions of Licheng and Fengze grew approximately 30% between the 2000 and 2010 censuses. The largest nearby urban jurisdictions, Jin Jiang and Shi Shi combined for a population increase of approximately 34%, while the outer metropolitan jurisdictions grew only 3%. The outer jurisdictions have far more rural land and are less attractive to residents since low automobile ownership makes them less accessible (see table). There was a population loss of 6 percent in the rural jurisdictions, which is typical for China, as people move for better lives to the urban areas.

    Quanzhou (Fujian) Population Trend by Sector
    Sector 2000 2010 Change % Change
    Jurisdictions with Substantial Urbanization
    Historic Core: Licheng & Fengze      690,000      898,000    208,000 30%
    Near Urban (Jin Jiang & Shi Shi)   1,978,000   2,660,000    682,000 34%
    Outer Urban & Exurban   2,785,000   2,864,000      79,000 3%
    Balance of Prefecture (Principally Rural)   1,830,000   1,719,000  (111,000) -6%
    Total   7,283,000   8,141,000    858,000 12%
    Note: Urban extent estimated at over 4.5 million in 2010

    A Multi-Centric Urban Area: As would be expected in such a low density urban area, Quanzhou is multi-centered, following the pattern of urban areas like Los Angeles, Houston, and Mexico City. The largest center is the historic core, which is divided between Licheng and Fengze (Photograph: Historic core). This core is genuinely historic, with the Kaiyuan Temple (Buddhist) complex dating from 686 AD. Two similar towers (one shown above) were built during the Song Dynasty.


    Historic Core

    But the historic core has substantial modern development. There is extensive new residential high rise and mid-rise development on an island in the Jin river, which is the southern border of Fengze, just north of Jin Jiang. The new high speed rail station is located far from this core and more remote than the major airport, which is located in Jin Jiang.

    There is another strong center in Shi Shi, which is 12 miles (20 kilometers) southeast of the historic core. Shi Shi has a large stock of medium rise buildings and has a small, though dense core (Photograph: Shi Shi core). There are also a number of large residential developments under construction in Shi Shi and major parts of the old core are under redevelopment.


    Shi Shi Core

    Jin Jiang is the largest of the jurisdictions in the metropolitan area, with nearly one quarter of the population. It is located just across the Jin River from Fengze. Jin Jiang also has a commercial core (Photograph: Jin Jiang core), though it is less concentrated than the historic core and the core of Shi Shi. Jin Jiang is also home to the airport serving Quanzhou. New, large multi-building high-rise residential development are under construction in many areas of Jin Jiang.


    Jin Jiang Core

    Vanishing Old China: Quanzhou may be the best place to see remnants of China’s urbanization that preceded the rise of places like Shanghai, Beijing, Wuhan and Chengdu. All three of the largest urban jurisdictions are modern, but each has areas with the dusty roads one would expect to see in a lower income nation. At the same time, Quanzhou is on its way to becoming one of the large, prosperous urban areas of China. Already its gross domestic product and the population of its urban extent exceeds that of Fuzhou, the provincial capital. Most typical throughout urban Quanzhou are the multiple building high rise residential developments typical of all large Chinese urban areas. At the same time, there are wide expanses of demolition, where the remnants of the older buildings remain, as sites are readied for more modern projects.

    Replicability? The process of in situ urbanization requires very high rural densities that can equal or exceed the 1000 per square mile or 400 per square kilometer standard used to delineate urban areas by census authorities in Canada, France, the United Kingdom, the United States and some other nations. There would simply be too much space between villages and houses in the rural areas of places like Kansas, Saskatchewan or the Ukraine. As a result, it situ urbanization is likely to remain the rare exception. However, if the world, especially Europe, were to follow the integrative urban-rural model suggested by Thomas Sieverts at the University of Darmstadt (Cities without Cities), something like in situ urbanization would be the result.

    Lead Photo:
    Zenguo Tower at Kaiyuan Temple, Licheng district of Quanzhou (all photos by author)

    See the attached file for 100 more photos of the region.

    Wendell Cox is a Visiting Professor, Conservatoire National des Arts et Metiers, Paris and the author of “War on the Dream: How Anti-Sprawl Policy Threatens the Quality of Life

  • The New World Order: A Report on the World’s Emerging Spheres of Influence

    This is the introduction to a new report, "The New World Order" authored by Joel Kotkin in partnership with the Legatum Institute. Read the full report and view the maps at the project website.

    The fall of the Soviet Union nearly a quarter of a century ago forced geographers and policy makes to rip up their maps. No longer divided into “west” and “east”, the world order lost many of its longtime certainties.

    In our attempt to look at the emerging world order, we have followed the great Arab historian Ibn Khaldun’s notion that ethnic and cultural ties are more important than geographic patterns or levels of economic development. In history, shared values have been critical to the rise of spheres of influence across the world. Those that have projected power broadly – the Greek, Roman, Arab, Chinese, Mongol and British empires – shared intense ties of kinship and common cultural origins. As Ibn Khaldun observed: “Only tribes held together by a group feeling can survive in a desert.”

    Of course, much has been written about the rising class of largely cosmopolitan “neo nomads”, who traipse from one global capital to another. But, for the most part, these people largely serve more powerful interests based on what we may call tribal groupings: the Indian sphere of influence, the Sinosphere and the Anglosphere.

    Our approach departs from the conventional wisdom developed after the Cold War. At that time it was widely assumed that, as military power gave way to economic influence and regional alliances, the world would evolve into broad geographic groups. A classic example was presented in Jacques Attali’s Millennium: Winners and Losers in the Coming World Order. Attali, a longtime advisor to French President Francois Mitterrand, envisioned the world divided into three main blocs: a European one centered around France and Germany, a Japan-dominated Asian zone, and a weaker United States-dominated North America.

    Time has not been kind to this vision, which was adopted by groups like the Trilateral Commission. The European Union proved less united and much weaker economically and politically than Attali and his ilk might have hoped. The notion of Japan, now rapidly aging and in a twodecades long slump, at the head of Asia, seems frankly risible. Although also suffering from the recession, North America over the past quarter century has done better in terms of growth and technology development, and has more vibrant demographics than either the EU or Japan.

    More recently, attention has turned to the rise of the so-called BRIC countries – Brazil, Russia, India and China. Yet it turns out that these countries have even less in common than the squabbling members of the European Union. For one thing, they represent opposing political systems. Brazil and India are chaotic but entrenched democracies, for example; Russia and especially China remain authoritarian, one-party dictatorships.

    These economies also are not particularly intertwined. Brazil is a major food exporter; Russia’s economy revolves around energy and minerals; China dominates in manufacturing; and India is vaulting ahead based largely on services. Brazil’s leading export markets, for example, are the United States and Argentina; Russia and China constituted together take barely 8 percent of the country’s exports. China’s largest trading partners by far are the United States, Hong Kong, Taiwan, South Korea and Japan. India ranks only ninth and Brazil tenth.

    More important still, no common “tribal” link, as expressed by a shared history, language, or culture unites these countries and peoples. This link is fundamental to any powerful and long-lasting power grouping.

    In contrast, the Indian and Chinese spheres, for example, are united by deep-seated commonalities: food, language, historical legacy and national culture. A Taiwanese technologist who works in Chengdu while tapping his network across east Asia, America, and Europe does so largely as a Chinese; an Indian trader in Hong Kong does business with others of his “tribe” in Africa, Great Britain and the former Soviet Republics in east Asia. Beyond national borders, these spheres extend from their home countries to a host of global cities, such as Hong Kong, Singapore, London, New York, Dubai, San Francisco, and Los Angeles, where they have established significant colonies.

    The prospects for the last great global grouping, the Anglosphere, are far stronger than many expect. Born out of the British Empire, and then the late 20th Century, the Anglosphere may be losing its claim to global hegemony, but it remains the first among the world’s ethnic networks in terms of everything from language and global culture to technology. More than the Indian Sphere and Sinosphere, the Anglosphere has shown a remarkable ability to incorporate other cultures and people.

    In the future, we will see the rise of other networks, as well. An example would be the Vietnamese sphere of influence, which reflects both the rise of that particular Asian country, and the influence of its scattered diaspora across the world. Culture is key to understanding the Vietnamese sphere: the country’s history includes long periods of Chinese domination that made it resistant to being absorbed into the Sinosphere. Instead, as we argue, Vietnam is likely to be more closely allied, first and foremost, with the United States and its allies.

    Finally, our maps deal with basic demographic issues that will dominate the future. We trace the global rise of women to prominence in business, education and politics. Although Western nations still lead in female empowerment, we argue that the most significant changes are taking place in developing countries, notably in Latin America. It will be these women – in Sao Paolo, Mumbai, and Maseru – who increasingly will shape the future female influence on the world.

    Yet this positive development also contains the seed of dangers. Female empowerment, along with urbanization, has had a depressing effect on fertility rates, seen first in the highly developed countries, and now increasingly in developing ones. Looking out to 2030, many countries, including the United States and China, will be facing massive problems posed by too many seniors and not enough working age people.

    As has always been the case, the emerging world order will face its own crises in the future, with, no doubt, unexpected, unpredictable results. But our bet is solidly on the three spheres of influence which constitute the bulk of this report.

    For the full report, visit The New World Order website at the Legatum Institute.

    Report authors:

    Joel Kotkin is executive editor of NewGeography.com and is a distinguished presidential fellow in urban futures at Chapman University, and an adjunct fellow of the Legatum Institute in London. He is author of The City: A Global History. His newest book is The Next Hundred Million: America in 2050, released in February, 2010.

    Sim Hee Juat is currently a research associate with the Centre for Governance and Leadership at the Civil Service College of Singapore.

    Shashi Parulekar is an engineer by training. He holds a master’s in finance and an M.B.A. He has worked as a high-tech marketer in Asia for several decades.

    Jane Le Skaife is a doctoral candidate in the Department of Sociology at the University of California, Davis. She is currently conducting her dissertation research involving a cross-national comparison of Vietnamese refugees in France and the United States.

    Wendell Cox is a consultant specialising in demographics and urban issues, principal of Demographia and a visiting professor at the Conservatoire National des Arts et Metiers in Paris.

    Emma Chen is a senior strategist at the Centre for Strategic Futures, Singapore. The views expressed within this article are solely her own. Publication does not constitute an endorsement by the Centre for Strategic Futures, Singapore.

    Zina Klapper is Deputy Editor of www.newgeography.com. A Los Angeles-based writer/editor/consultant with a background in journalism, she works in multiple aspects of report presentation. The maps were prepared by Ali Modarres, Professor of Urban Geography at California State University, Los Angeles.

    We also owe a debt to our largely volunteer research staff, headed by Zina Klapper, Editor and Director of Research. This includes Gary Girod and Kirsten Moore from Chapman University, to whom we owe a special debt for directed study focused on the maps. We also wish to thank Sheela Bonghir from California State University at Northridge; Malcolm Yiong and Jasmin Lau at the Centre for Strategic Futures, Singapore, and Chor Pharn Lee at the Ministry of Trade and Industry and researcher Erika Ozuna, based in Dallas, Texas. Special thanks to Nathan Gamester at Legatum Institute in London for helping put this project together and seeing it to fruition.