Tag: cities

  • Zhengzhou Ghost City Alive!

    Zhengzhou, Henan, China (March 28, 2011): In December, London’s Daily Mail reported that the Zhengzhou New Area was China’s largest “Ghost City.” A visit to the Zhengzhou New Area indicates exactly the opposite. Chinese “Ghost Cities” are large areas of new development that are virtually unoccupied. The most famous example is Ordos, a new and reportedly empty city, built to replace an older city in Inner Mongolia.

    Zhenghou is an urban area of approximately 2.5 million population and is the capital of Henan province. The Zhengzhou New Area is located in the northeastern quadrant of Zhengzhou. It is circular in design, with two parallel roads, high-rise condominium buildings on the inner ring and commercial buildings on the outer ring. The interior of the circle includes the Henan Arts Center and a skyscraper that is under construction. A new high speed rail station is under construction to serve the new Guangzhou to Beijing line. The station is to be one of the largest in Asia.

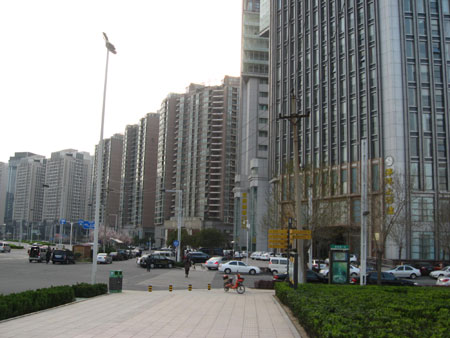
    Our visit revealed anything but a Ghost City. Granted, no-one would mistake the traffic for Beijing Third Ring Road volumes, but virtually all of the parking spaces were taken and there was traffic on the streets (Figure 1). That ultimate indicator of Chinese urbanization, the availability of frequent taxicab service was well in evidence. Two of the city’s bus rapid transit lines serve the interior circle road, again indicating a substantial threshold of non-ghost urbanization.

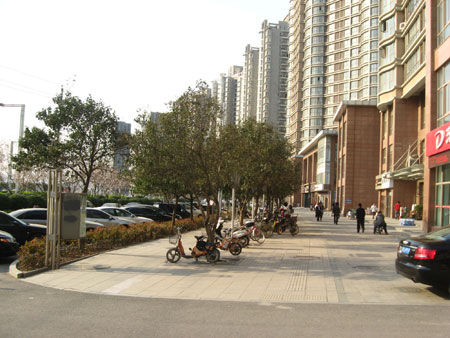
    There were people on the sidewalks, though not the numbers typical of an older, more dense section of a Chinese urban area (Figure 2). It was clear from the laundry hanging in glass enclosed patios that many of the condominiums were occupied, though it is to be expected that many would not be, given the Chinese propensity to invest in multiple residential properties (a tendency the central government seeks to curb). Many of the commercial skyscrapers were occupied, and some were still under construction. There are also shopping centers, small stores and fast food restaurants.

    Zhengzhou New Area is intended by the developers to become the new central business district for Zhengzhou. There is much more planned than this first phase. Eventually, the Zhengzhou New Area is intended to cover 105 square kilometers (41 square miles), generally further to the northeast. City maps already show the planned street pattern, not unlike 19th century maps of some US cities.

    In short, the Zhengzhou New Area is alive and not a Ghost City. It may well be that it took longer than expected for the place to come alive. But it is clear that the life of the Zhengzhou New Area began more than four months ago.

  • Major Metropolitan Areas: Summary of the First 20

    Data is now available for 20 of the nation’s 52 metropolitan areas with more than 1,000,000 population. The early results indicate a pattern of accelerating dispersion of the population to the suburbs as is indicated in the table below. Thus far, historic core municipality growth has been approximately one-half the 1990s rate. During the 2000s, the historic cores have accounted for 8.8 percent of metropolitan growth, down nearly one-half from the 1990s rate.

    Summary of 2010 Census Results
    Major Metropolitan Areas (Over 1,000,000 Population)
    Historical Core Municipalities
    Suburbs
    Metropolitan Areas
    2000-2010
    Population Gain 682,000 7,047,000 7,729,000
    Percentage Increase 6.7% 23.7% 17.7%
    Share of Growth 8.8% 91.2% 100.0%
    1990-2000
    Population Gain 1,229,000 6,718,000 7,948,000
    Percentage Increase 10.8% 30.5% 23.7%
    Share of Growth 15.5% 84.5% 100.0%
    Includes 20 of 52 metropolitan areas released by 3-3-2010

  • New Metro GDP Data Released

    The Bureau of Economic Analysis yesterday released the 2009 data for metropolitan area GDP. Their headline, “Economic Decline Widespread in 2009,” should come as a surprise to no one.

    The BEA focuses on the year on year change. I’d rather look at the full span of the data that’s available, which is now 2001-2009. Here’s a look at percent change in total real metro area GDP during that time period:

    And here are the top ten metro areas over one million in population on this metric:

    Row Metro 2001 2009 Pct Change
    1 Portland-Vancouver-Hillsboro, OR-WA 81,505 114,028 39.90%
    2 Oklahoma City, OK 43,835 59,532 35.81%
    3 Austin-Round Rock-San Marcos, TX 55,466 75,136 35.46%
    4 Las Vegas-Paradise, NV 63,730 82,255 29.07%
    5 Orlando-Kissimmee-Sanford, FL 71,940 91,400 27.05%
    6 Phoenix-Mesa-Glendale, AZ 138,780 174,617 25.82%
    7 Washington-Arlington-Alexandria, DC-VA-MD-WV 294,656 368,793 25.16%
    8 San Jose-Sunnyvale-Santa Clara, CA 117,447 146,448 24.69%
    9 Salt Lake City, UT 48,157 59,603 23.77%
    10 San Diego-Carlsbad-San Marcos, CA 126,875 155,850 22.84%

    Per capita tells is a little bit different story. Here’s a map of US metro areas for percent change in real GDP per capita:

    The stunning collapse in real per capita GDP and also the erosion in per capita personal income relative to the nation is one of the key reasons I see Atlanta as a region with far more troubles than is generally assumed.

    Here are the top ten large metros again:

    Row Metro 2001 2009 Pct Change
    1 Portland-Vancouver-Hillsboro, OR-WA 41,256 50,863 23.29%
    2 Oklahoma City, OK 39,573 48,507 22.58%
    3 San Jose-Sunnyvale-Santa Clara, CA 67,299 79,604 18.28%
    4 San Diego-Carlsbad-San Marcos, CA 44,252 51,035 15.33%
    5 San Francisco-Oakland-Fremont, CA 63,260 72,259 14.23%
    6 Los Angeles-Long Beach-Santa Ana, CA 46,147 52,158 13.03%
    7 Washington-Arlington-Alexandria, DC-VA-MD-WV 59,801 67,344 12.61%
    8 Virginia Beach-Norfolk-Newport News, VA-NC 37,960 42,521 12.02%
    9 Buffalo-Niagara Falls, NY 31,160 34,472 10.63%
    10 New Orleans-Metairie-Kenner, LA 49,100 53,835 9.64%

    All I can say is, this data looks great for Portland. That city isn’t perfect to be sure, but on the GDP side of the house, the plan is working beautifully. Contrary to slacker stereotypes, high value work is increasingly being produced there.

    Aaron M. Renn is an independent writer on urban affairs based in the Midwest. His writings appear at The Urbanophile.

  • Segregation and Quality of Life

    CensusScope’s dissimilarity index measures the distributions of blacks and whites across a city to quantify the level of integration and segregation. The site discerned three major Midwestern cities in the top ten: Detroit, MI in second; Milwaukee, WI in third; and Chicago, IL in fifth. These cities are major hubs for their region, both socially and economically. But does segregation affect quality of life? And does it help or hinder job growth?

    In order to get a decent comparison between these segregated cities and their quality of life, it’s necessary to take into account three cities with relatively low segregation: Minneapolis at 107; Austin, TX at 179; and Madison, WI at 213.

    To estimate quality of life, let’s look at three factors from the American Community Survey, 2009: Percentage of population with a Bachelor’s degree of higher; percentage of population considered unemployed; and percentage of families below the poverty level. Comparing the different values with their respective city produces an interesting result.


    Chicago

    Detroit

    Milwaukee

    Austin

    Madison

    Minneapolis

    % Bachelor’s +

    33.3

    26.2

    30.9

    38.4

    40.3

    37.5

    % Unemployed

    8.5

    12.4

    7

    6.3

    5

    6.3

    % Below Poverty

    9.1

    11.1

    9.1

    5.8

    5

    5.8

    Source: U.S. Census American Communtiy Survey

    The cities with the most segregated neighborhoods tend to have a less-educated base, contain a higher amount of unemployed workforce, and also have more families below the poverty level. On the other hand, Madison, Minneapolis, and Austin all boast high levels of educational attainment, relatively low unemployment rates, and a smaller percentage of families living below the poverty level, although Austin comes close.

    However, Madison and Austin are relatively smaller than the other areas listed here, and have prospering tech sectors and contain well-known universities that tend to dominate the city’s economy. With respect to this, segregation may not be a factor at all. Instead, the city’s development and more tech-oriented economies may be the answer.

    From these results, one may be able to cite segregation as an obstruction to a strong quality of life. One variable that seems to stick out amongst the data is that of educational attainment. Does education reduce segregation, or does segregation impede education?>

  • Vancouver: Moving to the Suburbs

    A few weeks ago, The New York Times touted purported savings that a household would save by living in the core city of New York (in Brooklyn) instead of the suburbs (South Orange, New Jersey). The article downplayed the 1,000 fewer square feet the money bought in Brooklyn and did not consider the 40% higher cost of living.

    The Province in Vancouver has now followed with a near identical story, except that the urban household in will make do with even less space. The city of Vancouver household will live in 800 square feet, or 1,200 fewer square feet in the high rise condominium than in a suburban Coquitlam detached house used in the comparison. Like The Times, The Province is little concerned with the smaller size of the house and misses the fact that the cost of living is from 10% to 20% less in the suburbs and exurbs than it is in the city of Vancouver.

    Nonetheless, according to Tsur Somerville, director of the University of British Columbia UBC Centre for Urban Economics and Real Estate, who assisted in developing the figures for The Province, “If all they cared about were the dollars, they wanted to have $600,000 worth of real estate and then minimize their out-of-pocket costs, all else being considered, then being in the city is better,” A commenter appropriately notes the volatility of strata (condominium association) fees, which suggests that out-of-pocket costs could rise significantly.

    Canadians are not listening to “their betters” any more than Americans. US Census data indicates a continuing strong migration of people from the central cities and strong migration to the suburbs, despite heroic efforts on the part of the media and others to mask the reality.

    “Being in the city” may be preferable to some in the Vancouver area, however not to the majority of the age group (25 to 44 years) most likely to move is voting for the suburbs, according to a recent Statistics Canada report. According to the report:

    “… there continues to be a migration of many young adults and families from central municipalities to surrounding municipalities, while few move in the opposite direction.”

    For every one person who moved from the suburbs to the city of Vancouver between 2001 and 2006 (in the age group):

    • Among all in the age group, 1.8 people moved to the suburbs from the city for every person moving to city from the suburbs.
    • Among those in the age group with advanced degrees, 1.7 people moved to the suburbs for every person moving to the city.
    • Among those earning $100,000 to $150,000, 3.4 people moved to the suburbs for every person moving to the city. The ratio fell to 2.0 times for those making over $150,000.
    • More than 25% of the age group population who had their first children between 2001 and 2006 moved to the suburbs from the city, more than five times as many as moved to the city from the suburbs.

    A table in the Statistics Canada report shows people in “creative class” occupations moving in greater numbers to the suburbs than to the city.

    However, not everyone is moving in larger numbers to the suburbs.

    • More of the lowest income people are moving to the city than to the suburbs.
    • Artists have moved in greater numbers to the city than to the suburbs.
    • University professors and other university personnel have moved in greater numbers to the city than to the suburbs, perhaps explaining why so many in these groups misunderstand the direction of the migration.

    The Statistics Canada report provided a similar analysis for Canada’s two larger metropolitan areas, Toronto and Montreal. In Toronto, moves to the suburbs were 3.5 times moves to the city, while in Montreal 2.7 central city dwellers moved to the suburbs for every suburbanite moving to the city. This does not, however, necessarily indicate that the exodus to the suburbs is stronger in Toronto and Montreal. It is rather an indication of the fact that these two central cities represent a larger share of their metropolitan population than Vancouver. This means that more of the core out-migration is captured in Toronto and Montreal.

    So, the media continues the “drumbeat” and the people keep marching — in the opposite direction.

  • Surprise, Frisco and Beaumont Among Fastest Growing

    The Bureau of the Census has updated its city (municipality or local government area) population estimates for 2009. Predictably, anti-suburban interests saw more indication of the elusive (read non-existent) exodus from the suburbs to the central cities. One analyst even suggested that a “high quality” of life in one central city (Washington, DC) might have kept people from moving to the suburbs. In fact, since 2000, nearly 40,000 people (domestic migrants) have moved out of the city of Washington and in the last year, the city gained 4,500 residents while the suburbs gained 13,700.

    In contrast, Buffalo News reporter Jack Ray looked at the data and noted that some cities in that metropolitan area were growing rather quickly, while others were losing population. Generally, he found that outer suburban communities were growing more quickly. Ray’s analysis was reflective of trends around the nation.

    There are nearly 20,000 incorporated cities, towns and villages in the United States. Population trends in these cities show that urban areas are growing most strongly on their suburban fringes or even in their exurbs. For example, two-thirds of the fastest growing 100 municipalities in the nation were suburbs or exurbs in the nation’s major metropolitan areas (those with more than 1,000,000 population). The other third were all municipalities in smaller metropolitan areas or outside metropolitan areas.

    The extent of this growth on the edge is illustrated by an examination of the nation’s municipalities of 25,000 or greater population that grew more than 25% between 2000 and 2009.

    • Among the 89 municipalities that grew 50% or more, 59 were in major metropolitan areas and all were suburbs (nearly all near the urban fringe) or exurbs. The total population growth among these suburbs and exurbs was 2.2 million from 2000 to 2009, for an average growth rate of 91%. These major metropolitan suburbs and exurbs grew 1.8 million, while the municipalities outside the major metropolitan areas added 400,000.
    • Among the 119 municipalities that grew between 25% and 50%, 69 were in major metropolitan areas. This included 67 suburbs and exurbs. It also included 2 central cities, Raleigh (39%) and Atlanta (28%). These major metropolitan area suburbs and exurbs gained 1.7 million residents, while the two central cities gained a total of 200,000. The municipalities outside the major metropolitan areas grew 1,000,000.

    Combined, the fastest growing suburbs and exurbs with more than 25,000 population grew more than 3.5 million, while the municipalities outside the major metropolitan areas grew 1.5 million, for a combined growth of more than 5.0 million. The smaller high growth municipalities (under 25,000), nearly 1,200 of them, both major metropolitan and outside, grew another 2.5 million.

    The fastest growing municipalities, excluding the two central cities of Raleigh and Atlanta, accounted for nearly one-third of the nation’s growth between 2000 and 20009.

    Most of the fast growing suburbs and exurbs have names that are simply not recognizable. Yet, a half-dozen added nearly as many or more new residents than all of the 20-plus central cities combined in the major metropolitan areas that do not have large swaths of suburbanization inside their borders. These include such places as Phoenix suburb, Surprise, Dallas-Fort Worth suburb Frisco and Riverside-San Bernardino suburb Beaumont.

    In Crabgrass Frontier: The Suburbanization of the United States, Kenneth Jackson noted that central Philadelphia began losing population in the early 19th century. The dispersion of America continues.

    Photograph: Exurbs of New York: Pike County, Pennsylvania

  • Let’s Not Fool Ourselves on Urban Growth

    There has been a lot written lately about the return to the city. I’ve noted myself how places like central Indianapolis have reversed decades of population declines. That’s exciting. And the New York Times, for example, just trumpeted how “smart growth is taking hold” in America.

    But let’s not kid ourselves here. In my view this represents a possible inflection point, but it is way too early for the type of triumphalist rhetoric being bandied about by advocates.

    Let’s take a look at the change in the regional population share in core counties in 2009 vs. 2008 for the Midwest cities I typically focus on.

    City  Core County Share Change   2009 Core County Share   2008 Core County Share 
    Columbus 0.02% 63.83% 63.81%
    Pittsburgh 0.02% 51.74% 51.72%
    Milwaukee (0.01%) 61.52% 61.53%
    Minneapolis-St. Paul (0.02%) 50.84% 50.86%
    Chicago (0.06%) 55.19% 55.24%
    Louisville (0.07%) 57.33% 57.41%
    Kansas City (0.11%) 34.13% 34.25%
    Cincinnati (0.17%) 39.37% 39.54%
    St. Louis (0.18%) 47.68% 47.86%
    Indianapolis (0.23%) 51.09% 51.32%
    Cleveland (0.26%) 61.00% 61.26%
    Detroit (0.32%) 43.47% 44.06%

    For St. Louis, I use St. Louis city + St. Louis County as the core. For Minneapolis-St. Paul, I used Hennepin+Ramsey as the core.

    As you can see, only two regions managed to increase core county share of population, and these by a minuscule amount. Everyone else lost core county share. Keep in mind that even these “core” counties have many places with suburban characteristics. Now you might prefer a purely core city measure, and if so, be my guest. But don’t be surprised if the data gets even worse in many cases. Even in Chicago, which might have experienced the biggest urban core construction boom in America, the city lost population while Cook County gained it. Looking at the core city would make Chicago’s share loss worse.

    I think this shows there is still some work to do, to put it mildly.

    So why the difference versus the EPA study the NYT trumpets? Well, for one thing, the EPA study is worthless as a measure of urban health. They measure only new building permits, not people. This I think taps into a subtle suburban mindset in our outlook, that new housing units must represent net new inventory and net new people moving in, but in urban areas that’s not necessarily the case.

    The sad fact is, many of our urban cores have experienced significant housing abandonment and demolition. So in addition to construction of net new units, there’s a countervailing force of reduction. For example, the greater downtown area of Indianapolis has been seeing lots of construction. But the regional center comprehensive plan noted that between 1990 and 2000, the net number of dwelling units actually decreased. “The actual number of housing units declined over the 10-year period as some housing became dilapidated or was demolished and as some projects were emptied to await renovation (the Census only counts habitable units).”

    What’s more, as yuppies move in, and others move out, there is bound to be an effect on household sizes. Is it is really a good idea to price out larger immigrant families to the inner ring suburbs so that DINK’s can move in? How’s that for the environmental footprint of the region?

    I’m glad we’ve got big increases in urban construction and even population increases in some neighborhoods, but let’s not get ahead of ourselves by trumpeting a “fundamental shift”, as the EPA does, when the demographics don’t back it up.

    The New York Times article is also a disappointment. It fails to do any independent analysis of the data and only talks to people who are cheerleaders for the study, making it a sad piece of journalism.

    Someone recently described me as an “apologist for sprawl”. I in no uncertain terms reject that label. I am a passionate urban advocate who wants to see our core cities thrive and prosper. I want more growth there. I live in a city in a walkable neighborhood and rarely drive.

    But advocacy research of the type urbanists are quick to decry in others does a disservice to the cause. To change the trajectory of our cities and our built environment in America, we need to start with something called “reality”. I am optimistic that there’s a change in the air. But let’s not make claims about “fundamental shifts” that are simply not supported by any realistic look at the totality of the data.

    This post first appeared at The Urbanophile.

  • Municipal Budget Mess

    A recent report from the National League of Cities projects a grim financial situation for many municipal governments during the next three years. According to the report the municipal sector “likely faces a combined, estimated shortfall of anywhere from $56 billion to $83 billion from 2010-2012.” Such shortfalls will be “driven by declining tax revenues, ongoing service demands and cuts in state revenues”. Facing large deficits, cities around the nation may be forced to “cure revenue declines and spending pressures with higher service fees, layoffs, unpaid furloughs, and drawing on reserves or canceling infrastructure projects”.

    The process of belt tightening has already begun in cities across the nation. In Michigan, the city of Jackson is asking municipal workers to take pay cuts to help close a $900,000 budget deficit. Toledo, Ohio, another rust belt city hard hit by the recession, may face a deficit of up to $44 million, and is being forced to consider “mid-contract union concessions, cutting city spending, and possibly asking the voters to increase the city’s 2.25 percent income tax.”

    In California, already challenged by record state deficits, the city of Los Angeles may have a budget shortfall of $1 billion by 2013, “driven primarily by escalating employee pension costs and stagnant tax revenues”. For the current fiscal year the city faces a deficit of $98 million. Under such budget conditions, the city’s administrative officer projects substantial cuts to city services will be “unavoidable”.

    With states already facing their own set of budget challenges, the League of Cities is calling on the federal government to intercede. According to the League, “in the absence of additional federal intervention, a deepening local fiscal crisis could hobble the nation’s incipient recovery with more layoffs, furloughs, cancelled infrastructure projects, and reduced services.” However, with an exploding federal debt load and federal budget deficits running at all time highs, municipal cries for increased aid may face a lukewarm reception in Washington, DC. Support for expanded stimulus efforts might prove lacking, with signs beginning to emerge that a mild economic recovery is underway, and many of the already passed stimulus dollars yet to be spent.

    For now, cities facing deficits will have to find ways to solve the shortfall on their own. If they are unable to bridge the gap, municipalities may find themselves forced, like the city of Vallejo, California,to file for Chapter 9 bankruptcy protection.

  • NGVideo: East St. Louis (Part III)

    Part III in the video series on East St. Louis explores ideas put forward for (re)development of the city, including cultural tourism based on the city’s African American heritage and use of vacant land for farming to create a local food source for the St. Louis metropolitan area.

    Part II gives views of downtown today, shows how its history can be seen in the city, and explains why the city could still be a good place for new development.

    Part I discusses the origins and development of East St. Louis as an industrial city.


    Michael R. Allen is an architectural historian currently serving as director of the Preservation Research Office, a technical assistance and preservation consulting firm. Allen also serves on the boards of the St. Louis Building Arts Foundation and Preservation Action.

    Alex Lotz is a graduate of the Film Production program of Chapman University’s Dodge College of Film and Media Arts.

  • A Threat To Home Owners Associations

    In the 1990s, just about the only site amenity that most suburban developments offered was a fancy entrance monument. Usually, there were no other additions beyond ordinance minimums and even those weren’t generally elaborate. Some of these monuments did cost millions, but once past the gilded gates, the seduction ended, and residents were greeted by familiar monotonous cookie cutter subdivisions.

    As neighborhood planners, we educate our developer clients regarding the virtues of building site amenities that improve Quality of Life (trails, gazebos, decorative ponds and fountains, etc). You would think these amenities were an easy sell to the cities approving the developments. After all, great developments create a great city, right? It’s not that simple, because all of these amenities require maintenance, and that places a burden on tax payers. No city wants to create a tax burden for all, when the likely benefit accrues to the few within the development.

    The solution to that problem was simple: The Home Owners Association. We are not talking about the type of Stepford-like association where lifestyles and flower plantings are strictly dictated, but the more limited type that adds a small monthly fee to service the common outdoor site amenities. In other words, only those extra amenities are cared for. Private yards still remain the financial burden of the individual homeowners. In the North, with snow removal, these neighborhood association fees are likely to be higher if the trails and walks are cleared. Since these Associations do not have to maintain private yards or address maintenance of buildings typical of townhome projects, the monthly fees are minimal. Some associations were formed in the North that did give options for snow removal on private driveways, at a very reasonable cost (after all, why not clear a few extra driveways while you are out clearing the trails?).

    The developer could now offer a much higher living standard and create more valuable lots that would be easier to sell. The majority of the neighborhoods we designed in the late 1990s through 2006 (the recession) offered the advantages that these minimal cost Associations could provide. We encouraged developers to spend less on elaborate entrance monuments and instead spread real value through the development where people lived.

    How HOAs May Be At Risk The recession has not just brought about massive foreclosures and reduced home prices. It has escalated real-estate taxes (the home value may be 40% less but the tax remains at pre-recession rates) and put the very idea of a Home Owners Association at risk. With failed development, there are often also failed Associations. With little or no maintenance of a development that was once cared for by private funding, cities may have to take over the burden until the economy recovers, and in some areas, if it recovers. Comprehensive associations that maintain all of the grounds (where there are no privately maintained yards),including the building exteriors and rooftops, as well as the streets, are at the greatest risk. The limited Associations that were typical of the neighborhoods we designed are not as much of a problem, but could easily be lumped into “all Associations are bad news” category in the minds of those approving future developments, after the economy returns.

    This affects all types of residential development.

    Developments that exceed minimum standards typically offer site amenities to make the development more enticing. Someone must maintain these extras. Fear of HOA failures will certainly be more on the minds of cities after the recession, but without HOAs, who will maintain the amenities? A two million dollar entrance monument does not make a neighborhood sustainable. Spreading value through the neighborhood with features that enhance quality of life, is a better investment. The Homeowners Association must not fall victim to the recession.