Tag: City Sector Model

  • America’s Most Suburbanized Cities

    Recently, The Wall Street Journal and Newsday, in a photographic spread, trumpeted the 70th anniversary of Levittown, the New York suburban development that provided the model for much of the rapid suburbanization that occurred after the Second World War in the United States. Levittown’s production line building also set the stage for the similar suburbs of cities in Canada, Australia, New Zealand and elsewhere.

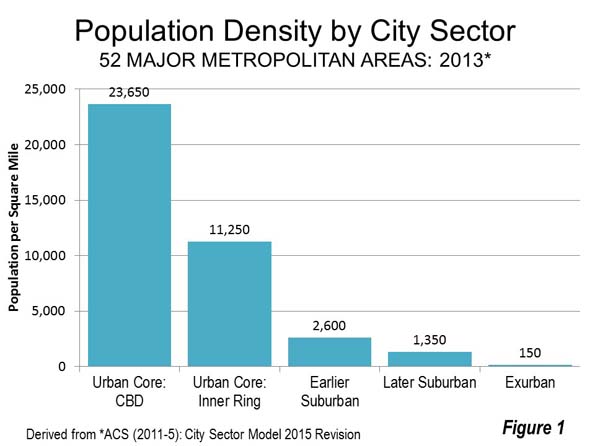
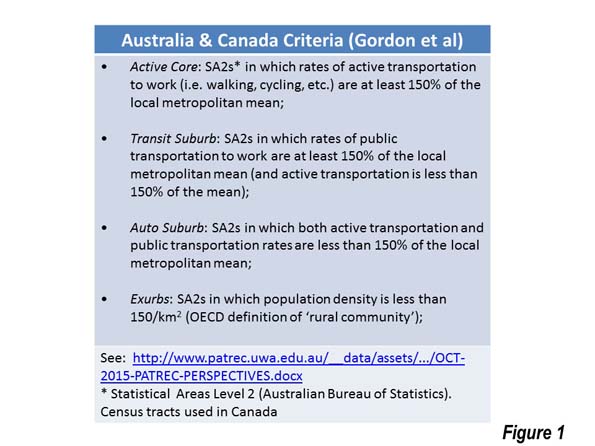
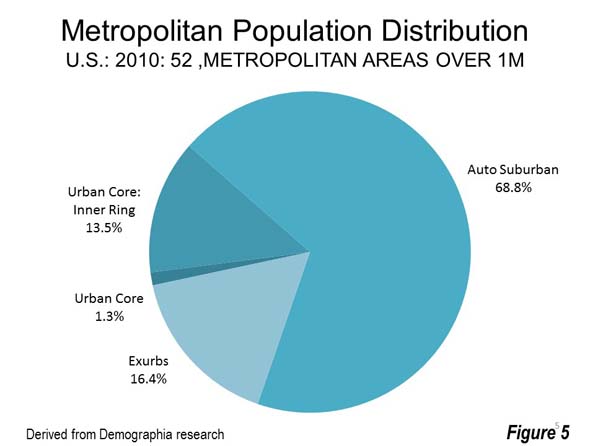
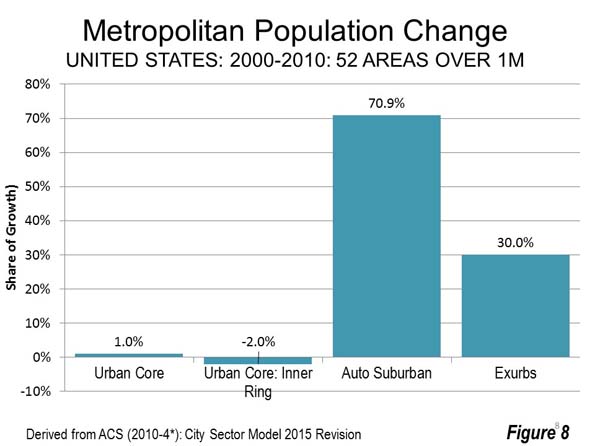
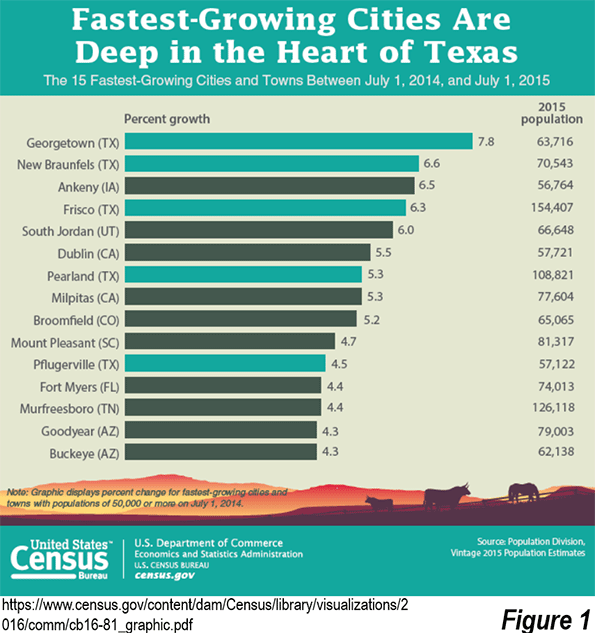
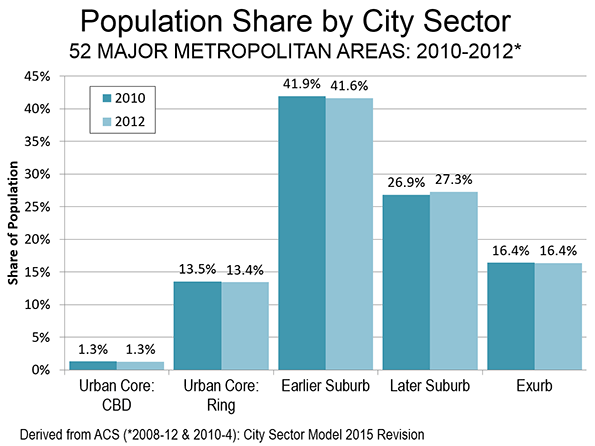
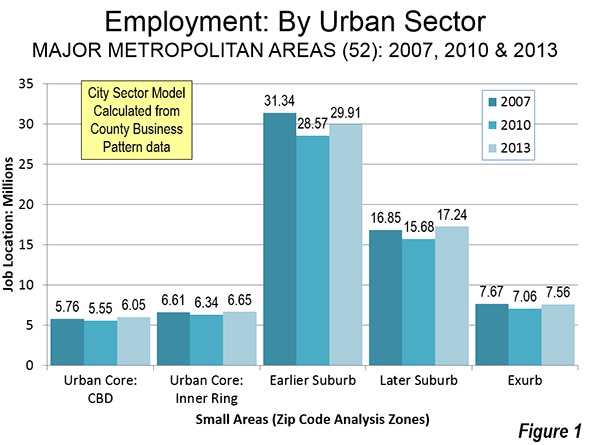
    Over the last seven decades, the United States has become a predominantly suburban nation. In 2011-2015, 85 percent of the population in the 53 major metropolitan areas (over 1,000,000 population) lived in the suburbs or exurbs. This is based on analysis at the small area level (zip code tabulation areas) from the American Community Survey that classifies population based on demographic data (Figure 1).

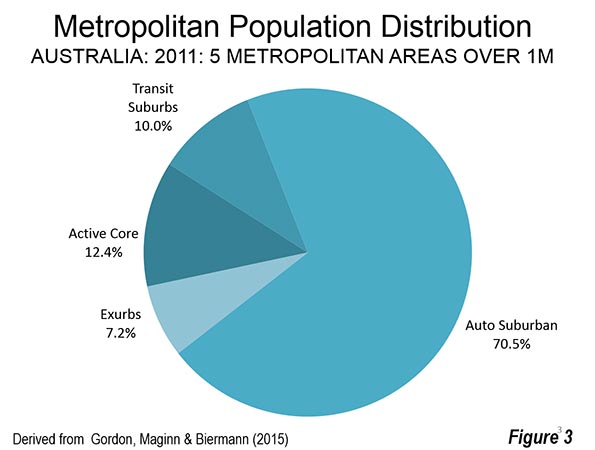
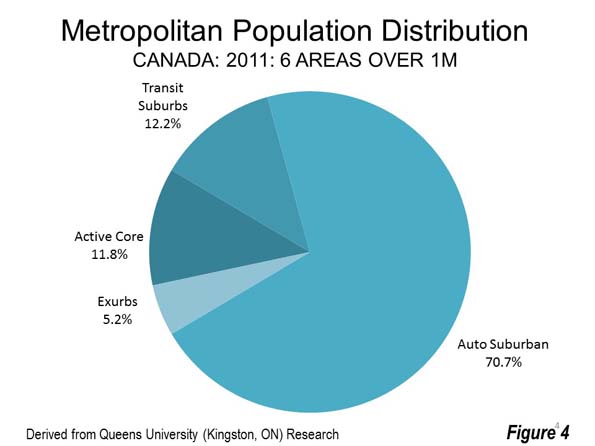
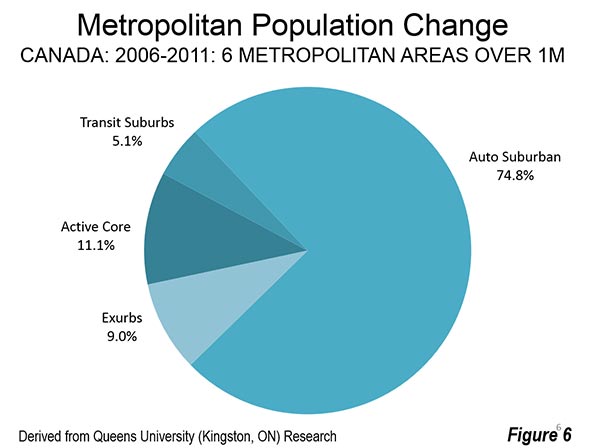
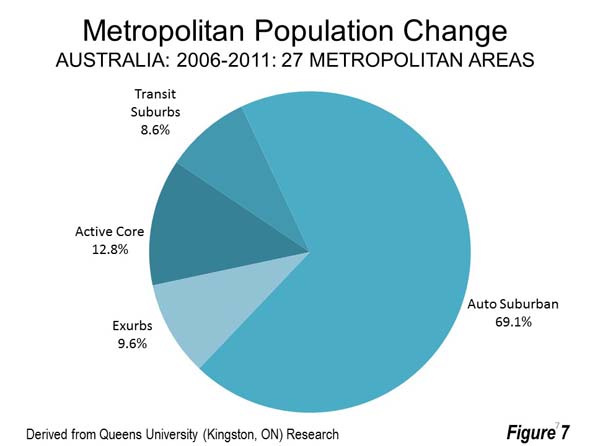
    Generally similar findings have been made about Canada and Australia by research teams led by Professor David L. A. Gordon of Queen’s University in Kingston, Ontario. Gordon and his Canadian team pioneered this type of analysis, which is not dependent on core municipality versus surrounding area analysis. Core municipalities often do not reflect the realities of metropolitan areas because they vary so greatly in their share of metropolitan area population. For example, the city of Atlanta has only 8 percent of the metropolitan area population, while San Antonio has more than 60 percent of the metropolitan area population.

    Suburban Nation: United States

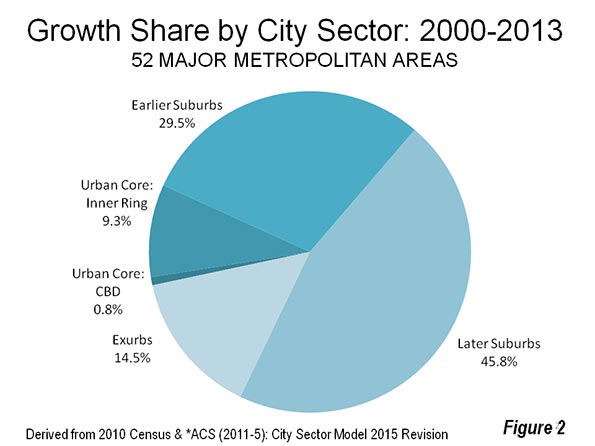
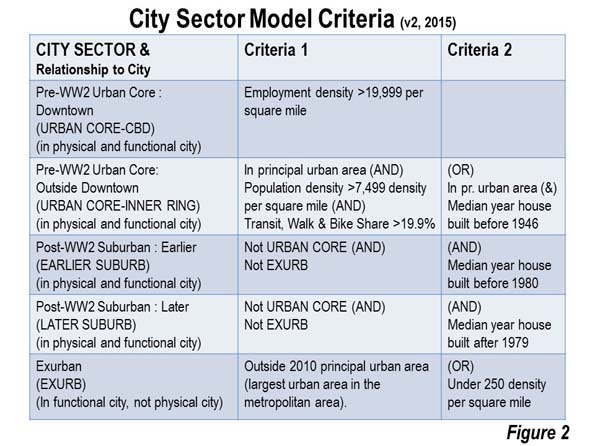
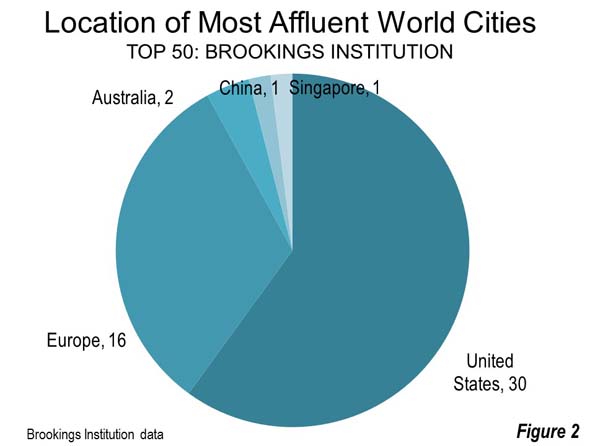
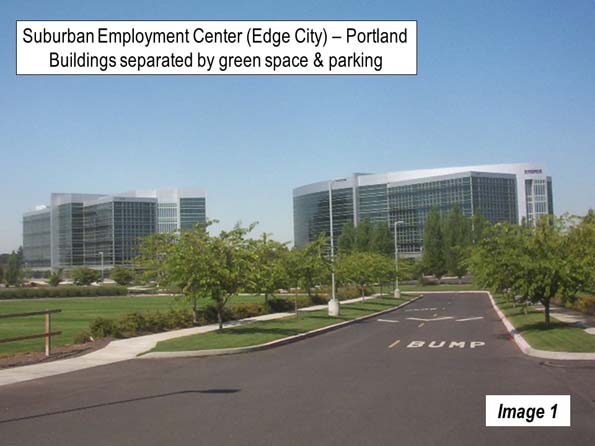
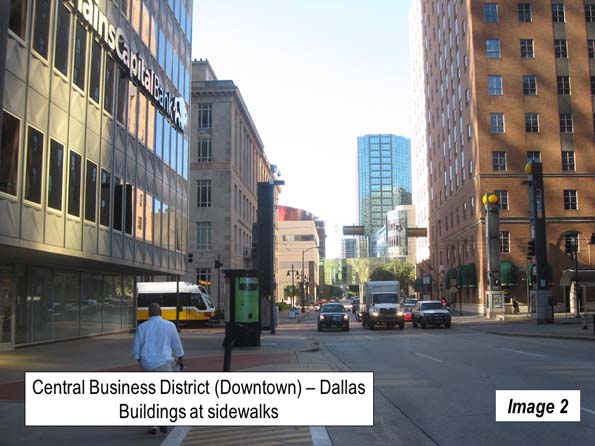
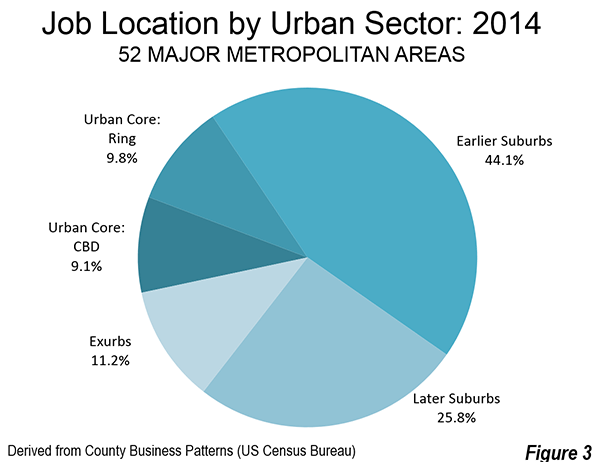
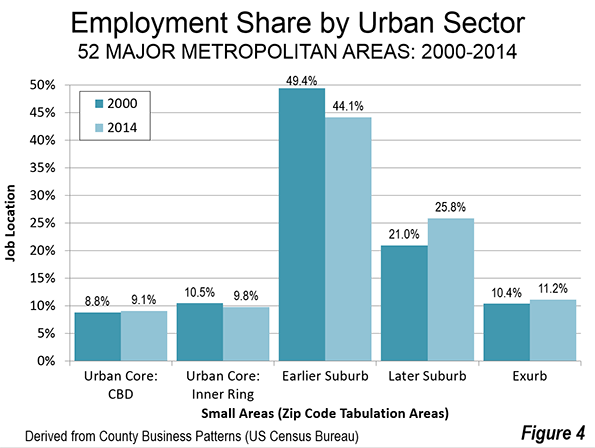
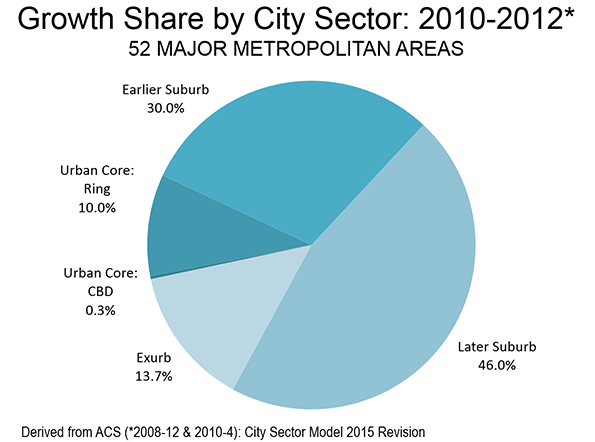
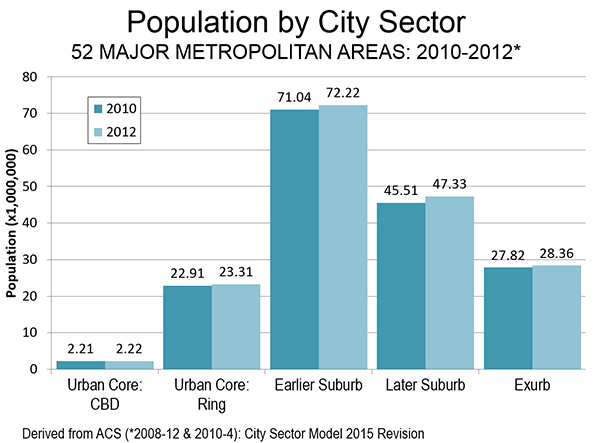
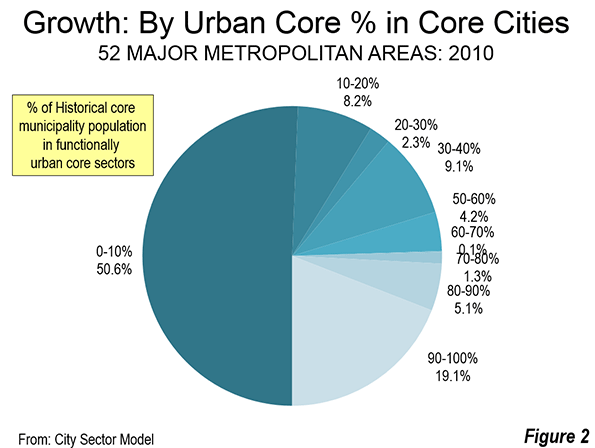
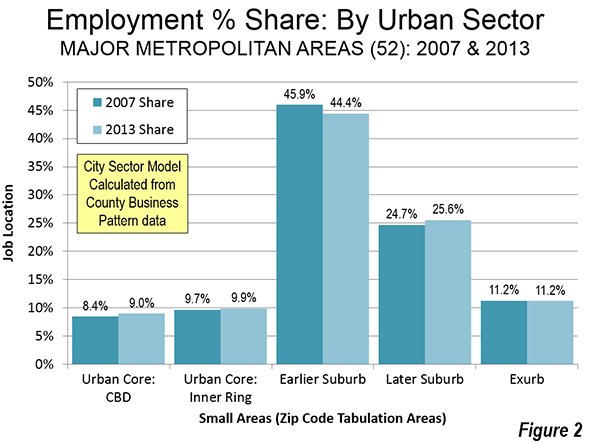
    Many people, including urban analysts, are unaware of the extent to which American cities have become suburbanized. But the former mono-centricity that characterized most metropolitan areas at the end of World War II has been replaced first by multi-centered suburban employment development (polycentricity) and more recently by dispersion of employment. As early as 2000, more people worked in dispersed worksites in the major metropolitan areas, including New York, than in the downtowns (CBD’s) and suburban office centers, according to research by Bumsoo Lee and Peter Gordon. City Sector Model analysis shows that CBDs lost two percent of their market share from 2000 to 2015, based on a City Sector Analysis of County Business Patterns data. It seems likely that the trend of dispersion has continued (Figure 2).

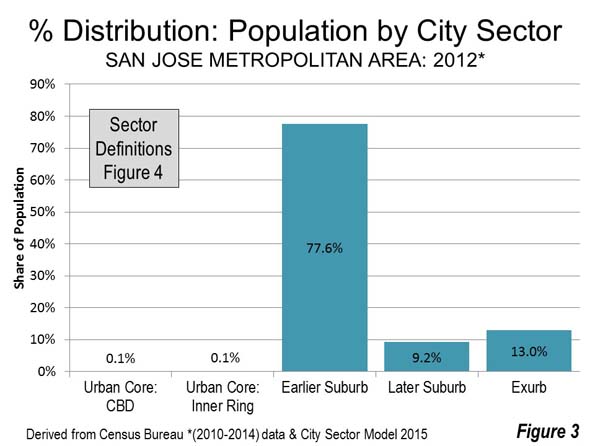
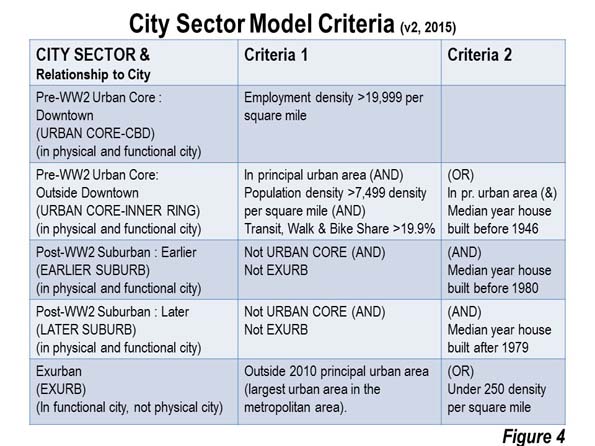
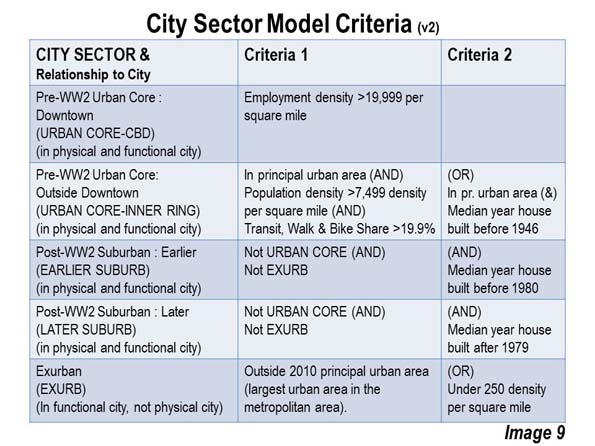
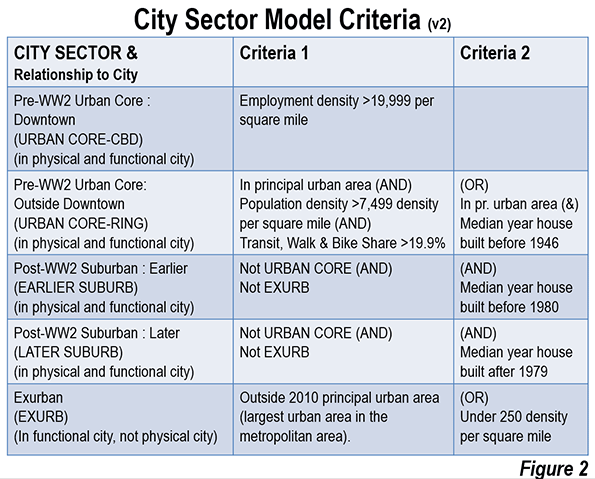
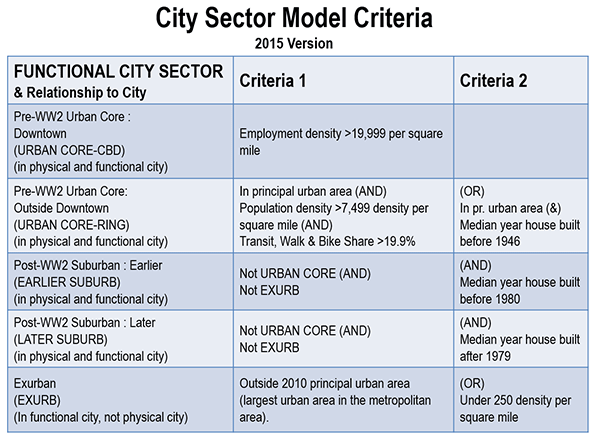
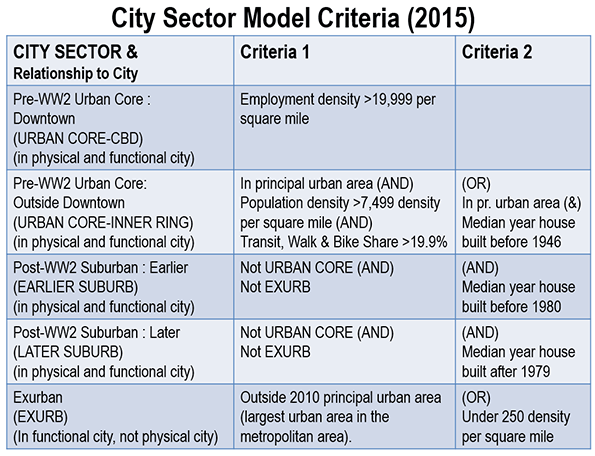
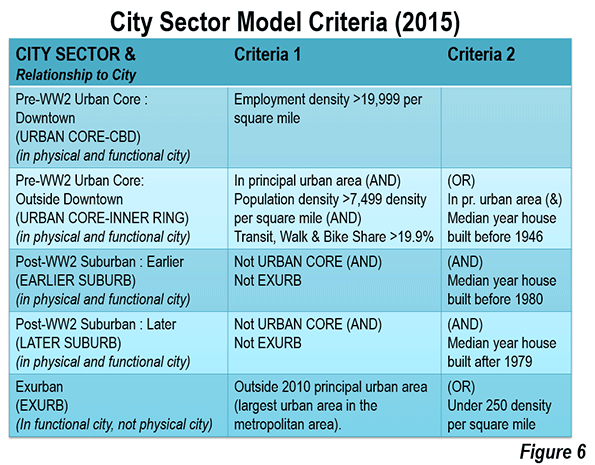
    We took a look at the population distribution of the 53 major metropolitan areas (those with more than 1,000,000 population) to rate down by the extent to which they are suburban. The City Sector Model classifies the population of any area where there is an employment density of 20,000 or more as a CBD considers the urban core inner ring to have population densities exceeding 7500 per square mile. Such densities were characteristic of pre-automobile urban areas in the United States. According to estimates prepared by the Urban Land Institute, in 1920 the 24 urban areas with more 250,000 residents had an average population density of 7500.

    As it turns out, 10 metropolitan areas have virtually no urban core population by this definition. To rank these metropolitan areas by their extent of suburbanization, we broke the 10 way tie by ranking the metropolitan areas by the extent of their exurban population. Exurban areas have very low population densities (250 per square mile or less) and are generally outside the urban area, which includes all contiguous built up area, surrounded by rural territory.

    Seven of the 10 most suburban cities are in three states. Three are in Florida and two each in North Carolina and Arizona. They are listed in the Table 1, and data is provided for all 53 in Table 2.

    Table 1
    Most Suburban Cities: (Metroplitan Areas)
    1 Charlotte, NC-SC
    2 Riverside-San Bernardino, CA
    3 Raleigh, NC
    4 Orlando, FL
    5 Birmingham, AL
    6 Jacksonville, FL
    7 Phoenix, AZ
    8 San Antonio, TX
    9 Tampa-St. Petersburg, FL
    10 Tucson, AZ
    Out of 53 with more than 1,000,000 population

    The Most Suburban: Charlotte, NC-SC

    Charlotte turns out to be the country’s most suburban metropolitan area. The exurban commuting patterns of Charlotte expanded substantially over the 2000 to 2010 decade, which resulted in the largest geographic expansion of any major metropolitan area. Its exurban population is 51 percent and its urban population density is approximately 1,700.

    2nd Most Suburban: Riverside-San Bernardino, CA

    Second ranked Riverside-San Bernardino, which in many ways is an extension of the Los Angeles metropolitan area (and is included in the Los Angeles combined statistical area), ranked as the second most suburban city. However, like other California cities, Riverside-San Bernardino is comparatively dense as an urban area, ranking above both Chicago and world renown densification model Portland as the 11th densest major urban area in the nation.

    3rd Most Suburban: Raleigh, NC

    At the opposite end of the density scale is third ranked Raleigh, a high tech center with an exurban population of 42 percent. Raleigh has an urban area population density of approximately 1,700, about the same as top ranked Charlotte and 16th ranked Atlanta.

    4th Most Suburban: Orlando, FL

    Fourth ranked Orlando has an exurban population of 34 percent and is suburban by nature. This is not surprising considering that it is virtually all new, having principally been developed since Walt Disney World made its decision to locate there and other entertainment venues followed.

    5th Most Suburban: Birmingham, AL

    Fifth ranked Birmingham, Alabama’s largest city, had far slower growth than most major metropolitan areas of the South. In 1950, the metropolitan population was approximately 20 percent behind Atlanta, according to the 1950 census. Now, virtually all-suburban Atlanta has grown to nearly 5 times that of Birmingham since that time. Even so, Birmingham has expanded to have the lowest density of any principal urban area in a major metropolitan area.

    6th Most Suburban: Jacksonville, FL

    Sixth ranked Jacksonville, another all-suburban metropolitan area has an exurban population of 25 percent.

    7th Most Suburban: Phoenix, AZ

    Phoenix, like Orlando is virtually all a postwar product. With its 100 percent suburban population, 19 percent of it is in the exurbs ranking Phoenix as seventh most suburban. Phoenix is the largest among the all-suburban cities, with more than 4.6 million residents and is likely to displace San Francisco to become the nation’s 11th largest metropolitan area this year, and could take 10th position away from Boston by the 2020 Census.

    8th Most Suburban: San Antonio, TX

    San Antonio, ranked as eighth most suburban, with an exurban population of 17 percent.

    9th Most Suburban: Tampa-St. Petersburg, FL

    Tampa – St. Petersburg ranks as the ninth most suburban city, with a 14 percent exurban population. Like San Antonio, Tampa has a comparatively strong downtown area, but its inner densities do not reach the levels necessary for population to be classified as urban core.

    10th Most Suburban: Tucson, AZ

    Tucson, the newest entry among the nations 53 major metropolitan areas takes the 10th position and rounds out the cities that are 100 percent suburban.

    Other Cities

    Nashville and San Jose ranked 11th, but are very different. Nashville, as the capital of Tennessee, has a comparatively strong CBD, but the urban area is one of the least dense. On the other hand, San Jose, which is really an extension of the San Francisco metropolitan area and a part of the San Francisco Bay combined statistical area has a weak CBD, but a very high urban area density. San Jose ranks after only Los Angeles and San Francisco in its urban density and ahead of the sprawling New York urban area.

    There are a total of 34 metropolitan areas that are 95 percent or more suburban. These include examples such as Atlanta, at 99.2 percent San Diego at 98.9 percent Sacramento at 98.3 percent, Austin and 97.9 percent, Denver at 96.9 percent and Portland at 90.0 percent.

    Los Angeles, with the nation’s densest urban area, is 89.4 percent suburban, nearly matched by Seattle’s 89.3 percent.

    A number of older cities are overwhelmingly suburban as well, such as St. Louis at 88.4 suburban, Minneapolis-St. Paul at 86.8 percent, Washington at 83.3 percent, and Milwaukee at 76.6 percent. Chicago, Philadelphia, Providence, San Francisco – Oakland and Buffalo are all more than 70 percent suburban.

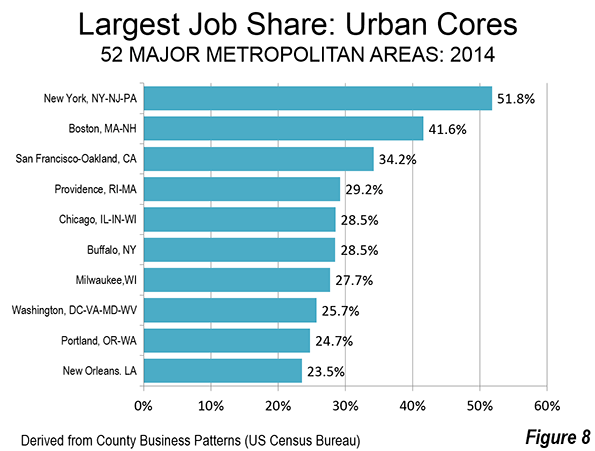
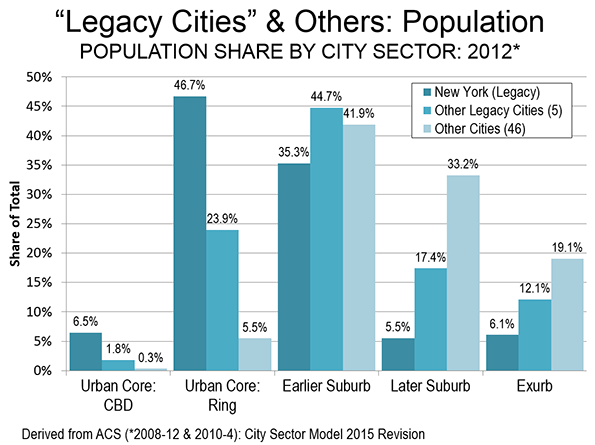
    Boston and New York are considerably less suburban than the other 51 major metropolitan areas. Boston is 64.3 percent suburban, while New York is the only major metropolitan area that has a larger urban core population than its suburban and exurban area. New York is only 46.7 percent suburban.

    Fast Growing and Automobile Oriented

    As with all suburban areas, these suburban cities are automobile oriented. The journey to work transit market shares average 1.7 percent, one third of the national average for all areas. They are also among the fastest growing, with six ranking in the top 10 for 2010 to 2016 growth. A close look shows that the American urban form is changing, but not in ways commonly discussed among planners, urban land speculators and many academics.

    Table 2
    Cities (Metropolitan Areas) Ranked by Extent of Suburbanization
    Major Metropolitan Areas: 2011-2015
    Share (%) of Metropolitan Population by Sector
    Rank Metropolitan Area % Suburban CBD Urban Core: Inner Ring Earlier Suburbs Later Suburbs Exurbs
    1 Charlotte, NC-SC 100.0% 0.0% 0.0% 10.2% 39.2% 50.6%
    2 Riverside-San Bernardino, CA 100.0% 0.0% 0.0% 28.9% 29.6% 41.5%
    3 Raleigh, NC 100.0% 0.0% 0.0% 7.4% 56.8% 35.8%
    4 Orlando, FL 100.0% 0.0% 0.0% 15.7% 50.6% 33.7%
    5 Birmingham, AL 100.0% 0.0% 0.0% 41.6% 25.2% 33.2%
    6 Jacksonville, FL 100.0% 0.0% 0.0% 25.6% 49.0% 25.4%
    7 Phoenix, AZ 100.0% 0.0% 0.0% 29.1% 52.0% 18.9%
    8 San Antonio, TX 100.0% 0.0% 0.0% 38.6% 44.1% 17.3%
    9 Tampa-St. Petersburg, FL 100.0% 0.0% 0.0% 44.2% 41.7% 14.1%
    10 Tucson, AZ 100.0% 0.0% 0.0% 46.9% 41.0% 12.2%
    11 Nashville, TN 99.8% 0.2% 0.0% 24.4% 36.9% 38.5%
    12 San Jose, CA 99.8% 0.1% 0.1% 77.5% 9.3% 13.0%
    13 Houston, TX 99.6% 0.4% 0.0% 33.2% 50.0% 16.4%
    14 Dallas-Fort Worth, TX 99.5% 0.2% 0.3% 33.7% 43.1% 22.7%
    15 Virginia Beach-Norfolk, VA-NC 99.5% 0.0% 0.5% 45.9% 38.0% 15.7%
    16 Atlanta, GA 99.2% 0.2% 0.6% 14.8% 70.8% 13.6%
    17 San Diego, CA 98.9% 0.0% 1.1% 61.3% 30.9% 6.7%
    18 Sacramento, CA 98.3% 0.0% 1.7% 37.7% 40.9% 19.8%
    19 Memphis, TN-MS-AR 98.1% 0.0% 1.9% 39.9% 35.3% 23.0%
    20 Austin, TX 97.9% 0.4% 1.7% 15.4% 63.0% 19.6%
    21 Las Vegas, NV 97.6% 0.4% 2.0% 16.2% 77.7% 3.8%
    22 Oklahoma City, OK 97.2% 0.4% 2.4% 34.1% 32.6% 30.6%
    23 Miami, FL 97.1% 0.3% 2.6% 50.0% 44.8% 2.4%
    24 Denver, CO 96.9% 0.5% 2.7% 42.7% 42.7% 11.4%
    25 Grand Rapids, MI 96.5% 0.0% 3.5% 33.0% 15.4% 48.0%
    26 Salt Lake City, UT 96.5% 0.0% 3.5% 47.9% 39.2% 9.3%
    27 Richmond, VA 95.6% 0.0% 4.4% 38.5% 38.4% 18.6%
    28 Columbus, OH 95.3% 0.0% 4.7% 28.5% 38.6% 28.3%
    29 Indianapolis. IN 95.0% 0.3% 4.6% 27.3% 42.6% 25.2%
    30 Kansas City, MO-KS 94.8% 0.2% 5.0% 37.5% 26.9% 30.4%
    31 Detroit,  MI 93.7% 0.1% 6.1% 60.2% 16.6% 17.0%
    32 Louisville, KY-IN 91.2% 0.5% 8.3% 44.5% 26.0% 20.8%
    33 Cincinnati, OH-KY-IN 90.0% 0.6% 9.4% 40.3% 27.9% 21.8%
    34 Portland, OR-WA 90.0% 0.7% 9.3% 36.0% 39.7% 14.3%
    35 Los Angeles, CA 89.4% 0.4% 10.1% 76.1% 5.3% 8.0%
    36 Seattle, WA 89.3% 1.1% 9.7% 35.9% 40.7% 12.6%
    37 New Orleans. LA 89.1% 0.2% 10.7% 50.3% 7.0% 31.8%
    38 Hartford, CT 88.7% 0.1% 11.2% 77.4% 1.0% 10.3%
    39 Rochester, NY 88.6% 0.3% 11.1% 46.8% 7.9% 34.0%
    40 St. Louis,, MO-IL 88.4% 0.1% 11.5% 39.6% 26.1% 22.7%
    41 Minneapolis-St. Paul, MN-WI 86.8% 0.5% 12.7% 31.4% 33.7% 21.7%
    42 Baltimore, MD 84.3% 1.4% 14.3% 42.0% 20.6% 21.8%
    43 Pittsburgh, PA 84.1% 1.3% 14.5% 56.0% 5.0% 23.1%
    44 Washington, DC-VA-MD-WV 83.3% 1.6% 15.1% 28.2% 36.6% 18.4%
    45 Cleveland, OH 78.3% 0.0% 21.7% 48.5% 13.6% 16.2%
    46 Milwaukee,WI 76.6% 1.6% 21.7% 50.7% 10.5% 15.4%
    47 Chicago, IL-IN-WI 74.2% 1.2% 24.6% 44.9% 18.5% 10.8%
    48 Philadelphia, PA-NJ-DE-MD 74.1% 0.9% 25.0% 50.5% 15.1% 8.5%
    49 Providence, RI-MA 73.9% 0.6% 25.5% 47.9% 2.8% 23.1%
    50 San Francisco-Oakland, CA 73.0% 3.3% 23.7% 54.0% 7.6% 11.4%
    51 Buffalo, NY 71.0% 0.3% 28.7% 51.3% 3.1% 16.6%
    52 Boston, MA-NH 64.3% 3.2% 32.5% 48.6% 3.6% 12.2%
    53 New York, NY-NJ-PA 46.7% 6.5% 46.8% 35.2% 5.5% 6.0%
    Derived from American Community Survey using City Sector Model


    Wendell Cox is principal of Demographia, an international public policy and demographics firm. He is a Senior Fellow of the Center for Opportunity Urbanism (US), Senior Fellow for Housing Affordability and Municipal Policy for the Frontier Centre for Public Policy (Canada), and a member of the Board of Advisors of the Center for Demographics and Policy at Chapman University (California). He is co-author of the “Demographia International Housing Affordability Survey” and author of “Demographia World Urban Areas” and “War on the Dream: How Anti-Sprawl Policy Threatens the Quality of Life.” He was appointed to three terms on the Los Angeles County Transportation Commission, where he served with the leading city and county leadership as the only non-elected member. He served as a visiting professor at the Conservatoire National des Arts et Metiers, a national university in Paris.

    Top photograph: Exurban Charlotte, by author.

  • 2010-2013 Small Area Data Shows Strong Suburban & Exurban Growth

    The latest small area estimates from the Census Bureau indicate that suburban and exurban areas continue to receive the overwhelming share of growth in metropolitan areas around the country, with a single exception, New York. The new American Community Survey (Note 1) 5 year file provides an update of data at the ZCTA (zip code tabulation area), which are described below, as analyzed by the City Sector Model. The data was collected from 2011 through 2015, and can therefore be considered generally reflective of the middle year of the period, 2013.

    City Sector Model Analysis

    The City Sector Model classifies small areas into five categories based on population density, commuting mode and age of development (the criteria is described in Figure 7). There are two pre-World War II classifications, the Urban Core CBD (central business district) and the Urban Core Inner Ring. These areas are typified by substantial reliance on transit, walking and cycling for commuting and have higher population densities. There are also three post-World War II, classifications, the Early Suburbs, Later Suburbs and the Exurbs, both of which have lower population densities and substantial automobile orientation (Figure 1).

    The Overall Trends

    In contrast to the narrative that there has been a “return to the cities” (meaning the urban core, as opposed to cities in the functional sense or physical sense, which are metropolitan areas and urban areas respectively see Note 2 in a previous post), most new residents are located in the suburbs and exurbs. Between 2010 and 2013, The automobile oriented suburbs and exurbs captured 89.9 percent of the new population growth in 52 major metropolitan areas (over 1,000,000 population in 2013). By contrast, 10.1 percent of major metropolitan population growth was in the Urban Core. The Urban Core-CBD, (largely identified with the Central Business District), accounted for 0.8 percent of the growth, and the Urban Core: Ring, the neighborhoods surrounding the core, for the other 9.3 percent (Figure 2). Although the vast majority of growth is concentrated in the suburbs and exurbs, the urban core has reversed their long-term decline, after suffering a small loss in population between 2000 and 2010.

    Each of the five categories experienced population increases between 2010 and 2015 (Figure 3). However, only the Later Suburbs grew faster than its pre-existing share of the metropolitan population. The Later Suburbs had 26.9 percent of the population in 2010, yet added a much stronger 45.8 percent of the population increase from 2010 to 2013.

    The Earlier Suburbs grew faster than in the previous decade, but their 29.5 percent share of metropolitan growth was far less than their 41.5 percent population share in 2010. The Urban Core: CBD captured 0.8 percent of the growth, less than its prior 1.3 percent share, while the Urban Core: Inner Ring fell nearly one-third short of equaling its previous population share. The Exurbs, which were hit hard by the Great Recession, also fell short of gaining at the rate of their population  (Figure 4).

    New York and the Rest

     The New York metropolitan area, dominated the nation in urban core growth, with 73.2 percent of the population increase, leaving only 27.8 percent for the suburbs. Even this, however, is not likely an indication of a “return to the core city” because of apparent net domestic migration losses (Note 2) throughout the metropolitan area. In fact the city of New York was not attracting new domestic migrants at all, from the suburbs or elsewhere in the nation, with a net domestic migration loss of 400,000 between 2010 and 2015. All of the city of New York’s population gain was due to an excess of births over deaths and, as befits one of the world’s great global cities, international migration.

    New York’s domination of urban core growth was astounding in raw numbers, as well. More than one-half of all the urban core growth among the major metropolitan areas was in the New York metropolitan area. Washington was a distant second, with 11.2 percent of the urban core growth. Boston was close behind at 9.7 percent, followed by San Francisco-Oakland at 8.1 percent. The other two metropolitan areas with legacy core cities were substantially lower, with Philadelphia accounting for 4.1 percent and Chicago 3.7 percent. All of the 46 metropolitan areas without legacy core cities, accounted for only 10.6 percent of total urban core growth, one-fifth the growth in New York alone. As with so much, the story of high density urban cores in the United States is largely about New York (Figure 5).

    Nothing like New York’s domination of urban core growth over suburban and exurban growth occurred elsewhere, not even among the other five metropolitan areas with “legacy cities” (core cities). These are the metropolitan areas with the six largest central business district in the United States, and in which the core cities account for 55 percent of the national transit commuting destinations (despite having only six percent of the national employment).

    Boston, came the closest, with 39.9 percent of its growth in the urban core. There was one other metropolitan area with more than 30 percent of its growth in the urban core, Philadelphia at 36.2 percent. The Chicago urban core accounted for 29.7 percent of its growth, San Francisco for 24.5 percent and Washington for 20.8 percent. Each of these, with the exception of San Francisco, managed to have proportionally greater growth in its urban core than the population share already living there (Figure 6).

    The situation was much different in the 46 major metropolitan areas without legacy core cities. In these, nearly all population growth (98.6 percent) was in the suburbs and exurbs. This is slightly above the 94.5 percent of the population living there.

    Suburban Nation

    Using a different small area classification system, the Urban Land Institute (ULI) has reached similar conclusions on the distribution of metropolitan population and growth. Indicating that “America remains a largely suburban nation,” ULI indicates that 79 percent of the nation’s metropolitan population lives in the suburbs and that suburban areas accounted for 91 percent of metropolitan growth from 2000 to 2015. These trends are mirrored in large measure in Canada and Australia, according to work led by Professor David Gordon of Queens University in Kingston, Ontario.

    To be sure, the improvement in urban core fortunes is a very positive development. There is no question that urban cores are far nicer places than they were two decades ago and that their renewed growth makes the entire city, from the central business district to the sparsely populated exurbs, a better and more productive place. But the bulk of growth, and the preponderance of the population, remains firmly suburban.

    Note 1: The American Community Survey (ACS) uses sampling methods from which estimates are built, not actual counts like occur in the US Census every 10 years. The most reliable data is from the Census, which will be conducted next in 2020.

    Note 2: “Apparent” is used because domestic migration data is not reported below the county level (such as in ZCTA’s). However, much of the Urban Core is in the city of New York and all of the inner ring suburban counties lost domestic migrants, suggesting that net domestic migration gains could not have occurred.
    Wendell Cox is principal of Demographia, an international public policy and demographics firm. He is a Senior Fellow of the Center for Opportunity Urbanism (US), Senior Fellow for Housing Affordability and Municipal Policy for the Frontier Centre for Public Policy (Canada), and a member of the Board of Advisors of the Center for Demographics and Policy at Chapman University (California). He is co-author of the "Demographia International Housing Affordability Survey" and author of "Demographia World Urban Areas" and "War on the Dream: How Anti-Sprawl Policy Threatens the Quality of Life." He was appointed to three terms on the Los Angeles County Transportation Commission, where he served with the leading city and county leadership as the only non-elected member. He served as a visiting professor at the Conservatoire National des Arts et Metiers, a national university in Paris.

    Photo: NASA satellite view of New York’s urban core

  • Suburban Nations: Canada, Australia and the United States

    Professors David L. A. Gordon of Queens University (Canada) and Paul Maginn and Sharon Biermann of the University of Western Australia have now shown Australia to be a largely suburban nation. This follows on Professor Gordon’s work with colleagues in 2013 that came to the same conclusion on Canada based upon 2006 census data. By using census tract data, rather than municipality data, Gordon, et al were able to avoid the misleading but readily accessible jurisdictional analysis (central city versus suburbs) that equated large low-density central municipalities like Calgary and Edmonton, with more compact and dense municipalities like Vancouver and Montreal (or New York with Phoenix). The Gordon, et al criteria is illustrated in Figure 1.

    Broadly following the Gordon et al research, in the Spring of 2014, I published a similar “City Sector Model” using postal code tabulation areas (zip codes) for the major metropolitan areas of the United States. That criteria is illustrated in Figure 2.

    This article compares the Gordon findings in Canada and Australia and contrasts them with my findings in the United States.

    The Gordon Research: Canada and Australia

    In Australia, as in Canada, Professors Gordon, Maginn and Biermann divided metropolitan areas into four classifications at a small area level. The research called the urban core classification "active core," to note the greater dependence of residents on walking and cycling for commuting to work. They divided suburban areas into transit and auto suburban areas, and designated the more rural areas of metropolitan areas as exurban. In both countries, they used the functional or economic definition of cities, which is metropolitan areas or labor market areas (Note 1).

    Gordon, Maginn and Biermann’s analysis shows that Australia’s 27 metropolitan areas are 13 percent “active core”, nine percent transit suburbs, 69 percent auto suburbs and 10 percent exurban. This is nearly the same as the previous research on the 2011 Census of Canada which revealed 12 percent active core, 11 percent transit suburbs, 69 percent auto suburbs and eight percent exurban for all 33 metropolitan areas.

    The Major Metropolitan Areas (Over 1,000,000 Population) In the smaller number of Australian metropolitan areas with more than 1,000,000 population, the “active cores” are only slightly larger than those in Canada (12.4 percent of the metropolitan population versus 11.8 percent). But Canada’s major metropolitan areas has larger “transit suburbs” by a 12.2 percent to 10.0 percent margin. The “auto suburban” figures are virtually the same, with Australia at 70.5 percent and Canada at 70.7 percent. Finally, Australia has a slightly larger “exurbs,” at 7.2 percent compared to Canada’s 5.2 percent (Figures 3 and 4).

    Comparing to the United States

    In the United States, the City Sector Model uses somewhat different criteria. Gordon’s central classifications (“active core” and “transit suburb”) parallel the City Sector Model’s “urban core: CBD” and “urban core: inner ring.” Gordon’s “auto suburban” and “exurban” also roughly parallel the two “suburban” and the exurban City Sector Model classifications.

    Perhaps the largest difference between the two models is in the treatment of commuting. Professor Gordon’s approach is to classify the two central areas based on 50 percent higher than each metropolitan’s area average shares of walking, cycling and transit journey to work travel. The City Sector Model uses an across-the-board minimum 20 percent market share (transit, cycling and walking combined), to replicate a division between more dense pre-World War II development and the automobile oriented suburbs that followed.

    Comparing to the United States

    Of course, it is to be expected that the United States, with the lowest density built-up urban areas (called population centers in Canada and urban centres in Australia) would be even more suburban than Australia and Canada . This is indicated by the data (see Demographia World Urban Areas).

    There are large differences in the two more central classifications. In Australia, the two central areas have 22.4 percent of the metropolitan area population, somewhat less than Canada’s 24.0 percent. In the United States the two central areas have a smaller 14.8 percent of the metropolitan area population (Figure 5).

    Various factors account for this difference. There were, for example, huge urban core population losses   in the United States, but not in Canada and Australia. Another cause is the much earlier motorization of the United States, which by 1929, according to economist Robert Gordon, had achieved 0.9 vehicles per household and had 90 percent of the world’s registered vehicles (Note 2). With this unparalleled market penetration, the U.S. had a several decade long head start in automobile oriented suburbanization. Canada equaled the 1929 U.S. automobile market penetration in the middle 1950s and Australia in the middle 1960s.However, in the suburban classification, the metropolitan areas of the three nations were very similar. The US automobile suburb share of the population, at 68.8 percent was within two percentage points of both Canada and Australia. However, like the urban core, the suburbs showed considerably different results, with the United States having a 16.4 percentage exurban share, compared to approximately 10 percentage point lower shares in both Canada and Australia.

    Part of difference in the exurbs is the larger geographic size of U.S. metropolitan areas, which are far less representative in capturing the genuine labor market. The building geographical blocks used by the U.S. Office of Management and Budget are simply too large for sufficient preciseness. This is illustrated by the Riverside-San Bernardino metropolitan area, which covers an area about the same size as the Canadian province of New Brunswick or the Australian state of Tasmania. By contrast, in Canada, Statistics Canada uses municipalities to construct metropolitan areas, while Australia uses “Statistical Areas Level 4,” which are generally smaller than US counties (Note 3). When the boundaries of a metropolitan area are far larger than the actual commuting shed (as often happens in the United States), more people will be in the metropolitan area.

    At the same time, these results must be interpreted carefully, since there are differences in the criteria and geographical building blocks of metropolitan areas in all three nations.

    Comparison of Population Growth

    Professor Gordon’s research in both nations shows suburban growth   far out stripping growth in the central areas. In Canada, nearly 84 percent of major metropolitan area population growth between 2006 and 2011 was in the “auto suburbs” and “exurbs” (Figure 6). In Australia (27 metropolitan areas), the “auto suburbs” and “exurbs accounted” for nearly 78 percent of population growth (Figure 7). In the United States, the suburbs and exurbs accounted for over 85 percent   (Figure 8).

    Suburban World

    Contrary to planning preference for dense urbanization, suburbanization has occurred virtually wherever people can afford cars. This is even true in Europe, Japan and China. For example, the municipality of Paris continues to languish with a population a quarter below its level of 135 years ago (1881). The 8 million resident urban area growth since that time has been in the suburbs , which now cover more than 25 times the area of the ville de Paris (the central municipality). Other examples, such as the core municipalities of Copenhagen (from 1950), Barcelona and Milan (from 1970) have suffered significant population losses while all metropolitan area growth has been in the suburbs. There are many similar examples around the world.

    Even with the differing definitions, the data in Canada, Australia and the United States is remarkably similar. Of course, not all suburbs are the same, but it should not be surprising that the organic growth of cities continues on their edges.

    Note 1: For further information see: Paul Cheshire, Max Nathan and Henry G. Overman of the London School of Economics in their recent book, Urban Economics and Urban Policy: Challenging Conventional Policy Wisdom.

    Note 2: See Robert J. Gordon, The Rise and Fall of American Growth: The U.S. Standard of Living Since the Civil War, page 374, reviewed at http://www.newgeography.com/content/005364-robert-gordons-notable-history-economics-and-living-standards.  

    Note 3: The larger size of US exurbs is illustrated by the 11,400 square kilometer average areas outside the principal urban areas (exurbs) of US metropolitan areas. In Australia, the average outside the principal urban centres is 6,500 square kilometers, while in Canada the average area outside the principal population centres is 4,600 square kilometers (data based on metropolitan areas with more than 1,000,000 population).

    Wendell Cox is principal of Demographia, an international public policy and demographics firm. He is a Senior Fellow of the Center for Opportunity Urbanism (US), Senior Fellow for Housing Affordability and Municipal Policy for the Frontier Centre for Public Policy (Canada), and a member of the Board of Advisors of the Center for Demographics and Policy at Chapman University (California). He is co-author of the “Demographia International Housing Affordability Survey” and author of “Demographia World Urban Areas” and “War on the Dream: How Anti-Sprawl Policy Threatens the Quality of Life.” He was appointed to three terms on the Los Angeles County Transportation Commission, where he served with the leading city and county leadership as the only non-elected member. He served as a visiting professor at the Conservatoire National des Arts et Metiers, a national university in Paris.

    Photo: Brisbane, Australia Inner Suburbs (by author)

  • World’s Most Affluent Areas: Dominated by Low Population Densities

    The Brookings Institution is again out with data on the world’s most affluent metropolitan areas. The GDP data is in Redefining Global Citieswhich contains a treasure trove of data. Again, United States metropolitan areas dominate the highest rankings, capturing nine of the top 10 positions. San Jose is rated with the highest gross domestic product (GDP) per capita, at $91,400 (purchasing power parity or PPP). This is an improvement from third in 2014 and second in 2012 (Figure 1). The top 10 is dominated by cities with relatively low urban densities, like those that characterize San Jose (core of the world’s leading information technology center , Silicon Valley).

    In 2015, San Jose finally passed even less dense Hartford, which had ranked second and first in the two previous reports. In 2014, Macau, the smaller of China’s two Special Administrative Regions (SAR) had ranked number one (the larger SAR is Hong Kong, ranked 32nd). There was a methodology change in 2015 that established a population threshold higher than that of Macau, however the government’s anti-corruption campaign was credited with reducing Macao’s gaming revenue substantially and dropping the GDP per capita by about 15 percent. If it had been rated, Macau’s GDP per capita would have remained in the top 10, but would have fallen from the top.

    Singapore broke into the top 10, positioning itself between San Jose and Hartford, rising from 14th place, with a GDP per capita of $84,300. The Hartford, metropolitan area, which lead the list in 2012 and ranks second in 2014 fell to third place, with a GDP per capita of $84,000. San Francisco rose from nine in 2014 to 4th, with a GDP per capita of $80,600. Boston ranked fifth, with the GDP per capita of $77,700, dropping from fourth place. The top 10 was rounded out by Seattle, Houston, Washington, New York and Los Angeles (Note 1).

    The US dominance was far less in the second 10, with positions 11, 12 and 13 being captured by Zurich, Perth (Australia) and Munich. Paris, often rated highly as a world city, ranked 17th, while Stockholm ranked 19th. The five US entries were Portland (14th), San Diego (16th), Minneapolis St. Paul (17th), Dallas-Fort Worth (18th), and Denver (20th).

    Thirty of the 50 most affluent cities were in the United States, and 16 were in Europe. Australia had two entries, while East Asia had two, Singapore and Hong Kong (Figure 2).

    As usual, the rankings produced results that would surprise people who do not regularly follow this data.  London, which is routinely in a neck and neck competition with New York as the strongest “world” city ranked 35th, just behind Columbus Ohio. Tokyo, home of the world’s largest urban area, ranked 60th, behind Shenzhen, China (59th). Toronto, Canada’s principal city, ranked 53rd, just behind San Antonio. Sydney, Australia’s largest city ranked 47th, just behind St. Louis and just ahead of Detroit.

    Expanded Contents: Redefining Global Cities

    The new Brookings Institution report contains far more data than is indicated above. There is labor productivity data, indicated by GDP per worker. San Jose also leads in this category, and again, nine US metropolitan areas are included in the top 10. The only non-US entrant is the industrial powerhouse of Dongguan, China, one of the world’s least known metropolitan areas, located between Hong Kong, Shenzhen, Guangzhou and Foshan (the latter three municipalities in Guangdong Province).

    The report also contains data on economic growth, tradable clusters, innovation, talent and connectivity (with multiple indictors in each category). With the three reports since 2012, the Brookings Institution has positioned itself as a premier source for regularly published world urban data.

    The Highest Productivity in the Lowest Urban Densities

    There have often been suggestions that productivity and innovation are associated with high urban densities. This year’s data provides ample refutation of any such claim. San Jose, the top city in both GDP per capita and labor productivity, is virtually all suburban, as is indicated by the City Sector Model (Figures 3 and 4). San Jose, without a pre-World War II core and world-class dispersion is illustrated in the photograph at the top.

    The highest built-up urban area density among the top 10 metropolitan areas in GDP per capita is in Singapore, which is also the only one exceeding the world average urban density in the top 30. All of the US metropolitan areas in the top 10 have urban population densities well below that of Singapore (Figure 5) and below that of the average Chinese and Western European urban areas. Indeed, US metropolitan areas, which dominate world affluence, have the lowest urban population densities in the world as is indicated in Figure 6 (Note 2). 

    Note 1: US city data not adjusted for PPP (regional price parities) within the United States. Application of regional price parities to personal or household incomes would yield considerably different rankings.

    Note 2: Built -up urban area data are the only reliable measure for comparing urban densities at the organic city level, which in the economic or functional sense is metropolitan areas, and in the physical sense is contiguous built-up urban areas . This excludes the administrative unit or “municipality,” which is simply a political construct. For further information see: Paul CheshireMax Nathan and Henry G. Overman of the London School of Economics in their recent bookUrban Economics and Urban Policy: Challenging Conventional Policy Wisdom. Virtually all metropolitan areas contain a principal built-up urban area and extensive rural areas (commuting sheds), which may also contain smaller urban areas. Thus, any comparison of metropolitan densities is not an urban comparison, but a mix of urban and rural densities. In most of the few countries that designate metropolitan areas, the rural land areas are substantially greater than the urban land areas. The matter is further complicated by the lack of international “building block” standards for metropolitan areas. These standards produce hugely different mixes of urban and rural in metropolitan areas. For example, the New York urban area represents only 42 percent of the land area. In Riverside-San Bernardino, the principal urban area has 2 percent of the metropolitan land area. In Paris, the land outside the principal urban area represents 83 percent of the metropolitan area. A recent post in the respected Marginal Revolution blog (“China Fact of the Day”) indicated that China’s metropolitan area densities were lower than those of the United States. As noted above, metropolitan density comparisons are not reflective of urban densities. China’s urban densities are nearly five times that of US urban areas (Figure 5).

    Wendell Cox is principal of Demographia, an international public policy and demographics firm. He is a Senior Fellow of the Center for Opportunity Urbanism (US), Senior Fellow for Housing Affordability and Municipal Policy for the Frontier Centre for Public Policy (Canada), and a member of the Board of Advisors of the Center for Demographics and Policy at Chapman University (California). He is co-author of the “Demographia International Housing Affordability Survey” and author of “Demographia World Urban Areas” and “War on the Dream: How Anti-Sprawl Policy Threatens the Quality of Life.” He was appointed to three terms on the Los Angeles County Transportation Commission, where he served with the leading city and county leadership as the only non-elected member. He served as a visiting professor at the Conservatoire National des Arts et Metiers, a national university in Paris.

    Photo by Michael from San Jose, California, USA (Santa Clara Valley – California) [CC BY 2.0], via Wikimedia Commons

  • Urban Containment, Endangered Working Families and Beleaguered Minorities

    Working families and the middle class are becoming an increasingly endangered species in   many parts of United States. Median household income remains below its 1999 peak (inflation adjusted). But the problem is not just stagnant incomes. Expenses are also rising, especially the costs of housing in some cities. As a result, it is becoming more and more difficult to make ends meet.

    Much of this has to do, as explained below, with attempts to stop development on the urban periphery which is indispensable to keeping housing affordable. Such prohibitions have been widely advocated by the  planning establishment. Moreover, a new White House Housing Development Toolkit,  rightly identifies housing unaffordability as an important issue but does not mention the important role of greenfield development in keeping costs down.

    Housing Affordability Problem

    Housing costs are generally responsible for the difference in cost of living between US cities (metropolitan areas). The range between cities in the Bureau of Economic Analysis (BEA) cost of living index (Regional Price Parities) in housing cost is far greater than that of its other two elements — 13 times goods and eight times services other than rents. It is no wonder that households are moving to affordable markets.

    Excessive land use regulation is a major cause of seriously unaffordable housing. Usually, these regulations include urban containment policy, which restricts or even prohibits building middle income detached housing on the urban fringe. As sure as OPEC cutbacks drive up the price of gasoline, urban planning land cutbacks drive up house prices. There is plenty of evidence that the law of supply and demand operates in urban land markets — that restricting the availability of land for development pushes land (Figure 1) and house prices up (See: A Question of Values: Middle-Income Housing Affordability).

    By definition, housing affordability must be measured in relation to incomes. It should also be compared to trends over time both within the metropolitan area (housing market) and between metropolitan areas (See Canada’s Middle-Income Housing Affordability Crisis).

    The most acute problem is in California, where house prices are up to four times those in liberally regulated US metropolitan areas. Before excessive land use regulations were imposed, housing affordability in California, prices relative to incomes, were similar to the rest of the nation, rarely exceeding 3.0 (measured by the “median multiple,” the median house price divided by the median household income).

    There is little comprehension of the seriousness of the housing affordability problem. With serious concerns being raised about income inequality, housing affordability represents one of the most important threats both to the well-being of middle-income households and poverty reduction. More than anywhere in the country, the price of middle income housing is beyond the reach of most middle income California households, including  those who would easily qualify in liberally regulated markets.

    At the same time, middle-income households in other excessively regulated markets, like Seattle, Portland, Denver, Miami, Boston and New York have seen their house prices double (or more) as regulations have been stiffened.  Finally, all of this increases the demand for subsidized housing. While there is plenty of rhetoric about affordable housing for lower income households, there is not and there is not likely to ever be enough money.

    The key issue is the cost of residential land under the house. Average residential land values are at least 75 percent of the house and land value in San Jose and San Francisco (Note 1), 70 percent in Los Angeles and 65 percent in San Diego. Our analysis of Lincoln Institute of Land Policy data indicates that the average house structure in the four California metropolitan areas had an average value is only 25 percent higher than that of the other major metropolitan areas. By contrast, the land value was more than 650 percent higher. It would be too expensive for middle income households to buy vacant residential lots, even if they intended living in tents.

    With such expensive land, there is virtually no hope to restore housing affordability without tackling the issue of land head on. In the meantime, house prices weigh heavily on all households, and many are leaving California, particularly in their mid-thirties and above.

    Lower Income Minorities: African Americans and Hispanics

    The situation for housing is far worse for ethnic groups with lower incomes. The maximum housing affordability disadvantage faced by African Americans and Hispanics is illustrated in the following examples. In the San Francisco MSA, the median value house would cost the equivalent of 9 more years of median African-American income than for Asian or White-Non-Hispanics. This has escalated from 1.3 years before regulations were strengthened. An Hispanic household would need six more years of median income to pay for the median valued house in the San Jose MSA. There also large spreads, both for African-American and Hispanic households in other highly regulated metropolitan areas, such as Los Angeles, San Diego, Portland, Boston and New York (See Figure 2 and Table: Housing Affordability: Overall and by Ethnicity).

    Planning’s “Killer App”

    It is popular to contend that housing affordability can be restored through   building higher densities. There are no examples of restoring metropolitan area housing affordability through intensification. A principal problem is higher prices. A City Sector Model (Figure 3) analysis indicates that the urban core rents per room are well above that of the suburbs (Figure 4). The differences are even greater in cities with the more aggressive intensification programs, such as Portland, Seattle and Los Angeles (Note 3).  Housing units are also smaller (Figure 5). “Granny flats,” basements and apartments are too small for many middle-income households. Forced intensification impairs the quality of life for many people, particularly families (Note 4)

    These policies also have the effect of widening economic divisions. Matthew Rognlie of the Massachusetts Institute of Technology examined French economist Thomas Piketty’s research on rising inequality and concluded that much of the observed inequality stems from housing. He went on to suggest re-examining the land use regulations that create scarcity, toward the end of increasing housing supply. My colleague Hugh Pavletich, co-author of Demographia International Housing Affordability Survey argues that without the “safety valve” of greenfield development, because housing cannot be kept affordable since urban containment destroys the competitive market for land.

    New Zealand consultant Phil Hayward observes: “There might be other policy mixes by which housing supply within a growth boundary could be made the means of keeping housing affordable, but publicly and politically, the debate is nowhere near tackling the complexities involved” (See The Myth of Affordable Intensification).

    Further, large lot or rural zoning is frequently cited as an impediment to housing affordability. This is consistent with economic theory, but its influence is miniscule compared to urban containment (Note 5). The metropolitan areas with substantial large lot zoning had an average price-to-income ratio of 3.0 in 2014, at the upper bound of affordability. This is in contrast with the seriously unaffordable price-to-income ratios (from 5.1 to 9.7) that have urban containment policy . The highest price-to-income ratios are in California’s large metropolitan areas, where there are smaller lot sizes.

    Based on the unparalleled damage they do to housing affordability, urban containment boundaries may be planning’s “killer app.” A principal objective of urban containment policy is to curb the outward expansion of cities (“urban sprawl”). But the “medicine” is far worse than the “cure” — lower standards of living and greater poverty, inflicting particular harm to lower income minorities.

    Necessary Reforms

    Unfortunately, housing affordability has not become an issue in this election year. Yet, policy reforms are appropriate:

    1. Urban containment policy should not be implemented where it has not been adopted.
    2. In urban containment metropolitan areas, improved housing affordability targets should be adopted (price to income ratios), with “event triggered” liberalization of urban fringe land use if the targets are not met. Similar reforms have been proposed in New Zealand and by Paul C. Cheshire, Max Nathan and Henry G. Overman of the London School of Economics.
    Housing Affordability: Overall and By Ethnicity
    Major Metropolitan Areas
    Median Multiple (Years of Median Income Needed to Buy the Median Priced House)
    Additional Years Requried
    All Asians and White Non-Hispanics African Americans Hispanic African Americans Hispanic
    United States 3.5 3.1 5.3 4.3 2.2 1.2
    Atlanta, GA 3.1 2.6 4.1 4.3 1.5 1.8
    Austin, TX 3.6 3.0 4.9 5.0 1.9 2.0
    Baltimore, MD 4.0 3.4 5.7 4.3 2.3 1.0
    Birmingham, AL 3.0 2.6 4.6 3.8 2.0 1.2
    Boston, MA-NH 5.0 4.5 9.3 9.2 4.8 4.7
    Buffalo, NY 2.6 2.3 5.1 5.3 2.8 3.0
    Charlotte, NC-SC 3.2 2.7 4.8 4.3 2.1 1.5
    Chicago, IL-IN-WI 3.6 2.9 6.4 4.5 3.5 1.6
    Cincinnati, OH-KY-IN 2.8 2.6 5.3 3.7 2.8 1.2
    Cleveland, OH 2.8 2.4 4.9 3.9 2.5 1.5
    Columbus, OH 2.9 2.6 4.6 3.7 2.0 1.1
    Dallas-Fort Worth, TX 2.8 2.2 4.1 3.8 1.8 1.5
    Denver, CO 4.5 4.0 7.4 6.3 3.3 2.3
    Detroit,  MI 2.8 2.4 4.7 3.6 2.3 1.2
    Grand Rapids, MI 2.7 2.6 5.2 3.7 2.7 1.1
    Hartford, CT 3.4 3.0 5.4 6.5 2.4 3.6
    Houston, TX 2.7 2.0 4.0 3.6 2.0 1.6
    Indianapolis. IN 2.7 2.4 4.5 4.0 2.1 1.6
    Jacksonville, FL 3.2 2.9 4.8 3.7 2.0 0.9
    Kansas City, MO-KS 2.7 2.5 4.5 3.7 2.0 1.2
    Las Vegas, NV 4.2 3.7 6.0 4.9 2.3 1.2
    Los Angeles, CA 8.6 6.8 12.0 11.1 5.2 4.2
    Louisville, KY-IN 2.9 2.7 4.9 3.4 2.3 0.7
    Memphis, TN-MS-AR 2.9 2.1 4.1 3.5 2.0 1.4
    Miami, FL 4.8 3.8 6.2 5.5 2.4 1.8
    Milwaukee,WI 3.5 3.0 6.9 5.0 3.9 2.0
    Minneapolis-St. Paul, MN-WI 3.3 3.0 7.3 5.1 4.3 2.1
    Nashville, TN 3.3 3.0 5.2 4.2 2.2 1.2
    New Orleans. LA 3.9 3.1 6.0 4.5 3.0 1.5
    New York, NY-NJ-PA 6.0 4.8 8.8 9.2 4.0 4.4
    Oklahoma City, OK 2.8 2.5 4.5 3.4 2.0 0.9
    Orlando, FL 3.4 2.9 4.4 4.3 1.5 1.4
    Philadelphia, PA-NJ-DE-MD 3.7 3.1 6.2 5.8 3.1 2.8
    Phoenix, AZ 3.9 3.5 5.4 5.2 1.9 1.7
    Pittsburgh, PA 2.6 2.5 5.4 3.4 2.9 0.9
    Portland, OR-WA 4.7 4.5 8.7 6.0 4.2 1.5
    Providence, RI-MA 4.3 4.0 6.7 7.6 2.7 3.7
    Raleigh, NC 3.4 2.9 5.1 5.7 2.1 2.7
    Richmond, VA 3.6 3.0 5.4 4.1 2.4 1.1
    Riverside-San Bernardino, CA 5.3 4.7 6.6 6.0 1.8 1.3
    Rochester, NY 2.6 2.3 4.6 4.5 2.3 2.2
    Sacramento, CA 5.4 4.9 8.4 6.8 3.6 1.9
    St. Louis,, MO-IL 2.9 2.6 4.9 3.5 2.3 0.9
    Salt Lake City, UT 3.8 3.6 6.2 5.3 2.6 1.7
    San Antonio, TX 2.7 2.2 3.1 3.3 0.9 1.1
    San Diego, CA 7.2 6.2 9.3 9.5 3.1 3.3
    San Francisco, CA 8.1 6.9 15.8 11.6 8.8 4.7
    San Jose, CA 8.1 6.9 11.6 12.7 4.7 5.8
    Seattle, WA 4.8 4.4 7.8 7.0 3.4 2.6
    Tampa-St. Petersburg, FL 3.4 3.2 4.7 4.0 1.5 0.8
    Tucson, AZ 3.5 3.1 5.0 4.2 1.8 1.1
    Virginia Beach-Norfolk, VA-NC 3.9 3.4 5.7 4.7 2.3 1.3
    Washington, DC-VA-MD-WV 4.3 3.6 5.9 5.8 2.3 2.2
    Data from American Community Survey: 2015
    AFFORDABILITY RATINGS    
    Affordable 3.0 or below
    Moderately Unaffordable 3.1 to 4.0
    Seriously Unaffordable 4.1 to 5.0
    Severely Unaffordable   5.1 and over


    Note 1: Commentators sometimes suggest the high housing prices in the San Francisco Bay Area are the result of land shortages created by topographic constraints, such as bodies of water and mountains. In fact, there is plenty of developable land in the Bay Area, which includes both the San Francisco and San Jose MSAs (See: The Incompatibility of Forced Densification and Housing Affordability).

    Note 2: This is without considering subsidies and tax breaks that can reduce some rents below market levels.

    Note 3: African American 1969 median household is estimated based on the variation in African American median family income from the overall median in that year. Median household income data was not published for ethnicities in the 1970 census. 

    Note 4: The planning establishment sometimes glosses over the reduced quality of life entailed in its efforts to discourage detached housing and force people into higher density housing. This is not their job. The quality of life can only be judged by households themselves.

    Note 5: Boston is an exception, which is the only seriously unaffordable major metropolitan area without urban containment policy. Boston has large lot zoning so expansive that it has created a severe shortage of land for development, with urban containment-like effects on house prices. Boston’s urbanization covers nearly as much land area as the Tokyo urban area, despite having only one-seventh the population. (See: The Evolving Urban Form: Sprawling Boston).

    Photo: Market Street, San Francisco, looking toward the Ferry Building (by author)

    Wendell Cox is principal of Demographia, an international pubilc policy and demographics firm. He is a Senior Fellow of the Center for Opportunity Urbanism (US), Senior Fellow for Housing Affordability and Municipal Policy for the Frontier Centre for Public Policy (Canada), and a member of the Board of Advisors of the Center for Demographics and Policy at Chapman University (California). He is co-author of the “Demographia International Housing Affordability Survey” and author of “Demographia World Urban Areas” and “War on the Dream: How Anti-Sprawl Policy Threatens the Quality of Life.” He was appointed to three terms on the Los Angeles County Transportation Commission, where he served with the leading city and county leadership as the only non-elected member. He served as a visiting professor at the Conservatoire National des Arts et Metiers, a national university in Paris.

  • The Evolving American Central Business District

    After decades of serious economic decline, the inner cores in many of America’s largest metropolitan areas have experienced much improvement in recent years. This is indicated by the “City Sector Model,” (Image 9) which we developed to analyze the largest cities (metropolitan areas) using small functional areas, ZIP Code calculation areas (ZCTAs). The 2015 update to the City Sector Model added a fifth broad category of urbanization, when the Urban Core was divided into the Urban Core: CBD, and the Urban Core: Inner Ring (hereinafter referred to as CBD and Inner Ring).

    The CBDs have far higher densities of employment and population than the surrounding Inner Rings that surround them. The largest CBDs are nearly all products of the pre-World War II period, when metropolitan employment was more concentrated. Overall both the CBD and the Inner Ring are more similar than not, with higher densities than the suburban and exurban sectors and with greater use of transit, walking and bicycles in commuting. In contrast, the suburban and exurban areas have near universal use of automobiles.

    This article includes analysis of the Urban Core: CBD (CBD) using the latest data from the American Community Survey for 2010 to 2014 (Note 1), with a middle year of 2012. The defining feature of the CBD is high employment densities. The City Sector Model uses employment densities of 20,000 and greater for designation of the CBDs. There are other dense employment centers in metropolitan areas, such as the “edge cities,” but they tend to be characterized by less concentrated development with their buildings, including high-rises, separated by green spaces and parking lots (Image 1). CBDs, on the other hand, typically have their high-rise buildings adjacent to street oriented sidewalks, with less space between the buildings (Image 2).


    Population Trends

    Since 2000, the CBDs have added approximately nine percent to their population. The CBD population growth rate largely tracked the overall metropolitan area growth rate. Critically, these remain a very small part of the urban population. Some 1.3 percent of the metropolitan population lived in the CBD in 2000, a figure that remained virtually the same in 2012.

    This growth rate, however, was not sustained throughout the Urban Core, which includes the much larger Inner Ring. The Inner Ring, which includes 91 percent of the Urban Core population, grew only 0.3 percent. The much larger Inner Ring drops the Urban Core growth rate down to only 0.9 percent, far below the 9 percent in the CBD component.  The other functional sectors grew faster, from two percent in the Earlier Suburbs to 39 percent in the Later Suburbs.

    Becoming More Residential

    Historically largely business districts, CBDs are becoming much more residential. Old, largely abandoned commercial buildings have been converted to new apartments and condominiums. In some places, there is new residential construction. There are new restaurants and other amenities that are associated with vibrant residential areas. There is more of a look of prosperity.

    Indeed, it may be surprising, given these developments that CBDs have not grown more. The net effect is that of the nearly 20 million new major metropolitan area residents added since 2000, less than 0.1 percent have been in the CBDs. However, as some people have moved in, others have moved out (Note 2).

    The growth in CBD population has been dominated by higher income ethnicities (Image 3). While the CBDs were adding 175,000 residents, the growth in Asian and White-Non-Hispanic residents was 215,000. African-American population declined more than 50,000, while Hispanic population edged up less than 10,000.

    Astoundingly, the CBDs, with barely one percent of the population, have attracted 32 percent of the major metropolitan White-Non-Hispanic growth. The 135,000 growth in White-Non-Hispanics compared to their slow, overall growth of 435,000. The share of the population growth among African-Americans, Asians and Hispanics in the CBDs has been far less (Image 4).

    Trends in the Inner Ring have been much different. There has been an exodus of approximately 600,000 of both white non-Hispanics and African-Americans. This has been somewhat more than offset by increases in the Asian and Hispanic population. Since 2000, Inner Ring has gained approximately 150,000 residents, somewhat less than the 175,000 gain in the CBDs (Image 5).

    The CBD Employment Market

    Another defining feature of CBDs is a huge imbalance between employed residents and jobs. The most recent data indicates that the CBD boasts  nearly six jobs for every employed resident. Elsewhere in the metropolitan areas there was a much closer balance between jobs and resident workers (Image 6).

    This huge excess of jobs provides a rich employment market for residents. This and the growth in higher income ethnicities have combined to make the CBDs the most affluent sector in the major metropolitan areas by 2012, at nearly $77.300. This compares to the overall median household income of $64,800, the second ranking $74,900 in the Later Suburbs and the $51,600 in the Inner Ring. The median household income in the Inner Ring was by far the lowest (Image 7).

    Overall, as we speak about the core, the lower incomes of the Inner Ring dwarf the higher incomes in the CBD. Overall, the Urban Core (including the CBD and Inner Ring) median household income is $54,400, approximately 30 percent below that of the CBD (Image 8), and well below incomes in the suburbs, exurbs and metropolitan area as a whole.

    Assessing CBD Progress

    The CBDs have made significant progress. This is an important development because they, like other sectors of the city, best play their part as vibrant and healthy areas, rather than the depressed places that they used to be. They have attracted many younger people (Millennial age).

    In context, however, the progress in the CBD has been more symbolic than substantive. The CBD is not a model for what the rest of the metropolitan area. It cannot be. Metropolitan areas are labor markets. This means that they have a jobs to resident worker ratio of approximately 1.0. By definition, labor markets cannot have six times as many jobs as employees. Even with their impressive attraction of younger people, more than 97 percent of Millennial population growth since 2000 has been outside the CBDs.

    CBD population growth has been impressive, but small in relation to the metropolitan area. When combined with the much larger urban core component, the Inner Ring, its income advantage and demographic dynamism fades. Reviving the CBDs is a good thing. But the much larger Inner Ring needs revival as well.

    The bottom line:  the city is better off when all of its component parts are healthy, from the core to the exurbs.

    Note 1: This is the latest available data for small areas and was collected from 2010 to 2014. Thus, approximately one-fifth of the data was collected in each of the five years. For convenience, this article refers to the data as being reflective of 2012 (the middle year).

    Note 2: The ethnic analysis is based on one-race and Hispanic data. This represents 98 percent of the major metropolitan area population.

    Wendell Cox is principal of Demographia, an international public policy and demographics firm. He is a Senior Fellow of the Center for Opportunity Urbanism (US), Senior Fellow for Housing Affordability and Municipal Policy for the Frontier Centre for Public Policy (Canada), and a member of the Board of Advisors of the Center for Demographics and Policy at Chapman University (California). He is co-author of the "Demographia International Housing Affordability Survey" and author of "Demographia World Urban Areas" and "War on the Dream: How Anti-Sprawl Policy Threatens the Quality of Life." He was appointed to three terms on the Los Angeles County Transportation Commission, where he served with the leading city and county leadership as the only non-elected member. He served as a visiting professor at the Conservatoire National des Arts et Metiers, a national university in Paris.

    Photo: Kansas City CBD (by author)

  • Suburbs (Continue to) Dominate Jobs and Job Growth

    Data released by the federal government last week provided additional evidence that the suburbs continue to dominate metropolitan area population growth and that the biggest cities are capturing less of the growth than they did at the beginning of the decade. The new 2015 municipality population estimates from the Census Bureau indicated that virtually all of the 15 fastest growing municipalities with more than 50,000 residents were suburbs, and five were in Texas (See Census Bureau poster, Figure 1). Further, in the major metropolitan areas (more than 1,000,000 population), nearly 75 percent of the population growth was in outside the historical core municipalities (the suburbs as defined by municipal jurisdiction).

    But that’s only half of the story. The suburbs and exurbs also continue to dominate employment and employment growth, according to the annual County Business Patterns data. County Business Patterns is a particularly effective measure of genuine job location preferences (both employers and employees), since it largely provides data for private employment.

    Analysis of the data using the City Sector Model indicates that both over the longer and shorter term, the outer reaches of US metropolitan have been more than holding their own in employment growth.

    The City Sector Model

    The City Sector Model classifies small areas (zip codes) of major metropolitan areas by their urban function (lifestyle). The City Sector Model includes five sectors (Figure 2). The first two are labelled as “urban core,” replicating the urban densities and travel patterns of pre-World War II US cities, although these likely fall short of densities and travel behavior changes sought by contemporary urban planning (such as Plan Bay Area). There are two suburban sectors, earlier and later. The fifth sector is the exurbs, outside the built-up urban area. The principle purpose of the City Sector Model is to categorize metropolitan neighborhoods based on their intensity of urbanization, regardless of whether they are located within or outside the boundaries of the historical core municipality (Note).

    Most Jobs are Outside the Urban Core

    The 2014 data indicates that more than 80 percent of employment in the nation’s major metropolitan areas is in functionally suburban or exurban areas (Figure 3). The earlier suburbs have the largest share of employment, at 44 percent. The later suburbs and exurbs combined have 37.0 percent, while the urban cores have 18.9 percent, including the 9.1 percent in the downtown areas (central business districts, or CBDs).

    These numbers reveal dispersion since 2000. Then, the earlier suburbs had even more of the jobs, at 49.4 percent, 5.3 percentage points higher than in 2014. Virtually all of the lost share of jobs in the earlier suburbs was transferred to the later suburbs and exurbs, which combined grew from 31.4 percent in 2000 to 37.0 percent in 2014. The urban cores had 19.4 percent of the jobs (8.8 percent in the CBDs), slightly more than the 18.9 percent in 2014 (Figure 4).

    Things have been much more stable since 2010, with a small loss in the earlier suburbs (-1.1 percentage points), a small gain in the urban core (plus 0.1 percentage points), which includes a 0.3 percentage point gain in the CBDs. The later suburbs gained 1.0 percentage points, while the exurbs held the same share as in 2010 (Figure 5).

    Most Jobs Growth Since 2010 has been Outside the Urban Core

    Between 2010 and 2014, more than 80 percent of the employment growth was in the suburbs and exurbs (Figure 6), approximately the same figure as their overall combined share of employment. The later suburbs have added more than their employment share since 2010 (39.7 percent compare to 24.8 percent), while the earlier suburbs and the exurbs have added a smaller percentage compared to their 2010 share of jobs (30.8 percent versus 45.2 percent and 10.6 percent versus 11.2 percent, respectively).

    In the last year (2013 to 2014), the data has remained similar, with smaller changes in the same direction as before (Figure 7). The earlier suburbs experienced a small loss (0.3 percentage points), while the later suburbs gained 0.2 percentage points, the exurbs gained 0.1 percentage points and the urban cores remained constant (including no change in the CBDs).

    Where the Jobs are By Urban Sector

    There is substantial variation in the distribution of jobs within metropolitan areas.

    Not surprisingly, the largest urban core job concentrations are in the metropolitan areas with older and larger core municipalities. Nearly 52 percent of the employment in the New York metropolitan area is in the urban core, which includes the nation’s largest central business district. Chicago, Washington, Boston and San Francisco, with the next four largest CBDs (though all small compared to New York) also rank among the 10 metropolitan areas with the greatest employment share in their urban cores (Figure 8). Only 16 of the 52 major metropolitan areas had more than 20 percent of their employment in urban cores (36 had 80 percent or more of their employment in the suburbs or exurbs).

    The metropolitan areas with greater job concentration in the earlier suburbs typically experienced more of their growth in the decades immediately following World War II. Hartford has the largest share of employment in the earlier suburbs, at 81.7 percent (Figure 9). Los Angeles, perhaps the original polycentric city, ranks second, at 72.3 percent. This list also includes Rust Belt metropolitan areas that have either grown little or lost population (Detroit, Cleveland, Pittsburgh and Buffalo).

    The metropolitan areas that have had the greatest recent population growth dominate in later suburban and exurban employment (Figure 10). More than 82 percent of Raleigh’s employment is in the later suburbs and exurbs. All but one of the 10 metropolitan areas with the largest job share in the later suburbs and exurbs were among the 15 fastest growing in terms of overall population between 1980 and 2010. The one exception is Grand Rapids, which ranked 27th in growth from 1980 to 2010.

    Balanced Metropolitan Areas

    The meme that people were moving back to the city (urban core) has been with us for decades. For just as long, there have been virtually no reality to the narrative. . The overwhelming share of the population lives and works the suburbs and exurbs. This is where both population growth continues and job growth is concentrated. One fortunate result is metropolitan areas with remarkable balances between home and employment locations, and among the shortest work trip travel times in the world.

    ——

    Note: In some cases the functional urban core extends beyond the boundaries of the historical core municipality (such as in New York and Boston). In other cases, there is virtually no functional urban core (such as in San Jose or Phoenix). Functional urban cores accounted for 14.7 percent of the major metropolitan area population in 2012. By comparison, the jurisdictional urban cores (historical core municipalities) had 26.6 percent of the major metropolitan population, many consisting of large tracts of functional suburban development.

    Wendell Cox is principal of Demographia, an international pubilc policy and demographics firm. He is a Senior Fellow of the Center for Opportunity Urbanism (US), Senior Fellow for Housing Affordability and Municipal Policy for the Frontier Centre for Public Policy (Canada), and a member of the Board of Advisors of the Center for Demographics and Policy at Chapman University (California). He is co-author of the "Demographia International Housing Affordability Survey" and author of "Demographia World Urban Areas" and "War on the Dream: How Anti-Sprawl Policy Threatens the Quality of Life." He was appointed to three terms on the Los Angeles County Transportation Commission, where he served with the leading city and county leadership as the only non-elected member. He served as a visiting professor at the Conservatoire National des Arts et Metiers, a national university in Paris.

    Photograph: Suburban fringe, St. Louis (by author)

  • 2010-2012: More Modest Dispersion Within Metropolitan Areas

    American cities seemed to be re-centralizing in the years immediately following the Great Recession, but new American Community Survey data indicates that, contrary to conventional wisdom, Americans continue to disperse though at a much reduced rate. The Census Bureau has just released the five year American Community Survey (2010-2014) small area data used by the City Sector Model to report on population trends within functional sectors of metropolitan areas. The City Sector Model classifies small areas as the urban core, suburban or ex-urban without reference to the more traditional analysis method that relied on core cities and suburbs (Note 1). The principal purpose is to compare finer-grained data and trends in parts of the metropolitan area that are more reflective of pre-World War II urban forms and lifestyles (the Urban Core: CBD and the Urban Core Ring) and the balance of the metropolitan area, which is automobile oriented (the Earlier Suburbs, Later Suburbs and Exurbs).

    These data were collected over a five year period, with the middle year being 2012. General trends can be examined in comparison to the 2008-2012 American Community Survey, with a middle year of 2010. At the same time, caution is warranted since the American Community Survey is not a count, such as is collected in the decennial censuses. For simplicity, this article refers to the 2010 to 2014 data as 2012 and the 2008 to 2012 data as 2010.

    More Modest Dispersion

    The continuing dispersion was most evident in the rising 0.4 percentage point share (from 26.9% to 27.3%) in the Later Suburbs – with mid-point construction dates of 1980 or later. Two of the other four functional city sectors experienced declines in their shares, with the higher density, transit-, walking- and cycling-oriented Urban Core Ring dropping from 13.5% to 13.4% and the Earlier Suburbs dropping from 41.9% to 41.6% of the major metropolitan population. The earlier suburbs are automobile oriented and have houses with median construction dates of 1946 through 1979. The Urban Core CBD sector and the exurbs have retained their previous share of the population since 2010 (Figure: Growth Share by City Sector: 2010-2012 and Population Share by City Sector).

    Overall the Urban Core, which consists of the CBD and Ring dropped from 14.8% of the population to 14.7%. If this rate were to continue through the 2020 census, the Urban Core share of the major metropolitan area population would drop by 0.5 percentage points, considerably less than the 1.7 percentage point loss between 2000 and 2010. Nonetheless, the suburbs and exurbs accounted for nearly 90% of the growth between 2010 and 2012 (Figure: Population by City Sector). Suburbia, even exurbia, is where the growth is

    The new data also suggests that much of that growth was in the suburban areas of the historical core municipalities (newer and automobile oriented). For example, large areas of core cities are functionally suburban, such as in Phoenix, Dallas, Los Angeles, Portland, Atlanta, Charlotte, and elsewhere.

    The bottom line , as we have indicated in previous articles, is this: the data shows virtually no “return to the city.” Between 2010 and 2012 the suburbs and exurbs gained 3.5 million residents, while the Urban Cores gained 400,000. The Exurbs alone gained more population than the Urban Core (CBD and Ring combined). This has also been evident in each year of this decade by the continuing domestic migration to suburban and exurban counties, which has exceeded that of counties that contain the urban cores.

    New York, Other Legacy Cities and the Balance

    There is considerable variation in the size and growth of Urban Cores among the major metropolitan areas. The Urban Cores in the “legacy cities” are far larger and are capturing a far higher share of their metropolitan area growth. The legacy cities are the six metropolitan areas that have downtowns (central business districts or CBD’s) with more than 200,000 jobs (New York, Chicago, Philadelphia, San Francisco, Boston and Washington), These are generally older cities and the strength of their Urban Cores is illustrated by the fact that, combined, the core cities of these metropolitan areas account for 55% of the destinations of transit committing trips in the nation.

    Even among the legacy cities, strong distinctions exist. New York, with central business district employment of nearly 2 million, has nearly 4 times the jobs that of its Chicago counterpart. Indeed, New York’s central business district employment exceeds that of the combined employment in the downtowns other five legacy cities. Thus, as in other indicators of intense urbanism (such as transit ridership and the share of the national transit ridership increase), New York is in a “league” of its own.

    As of 2012, New York’s Urban Core included approximately 53% of the metropolitan area population. This is more than double the 26% share of the metropolitan population in the urban cores of Chicago, Philadelphia, San Francisco, Boston and Washington (Figure Legacy Cities and Others: Population).

    The difference between the legacy cities and the other 46 metropolitan areas is even more stark. On average, other metropolitan areas have on average only approximately seven percent of their populations in their urban cores, compared to 53 percent in New York and 26 percent in the other five.

    There are even greater disparities in population growth. Between 2010 and 2012, 73% of the population growth in the New York metropolitan area was in the Urban Core. This is 2.7 times the average 27% of metropolitan growth in the urban cores of the other five legacy cities. Thus, by two measures, population concentration and population growth in the urban cores, Chicago, Boston and the other legacy cities cannot even present themselves as “little New York’s”.

    Most other cities are not even in the same league as Chicago or Boston. None achieved a 20 percent Urban Core growth percentage, though St. Louis was close (19.8 percent), and Seattle was next (15.0 percent). The urban core growth in the other 46 cities was less than 6% (Figure Legacy Cities and Others: Growth). Even in Portland, with its strong densification policies biased toward urban core development and discouraging towards suburban development, no more than average 10% of its growth took place in its Urban Core. Nearly 90 percent of Portland’s growth was in the suburbs and exurbs.

    Back to Normalcy?

    The 2010-2012 data does not indicate a return to the near monopoly on growth enjoyed by the suburbs and exurbs in the 1990s and 2000s. But more recent data suggests stronger suburban performance, as chronicled by William Frey at the Brookings Institution and Jed Kolko at Trulia. At the same time, it is good to see the upward trends in the in the urban cores, which as metropolitan areas as diverse as St. Louis and Seattle show, do not depend on suburban misfortune to prosper. The cores are an important part of a healthy metropolitan system, although in most places they are far smaller in population, and growth, than the suburban rings.

    Note: The “City Sector Model” provides data for areas (Zip Code Analysis Zones) within metropolitan areas, as opposed to data based on jurisdictional boundaries, such as city limits. The data is based on small areas, Zip Code Tabulation Areas (ZCTA’s). The criteria for classification is indicated in the Figure: City Sector Model Criteria.

    Wendell Cox is Chair, Housing Affordability and Municipal Policy for the Frontier Centre for Public Policy (Canada), is a Senior Fellow of the Center for Opportunity Urbanism (US), a member of the Board of Advisors of the Center for Demographics and Policy at Chapman University (California) and principal of Demographia, an international public policy and demographics firm.He is co-author of the "Demographia International Housing Affordability Survey" and author of "Demographia World Urban Areas" and "War on the Dream: How Anti-Sprawl Policy Threatens the Quality of Life." He was appointed to three terms on the Los Angeles County Transportation Commission, where he served with the leading city and county leadership as the only non-elected member. He served as a visiting professor at the Conservatoire National des Arts et Metiers, a national university in Paris.

    Photo: New York’s Growing Skyline by Citizen59 (Own work) [CC BY 3.0], via Wikimedia Commons

  • Growth Concentrated in Most Suburbanized Core Cities

    An analysis of the just-released municipal population trends shows that core city growth is centered in the municipalities that have the largest percentage of their population living in suburban (or exurban) neighborhoods.

    Improved Urban Core Analysis

    There is considerable interest in urban core population trends, both because of recent increases in the interest of urban planning orthodoxy to restore living patterns more akin to the pre-World War II era. At that time, urban areas were considerably more densely populated, commuting travel was much more focused on downtowns (central business districts or CBDs) and automobile use accounted for far less of urban travel than today.

    Most previous analysis has equated historical core municipality (core city) data with the urban core. The core cities are generally the original settlements, as they have evolved by expanding their city limits. Around these core cities, suburbs and exurbs have developed, which combined with the core cities make up the metropolitan area. Metropolitan areas are the "economic" dimension of contemporary cities.

    However, even the most cursory analysis demonstrates that equating core cities with the urban core is far from ideal. Historical core municipalities vary greatly in their percent of their population living in traditional high density neighborhoods. For example, in core cities like New York, Boston and San Francisco, nearly all people live in neighborhoods that can be classified as urban core. In others of the largest core cities, virtually all of the population lives in neighborhoods that are suburban or exurban, in view of their low densities and overwhelming automobile orientation. These include examples like San Antonio, Phoenix and San Jose. Even core cities perceived to have a strong urban core, such as Portland and Miami, have considerably less than 50% of their population in urban core neighborhoods.

    Overall, historical core municipalities have little more than 40% of their population living in urban core neighborhoods. When non-core principal cities or primary cities are equated with core cities, there is even less association with the urban core. Overall, non-core principal cities have less than 10% of their population living in urban core neighborhoods.

    This has changed in recent years, with the introduction of the annual American Community Survey and its small area data, such as for ZIP Code analysis zones (ZCTAs). Even so, the comprehensive publication of small area data tends to lag approximately three years behind population estimates. Thus, the small area data that would make it possible to compare population trends to 2014 by functional urban sector within core cities will not be released until 2017.

    This article classifies 2010 to 2014 core city population growth by the percentage of urban core population according to the 2010 census. The classification was developed using my City Sector Model, which classifies every zip code in metropolitan areas as pre-War urban core (CBD and inner ring) or post-War suburban or exurban (Figure 1). Simplified, the City Sector Model classifies as urban core any small area with an employment density of 20,000 per square mile or more or a population density of 7,500 per square mile or more, with a transit, cycling and walking work trip market share of 20% or more (Note).

    Growth by Extent of Urban Core Population

    More than 50% of the growth between 2010 and 2014 has been in core municipalities that are more than 90% post World War II suburban or exurban (0 to 10% urban core). This growth share is nearly one-half higher than their population share of 35%.

    These findings are based on the City Sector Model (Figure 1 and Note), which classifies small areas (zip code tabulation areas) principally using population density and commuting market share data that attempts to replicate urban areas as they functioned before World War II.

    These most suburban of core cities grew the fastest, up 6.8% from 2010 to 2014. These municipalities had less than 10% of their population in urban core neighborhods, and include core cities that annexed substantial suburban or rural territory, such as Phoenix, San Jose, Charlotte, Tampa, Orlando and San Antonio. Those that were most heavily urban core in form grew 4,0 percent, which was slightly behind the national average of 4.7 percent. The core cities had less than 10% of their population living in urban core neighborhoods, and include New York, Buffalo, Providence, San Francisco and Boston (Figure 2)  

    The functionally suburban and exurban areas accounted for approximately 58% of the population in the core cities. This leaves approximately 42% of the population living in areas that are similar to the urban areas as they functioned in 1940.

    Approximately 70% of the growth was in the 33 historical core municipalities that are more than 60% suburban or exurban.

    At the same time, the five core cities with the largest urban core percentages accounted for nearly 20% of the growth, compared to their 22 percent of the population. Approximately 80% of this growth was in New York, which is estimated to have added the largest population (316,000) among the core cities.

    Ten Fastest Growing Core Municipalities

    Six of the ten fastest growing core cities had urban core shares of less than 10%, including Austin, Orlando, Charlotte, Raleigh, Atlanta and San Antonio. A seventh, Denver was less than 15% urban by function. Two more had more than 50% in urban core population, Washington and Seattle (Table). Eight of the 10 fastest growing core cities were in the South, including Washington.

    Table
    Population Growth: 2010-2014
    Core Municipalities in Major Metropolitan Areas
    Population Population in Pre-War Functional Urban Core
    Rank Historical Core Municipality Metropolitan Area 2010 2014 % Change Historical Core Municipality Metropolitan Area
    1 Austin Austin, TX     790,637      912,791 15.5% 4.8% 2.2%
    2 New Orleans New Orleans. LA     343,829      384,320 11.8% 37.9% 10.9%
    3 Denver Denver, CO     600,024      663,862 10.6% 13.1% 3.1%
    4 Orlando Orlando, FL     238,304      262,372 10.1% 0.0% 0.0%
    5 Charlotte Charlotte, NC-SC     735,780      809,958 10.1% 0.0% 0.0%
    6 Seattle Seattle, WA     608,660      668,342 9.8% 52.6% 10.5%
    7 Washington Washington, DC-VA-MD-WV     601,723      658,893 9.5% 83.7% 16.5%
    8 Raleigh Raleigh, NC     403,947      439,896 8.9% 0.0% 0.0%
    9 Atlanta Atlanta, GA     420,279      456,002 8.5% 9.2% 0.7%
    10 San Antonio San Antonio, TX  1,327,605   1,436,697 8.2% 0.1% 0.1%
    11 Miami Miami, FL     399,508      430,332 7.7% 23.0% 3.0%
    12 Oklahoma City Oklahoma City, OK     580,003      620,602 7.0% 6.1% 2.8%
    13 Dallas Dallas-Fort Worth, TX  1,197,833   1,281,047 6.9% 1.1% 0.5%
    14 Tampa Tampa-St. Petersburg, FL     335,709      358,699 6.8% 0.0% 0.0%
    15 Houston Houston, TX  2,097,217   2,239,558 6.8% 1.4% 0.5%
    16 Nashville Nashville, TN     603,527      644,014 6.7% 0.7% 0.2%
    17 Richmond Richmond, VA     204,237      217,853 6.7% 26.0% 4.5%
    18 San Jose San Jose, CA     952,562   1,015,785 6.6% 0.1% 0.2%
    19 Minneapolis Minneapolis-St. Paul, MN-WI     382,578      407,207 6.4% 86.0% 0.0%
    20 Boston Boston, MA-NH     617,594      655,884 6.2% 90.4% 35.5%
    21 Phoenix Phoenix, AZ  1,447,552   1,537,058 6.2% 0.0% 0.0%
    22 San Diego San Diego, CA  1,301,621   1,381,069 6.1% 2.8% 1.2%
    23 Portland Portland, OR-WA     583,778      619,360 6.1% 37.9% 10.0%
    24 Columbus Columbus, OH     788,577      835,957 6.0% 12.0% 5.0%
    25 Oakland San Francisco-Oakland, CA     390,719      413,775 5.9% 54.7% 0.0%
    26 San Francisco San Francisco-Oakland, CA     805,235      852,469 5.9% 94.4% 0.0%
    27 Las Vegas Las Vegas, NV     583,787      613,599 5.1% 7.8% 2.8%
    28 Stl Paul Minneapolis-St. Paul, MN-WI     285,068      297,640 4.4% 38.7% 0.0%
    29 Sacramento Sacramento, CA     466,488      485,199 4.0% 7.6% 1.6%
    30 New York New York, NY-NJ-PA  8,175,136   8,491,079 3.9% 97.3% 52.8%
    31 Jacksonville Jacksonville, FL     821,784      853,382 3.8% 0.0% 0.0%
    32 Los Angeles Los Angeles, CA  3,792,627   3,928,864 3.6% 30.1% 10.6%
    33 Indianapolis Indianapolis. IN     820,442      848,788 3.5% 11.0% 4.8%
    34 Grand Rapids Grand Rapids, MI     188,040      193,792 3.1% 19.1% 3.8%
    35 Louisville Louisville, KY-IN     597,336      612,780 2.6% 17.8% 8.7%
    36 San Bernardino Riverside-San Bernardino, CA     209,952      215,213 2.5% 0.0% 0.0%
    37 Kansas City Kansas City, MO-KS     459,787      470,800 2.4% 19.8% 5.4%
    38 Salt Lake City Salt Lake City, UT     186,443      190,884 2.4% 21.4% 3.7%
    39 Philadelphia Philadelphia, PA-NJ-DE-MD  1,526,006   1,560,297 2.2% 86.1% 25.8%
    40 Memphis Memphis, TN-MS-AR     646,889      656,861 1.5% 3.7% 1.8%
    41 Norfolk Virginia Beach-Norfolk, VA-NC     242,803      245,428 1.1% 2.8% 0.4%
    42 Chicago Chicago, IL-IN-WI  2,695,598   2,722,389 1.0% 76.6% 25.8%
    43 Milwaukee Milwaukee,WI     594,740      599,642 0.8% 55.4% 23.6%
    44 Providence Providence, RI-MA     178,036      179,154 0.6% 92.6% 26.2%
    45 Cincinnati Cincinnati, OH-KY-IN     296,950      298,165 0.4% 54.2% 10.1%
    46 Baltimore Baltimore, MD     620,961      622,793 0.3% 67.7% 16.2%
    47 Birmingham Birmingham, AL     212,288      212,247 0.0% 0.0% 0.0%
    48 Hartford Hartford, CT     124,775      124,705 -0.1% 88.5% 11.3%
    49 Pittsburgh Pittsburgh, PA     305,702      305,412 -0.1% 78.0% 15.9%
    50 Rochester Rochester, NY     210,512      209,983 -0.3% 51.7% 11.4%
    51 St. Louis St. Louis,, MO-IL     319,294      317,419 -0.6% 84.1% 11.7%
    52 Buffalo Buffalo, NY     261,310      258,703 -1.0% 96.0% 29.2%
    53 Cleveland Cleveland, OH     396,814      389,521 -1.8% 80.1% 22.2%
    54 Detroit Detroit,  MI     713,777      680,250 -4.7% 32.1% 6.5%
    Data from:
    US Census Bureau
    City Sector Model (2015)


    Austin has been the fastest growing historical core municipality over the four years. In 2010, Austin had 790,000 residents, and has increased 15.5% to 913,000.

    New Orleans was the second fastest growing, adding 11.8%, continuing its recovery from the huge population loss after Hurricanes Katrina and the related flood control failures, which the Independent Levee Investigation Team concluded was the "single most costly catastrophic failure of an engineered system in history." New Orleans has now recovered more than 70% of its population loss between 2005 and 2006. In 2005, the population was 455,000, which fell to 209,000 in 2006, before recovering to the 2014 figure of 384,000.

    The balance of the top five, Denver, Orlando and Charlotte also grew more than 10% between 2010 and 2014. The second five in population growth were Seattle, Washington (DC), Raleigh, Atlanta and San Antonio.

    Slowest Growing Core Municipalities

    Eight of the 10 slowest growing municipalities were in the Northeast and Midwest, including Detroit, Cleveland, Buffalo, St. Louis, Rochester, Pittsburgh, Hartford and Cincinnati. Two were in the South, Birmingham and Baltimore.

    Eight core municipalities lost population. The largest loss was in Detroit, which fell 4.7% to 680,000. This is a continuation of the catastrophic losses from 1950, when Detroit had 1,850,000 residents. It may be surprising, however, that Detroit has become the core municipality with the greatest loss only this year. Until 2013, St. Louis had lost the largest share of its population from 1950 (when its population was 857,000). By 2014, Detroit had lost 63.2% of its 1950 population, compared to the 63.0% loss in St. Louis). St. Louis also continued its losses, dropping 0.6% between 2010 and 2014.

    Cleveland and Buffalo had greater losses than St. Louis. Cleveland slipped 1.8% to 390,000, while Buffalo dropped 1.0% to 259,000. Losses of less than 0.5% were posted in Pittsburgh, Hartford and Birmingham.

    More-than-a-Million Municipalities

    The United States added its 10th municipality with more than 1,000,000 in the 2014 estimates. San Jose joins Los Angeles and San Diego as California’s third more-than-a-million city. As a result, California now equals Texas, which had led the nation, with three cities with more than 1,000,000 residents in previous years (Houston, San Antonio and Dallas).

    Texas, however, should soon reclaim the exclusive title. The city of Austin forecasts that its population will reach 1,000,000 population early in the 2020s, which would give Texas four more-than-a-million municipalities. This forecast, however, could be too conservative. If the Texas city continues to grow at its current rate, a population of more than 1,000,000 could be reached before the 2020 census.

    Yet, the core municipalities with more than 1,000,000 – particularly the new entrants – are not particularly dense, but are virtually suburban in form, that is, auto-oriented and generally low density.  Three have less than one percent of their population in urban core neighborhoods, including Phoenix, San Antonio and San Jose, Dallas and Houston have less than two percent of their population in urban core neighborhoods, while San Diego has less than three percent. Even in Los Angeles only 30% of residents live in urban core neighborhoods. Only three of the largest municipalities have most of their population in urban core neighborhoods, New York, (97%), Philadelphia (86%) and Chicago (77%).  

    Lower Density Growth Could be Dominant in Core Cities

    The new population estimates provide little indication how much core city growth since 2010 is urban intensification versus low density suburban development. However, the concentration of growth where urban cores are smaller implies that growth has been stronger at lower in the suburban portions of core municipalities. To know for sure will require waiting for later small area data.

    Related article: U.S. Population Estimate Accuracy: 2010

    Note: The analysis is based on the City Sector Model (Figure 1), which classifies small areas (ZIP codes, more formally, ZIP Code Tabulation Areas, or ZCTAs) in major metropolitan areas based upon their behavioral functions as urban cores, suburbs or exurbs. The criteria used are generally employment and population densities and modes of work trip travel. The purpose of the urban core sectors is to replicate, to the best extent possible, the urban form as it existed before World War II, when urban densities were much higher and when a far larger percentage of urban travel was on transit or by walking. The suburban and exurban sectors replicate automobile oriented suburbanization that began in the 1920s and escalated strongly following World War II.

    Wendell Cox is principal of Demographia, an international public policy and demographics firm. He is co-author of the "Demographia International Housing Affordability Survey" and author of "Demographia World Urban Areas" and "War on the Dream: How Anti-Sprawl Policy Threatens the Quality of Life." He was appointed to three terms on the Los Angeles County Transportation Commission, where he served with the leading city and county leadership as the only non-elected member. He served as a visiting professor at the Conservatoire National des Arts et Metiers, a national university in Paris. Wendell Cox is Chair, Housing Affordability and Municipal Policy for the Frontier Centre for Public Policy (Canada), is a Senior Fellow of the Center for Opportunity Urbanism and is a member of the Board of Advisors of the Center for Demographics and Policy at Chapman University.

    Photo: Newest more-than-a-million US core city, virtually all-suburban San Jose by Robert Campbell [GFDL or CC BY-SA 3.0], via Wikimedia Commons

  • Dispersion and Concentration in Metropolitan Employment

    The just released County Business Patterns indicates a general trend of continued employment dispersion to the newer suburbs (principally the outer suburbs) and exurbs but also greater concentration in the central business districts of the 52 major metropolitan areas in the United States (over 1 million population in 2013). County Business Patterns is a Census Bureau program that provides largely private-sector employment data by geography throughout the nation.

    This article examines the most recent data, for 2013, with comparisons to 2007, which was the peak employment year and preceded the Great Recession, the most substantial economic decline in the United States since the Great Depression. There are also comparisons to 2010, the year in which national employment reached its lowest level (trough) before beginning what is, so far, a long and fairly arduous recovery. The analysis uses the City Sector Model (Note)

    2007-2013 Trend

    Job losses were registered in each of the five urban sectors between the employment peak of 2007 and the trough of 2010. Three of the urban sectors have recovered to above their 2007 employment levels. However, overall major metropolitan area employment remains lower by approximately 800,000. Since the 2010 trough, the largest numeric gains have been in the newer suburbs. The Central Business Districts (CBDs) of the Urban Core have recovered more than double their 2007 to 2010 numeric loss. In contrast, the balance of the Urban Core, the Inner Ring experienced a modest increase over its 2007 employment peak. The exurbs have not yet fully recovered. By far the largest losses between 2007 and 2010 were in the earlier suburbs (principally inner suburbs), where employment dropped 2.8 million and has recovered less than one half of that loss (Figure 1).

    Dispersion and Concentration

    The dispersion and concentration is most evident in the shares of employment by urban sector (Figure 3). Three of the urban sectors increased their share of metropolitan employment between 2007 and 2013. The largest increase was in the newer suburban areas, which rose from 24.7 percent to 25.6 percent of metropolitan employment. The central business districts also increased their share of employment, from 8.4 percent in 2007 to 9.0 percent in 2013. This trend is similar to the City Observatory (Joe Courtright) findings that urban cores outperformed suburbs in job growth between 2007 and 2011. The Courtright findings were for areas within three miles of the largest city center, while the findings here relate to the generally smaller CBDs (Figure 2).The gains in other sectors were at the expense of the earlier suburbs, which experienced a loss from 45.9 percent to 44.4 percent of metropolitan employment between 2007 and 2013.


    From the 2010 Trough to 2013

    Since the trough of 2010, there were numeric gains in all of the urban sectors. The gains were concentrated in the suburbs and exurbs, which accounted for 80.9 percent of the employment growth from 2010 to 2013. This nearly equals the 81.9 percent share of employment in these areas in 2007. The urban core, including the CBD and inner ring, captured 19.1 percent of the 2010 to 2013 employment growth, better than their combined 18.1 percent share in 2007 (Figure 3).

    There was also geographic concentration in the CBD gains between the 2010 trough and 2013. Approximately two-thirds of the CBD employment gain between 2007 and 2013 was in four metropolitan areas: New York, Chicago, Boston and San Francisco. Along with Seattle and Houston, these metropolitan areas account for 75 percent of the CBD growth. All of the 46 other major metropolitan areas contributed 25 percent of the gain (Figure 4).

    Between 2010 and 2013, the largest annual percentage employment gain was in the later suburbs, at 3.2 percent. The CBDs, experienced the second strongest growth at 2.9 percent. However, numeric gain in the later suburbs was more than three times that of the CBDs, due to their already much larger employment base (Figure 5).

    Returning to Normalcy?

    For decades, most employment growth has been outside the urban cores of the major metropolitan areas, as had been the case with residential population gains. The Great Recession interfered with these patterns, but normalcy may be returning. Brookings Institution Demographer William Frey recently commented on later population trends (through 2014), suggesting "renewed growth in suburban and exurban counties." The new data indicates renewed employment growth in suburban and exurban areas. At the same time, it would not be surprising for the revival in the CBDs to continue, even if the numbers are relatively small in the metropolitan area context, where the dominance of suburban and exurban job growth seems likely to continue.

    Note: The analysis is based on the City Sector Model (Figure 6), which classifies small areas (ZIP codes, more formally, ZIP Code Tabulation Areas, or ZCTAs) in metropolitan area in the nation based upon their behavioral functions as urban cores, suburbs or exurbs. The criteria used are generally employment and population densities and modes of work trip travel. The purpose of the urban core sectors is to replicate, to the best extent possible, the urban form as it existed before World War II, when urban densities were much higher and when a far larger percentage of urban travel was on transit or by walking. The suburban and exurban sectors replicate automobile oriented suburbanization that began in the 1920s and escalated strongly following World War II.

    Photo: New York: Columbus Circle (by author)

    Wendell Cox is principal of Demographia, an international public policy and demographics firm. He is co-author of the "Demographia International Housing Affordability Survey" and author of "Demographia World Urban Areas" and "War on the Dream: How Anti-Sprawl Policy Threatens the Quality of Life." He was appointed to three terms on the Los Angeles County Transportation Commission, where he served with the leading city and county leadership as the only non-elected member. He served as a visiting professor at the Conservatoire National des Arts et Metiers, a national university in Paris. Wendell Cox is Chair, Housing Affordability and Municipal Policy for the Frontier Centre for Public Policy (Canada), is a Senior Fellow of the Center for Opportunity Urbanism and is a member of the Board of Advisors of the Center for Demographics and Policy at Chapman University.