Tag: City Sector Model

  • Driving Farther to Qualify in Portland

    Portland has been among the world leaders in urban containment policy. And, as would be predicted by basic economics, Portland has also suffered from serious housing cost escalation, as its median multiple (median house price divided by median household income) has risen from a normal 3.0 in 1995 to 4.8 in 2014.

    One of the all too predictable effects of urban containment policy is at least some households will drive even farther to "qualify" for mortgages than before. Single-family detached houses have been the national preference in housing in the United States (and a number of other nations) for decades. Significant "leakage" can occur as people skip over the urban growth boundaries, inside of which housing has become unaffordable. For example, after the 2010 census, San Joaquin County, with its seat of Stockton, was added to the San Francisco Bay combined statistical area (CSA). Combined statistical areas are combinations of metropolitan areas have a somewhat weaker economic connection, as defined by commuting patterns than within metropolitan areas (Note 1).

    As in the San Francisco Bay Area, more Portlanders are now commuting from outside the metropolitan area in large enough numbers that four additional, metropolitan areas are now included in the Portland CSA.

    Driving to Qualify from Corvallis and Albany

    Perhaps most notable addition is Corvallis, seat of Benton County and home of Oregon State University. Corvallis is rather exurban to Portland, even though it is now officially in Portland’s commuting belt. At least 15 percent of resident workers in Benton County travel to one of the central counties of the Portland metropolitan area (Clackamas, Multnomah and Washington in Oregon and Clark in Washington) or vice versa. This is no 30 minute commute. Corvallis is 85 miles from downtown Portland. It is 65 miles from the nearest potential Portland MSA employment in southern Clackamas County. Further, the Corvallis metropolitan area is not adjacent to the Portland metropolitan area. To get to the Portland metropolitan area by the most direct route, a Benton County commuter passes through two other metropolitan areas Albany and Salem.

    This would be a very long commute, even by comparison to the nation’s largest metropolitan regions. Take New York, for example. The New York CSA extends from outside of New Haven, Connecticut, to beyond Allentown, Pennsylvania, to beyond Toms River, New Jersey and includes all of Long Island. Yet some of the farthest reaches of New York are no closer to Manhattan than Corvallis to Portland. These include Bethlehem, Pennsylvania, New Haven, Connecticut, and Port Jervis, New York. Philadelphia, beyond the New York CSA, is only slightly farther away (90 miles).

    Or, consider Los Angeles, which its undeserved reputation for sprawl. The Los Angeles CSA is the second largest in the nation. Yet, Banning, which sits on the mountain pass leading to Palm Springs is 85 miles from Los Angeles. San Clemente, the southernmost point in the CSA is only 60 miles from downtown. The expansive Portland commuter shed suggests that, in some ways, Portland, already far less dense, is also more sprawling.

    Expansions for Linn, Marion, Polk and Cowlitz Counties

    The Portland CSA added two more metropolitan areas in the Willamette Valley. Albany (Linn County), only about 15 miles closer than Corvallis is one. Salem, the state capital, was also added. Salem includes Marion and Polk counties and is 45 miles from Portland. To the north, Longview, Washington (Cowlitz County) was also added. By comparison with Corvallis, Longview seems close, at less than 50 miles from Portland.

    The Portland CSA now stretches 175 miles from the southern Linn County border to the northern Cowlitz County border. There it has collided with the southerly expanding Seattle CSA, which now includes Lewis County (Centralia-Chehalis), 85 miles from downtown Seattle.

    However, this does not imply 175 miles of continuous urbanization. Like all metropolitan areas, combined statistical areas, including Portland, have far more rural land than urban land.

    Dispersing in the Metropolitan Area

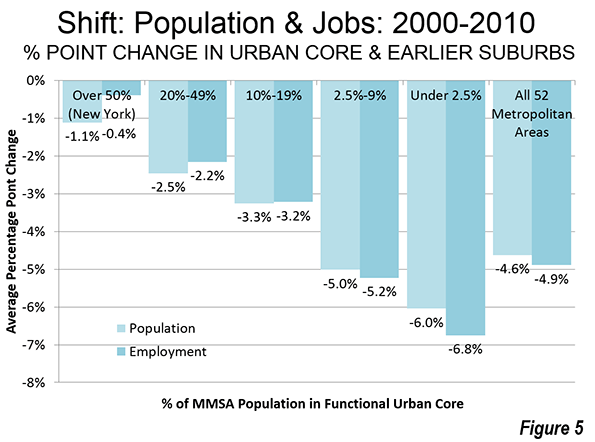
    Perhaps the greatest irony is that an “urban containment” policy designed to prevent sprawl could well be accelerating it. Higher prices, in part due to this policy, have forced more people to look ever further for housing that is affordable.

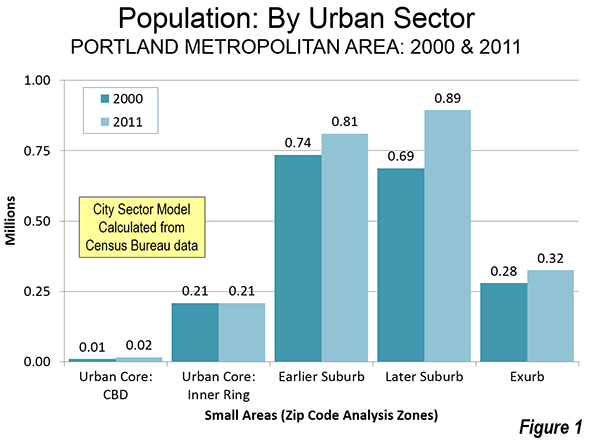
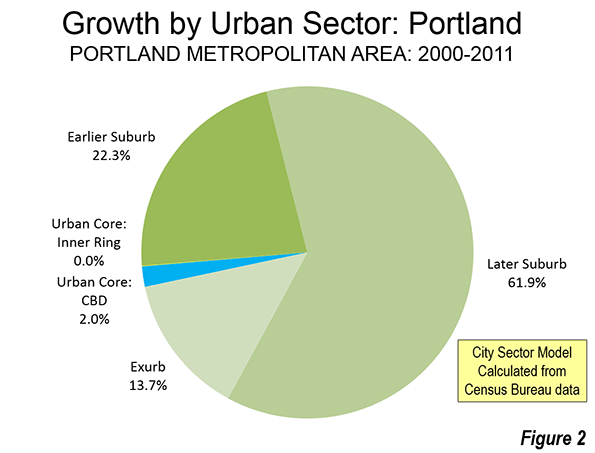
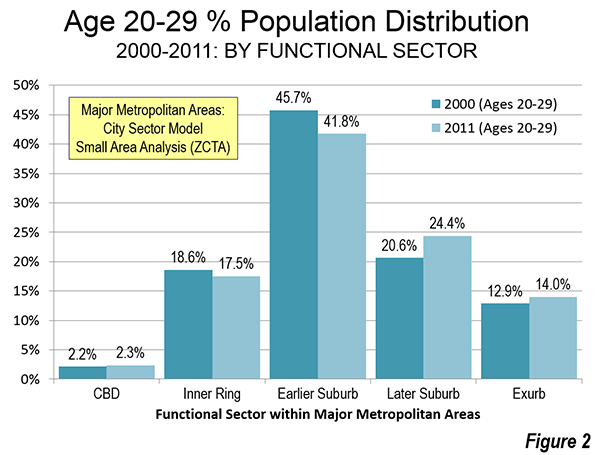
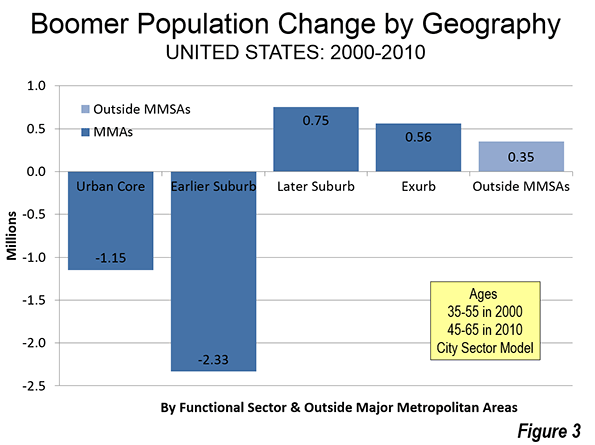
    Approximately 98 percent of Portland’s population growth between 2000 and 2011 occurred in the suburbs (Note). There was a small, but significant percentage growth around the central business district, but its addition of fewer than 7,000 residents paled by comparison to the more than 325,000 added to the suburbs and exurbs. The balance of the urban core, (the inner ring) grew by little more than 100, which is glacial for an urban sector with more than 200,000 residents (less than 0.1 percent).

    None of this should be surprising. The attractive inner city developments, especially the Pearl District, do not provide for the economic needs or wants of most people, as the population trend data indicates. Few households are drawn to buy less than one-half the space they want at nearly three times the price per square foot they would pay in outer suburbs like Forest Grove, Wilsonville or Hazel Dell.
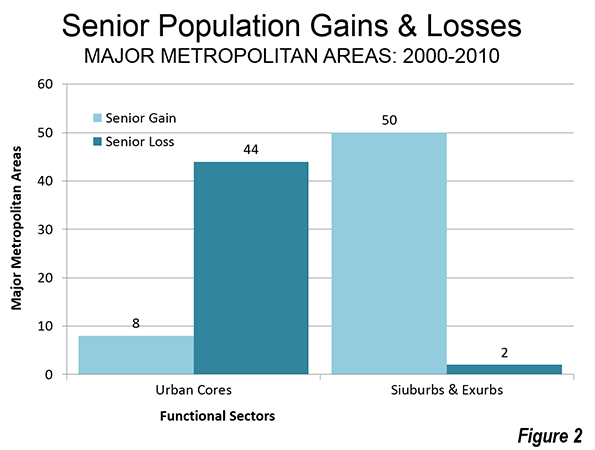
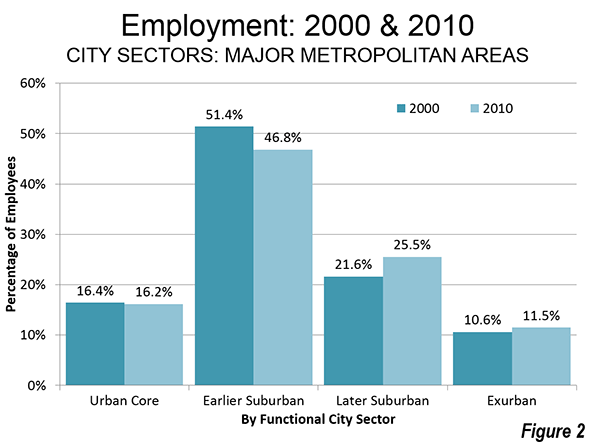
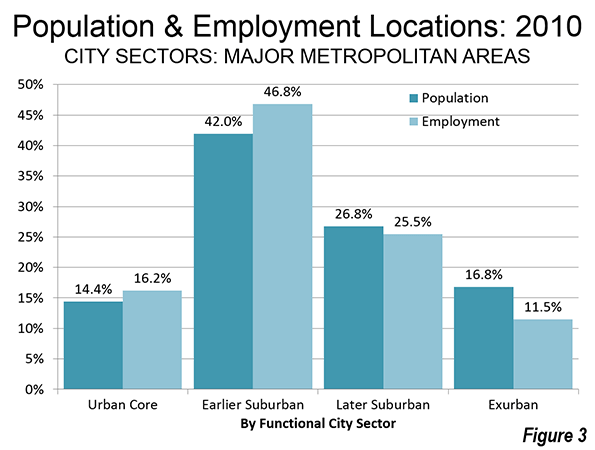
    Job Dispersion

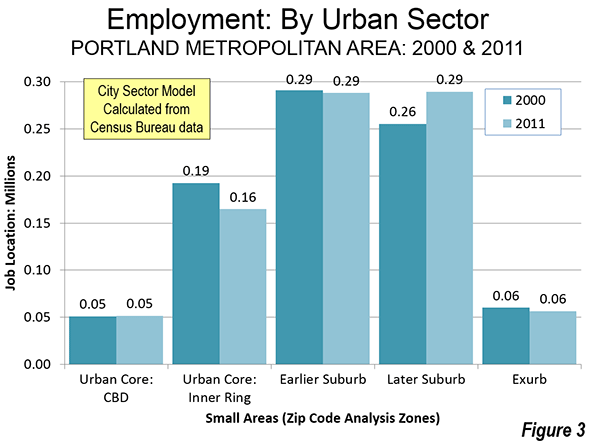
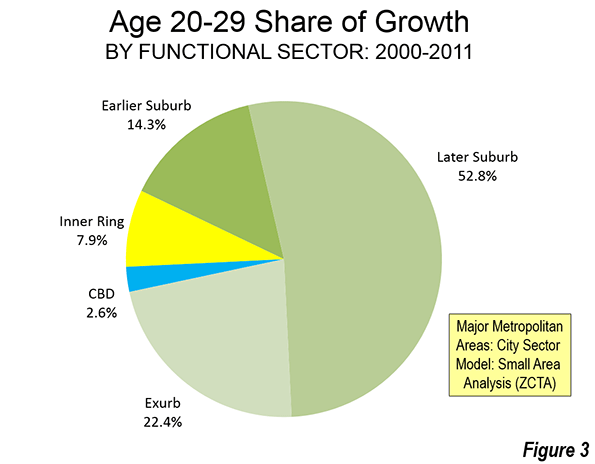
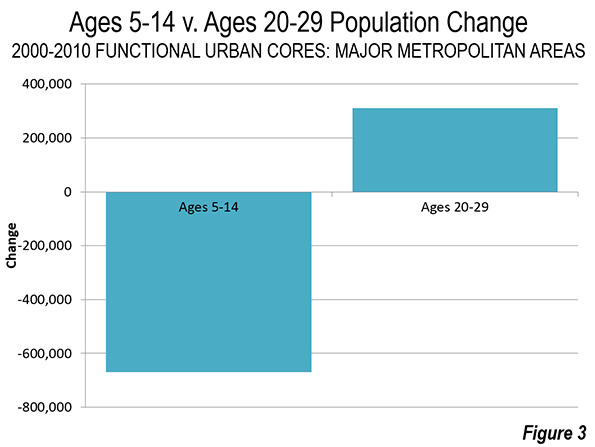
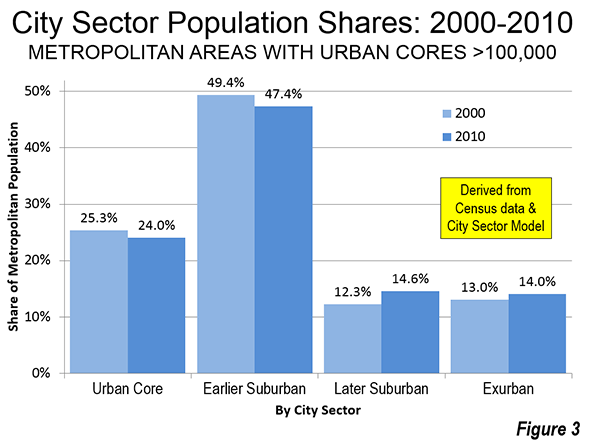
    Fortunately for both the suburbanites and an exurbanites, Portland’s job market also dispersed between 2000 and 2011, meaning that a smaller percentage of commuting was to downtown or the balance of the urban core (Figure 3). That makes it easier to drive to qualify. It turns out that while planners plan, people usually make choices that suit their basic needs rather than those of a particular urban ideology.

    Note 1: Metropolitan areas are defined by commuting patterns. Oversimplifying, metropolitan areas are organized around central counties that contain all or part of large urban areas ("built-up" urban areas). All such counties are included in the metropolitan area as well as any counties that have a strong commuting interchange with the central counties. For example, in the case of Portland, the central counties are Multnomah, Washington and Clackamas in Oregon and Clark in Washington. Columbia and Yamhill in Oregon are outlying counties as well as Skamania in Washington. Combined statistical areas are created from combinations of metropolitan areas that meet a weaker commuting interchange threshold. A complete description of the commuting thresholds that apply to metropolitan areas and combined statistical areas is found here.

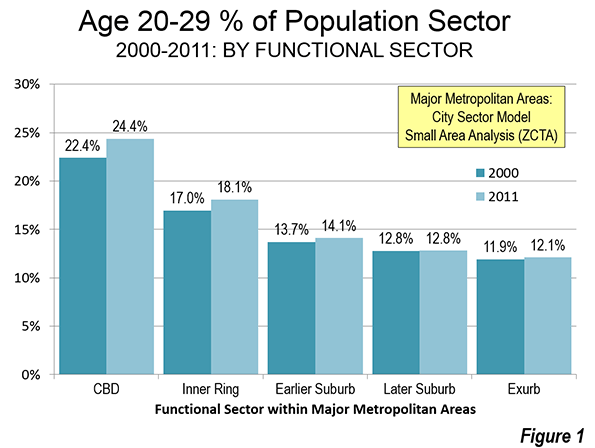
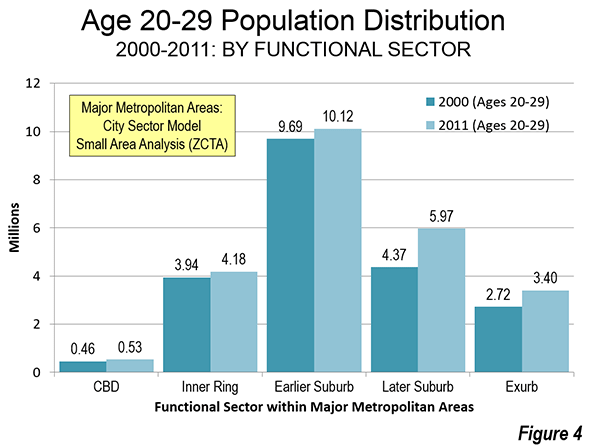
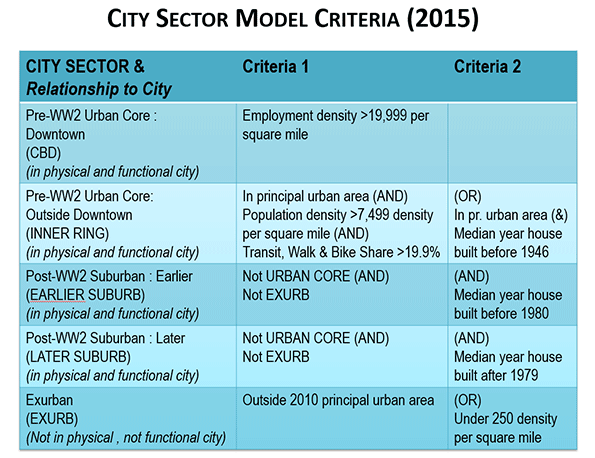
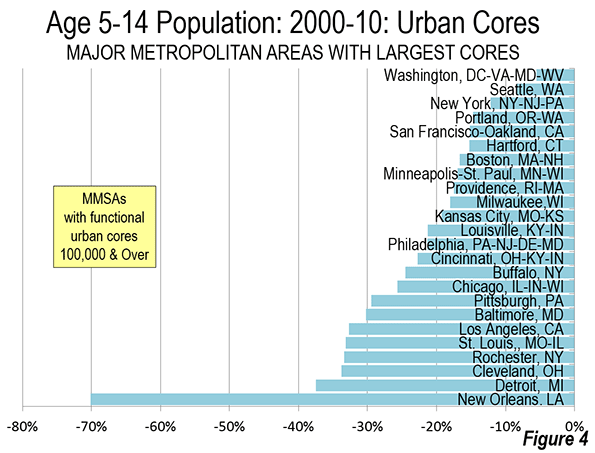
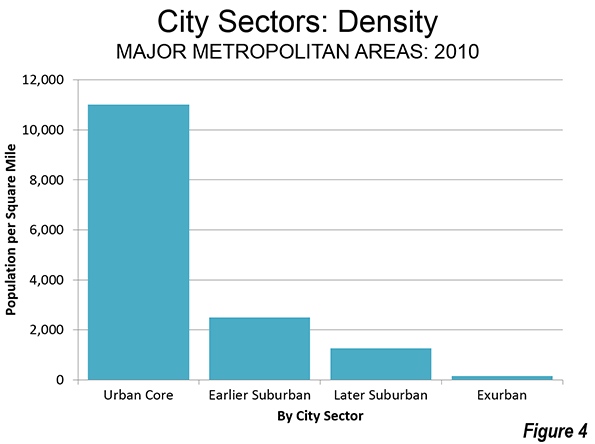
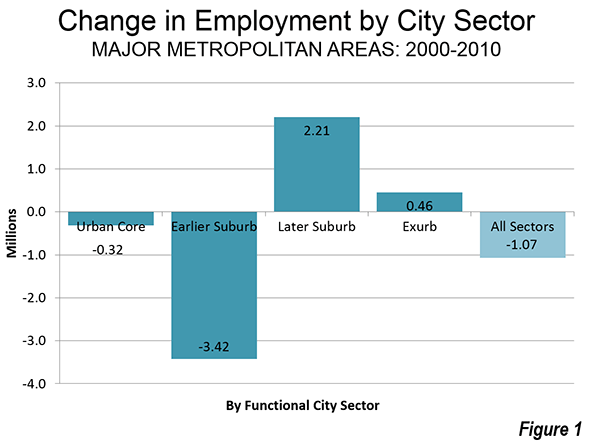
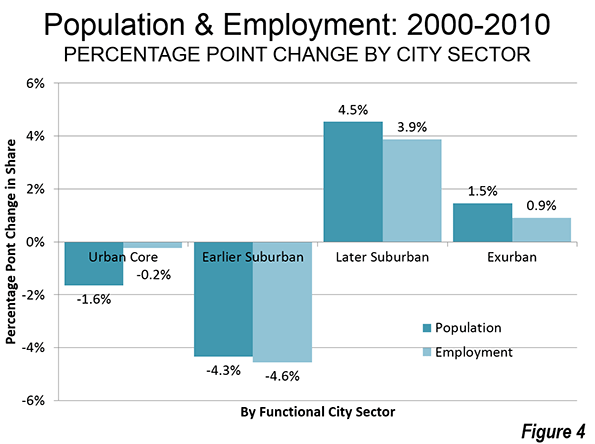
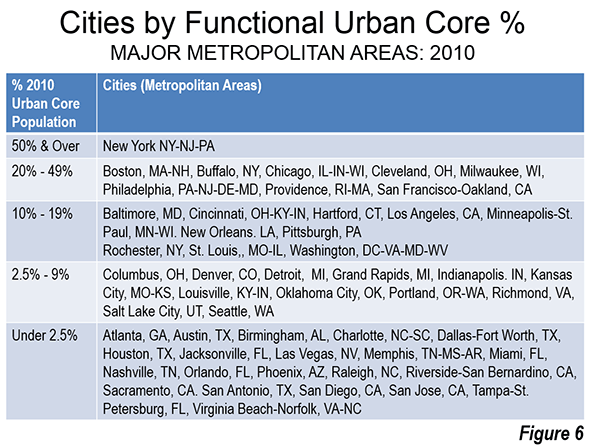
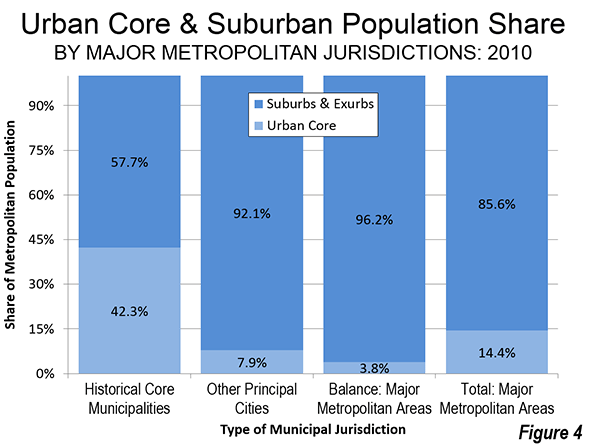
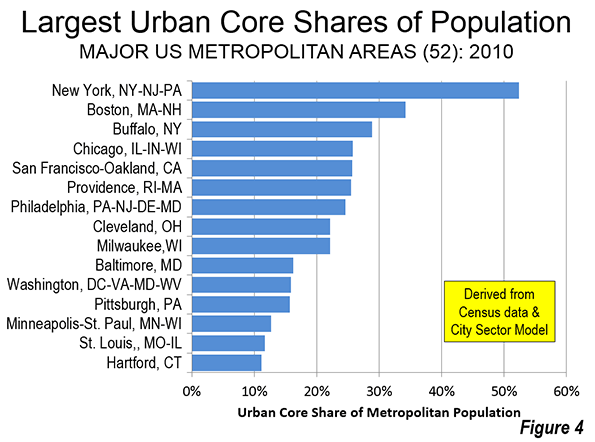
    Note 2: Based on the City Sector Model (Figure 4), which classifies small areas (ZIP codes, more formally, ZIP Code Tabulation Areas, or ZCTAs) in metropolitan area in the nation based upon their behavioral functions as urban cores, suburbs or exurbs. The criteria used are generally employment and population densities and the extent of transit, versus car use. The purpose of the urban core sectors is to replicate, to the best extent possible, the urban form as it existed before World War II, when urban densities were much higher and when a far larger percentage of urban travel was on transit. The suburban and exurban sectors replicate automobile oriented suburbanization that began in the 1920s and escalated strongly following World War II. The data from 2000 is from the 2000 census. The 2011 data is from the 2009-2013 American Community Survey (mid-year 2011).

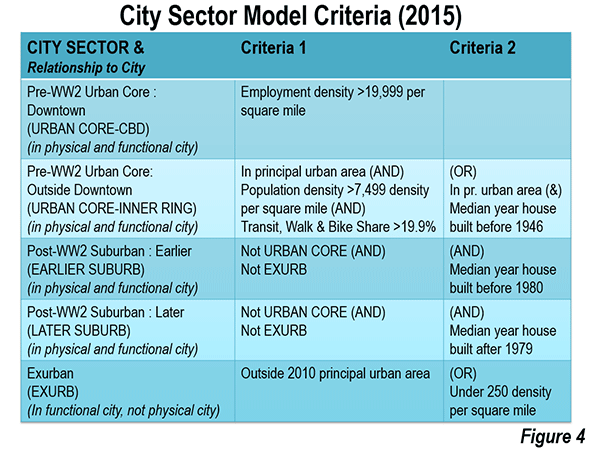
    Photo: Benton County Courthouse, Corvallis (in the Portland commuter shed) by Gregkeene (Own work) [CC BY 3.0 us or CC BY-SA 3.0], via Wikimedia Commons

    Wendell Cox is principal of Demographia, an international public policy and demographics firm. He is co-author of the "Demographia International Housing Affordability Survey" and author of "Demographia World Urban Areas" and "War on the Dream: How Anti-Sprawl Policy Threatens the Quality of Life." He was appointed to three terms on the Los Angeles County Transportation Commission, where he served with the leading city and county leadership as the only non-elected member. He served as a visiting professor at the Conservatoire National des Arts et Metiers, a national university in Paris. Wendell Cox is Chair, Housing Affordability and Municipal Policy for the Frontier Centre for Public Policy (Canada), is a Senior Fellow of the Center for Opportunity Urbanism and is a member of the Board of Advisors of the Center for Demographics and Policy at Chapman University.

  • Urban Core Millennials? A Matter of Perspective

    Yes, millennials are moving to the urban cores but not in significant numbers when view from the context of larger city (metropolitan area) trends. That’s the updated story, based on new small area data that approximates the year 2011 (Note: ACS 5-Year Data).

    Small area trends are important to understanding developments in metropolitan areas, because conventional municipal jurisdiction based analysis obscures the extent of large suburban areas within the boundaries of most core municipalities. In 2010, approximately 58% of the population in core municipalities lived in small areas that were essentially suburban, with much lower population densities than areas that developed before World War II, and where nearly all motorized travel is by car.

    Even worse, "principal cities," have been equated to core municipalities in some analyses, despite their overwhelming suburban, single family nature, such as Staten Island in New York to the broad expanses of Phoenix, Denver, and Portland. Excepting the core municipalities, the principal cities designated since 2000 are polycentric business centers, the metropolitan area criteria adopted by the Office of Management and Budget (OMB). Marking the transition of American cities from being monocentric to polycentric, principal cities are 92% suburban and exurban.

    This analysis uses my City Sector Model, which classifies small areas (ZIP codes, more formally, ZIP Code Tabulation Areas, or ZCTAs) in metropolitan areas in the nation based upon their function as urban cores, suburbs, or exurbs. The criteria used are generally employment and population densities and the extent of transit use versus car use. The purpose of the urban core sectors is to replicate, to the best extent possible, the urban form as it existed before World War II, when urban densities were much higher and a far larger percentage of urban travel was on transit. The suburban and exurban sectors replicate automobile-oriented suburbanization that began in the 1920s and escalated strongly following World War II.

    A recent revision to the model divided the urban core into two classifications, the downtown or central business district ("CBD") and the "inner ring." The CBD is the locus of the most important urban revitalization in the core municipalities, while the inner ring includes the remaining part of the urban core that resembles the outlying parts of the pre-World War II city in its travel patterns and population densities (the City Sector Model criteria are described in the note below).

    The Anecdotal Evidence

    Seemingly endless stories are covered in both the print and electronic media describing how younger adults have been attracted to the urban core. Press organs like The New York Times and the Los Angeles Times can readily send their reporters to nearby cafes, bars, and restaurants. Much rarer are the anecdotes from the suburban strip malls and even a "Starbucks" on Long Island, Sugarland, outside Houston, or in the San Fernando Valley. But data, not anecdotes, are the most reliable indicators of actual trends.  

    From Anecdotes to Data

    The new data reinforces the reality that the story of millennials in the urban core is more nuanced than often suggested. This analysis compares population data for younger adults in the age range of 20 to 29 years old.

    Data: The Urban Core

    The "good news" relates to part of the city, the urban core. Millennials are concentrating to a greater degree than before in the urban core. Millennials have a larger share of the total population in the CBD then in any of the other for city sectors. In 2011, millennials represented 24.4% of the CBD population. By comparison, millennials are a much smaller 14.1% of the overall metropolitan population and the share in the exurbs is only 12.1%, less than one half that in the CBD. The associated inner ring has the second highest millennial component, at 18.1%, well above the shares in the outer sectors. Further, the millennial composition of the CBD increased between 2000 and 2011 from 22.4% to 24.4%. The inner ring millennial composition also increased, from 17.0% to 18.1% (Figure 1).

    So there is no question that the urban core millennial population is increasing beyond the general population increase.

    Data: City-Wide

    The other, often neglected, reality is that the gains in the urban cores are small compared to overall city (urban area or metropolitan area) trends. And millennial urban core gains may well have reached a peak, as has been suggested by Trulia’s Jed Kolko. Over the last year the millennial population in the CBDs has dropped a modest 25,000 (an amount that is probably within the margin of error, since all of these data are from surveys).

    Only 2.3% of millennials lived in the CBDs in the most recent year for which there is data (2011). This is up, but only from 2.2% in 2000. That gain was offset by a troubling loss in the inner core from 18.6% to 17.5%. The millennial share increases were all in the suburbs and exurbs (Figure 2).

    In numbers, the population aged 20 to 29 increased in the suburbs 20 times that of the CBD and the increase in the exurbs was nearly 9 times as high. Altogether, more than 90% of this cohort’s growth took place outside the urban core in the major metropolitan areas (Figure 3). Overall, the millennial gains in the CBD were approximately 80,000, while the gains in the inner ring were approximately 240,000. By contrast, the millennial gains in the suburbs and exurbs amounted to more than 2.75 million (Figure 4).  

    A Matter of Perspective

    The story on millennials is simply a matter of perspective. Those most interested in the small but influential urban core, depict a rising tide of millennials, with some justification. Those most interested in all the entire metropolitan area, are compelled by the overwhelming numbers to recognize that the story of millennials in the urban core is less significant in the larger context. But we are far from, and may well never achieve, a return to the imminent "Nirvana" of restoring pre-World War II cities or even a substantially smaller role for cars, which continue to drive the urban form in much of the world.

    Continued progress in the urban cores does not depend upon the "death" or decline of the suburbs. If cities are to best perform their crucial role of providing better standards of living and enabling lower poverty rates, they could boost prosperity throughout the city from the urban core through the suburbs to the exurbs.

    Note: ACS 5 Year Data: The data were collected by the American Community Survey of the US Census Bureau from 2009 to 2013. One fifth of the survey is completed each year, and therefore the data most closely approximates the middle of the period,  2011.

    Note: City Sector Model Criteria: This article continues a series examining the 52 major metropolitan areas (those with more than 1,000,000 residents) using the City Sector Model, which allows a more representative functional analysis of urban core, suburban, and exurban areas, by using smaller areas, rather than using municipal boundaries. The City Sector Model thus eliminates the over-statement of urban core data that occurs in conventional analyses, which rely on historical core municipalities, most of which encompass considerable suburbanization.

    The City Sector Model classifies 9,000 major metropolitan area zip code tabulation areas using urban form, density, and travel behavior characteristics. There are five functional classifications: the CBD, the inner ring, all will earlier suburbs, later suburbs, and exurban areas.

    The general criteria is as follows: The CBDs include any small area with an employment density of 20,000 or more per square mile. The inner ring has lower employment density, with high residential densities, older housing and substantially greater reliance on transit. The CBD and inner ring together form the urban core, which resembles the population density and travel patterns of the pre-World War II city. The suburbs constitute the balance of the built-up urban areas and the exurbs are beyond the built-up urban areas.

    The revised City Sector Model criteria are illustrated in the Figure: "City Sector Model Criteria: 2015," below.

    Wendell Cox is principal of Demographia, an international public policy and demographics firm. He is co-author of the "Demographia International Housing Affordability Survey" and author of "Demographia World Urban Areas" and "War on the Dream: How Anti-Sprawl Policy Threatens the Quality of Life." He was appointed to three terms on the Los Angeles County Transportation Commission, where he served with the leading city and county leadership as the only non-elected member. He was appointed to the Amtrak Reform Council to fill the unexpired term of Governor Christine Todd Whitman and has served as a visiting professor at the Conservatoire National des Arts et Metiers, a national university in Paris.

    Photo:  The revitalizing CBD of St. Louis (by author)

  • Exodus of the School Children

    The urban cores of the nation’s 52 major metropolitan areas (over 1 million population) lost nearly one-fifth of their school age population between 2000 and 2010. This is according an analysis of small area age group data for children aged 5 to 14 from Census Bureau data, using the City Sector Model. Over the period, the share of 5 to 14 age residents living in the functional urban cores declined from 15.0 percent to 12.0 percent (Figure 1).

    The City Sector Model

    The City Sector Model analysis avoids the exaggeration of urban core data that necessarily occurs from reliance on the municipal boundaries of core cities (which are themselves nearly 60 percent suburban or exurban, ranging from as little as three percent to virtually 100 percent). It also avoids the use of the newer "principal cities" designation of larger employment centers within metropolitan areas, nearly all of which are suburbs, but are inappropriately joined with core municipalities in some analyses. The City Sector Model" small area analysis method is described in greater detail in Note 1 below (previous articles are listed in Note 2). The approach is similar to the groundbreaking work of David Gordon, et al at Queen’s University for Canadian metropolitan areas.

    School Age Losses

    The urban core school-age population dropped from approximately 3.40 million in 2000 to 2.73 million in 2010, for a loss of 670,000 (Figure 2). Much has been made about the affinity of the Millennial generation for the urban cores. Despite this, our small area analysis indicated that the percentage of 20 to 29 year olds living in the functional urban cores declined between 2000 and 2010, with 88 percent of the growth in suburbs and exurbs (see Dispersing Millennials). Coincidentally, over the period, there was a reduction of two school age children in the urban cores for every additional resident aged 20 to 29 (Figure 3).

    A loss was also sustained in the earlier suburbs (with median house construction dates between 1946 and 1979). The school-age population declined slightly more than 1 million in the earlier suburban areas. In 2000, 45.3 percent of school age children lived in the earlier suburbs, a figure that declined to 40.5 percent in 2010.

    Virtually all of the gain in 5 to 14 age residents was in the later suburban areas (a median house construction dates of 1980 or later) and exurban areas. Overall, these two city sectors added 1.9 million school-age children, while the urban cores and the earlier suburban areas experienced a reduction of 1.7 million, for a reduction of approximately 10 percent.

    The largest increase was in the newer suburban areas (median house construction dates of 1980 or later), where 1.47 more school-age children lived in 2010 than in 2000. This represented an increase of approximately 30 percent. Exurban areas have a more modest increase of 310,000 school-age children, up 8.3 percent from 2000.

    Losses in the Largest Urban Cores

    All of the large urban cores in the metropolitan areas experienced losses in school aged children from 2000 to 2010. Among the 24 urban cores with more than 100,000 residents, Washington (-5.5 percent) and Seattle (-8.4 percent) came the closest to retaining their 2000 school age numbers in 2010.  Seven large urban cores experienced losses of at least 30 percent. Baltimore’s loss was approximately 30 percent. Los Angeles joined rust belt cities St. Louis, Rochester and Cleveland at 33 percent to 34 percent and Detroit at 38 percent. New Orleans had the largest loss (-70.2 percent), owing in part to population loss from the disastrous hurricanes (Figure 4).

    Finally, in all of the 52 metropolitan areas, the later suburban and exurban areas (combined) retained more of their school age children than the urban cores and earlier suburbs. There were gains in 45 of the later suburban and exurban areas.

    Better Schools: The Necessary (But Maybe Not Sufficient) Condition

    One of the issues of most interest among urban analysts has been whether urban cores will be able to retain the share of Millennials that they have attracted. The functional urban cores seem likely to maintain their attraction for younger adults, so long as the cores sustain their improved living environment (such as much lower crime rates than before and continued investment by retailers and other commercial business to support the new populations).

    However, the continuing exodus of people with school-age children described seems to indicate that young adults tend to move to the suburbs and exurbs around the time their children enroll in school. Suburban and exurban schools often provide better educations than urban core schools. The Editorial Projects in Education found that high school graduation rates were 77.3 percent in suburban school districts, compared to 59.3 percent in "urban" school districts (Note 3). There are other difficulties as well, such as having sufficient defensible outdoor space for children to play and for parents to feel secure. But education seems likely to be the most important consideration.

    Of course, in urban areas the highly affluent can enroll their children in private schools. The alternative of private schools can be overly expensive, inducing households to relocate to school districts with higher quality education. According to research by Chief Economist Jed Kolko of Trulia: “Private school enrollment in the lowest-rated school districts is more than four times as high as private school enrollment in the highest-rated school districts after adjusting for neighborhood demographic differences."

    A balanced broad age distribution of households, including those with children of school age, is not likely to be achieved in urban cores unless Millennials are retained in substantial numbers. Once having moved, the chances of their returning are slim, because households move less frequently as they move up the age scale.

    Note 1: The City Sector Model allows a more representative functional analysis of urban core, suburban and exurban areas, by the use of smaller areas, rather than municipal boundaries. The more than 30,000 zip code tabulation areas (ZCTA) of major metropolitan areas and the rest of the nation are categorized by functional characteristics, including urban form, density and travel behavior. There are four functional classifications, the urban core, earlier suburban areas, later suburban areas and exurban areas. The urban cores have higher densities, older housing and substantially greater reliance on transit, similar to the urban cores that preceded the great automobile oriented suburbanization that followed World War II. Exurban areas are beyond the built up urban areas. The suburban areas constitute the balance of the major metropolitan areas. Earlier suburbs include areas with a median house construction date before 1980. Later suburban areas have later median house construction dates. 

    Urban cores are defined as areas (ZCTAs) that have high population densities (7,500 or more per square mile or 2,900 per square kilometer or more) and high transit, walking and cycling work trip market shares (20 percent or more). Urban cores also include non-exurban sectors with median house construction dates of 1945 or before. All of these areas are defined at the zip code tabulation area (ZCTA) level.

    Note 2: The City Sector Model articles are:
    From Jurisdictional to Functional Analyses of Urban Cores & Suburbs
    The Long Term: Metro American Goes from 82 percent to 86 percent Suburban Since 1990
    Beyond Polycentricity: 2000s Job Growth (Continues to) Follow Population
    Urban Cores, Core Cities and Principal Cities
    Large Urban Cores: Products of History
    New York, Legacy Cities Dominate Transit Urban Core Gains
    Boomers: Moving Farther Out and Away
    Seniors Dispersing Away from Urban Cores
    Metropolitan Housing: More Space, Large Lots
    City Sector Model Small Area Criteria

    Note 3: This report (which was prepared with support from the America’s Promise Alliance and the Bill and Melinda Gates Foundation) provides graduation rates using the US Department of Education "local codes." This typology generally defines "urban" school districts as those in core cities as well as other principal cities (such as Arlington, Texas and Mesa, Arizona). Most of the population of core cities and principal cities is classified as functionally suburban (see: Urban Cores, Core Cities and Principal Cities). Further, the typology classifies some districts as suburban that have large urban components (such as Las Vegas, Miami, Louisville and Honolulu), which is necessary because of county level school districts that include both urban cores and suburban areas. As a result the functionally suburban component of urban districts is overstated and the functionally suburban component of suburban districts is understated. Because urban graduation rates tend to be less than suburban rates, both of these factors seem likely to overstate the "urban" graduation rates and understate the "suburban" graduation rates.

    Wendell Cox is principal of Demographia, an international public policy and demographics firm. He is co-author of the "Demographia International Housing Affordability Survey" and author of "Demographia World Urban Areas" and "War on the Dream: How Anti-Sprawl Policy Threatens the Quality of Life." He was appointed to three terms on the Los Angeles County Transportation Commission, where he served with the leading city and county leadership as the only non-elected member. He was appointed to the Amtrak Reform Council to fill the unexpired term of Governor Christine Todd Whitman and has served as a visiting professor at the Conservatoire National des Arts et Metiers, a national university in Paris.

    Photo: School buses in suburban Atlanta (by author)

  • Metropolitan Housing: More Space, Large Lots

    Americans continue to favor large houses on large lots. The vast majority of new occupied housing in the major metropolitan areas of the United States was detached between 2000 and 2010 and was located in geographical sectors associated with larger lot sizes. Moreover, houses became bigger, as the median number of rooms increased (both detached and multi-family), and the median new detached house size increased.

    These conclusions are based on an analysis of small area data for major metropolitan areas using the City Sector Model. City Sector Model analysis avoids the exaggeration of urban core data that necessarily occurs from reliance on the municipal boundaries of core cities (which are themselves nearly 60 percent suburban or exurban, ranging from as little as three percent to virtually 100 percent). It also avoids the use of the newer "principal cities" designation of larger employment centers within metropolitan areas, nearly all of which are suburbs, but are inappropriately joined with core municipalities in some analyses. The City Sector Model" small area analysis method is described in greater detail in the Note below.

    Increase in Detached Housing

    America’s preference for detached housing was evident across the spectrum of functional city sectors between 2000 and 2010. Overall, there was a 14% increase in detached housing in the major metropolitan areas. Among the major metropolitan areas (over 1 million population), the number of occupied detached houses rose the most (35%) in the later or generally outer suburbs and exurban areas (24%). Detached houses increased 2.8 million in the later suburbs and 2.5 million in the exurban areas. A smaller 50,000 increase was registered in the earlier or generally inner suburban areas. Most surprisingly, there was also a small increase (20,000) in the number of detached houses in the functional urban cores (Figure 1).

    Smaller Increase in Multi-Family Housing

    The increase in detached housing dwarfed that of new multi-family housing (owned and rented apartments). The increase in detached housing in the major metropolitan areas was six times that of multi-family housing. Overall, there was a four percent increase in multi-family housing in the major metropolitan areas, less than one-third the increase in detached housing.  There were slight decreases in the number of multi-family houses in both the urban cores and the earlier (generally inner) suburbs. At the same time, there has been a healthy increases in the number of multi-family houses in the later suburbs and exurbs, where the growth rates exceeded the increase in major metropolitan population (11%). In the later suburbs, multi-family housing increased 29% and in the exurbs the increase was 14% (Figure 2).

    Larger Houses, Larger Lots

    Yet overall, houses were getting bigger. The median number of rooms per house rose from 5.3 in 2000 to 5.6 in 2010. Increases in median rooms were registered in each of the city sectors (Figure 3). Nationally, the median size of new detached housing edged up five percent between 2000 and 2010. (By 2013, median new house size had increased another 17 percent to a record 2,384 square feet).

    Lots also were getting bigger. Nearly all of the population growth (99 %) was in the later suburbs and exurbs between 2000 and 2010, where population densities are much lower and lots are larger than in the earlier suburbs and the urban core (Figure 4).

    The preponderance of  urban planning theory over the past decade has been based on the notion that people would increasingly seek houses on smaller lots. For example, Arthur C. Nelson of the University of Utah predicted that the demand for housing on conventional-sized lots (which Professor Nelson defines as more than 1/8 acre, which is smaller than the smallest lot size reported by the Census Bureau) would be only 16% in the major metropolitan areas of California by 2010, relying in part on stated preference survey data. In fact the revealed preferences — in other words what people actually did — was four times the predicted demand (64%) in the conventional-lot-dominated later suburbs and exurbs of California’s largest metropolitan areas between 2000 and 2010. This is despite California’s regulatory and legal bias against detached housing on conventional lots (See: California’s War Against the Suburbs). Outside California, later suburban and exurban detached housing represented 77% of new housing demand over the period.

    Planning and Preferences

    Urban cores and multi-family housing are favored by urban planning policy. Yet, large functional urban cores (high density and high transit market share, as defined in the City Sector Model, Note below) are few and far between, with only seven exceeding 500,000 population, a modest number equaled or exceeded by approximately 100 metropolitan areas. Overall, the functional urban cores of major metropolitan areas lost more than 100,000 residents between 2000 and 2010, while suburban and exurban areas gained more than 16.5 million. Predictably, the housing forms typical of the later suburbs and exurbs made strong gains. The preferences of planning are not those of people and households.

    ————-

    Note: The City Sector Model allows a more representative functional analysis of urban core, suburban and exurban areas, by the use of smaller areas, rather than municipal boundaries. The more than 30,000 zip code tabulation areas (ZCTA) of major metropolitan areas and the rest of the nation are categorized by functional characteristics, including urban form, density and travel behavior. There are four functional classifications, the urban core, earlier suburban areas, later suburban areas and exurban areas. The urban cores have higher densities, older housing and substantially greater reliance on transit, similar to the urban cores that preceded the great automobile oriented suburbanization that followed World War II. Exurban areas are beyond the built up urban areas. The suburban areas constitute the balance of the major metropolitan areas. Earlier suburbs include areas with a median house construction date before 1980. Later suburban areas have later median house construction dates.

    Urban cores are defined as areas (ZCTAs) that have high population densities (7,500 or more per square mile or 2,900 per square kilometer or more) and high transit, walking and cycling work trip market shares (20 percent or more). Urban cores also include non-exurban sectors with median house construction dates of 1945 or before.

    ————-

    Wendell Cox is principal of Demographia, an international public policy and demographics firm. He is co-author of the “Demographia International Housing Affordability Survey” and author of “Demographia World Urban Areas” and “War on the Dream: How Anti-Sprawl Policy Threatens the Quality of Life.” He was appointed to three terms on the Los Angeles County Transportation Commission, where he served with the leading city and county leadership as the only non-elected member. He was appointed to the Amtrak Reform Council to fill the unexpired term of Governor Christine Todd Whitman and has served as a visiting professor at the Conservatoire National des Arts et Metiers, a national university in Paris.

    Photo: Northern Suburbs of Minneapolis-St. Paul (by author)

  • Seniors Dispersing Away from Urban Cores

    Senior citizens (age 65 and over) are dispersing throughout major metropolitan areas, and specifically away from the urban cores. This is the opposite of the trend suggested by some planners and media sources who claim than seniors are moving to the urban cores. For example, one headline, "Millions of Seniors Moving Back to Big Cities" is at the top of a story with no data and anecdotes ranging that are at least as much suburban (Auburn Hills, in the Detroit area) and college towns (Oxford, Mississippi and Lawrence, Kansas), as they are big city. Another article, "Why Seniors are Moving to the Urban Core and Why It’s Good for Everyone," is also anecdote based, and gave prominence to a solitary housing development in downtown Phoenix (more about Phoenix below).

    Senior Metropolitan Growth Trails National

    Between 2000 and 2010, the nation’s senior population increased approximately 5.4 million, an increase of 15 percent. Major metropolitan areas accounted for approximately 50 percent of the increase (2.7 million) and also saw their senior population increase 15 percent. By contrast, these same metropolitan areas accounted for 60 percent of overall growth between 2000 and 2010, indicating that most senior growth is in smaller metropolitan areas and rural areas.

    Senior Metropolitan Population Dispersing

    The number of senior citizens living in suburbs and exurbs of major metropolitan areas (over 1,000,000 population) increased between 2000 and 2010, according to census data. The senior increases were strongly skewed away from the urban cores. Suburbs and exurbs gained 2.82 million senior residents over the period, while functional urban cores lost 112,000. The later suburbs added 1.64 million seniors. The second largest increase was in exurban areas, with a gain of 0.88 million seniors. The earlier suburbs (generally inner suburbs) added just under 300,000 seniors (Figure 1).

    During that period, the share of senior citizens living in the later suburbs increased 35 percent. The senior citizen population share in the exurbs rose nearly 15 percent. By contrast, the share of seniors living in the functional urban cores declined 17 percent. Their share in the earlier suburbs declined 11 percent.

    This is based on an analysis of small area data for major metropolitan areas using the City Sector Model.
    City Sector Model analysis avoids the exaggeration of urban core data that necessarily occurs from reliance on the municipal boundaries of core cities (which are themselves nearly 60 percent suburban or exurban, ranging from as little as three percent to virtually 100 percent). It also avoids the use of the newer "principal cities" designation of larger employment centers within metropolitan areas, nearly all of which are suburbs, but are inappropriately joined with core municipalities in some analyses. The City Sector Model" small area analysis method is described in greater detail in the Note below.

    Pervasive Suburban and Exurban Senior Gains

    The gains in functional suburban and exurban senior population were pervasive. Among the 52 major metropolitan areas, there were gains in 50. In two areas (New Orleans and Pittsburgh), there were losses. However, in each of these cases there was an even greater senior loss in the functional urban cores. In no case did urban cores gain more or lose fewer seniors than the suburbs and exurbs. Eight of the functional urban cores experienced gains in senior population, while 44 experienced losses (Figure 2)

    Largest Urban Cores

    The major metropolitan areas with the largest urban cores (more than 20 percent of the population in the functional urban cores),  would tend to be the most attractive to seniors seeking an urban core lifestyle. But they  still saw their seniors heading  to the suburbs and exurbs (Figure 3). Senior populations declined in the functional urban cores of all but two of these nine areas, New York and San Francisco. However, in both of these metropolitan areas, the increases in suburban and exurban senior populations overwhelmed the increases in the urban cores. All of these nine major metropolitan areas experienced increases in their suburban and exurban senior populations.

    Moreover, the Phoenix anecdote cited above is at odds with the reality that the later suburbs and exurbs gained 165,000 seniors between 2000 and 2010. The earlier suburbs lost 7,000 seniors (No part of Phoenix has sufficient density or transit market share to be classified as functional urban core).

    Consistency of Seniors Trend with Other Metropolitan Indicators

    As has been indicated in previous articles, there continues to be a trend toward dispersal and decentralization in US major metropolitan areas. There was an overall population dispersion from 1990 to 2000 and 2000 to 2010, which continued trends that have been evident since World War II and even before, as pre-automobile era urban cores have lost their dominance. Jobs continued to follow the suburbanization and exurbanization of the population over the past decade away as cities became less monocentric, less polycentric and more "non-centric." As a result, work trip travel times are generally shorter for residents where population densities are lower. Baby boomers and Millennials have been shown to be dispersing as well, despite anecdotes to the contrary (Figure 4). The same applies to seniors.

    Note: The City Sector Model allows a more representative functional analysis of urban core, suburban and exurban areas, by the use of smaller areas, rather than municipal boundaries. The more than 30,000 zip code tabulation areas (ZCTA) of major metropolitan areas and the rest of the nation are categorized by functional characteristics, including urban form, density and travel behavior. There are four functional classifications, the urban core, earlier suburban areas, later suburban areas and exurban areas. The urban cores have higher densities, older housing and substantially greater reliance on transit, similar to the urban cores that preceded the great automobile oriented suburbanization that followed World War II. Exurban areas are beyond the built up urban areas. The suburban areas constitute the balance of the major metropolitan areas. Earlier suburbs include areas with a median house construction date before 1980. Later suburban areas have later median house construction dates.

    Urban cores are defined as areas (ZCTAs) that have high population densities (7,500 or more per square mile or 2,900 per square kilometer or more) and high transit, walking and cycling work trip market shares (20 percent or more). Urban cores also include non-exurban sectors with median house construction dates of 1945 or before. All of these areas are defined at the zip code tabulation area (ZCTA) level.

    —-

    Wendell Cox is principal of Demographia, an international public policy and demographics firm. He is co-author of the "Demographia International Housing Affordability Survey" and author of "Demographia World Urban Areas" and "War on the Dream: How Anti-Sprawl Policy Threatens the Quality of Life." He was appointed to three terms on the Los Angeles County Transportation Commission, where he served with the leading city and county leadership as the only non-elected member. He was appointed to the Amtrak Reform Council to fill the unexpired term of Governor Christine Todd Whitman and has served as a visiting professor at the Conservatoire National des Arts et Metiers, a national university in Paris.

    Photo: Later Suburbs of Cincinnati (where most senior growth occurred from 2000 to 2010). By Author

  • Beyond Polycentricity: 2000s Job Growth (Continues to) Follow Population

    The United States lost jobs between 2000 and 2010, the first loss between census years that has been recorded in the nation’s history. The decline was attributable to two economic shocks, the contraction following the 9/11 attacks and the Great Recession, the worst financial crisis since the Great Depression. Yet, even in this moribund job market, employment continued to disperse in the nation’s major metropolitan areas.

    This is the conclusion of a small area analysis (zip code tabulation areas) of data from County Business Patterns, from the Census Bureau, which captures nearly all private sector employment and between 85 and 90 percent of all employment (Note 1). 

    The small area analysis avoids the exaggeration of urban core data that necessarily occurs from reliance on the municipal boundaries of core cities (which are themselves nearly 60 percent suburban or exurban, ranging from as little as three percent to virtually 100 percent). This "City Sector Model" small area analysis method is described in greater detail in Note 2.

    Distribution of Employment in Major Metropolitan Areas

    County Business Pattern data indicates that employment dropped approximately 1,070,000 in the 52 major metropolitan areas (those with more than 1,000,000 population) between 2000 and 2010. The inner city sectors (the functional urban cores and earlier suburbs) were hard-hit. Together the inner sectors, the functional urban cores and the earlier suburbs, lost 3.74 million jobs. The outer sectors, the later suburbs and the exurbs, gained 2.67 million jobs (Figure 1).

    There were job losses of more than 300,000 in the functional urban cores, and even larger losses (3.2 million) in the earlier suburbs. The functional urban cores are defined by the higher population densities that predominated before 1940 and a much higher dependence on transit, walking and cycling for work trips. The earlier suburbs have median house construction dates before 1980.

    The share of major metropolitan area employment in the functional urban cores dropped from 16.4 percent in 2000 to 16.2 percent in 2010. This compares to the 8 percent of major metropolitan employment that is downtown (central business district) areas. The notion, however, that metropolitan areas are dominated by their downtowns is challenged by the fact that 84 percent of jobs are outside the functional urban cores.

    The largest percentage of major metropolitan areas is clustered in the earlier suburbs, those with median house construction dates from 1946 to 1979. In 2010, 46.8 percent of the jobs were in the earlier suburbs, a decline from 51.4 percent in 2000.

    These losses in employment shares in the two inner city sectors were balanced somewhat by increases in the outer sectors, the later suburbs (with median house construction dates of 1980 or later) and the exurbs, which are generally outside built-up urban areas. The increase was strongest in the later suburbs, where, where employment increased by 2.6 million. The share of employment in the later suburbs rose to 25.5 percent from 21.6 percent. There was also a 600,000 increase in exurban employment. The exurban share of employment rose to 11.5 percent from 10.6 percent (Figure 2).

    The Balance of Residents and Jobs

    There is a surprisingly strong balance between population and employment within the city sectors, which belies the popular perception by some press outlets and even some urban experts that as people who farther away from the urban core, they have to commute farther. In fact, 92 percent of employees do not commute to downtown, and as distances increase, the share of employees traveling to work downtown falls off substantially. As an example, only three percent of working residents in suburban Hunterdon County, New Jersey (in the New York metropolitan area), work in the central business district, Manhattan, while 80 percent work in relatively nearby areas of the outer combined metropolitan area.

    It is to be expected that the functional urban core would have a larger share of employment than population. However the difference is not great, with 16.2 percent of employment in the functional urban core and 14.4 percent of the population. The earlier suburbs have by far the largest share of the population at 42.0 percent. They also have the largest share of employment, at 46.8 percent. The later suburbs have 26.8 percent of the population, slightly more than their 25.5 percent employment share. The largest difference is, as would be expected, is in the exurbs, with 16.8 percent of major metropolitan area residents and 11.5 percent of employment (Figure 3). It is notable, however, that the difference between the share of population and employment varies less than 15 percent in the three built-up urban area sectors (urban core, earlier suburbs and later suburbs), though the difference was greater in the exurbs.

    How Employment Followed Population in the 2000s

    The outward shifts of population and employment are between in the city sectors. In the earlier suburbs, where the population and employment is the greatest, the population share declined 4.3 percentage points, while the employment share declined a near lockstep 4.6 percentage points. The later suburbs had a 4.5 percentage point increase in population share, followed closely a near lockstep 3.9 percentage point increase in employment share. In the exurbs, a 1.5 percentage point increase in the population share was accompanied by a 0.9 percentage point increase in the employment share. The connection is less clear in the functional urban core, where a 1.6 percentage point drop in the population share was associated with a 0.2 percentage point reduction in the employment share (Figure 4).

    The similarity in population and employment shares between the city sectors is an indication that employment growth has been geographically tracking population growth for decades, as cities have evolved from moncentricity to polycentricity and beyond.

    "Job Following" by Relative Urban Core Size

    Similar results are obtained when cities are categorized by the population of their urban cores relative to the total city population. Each category indicates an outward shift from the functional urban cores and earlier suburbs to the later suburbs and exurbs, in both the population share and the employment share. However, the shift is less pronounced in the cities with larger relative urban cores, which tend to be in the older urban regions  (Figure 5). Out of the 18 cities with functional urban cores amounting to more than 10 percent of the metropolitan area, 16 are in the Northeast (including the Northeastern corridor cities of Washington and Baltimore) and the Midwest, where strong population growth ended long ago.

    As usual, New York is in a category by itself, New York, has a functional urban core with more than 50 percent of its population. New York experienced an outward shift of 1.1 percent in its population, and a 0.4 percent outward shift of its employment (the total shift in share, from the urban core and earlier suburbs to the later suburbs and exurbs, expressed in terms of percentage points).

    Generally speaking, the stronger the functional urban core, the less the movement of jobs and people from the center. The actual percentages of functional urban core population by city are shown in From Jurisdictional to Functional Analysis of Urban Cores and Suburbs (Figure 6).

    On average, there was a shift of nearly five percent from the inner sectors (functional urban cores and earlier suburbs) to the outer sectors (later suburbs and exurbs)

    Commute Times: Less Outside the Urban Cores

    The earlier suburbs are generally between the functional urban cores and the later suburbs geographically. As a result, jobs are particularly accessible to residents from all over the metropolitan area. A further consequence is that commute times are shortest (26.3 minutes) in the earlier suburbs, where approximately half of the people also live. Commute times are a bit higher in the later suburbs (27.7 minutes). The exurbs have the third longest commutes, at 29.2 minutes. Finally, commute times are longest in the functional urban cores (31.8 percent), both because traffic congestion is greater (to be expected, not least because of their higher densities), and more people take transit, which is slower (Figure 7).

    The dispersed, and well coordinated location of jobs and residences is one reason that United States metropolitan areas have shorter commute times and less traffic congestion than its international competitors in Europe, Australia, and Canada. All this is testimony to the effectiveness with which people and the businesses established to serve them have produced effective labor markets, which are the most affluent in the world, in which the transaction related impacts of work trip travel time are less than elsewhere.

    Beyond Polycentricity

    These are not new concepts, despite the continuing tendency to imagine the city as a monocentric organism where everyone works in downtown skyscrapers and lives in suburban dormitories. The lower density US city has not descended into the illusion of suburban gridlock that some planners have declared so stridently. Indeed, traffic congestion is considerably less intense in US cities than it is in the other parts of the high income world for which there is data.

    A quarter century ago, University of Southern California economists Peter Gordon and Harry Richardson said that "the co-location of firms and households at decentralized locations has reduced, not lengthened commuting times and distances. Decentralization reduces pressures on the CBD, relieves congestion and avoids ‘gridlock.’"  In 1996 they Los Angeles as "beyond polycentricity" Both of these observations fit well as a description of trends in the 2000s. Most US major metropolitan areas are now "beyond polycentricity," not just Los Angeles.

    Wendell Cox is principal of Demographia, an international public policy and demographics firm. He is co-author of the “Demographia International Housing Affordability Survey” and author of “Demographia World Urban Areas” and “War on the Dream: How Anti-Sprawl Policy Threatens the Quality of Life.” He was appointed to three terms on the Los Angeles County Transportation Commission, where he served with the leading city and county leadership as the only non-elected member. He was appointed to the Amtrak Reform Council to fill the unexpired term of Governor Christine Todd Whitman and has served as a visiting professor at the Conservatoire National des Arts et Metiers, a national university in Paris.

    ——

    Note 1: The Census Bureau describes "County Business Pattern" data as follows: "Statistics are available on business establishments at the U.S. level and by State, County, Metropolitan area, and ZIP code levels. Data for Puerto Rico and the Island Areas are available at the State and county equivalent levels. County Business Patterns (CBP) covers most NAICS industries excluding crop and animal production; rail transportation; National Postal Service; pension, health, welfare, and vacation funds; trusts, estates, and agency accounts; private households; and public administration. CBP also excludes most establishments reporting government employees.

    Note 2: The City Sector Model allows a more representative functional analysis of urban core, suburban and exurban areas, by the use of smaller areas, rather than municipal boundaries. The more than 30,000 zip code tabulation areas (ZCTA) of major metropolitan areas and the rest of the nation are categorized by functional characteristics, including urban form, density and travel behavior. There are four functional classifications, the urban core, earlier suburban areas, later suburban areas and exurban areas. The urban cores have higher densities, older housing and substantially greater reliance on transit, similar to the urban cores that preceded the great automobile oriented suburbanization that followed World War II. Exurban areas are beyond the built up urban areas. The suburban areas constitute the balance of the major metropolitan areas. Earlier suburbs include areas with a median house construction date before 1980. Later suburban areas have later median house construction dates.

    Urban cores are defined as areas (ZCTAs) that have high population densities (7,500 or more per square mile or 2,900 per square kilometer or more) and high transit, walking and cycling work trip market shares (20 percent or more). Urban cores also include non-exurban sectors with median house construction dates of 1945 or before. All of these areas are defined at the zip code tabulation area (ZCTA) level.

    —–

    Photo: Beyond Polycentric Houston (by author)

  • Boomers: Moving Further Out and Away

    There have been frequent press reports that baby boomers, those born between 1945 and 1964, are abandoning the suburbs and moving "back" to the urban cores (actually most suburban residents did not move from urban cores). Virtually without exception such stories are based on anecdotes, often gathered by reporters stationed in Manhattan, downtown San Francisco or Washington or elsewhere in urban cores around the nation. Clearly, the anecdotes about boomers who move to suburbs, exurbs, or to outside major metropolitan areas are not readily accessible (and perhaps not as interesting) to the downtown media.

    Yet there is a wide gulf between the perceived reality of the media stories and what is actually occurring on the ground, as is indicated by comprehensive sources. The latest available small area data shows that baby boomers continue to leave the urban cores in large numbers. They have also left the earlier suburbs in such large numbers that their population gains in the later suburbs and exurbs have been insufficient to stem boomer movement out of the major metropolitan areas to smaller cities and rural areas.

    These conclusions are drawn from an analysis of population at the zip code tabulation area (ZCTA) among those 35 to 54 years of age in 2000 and the same cohort in 2010 (then 45 to 64 years of age). This small area analysis avoids the exaggeration of urban core data that necessarily occurs from reliance on the municipal boundaries of core cities (which are themselves nearly 60 percent suburban or exurban, ranging from as little as three percent to virtually 100 percent). This is described in further detail in the "City Sector Model" note below.

    Overall Trend

    The national population of the baby boomer generation declined 1.82 million between 2000 and 2010, a 2.2 percent loss (the result of an inevitably increasing death rate from the aging of cohorts). A small increase of 350,000 (1.0 percent) outside the largest cities was more than offset by a 2.17 million loss in the major metropolitan areas (over 1 million population), where the decline was of 4.7 percent.

    Boomers and the Urban Core

    The largest percentage loss occurred in the functional urban cores, which experienced a decline of 1.15 million baby boomers, a reduction of 16.7 percent. The functional urban cores are defined by the higher population densities that predominated before 1940 and a much higher dependence on transit, walking and cycling for work trips (further details are provided in the "City Sector Model" note below). In 2000, baby boomers accounted for 14.9 percent of the major metropolitan area population, a figure that declined to 13.0 percent by 2010 (Figure 1).

    The losses were pervasive. Among the 24 major metropolitan areas with functional urban core populations above 100,000, all experienced reductions in their baby boomer population shares. The average share reduction was approximately 12 percent.

    Not surprisingly, the leading urban core magnets of New York and San Francisco did the best, losing 4.3 percent and 5.8 percent of their boomer population share between 2000 and 2010. Providence, Los Angeles,and Boston rounded out the best five.

    Among the 24 metropolitan areas with the largest functional urban cores, Detroit experienced the largest proportional boomer loss, at 21.2 percent. Kansas City, Washington, and Minneapolis-St. Paul lost from 17 percent to 19 percent, proportionally, of their boomer urban core populations. Despite its reputation for core renewal, Portland experienced an approximate 15 percent proportional loss of its urban core boomers, along with Milwaukee and Cleveland (Figure 2).

    Boomers and the Earlier Suburbs

    The reduction in baby boomer population was even greater in the earlier suburban areas (those with median house construction dates of 1979 or before). The 2.33 million earlier suburban population loss was double that of the functional urban core loss, but because of this population is much larger than the functional cores, the overall drop was a smaller 11.1 percent. Nonetheless, the earlier suburbs continue to house the largest share of major metropolitan boomers. This fell, however, from 45.3 percent in 2000 to 42.2 percent in 2010.

    Combined, the urban cores and earlier suburbs lost 3.48 million boomers between 2000 and 2010.

    Boomers and the Later Suburbs and Exurbs

    In contrast, the later suburban areas (median house construction date 1980 or later) added approximately 750,000 baby boomers, for an increase of 6.8 percent. The later suburbs also experienced an increase in their share of major metropolitan boomers, rising from 24.0 percent in 2000 to 26.9 percent in 2010.

    The exurban gain was greater than the later suburbs in percentage terms (7.7 percent) but less in population gain (560,000). This was enough to increase the exurban share of boomers from 15.8 percent in 2000 to 17.9 percent in 2010. Indeed, the exurban areas of the 24 major metropolitan areas with urban cores over 100,000 population all did better in attracting or retaining boomer populations than both the urban cores and the earlier suburbs.

    Overall there was a 5.0 percentage point transfer of boomer share from the functional urban cores and earlier suburbs to the later suburbs and exurbs, reflecting their more than 1.3 million gain between 2000 and 2010.

    Boomers and the Nation

    Moreover, the data indicates that boomers are leaving the major metropolitan areas to move to smaller cities or even to rural areas. In contrast with the 2.17 million major metropolitan area loss, areas outside the major metropolitan areas added 350,000 boomers between 2000 and 2010. In 2000, smaller cities and rural areas housed 44.4 percent of the boomer population. By 2010, the smaller city and rural share had risen to 45.8 percent (Figure 3). By contrast, over the same period, the major metropolitan areas increased their proportion of the US population, from 54.5 percent in 2000 to 54.9 percent in 2010.

    America’s downtowns (generally a smaller area than the larger urban cores), have done much better in recent years, as they have become safer and as a "100 year flood" of economic retrenchment has reduced many to renting rather than buying. Yet, overall, urban cores have done less well, with Census Bureau data showing that the population gains within two miles of largest municipality city halls being more than offset by losses in the two to five mile radius between 2000 and 2010. These loses are not limited to the overall population, but extend to share losses among Millennials and population losses among the boomers.

    Wendell Cox is principal of Demographia, an international public policy and demographics firm. He is co-author of the "Demographia International Housing Affordability Survey" and author of "Demographia World Urban Areas" and "War on the Dream: How Anti-Sprawl Policy Threatens the Quality of Life." He was appointed to three terms on the Los Angeles County Transportation Commission, where he served with the leading city and county leadership as the only non-elected member. He was appointed to the Amtrak Reform Council to fill the unexpired term of Governor Christine Todd Whitman and has served as a visiting professor at the Conservatoire National des Arts et Metiers, a national university in Paris.

    ———–

    City Sector Model Note: The City Sector Model allows a more representative functional analysis of urban core, suburban and exurban areas, by the use of smaller areas, rather than municipal boundaries. The more than 30,000 zip code tabulation areas (ZCTA) of major metropolitan areas and the rest of the nation are categorized by functional characteristics, including urban form, density and travel behavior. There are four functional classifications, the urban core, earlier suburban areas, later suburban areas and exurban areas. The urban cores have higher densities, older housing and substantially greater reliance on transit, similar to the urban cores that preceded the great automobile oriented suburbanization that followed World War II. Exurban areas are beyond the built up urban areas. The suburban areas constitute the balance of the major metropolitan areas. Earlier suburbs include areas with a median house construction date before 1980. Later suburban areas have later median house construction dates.

    Urban cores are defined as areas (ZCTAs) that have high population densities (7,500 or more per square mile or 2,900 per square kilometer or more) and high transit, walking and cycling work trip market shares (20 percent or more). Urban cores also include non-exurban sectors with median house construction dates of 1945 or before. All of these areas are defined at the zip code tabulation area (ZCTA) level.

  • Urban Cores, Core Cities and Principal Cities

    Many American cities, described commonly as urban cores, are functionally more suburban and exurban, based on urban form, density, and travel behavior characteristics. Data from the 2010 census shows that 42.3 percent of the population of the historical core municipalities was functionally urban core (Figure 1). By comparison, 56.3 of the population lived in functional suburbs and another 1.3 percent in functionally exurban areas (generally outside the urban areas). Urban cores are defined as areas that have high population densities (7,500 or per square mile or 2,900 per square kilometer or more) and high transit, walking and cycling work trip market shares (20 percent or more). Urban cores also include non-exurban sectors with median house construction dates of 1945 or before. All of these areas are defined at the zip code tabulation area (ZCTA) level, rather than by municipal jurisdiction. This is described in further detail in the "City Sector Model" note below.

    The Varieties of Central Cities

    Of course the “urbaneness” of central cities vary greatly. Some, like New York, Boston, Chicago, and San Francisco experienced much of their growth before the 20th century, well before the great automobile oriented suburbanization that occurred after World War II. Others, that experienced early growth, such as Milwaukee and Seattle, annexed substantial areas of suburbanization after World War II, so that their comparatively large functional urban cores have been overwhelmed by suburbs within the city limits. Los Angeles, with a large functional urban core, annexed huge swaths of agricultural land that later became suburban. Finally, a number of other central cities, such as Phoenix and San Jose, have developed since World War II and are virtually all suburban,

    Moreover, central cities comprise very different proportions of their respective metropolitan areas (the functional or economic definition of "city"). For example, the central city of San Antonio comprises 62 percent of the San Antonio metropolitan area population. Conversely, the city of Atlanta comprises only 8 percent of the Atlanta metropolitan area population. Obviously, with such a large differential, the term central city describes jurisdictions that are radically different.

    This difference is caught by examining the functional urban cores by historical core municipality classifications. The Pre-World War II Core & Non-Suburban central cities have functional urban cores comprising 72 percent of their population. The Pre-World War II Core & Suburban central cities have functional urban cores that are only 14 percent of their populations. The Post-World War II Suburban central cities have very small urban cores, representing only 2 percent of their population (Figure 2).

    Among the 54 historical core municipalities, the share of central city population in the functional urban cores varies from a high of more than 97 percent (New York) to virtually zero (Birmingham, Charlotte, Dallas, Jacksonville, Orlando, Phoenix, Raleigh, San Bernardino, San Jose, and Tampa).

    Core Cities with the Strongest Urban Cores

    It is not surprising that the central cities with the largest share of their populations in the functional urban cores are in the older, established are concentrated in the Northeast Corridor (Washington to Boston) and the Midwest. Only one of the 14 central cities with the highest population share in functional urban cores is outside these areas is San Francisco, the first large city to be built on the American West Coast Among the 25 central cities with the highest functional urban core share, only seven are outside the Northeast Corridor or the Midwest (San Francisco, Oakland, Seattle, New Orleans, Portland, Los Angeles and Salt Lake City).

    It is not surprising that the city of New York has the largest function urban core population share, at 97.3 percent. Nearly one-third of the total urban core population in the 52 major metropolitan areas lives in the city of New York (nearly 8,000,000 residents).

    Two other central cities have functional urban core population percentages above 90 percent. Buffalo ranks second, at 94.5 percent. San Francisco is third at 94.0 percent.

    The next three highest ranking cities are in New England. Boston has an 89.7 percent functional urban core population, followed by Hartford (87.4 percent), and Providence (86.5 percent). These are all of the major metropolitan areas in New England.

    Three Midwestern central cities have more than 80 percent of their populations in functional urban cores, including St. Louis (84.1 percent), Minneapolis (83.5 percent), and Cleveland (80.1 percent). Washington (83.4 percent) and Philadelphia (83.4 percent), in the Northeast Corridor also have greater than 80 percent functional urban core shares.

    Pittsburgh (76.9 percent) and Chicago (76.6 percent) have functional urban core population shares between 70 percent and 80 percent. At 67.7 percent, Baltimore (67.7 percent) is the only central city in the Northeast Corridor that with less than 70 percent of its population in the functional urban core.

    Oakland (54.7 percent), at 15th, is the highest ranking central city outside the Northeast Corridor and the Midwest other than San Francisco. Cincinnati, Rochester, and Milwaukee also have more than 50 percent of their population in functional urban cores.

    The top 25 is rounded out by Seattle (37.5 percent), New Orleans (36.8 percent), St. Paul (36.7 percent), Portland (35.2 percent), Detroit (31.3 percent), Los Angeles (29.9 percent) and, somewhat unexpectedly, Salt Lake City (27.1 percent).

    The central cities with the largest functional urban core percentages have overwhelmingly suffered large population losses. Among the 25 with the largest urban core shares, only seven were at their peak populations at the 2010 census, and only two of the top 18 (New York and San Francisco). Overall the cities with large functional cores lost more than 35 percent of their population and 8 million residents.

    "Other" Principal Cities

    Starting in 2003, the Office of Management and Budget (OMB) retired the term "central city" and replaced it with "principal city," which includes the 54 former historical core municipalities and approximately 160 additional cities. The adoption of principal city terminology recognized as OMB described it, that metropolitan areas were no longer monocentric, but had become polycentric. OMB specifically rejected the use of geographical terms other than "principal city" within metropolitan areas, including "suburb." Indeed, the very employment of polycentricity that justified abandonment of the central city designation was the suburbanization of employment. Yet some popular usage (even in some Census Bureau documents), considers any area that is not a principal city as suburban. The more appropriate term would be "not principal city."

    Some principal cities that are not historical core municipalities ("other" principal cities) have strong urban cores, especially in metropolitan areas where the urban core stretches well beyond the core municipality’s city limits, especially in New York and Boston. Four such principal cities have urban cores larger than 100,000 and urban core population shares exceeding 90 percent, including Cambridge in the Boston area (97.0 percent, and the New York area’s Newark (94.7 percent) and Jersey City (100.0 percent), which is higher even than New York City itself. None of these cities was at its population peak in 2010.

    Even so the vast majority of the "other" principal cities are overwhelmingly suburban, comprising less of the functional urban core population than areas that are not principal cities (1.5 million compared to 4.1 million outside the principal cities). Overall, the other principal cities are 7.9 percent urban core (compared to 42.3 percent for the historical core municipalities). If the 11 municipalities with cores larger than 50,000 are excluded, the share living in functional urban cores for the remaining more than 150 cities is 1.5 percent. (Figure 4).

    Crude Measurement

    The perhaps stunning conclusion is that the average difference between the historical core municipality population and the functional urban core population is 73 percent. Core cities — themselves 57 percent suburban and exurban — are a crude basis for classifying urban cores and suburbs. Principal cities — 92 percent functionally suburban or exurban — are even worse. The bottom line: America is fundamentally more suburban in nature than commonly believed.

    —–

    City Sector Model Note: The City Sector Model allows a more representative functional analysis of urban core, suburban and exurban areas, by the use of smaller areas, rather than municipal boundaries. The nearly 9,000 zip code tabulation areas (ZCTA) of major metropolitan areas are categorized by functional characteristics, including urban form, density and travel behavior. There are four functional classifications, the urban core, earlier suburban areas, later suburban areas and exurban areas. The urban cores have higher densities, older housing and substantially greater reliance on transit, similar to the urban cores that preceded the great automobile oriented suburbanization that followed World War II. Exurban areas are beyond the built up urban areas. The suburban areas constitute the balance of the major metropolitan areas. Earlier suburbs include areas with a median house construction date before 1980. Later suburban areas have later median house construction dates.

    —–

    Wendell Cox is principal of Demographia, an international public policy and demographics firm. He is co-author of the "Demographia International Housing Affordability Survey" and author of "Demographia World Urban Areas" and "War on the Dream: How Anti-Sprawl Policy Threatens the Quality of Life." He was appointed to three terms on the Los Angeles County Transportation Commission, where he served with the leading city and county leadership as the only non-elected member. He was appointed to the Amtrak Reform Council to fill the unexpired term of Governor Christine Todd Whitman and has served as a visiting professor at the Conservatoire National des Arts et Metiers, a national university in Paris.

    Photo: Downtown Houston (by author)

  • Large Urban Cores: Products of History

    Urban cores are much celebrated but in reality most of the population living in functional urban cores is strongly concentrated in just a handful of major metropolitan areas in the United States. This conclusion is based on an analysis using the City Sector Model, which uses functional characteristics, rather than municipal jurisdictions, to analyze urban core and suburban components of metropolitan areas.

    Functional Classifications of Metropolitan Areas

    The City Sector Model allows a more representative functional analysis of urban core, suburban and exurban areas, by the use of smaller areas, rather than municipal boundaries.

    The nearly 9,000 zip code tabulation areas of major metropolitan areas are categorized by functional characteristics, including urban form, density, and travel behavior. There are four functional classifications, the urban core, earlier suburban areas, later suburban areas and exurban areas. The urban cores have higher densities, older housing and substantially greater reliance on transit, similar to urban cores that existed before the post-World War II automobile oriented suburbanization. Exurban areas are beyond the built up urban areas. The suburban areas constitute the balance of the major metropolitan areas. Earlier suburbs include areas with a median house construction date before 1980. Later suburban areas have later median house construction dates.

    Concentrating in New York and A Few Other Areas

    As is so often the case on dense urbanization, the statistics are dominated by New York urban core which accounts for 42 percent of the total urban core population for the whole country. The New York metropolitan area, with 19.6 million people represents roughly six percent of the country’s population but its urban core –some 10.2 million strong – is larger than the total population of every metropolitan area in the nation other than Los Angeles (12.8 million).

    New York’s dominance is not surprising, reflecting its unique history and development.  Four of the core city’s five boroughs (Brooklyn, Queens, Manhattan, and the Bronx) have higher population densities than any municipality more than one-one hundredth its size in the United States. Significantly, unlike most major metropolitan areas, New York’s functional urban core stretches well beyond the core city, and includes more than 2,000,000 residents outside New York City.

    Another 36 percent of the nation’s urban core population is in six metropolitan areas, though none reaches a population close to that of New York (Figure 1). Chicago is second, with an urban core population of 2.4 million. Four other urban cores exceed 1,000,000 population, including Boston (1.6 million), Philadelphia (1.5 million), Los Angeles (1.3 million) and San Francisco (1.1 million). The seventh largest urban core is in Washington, at 900,000. These seven metropolitan areas include the six transit legacy cities (municipalities), which account for 55 percent of the transit work trip destinations and 99 percent of the increase in urban core transit commuting in the United States over the past 10 years.(Los Angeles is not classified as a transit legacy city).

    After Washington, the size of urban cores drops off markedly with the next 45 largest metropolitan areas accounting for only 22 percent of the urban core population. Cleveland ranks eighth at 460,000, Baltimore is ninth at 440,000, and Minneapolis-St. Paul is 10th with 420,000 urban core residents. Perhaps surprisingly, Providence, which is the nation’s 38th largest metropolitan area, ranks 11th in urban core population, at 410,000 residents. Pittsburgh, Milwaukee, Buffalo, and St. Louis round out the top 15, with between 320,000 and 370,000 urban core residents (Figure 2).

    Another 9 metropolitan areas have urban core populations exceeding 100,000:Detroit, Seattle, Cincinnati, Portland, Hartford, New Orleans, Rochester, Kansas City, and Louisville.

    Urban Cores over 100,000 Population

    Approximately 97 percent of the urban core population lives in the 24 major metropolitan areas with more than 100,000 urban core residents. Between 2000 and 2010, the urban core populations in these areas dropped from 25.3 percent to 24.0 percent of their respective metropolitan populations. The continued decentralization of these metropolitan areas is illustrated by a loss in the earlier suburban areas and gains in the later suburban areas and exurban areas (Figure 3).

    By comparison, only one percent of the population was in the urban cores of the other 28 major metropolitan areas (fewer than 100,000 residents in the urban core).

    New York had by far the largest percentage of its total metropolitan population in the urban core, at 52 percent. Boston ranked second, with 34 percent of its population in the urban core. Buffalo, which was ranked only 47th in metropolitan area population, was third in urban core population share (29 percent). Chicago and San Francisco had 26 percent of their population in the urban cores, followed by Providence and Philadelphia at 25 percent (Figure 4).

    Description of the Largest Urban Cores

    There is substantial variation in the geographical extent of the largest urban cores relative to their corresponding historical core municipalities. This is described below and illustrated in the just published Demographia City Sector Model Metropolitan Area Maps.

    As would be expected, New York’s urban core includes nearly all of the city of New York. Virtually all of Brooklyn, Manhattan, the Bronx, and Queens are in the urban core, though only parts of Staten Island are included. The urban core extends into New Jersey, with nearly all of Hudson County (including Jersey City) included, the core of Essex County (including Newark) and the city of Elizabeth (in Union County). The urban core and extends into Long Island’s Nassau County, including Hempstead, Valley Stream, Rockville Center and other areas. To the north, the urban core extends to parts of Westchester County (such as Yonkers, Pelham, Mount Vernon and New Rochelle). Interestingly, many of these areas, such as in western Nassau County, parts of Essex County and southern Westchester County are also suburban in form, but are classified as urban core because of high transit market shares, higher densities or pre-war development.

    Chicago’s urban core, the second largest, extends beyond but also excludes parts of the city of Chicago. The urban core extends into adjacent areas, such as older “suburban” Evanston, Oak Park and Cicero. There is also a significant urban core in northwestern Indiana, centered on East Chicago and Hammond.

    Boston’s urban core extends far outward from the city of Boston, including much of the area inside Route 128 (Interstate 95). This area also includes cities such as Cambridge, Everett, Somerville, Quincy, Medford, Waltham, and Lynn.

    Philadelphia’s urban core is largely confined to the city of Philadelphia, with extensions into Delaware County, Pennsylvania and Camden County, New Jersey.

    The urban core of Los Angeles is principally in the area extending from Hollywood to parts of East Los Angeles and south to the Interstate 105 freeway. However, much more of the city of Los Angeles is not in the urban core. The urban core also includes parts of Beverly Hills, West Los Angeles, Pasadena and Glendale.

    The urban core of San Francisco includes most of the cities of San Francisco and Oakland, as well as much of Berkeley, Albany, and Emeryville.

    Washington’s urban core includes most of Washington (the District of Columbia) and extends into Arlington and Alexandria in Virginia and has a large extension into Montgomery County, Maryland, including areas such as Bethesda and Silver Spring.

    Urban Cores Compared to Historical Core Municipalities

    A comparison of functional urban core populations to the populations of historical core municipalities indicates the problem of relying on jurisdictional (municipal) boundaries for urban core analysis. Functional urban core and historical core municipality populations vary significantly (Figure 5). The greatest differences are in Boston and Louisville. Boston’s functionalurban core population is 2.52 times that of the historical core municipality (Boston). Louisville’s functional urban core population is only one-sixth that of the historical core municipality (Louisville).

    Providence is second to Boston in its ratio of urban core population to that of historical core municipality at 2.29. The city of Providence had only 178,000 residents in 2010. (Among historical core municipalities, only Hartford was smaller at 125,000). Washington has an urban core population 1.49 times that of the historical core municipality, while New York and Buffalo had urban cores 1.25 times the population of their historical core municipalities.

    Among urban cores with more than 100,000 population Kansas City, Los Angeles, Portland, and New Orleans follow Louisville with the lowest ratios to historical core municipality populations (from 24 percent to 37 percent). In each of these cases, the urban core’s low ratio is the result of substantial annexations or large areas or the settling of large rural territories that had been previously included in the municipal limits (such as Los Angeles and New Orleans).

    Urban Cores: Products of History

    Indeed, nothing distinguishes the major metropolitan areas with larger urban core populations from the rest than history, In1940, just before the great mobility and suburbanization revolution, there were 23 metropolitan areas in the United States with wore than 500,000 population. The major metropolitan areas with the 19 largest urban cores in 1940 were all among the 23 with more than 500,000 population in 1940. Out of the 24 major metropolitan areas with more than 100,000 urban core residents in 2010, 21had more than 500,000 population in 1940 (only Hartford, Rochester and Louisville had smaller populations).

    Conversely, only two of the 28 major metropolitan areas in 2010 with fewer than 100,000 functional urban core residents had more than 500,000 residents in 1940, and they were among the smaller (Houston with 528,000 and Atlanta with 518,000).

    Urban cores were not planned, but rather were the result of consumer trendsin a time of much lower household incomes and much more restricted personal mobility. Many of the very centers of urban cores are reviving, but overall core growth continues to lag behind that of metropolitan areas. Moreover, there are no significant new ones.Urban cores, as much as anything, are a product of history.

    ————

    Wendell Cox is principal of Demographia, an international public policy and demographics firm. He is co-author of the "Demographia International Housing Affordability Survey" and author of "Demographia World Urban Areas" and "War on the Dream: How Anti-Sprawl Policy Threatens the Quality of Life." He was appointed to three terms on the Los Angeles County Transportation Commission, where he served with the leading city and county leadership as the only non-elected member. He was appointed to the Amtrak Reform Council to fill the unexpired term of Governor Christine Todd Whitman and has served as a visiting professor at the Conservatoire National des Arts et Metiers, a national university in Paris.

    ————

    Illustration: Core of the New York metropolitan area (City Sector Model map)

  • Demographia City Sector Maps Available

    Maps have been published illustrating the City Sector Model functional urban classifications for the 52 major metropolitan areas in the United States. The maps are available at Demographia City Sector Model Metropolitan Area Maps.

    Functional Classifications of Metropolitan Areas

    The City Sector Model allows a more representative functional analysis of urban core, suburban and exurban areas, by the use of smaller areas, rather than municipal boundaries.

    The nearly 9,000 zip code tabulation areas of major metropolitan areas are categorized by functional characteristics, including urban form, density and travel behavior. There are four functional classifications, the urban core, earlier suburban areas, later suburban areas and exurban areas. The urban cores have higher densities, older housing and substantially greater reliance on transit, similar to the urban cores that preceded the great automobile oriented suburbanization that followed World War II. Exurban areas are beyond the built up urban areas. The suburban areas constitute the balance of the major metropolitan areas. Earlier suburbs include areas with a median house construction date before 1980. Later suburban areas have later median house construction dates.