Tag: congestion

  • This is Not the Way to Fix Toronto’s Transit

    Results and not ideology should guide transportation policy.

    Large city officials have been lobbying for a major program of federal transit subsidies for years. The push will likely intensify after the federal election.

    A principal resource in this campaign will likely be the Toronto Board of Trade’s third annual Scorecard on Prosperity, which finds Toronto’s transportation system to be among the worst in the world, ranking 19th out of 23 metropolitan areas. Other metropolitan areas also ranked poorly, such as Montreal at 12th, Calgary at 13th and Vancouver at 21st.

    However, a deeper look yields difficulties with the Board of Trade report.

    Automobiles dominate travel in all but two of the metropolitan areas (Hong Kong and Tokyo). Yet, only two of 11 indicators involve automobiles. Eight relate to non-automobile modes such as transit (one deals with freight). The Board of Trade comparisons are skewed because they give disproportionate weight to modes that are relatively minor in metropolitan mobility.

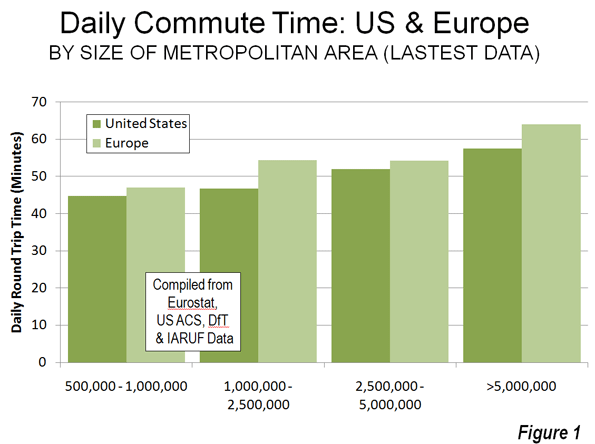
    However, the greatest difficulty with the Scorecard is the implied belief greater reliance on transit is preferable. In fact, transit is slower than cars for the majority of trips. Travel time needs to decrease to encourage metropolitan economic growth, as research at the University of Paris indicates. There is probably no more important transportation indicator regarding the economy.

    A Globe and Mail article rightly expresses particular concern that Toronto’s round-trip average work trip time ranks last at 80 minutes per day. However, at least two of the metropolitan areas had longer work trip travel times. The average work trip travel time in the Tokyo metropolitan area was 96 minutes in 2003 (the latest data available), according to the Japan Statistics Bureau. The Board of Trade failed to find a number for Hong Kong, which the government reported at 92 minutes in 2002. Yet, these travel time laggards rank first and second in the Board of Trade rankings.

    It should be a source of embarrassment that Dallas-Fort Worth, a bane of urban planners and with less than half the Toronto density, should have a work trip travel time one-third less and one-fifth less, respectively, than Calgary and Vancouver, the highest ranked Canadian metropolitan areas.

    It’s worse than that. Among all of the large American metropolitan areas, in or out of The Scorecard on Prosperity, all but New York have better work trip travel times.

    Except in the romantic minds of planners, little of the present car travel demand can be replaced by transit. Further, in virtually all of the metropolitan areas ranking above Toronto, the trajectory has been toward cars, so that the present figures are less favourable to transit than they would have been a decade or two ago.

    For transport to make the greatest possible contribution to economic growth and job creation, the transport system must provide quick mobility throughout the entire labour market (metropolitan area). Transit-favouring ideology will not do.

    The problem is evident. The $8 billion just committed by Mayor Rob Ford and Premier Dalton McGuinty to build an Eglinton subway should be used to reduce travel times as much as possible.

    A huge expenditure on a single street will not do that.

    So long as ideology trumps reality, Toronto’s calcified traffic will put it at a competitive disadvantage. The focus should be on results — the time it takes to get to work, rather than on means — whether the trip is by car or transit.

    Wendell Cox writes here as a Senior Fellow at the Frontier Centre for Public Policy in Winnipeg and is a regular contributor to NewGeography.com. This piece also appeared in the Toronto Sun.

  • The Transportation Politics of Envy: The United States & Europe

    The Department for Transport of the United Kingdom may be surprised to learn that the average round-trip commute in the nation is up to a quarter hour less than reflected in its reports. This revelation comes from an article in The Economist, ("Life in the Slow Lane") citing a survey indicating that the average commuter in the United Kingdom spends less than 40 minutes daily traveling to and from work in 2000. According to Regional Transport Statistics, published by the Department for Transport, the average commuter spent 50 minutes traveling to and from work in 2000. The UK government further indicates that the average commute time had risen to 56 minutes by 2009. The Economist relies on the much lower figure (and other similarly low estimates from other European nations) in fashioning an article criticizing transportation policy in the United States.

    Shorter US Commute Times: The Economist begins with the contention that the average work trip travel time in the United States is substantially greater than that of the number of European nations. The most reliable data says otherwise.

    The most comprehensive work trip data in Europe is maintained by Eurostat, the statistical agency of the European Commission. The Eurostat data indicates that average commute times in Europe are somewhat more than in the United States in metropolitan areas of similar size (Figure 1), when compared to the comprehensive data from the US Census Bureau. For example, among metropolitan areas of more than 5 million population, the daily round-trip average commute is under 58 minutes in the United States, less than the 64 minutes in Europe. European commute times are longer in all population categories (Note).

    Overall, the average round-trip travel time in the US metropolitan areas over 500,000 population is 23.6 minutes and 25.3 minutes in the European metropolitan areas.

    Moreover, there are indications that the US trend is favorable, at least in comparison to the United Kingdom. Between 2000 and 2009, UK government data shows average round trip commute times to have increased six minutes, while US government data indicates a decline of nearly one minute (Figure 2).

    The US: Less Traffic Congestion:  The Economist then asserts that traffic congestion is worse in US metropolitan areas than in Europe. According to The Economist:

    …with few exceptions (London among them) American traffic congestion is worse than western Europe’s. Average delays in America’s largest cities exceed those in cities like Berlin and Copenhagen.

    The reality is the opposite, according to the INRIX Traffic Scorecard and a more correct rendering of the point above would have been:

    … with few exceptions (Los Angeles among them) western Europe’s traffic congestion is worse than America’s. Average delays in some of western Europe’s smallest cities exceed those in cities like Atlanta, Houston and Dallas-Fort Worth.

    INRIX compared 2010 peak period traffic delays in metropolitan areas of the United States and Europe. As with commuting time, the average travel delay per driver was greater in Europe than in the United States in every population classification. While Los Angeles has the worst congestion the approximately 200 metropolitan areas (one-half in the US and one-half in Europe), the next 13 worst were in Europe (Honolulu ranks 15th) and 18 of the worst 20 were in Europe (Figure 3). The third worst ranking US metropolitan area was San Francisco, at 28th, while Washington was 29th. Only seven of the 50 most congested metropolitan areas were in the United States. Of course, anyone who has driven extensively in the metropolitan areas of the US and western Europe knows that congestion is generally far worse in Europe, a fact confirmed by the INRIX data.

    Indeed, traffic congestion in the smallest European metropolitan areas (under 500,000) was worse than in the largest US metropolitan areas, those with over 5 million (There were no US metropolitan areas with less than 500,000 population in the INRIX data, see Figure 4). Those automobile-oriented, highly suburbanized banes of urban planning, Atlanta, Dallas-Fort Worth and Houston all ranked in the middle, between 90th and 110th. At least 75 European metropolitan areas had worse traffic congestion than all three.

    High-Speed Rail Envy: Finally, The Economist decries the lack of high-speed rail in the United States, noting that:

    The absence of true high-speed rail is a continuing embarrassment to the nation’s rail enthusiasts.

    It is hard to imagine a more pathetic standard for evaluating public policy than "satisfying rail enthusiasts."  It is well known that that governments from Washington to London, Athens and Lisbon are in serious financial difficulty. It is a time for limiting public expenditures to matters of genuine priority. That does not include high speed rail.

    The intercity road and airport systems are principally financed by users, in contrast to the operating subsidies and intense (100 percent) capital subsidies required by high-speed rail. This is evident in California with its now $65 billion first line that has more than doubled in real cost in a decade. It is also evident, closer to home for The Economist, where the controversial HS-2 high-speed rail proposal from London to Manchester and Leeds could easily double in cost (to £65 billion), based upon the best international research. Astoundingly, a doubling of cost would be a bargain for Britain’s taxpayers compared to two previous high-speed rail failures in the same corridor (See: The High Speed Rail Battle of Britain). The recurring environmental justifications ring hallow due to the high costs and the three generations or more it would require in California and the United Kingdom to eliminate the first gram of greenhouse gas.

    Transport policy could be improved in the United States, as well as in Europe. However, the starting point must be facts, not fancy, and certainly not envy.

    ——-

    Note: this analysis includes all data available for metropolitan areas in the United States (metropolitan statistical areas) and Europe (larger urban zones, the closest equivalent to US metropolitan areas). US data is complete, covering all 100 metropolitan areas with more than 500,000 population and is from the United States Census Bureau. European data is principally from Eurostat (94 larger urban zones and three from other sources). Paris data is from IAURIF (Institut d’aménagement et d’urbanisme de la région Île-de-France). Newcastle-upon-Tyne and Leeds data is from the UK Department for Transport.  Data is not available for a number of metropolitan areas with more than 500,000 population in Europe.

  • Kudos to Houston Traffic from IBM

    IBM has released its annual “Commuter Pain Index,” which ranks traffic congestion in 20 metropolitan areas around the world. According to IBM, the Commuter Pain Index includes 10 issues: “1) commuting time, 2) time stuck in traffic, agreement that: 3) price of gas is already too high, 4) traffic has gotten worse, 5) start-stop traffic is a problem, 6) driving causes stress, 7) driving causes anger, 8) traffic affects work, 9) traffic so bad driving stopped, and 10) decided not to make trip due to traffic.”

    Each metropolitan area is given a score between 0 and 100, with the highest score indicating the worst traffic congestion (See Table).

    IBM Commuter Pain Index: 2010
    Metropolitan Areas Ranked by Worst Traffic Congestion
    Rank Metropolitan Area Score (Worst to Best)
    1 Beijing 99
    1 Mexico City 99
    3 Johannesburg 97
    4 Moscow 84
    5 Delhi 81
    6 Sao Paulo 75
    7 Milan 52
    8 Buenos Aires 50
    9 Madrid 48
    10 London 36
    10 Paris 36
    12 Toronto 32
    13 Amsterdam 25
    13 Los Angeles 25
    15 Berlin 24
    16 Montreal 23
    17 New York 19
    18 Melbourne 17
    18 Houston 17
    20 Stockholm 15

    Favorable Urban Planning Characteristics Associated with Intense Traffic Congestion: The worst traffic congestion was recorded in the developing world metropolitan areas of Beijing, Mexico City, Johannesburg, Moscow, Delhi and Sao Paulo. In many ways, these metropolitan areas exhibit characteristics most admired by current urban planning principles. Automobile ownership and per capita driving is low. Transit carries at least 40% of all travel in each of the metropolitan areas. Yet traffic is intense. This is due to another urban planning “success,” objective, high population densities. Higher population densities are inevitably associated with greater traffic congestion (and more intense local air pollution), whether in the United States or internationally. All six of these metropolitan areas scored 75 or above, where a score of 100 would be the worst possible congestion.

    The next five metropolitan areas have accomplished nearly as much from an urban planning perspective. Milan, Buenos Aires, Madrid, London and Paris all achieve more than 20% transit market shares, and their higher urban densities also lead to greater traffic congestion. Each scores between 35 and 52.

    Traffic congestion is less in the next group, which includes Toronto, Los Angeles, Berlin, Amsterdam and Montreal. With the exception of Berlin, transit market shares are less, though the urban densities in all are above average US, Canadian and Australian levels. Amsterdam, the smallest metropolitan area among the 20, scores surprisingly poorly, since smaller urban areas are generally associated with lower levels of traffic congestion.

    The Least Congested Metropolitan Areas: Four metropolitan areas scored under 20, achieving the most favorable traffic congestion ratings. New York scores 19, with its somewhat lower density (the New York urban density is less than that of San Jose). Even lower density Melbourne and Houston score 17, tying for the second best traffic conditions. Stockholm achieves the best traffic congestion score, at 15, despite its comparatively high density. Stockholm is probably aided by its modest size which is similar to that of Orlando (Florida).

    The Houston Advantage: Perhaps the biggest surprise is Houston’s favorable traffic congestion ranking.

    • Houston has the lowest urban density of the 20 metropolitan areas.
    • Houston has the lowest transit market share, by far, at only 1%.
    • Houston also has the highest per capita automobile use among the IBM metropolitan areas.

    Yet Houston scored better than any metropolitan area on the list except for much smaller Stockholm. As late as 1985, Houston had the worst traffic congestion in the United States, according to the annual rankings of the Texas Transportation Institute. Public officials, perhaps none more than Texas Highway Commission Chair and later Mayor Bob Lanier led efforts to improve Houston’s road capacity, despite explosive population growth. Their initiatives paid off. By 1998, Houston had improved to 16th in traffic congestion in the United States. The population growth has been incessant, so much so that Houston has added more new residents since 1985 than live in Stockholm and more than half as many as live in Melbourne. While Houston had slipped to 11th in traffic congestion by 2007, the recent opening of a widened Katy Freeway and other improvements should keep the traffic moving in Houston better than in virtually all of the world’s other large metropolitan areas.

    Photo: Freeway in Houston