Tag: Dallas

  • The Shifting Geography of Black America

    Black population changes in various cities have been one of the few pieces of the latest Census to receive significant media coverage.  The New York Times, for example, noted that many blacks have returned to the South nationally and particularly from New York City.  The overall narrative has been one of a “reverse Great Migration.”  But while many northern cities did see anemic growth or even losses in black population, and many southern cities saw their black population surge, the real story actually extends well beyond the notion of a monolithic return to the South.

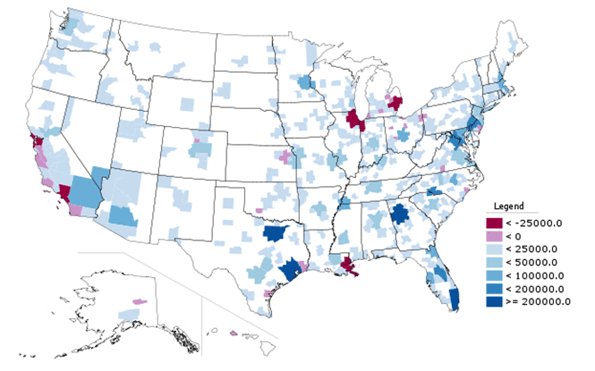
    The map below, showing total growth in Black Only population from 2000 to 2010, indeed shows that northern and west coast cities had low or even negative growth while various southern cities boomed.


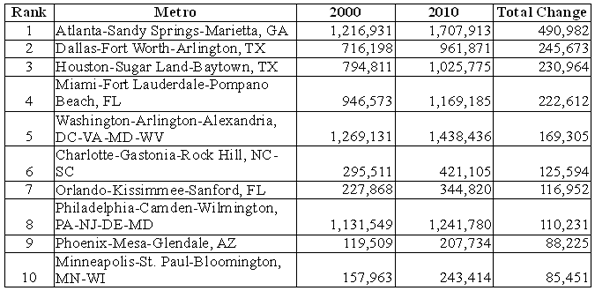
    Here is a list of the top ten metro areas (among those with more than a million total people) for black population growth:


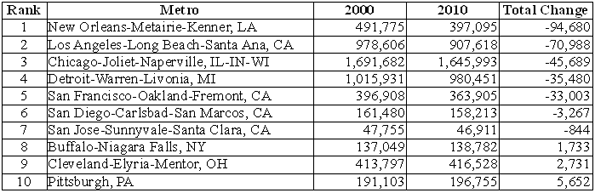
    And here are the bottom ten (among those with more than one million people):


    Of course, looking at total population numbers can mislead. Some cities grew slowly or lost people as a whole while others boomed. With Houston, Dallas, and Atlanta all adding over a million people each, it’s no surprise these regions added lots of blacks. Working and middle class African-Americans likely shared many of the same motivations to move to these cities – such as lower housing prices – as Americans of other ethnicities. In that light, a look at change in black population share (the percentage of the population that is black) provides additional perspective:


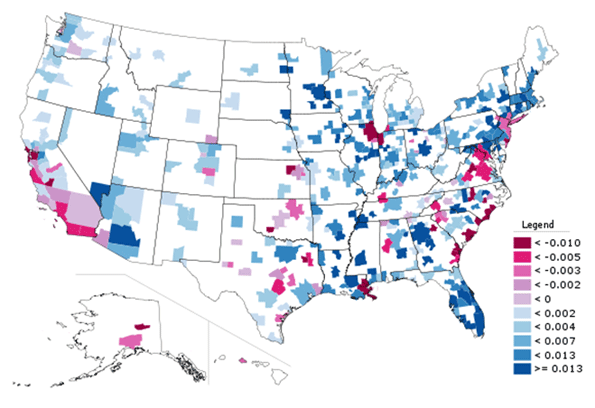
    Here we see not a single-minded return to the South, but a complex mixture of shrinking and growing regions in various parts of the country.  This includes some surprising places, like Minneapolis-St. Paul, which was one of the top ten metros in the country for total black population growth, and also saw its black population share grow strongly.  Now the Twin Cities, along with Columbus, Ohio, another strong performer, are two of the top destination for African immigrants from Somalia and elsewhere, which doubtless accounts for part of that strong growth. But anecdotal reports indicate that they are also benefitting from Chicago’s expanding black diaspora, along with places like Indianapolis and various Downstate metros.

    Atlanta, well known as America’s premier metro area for blacks, continued to dominate the charts. Not only far and away the leader in adding raw numbers of blacks, the African-American share also grew share strongly too. Charlotte is also clearly emerging as another key black population hub, ranking #6 in America for total black population growth, which is impressive for a smaller city, and adding nearly two percentage points in black population share.  It grew its black population much faster than other fast growing small cities like Raleigh or Nashville, and added share at more than three times as fast.

    By contrast, Houston, which grew total black population significantly, had a much lower share gain. Austin, one of America’s fastest growing metros, added only 28,000 blacks and actually lost black population share. And Washington, DC, despite being a traditional black population and cultural hub, also lost black population share regionally as gentrification in the District resulted in its loss of its black majority for the first time in decades, according to the Brookings Institution. 

    So even among rapidly growing metro areas in the South, the appeal to black population is selective, favoring places like Atlanta, Charlotte, Florida cities, and even slower growing cities along the length of the Mississippi River like Memphis.  Even some cities in the North are retaining their allure to blacks as well. Less favored or even out of favor are metros like DC, Dallas, and Houston as well as cities such as Charleston and Savannah along the southeast coast.

    Slow or negative black population growth is particularly concentrated in traditional tier one “global cities”, as well as those facing economic or other hardship like Detroit, Cleveland, and immediate post-Katrina New Orleans.

    The latter may be understandable – whites have been leaving these regions as well – but the former is quite troubling.  The global city model, focused on high end and creative services, is supposedly the bright and shining savior of American urbanism. Indeed, it’s hard to find a city that doesn’t have some aspect of that as a core plank in its civic strategy. Yet the cities that have been most focused at promoting this notion – such as New York, San Francisco, and Chicago – are generally those  disproportionately driving blacks away. The reasons for this aren’t clear, but the high and increasing cost of living in those places seems like one logical explanation.

    Here’s a more detailed look at the percentage growth in Black Only population in some tier one global type metros:


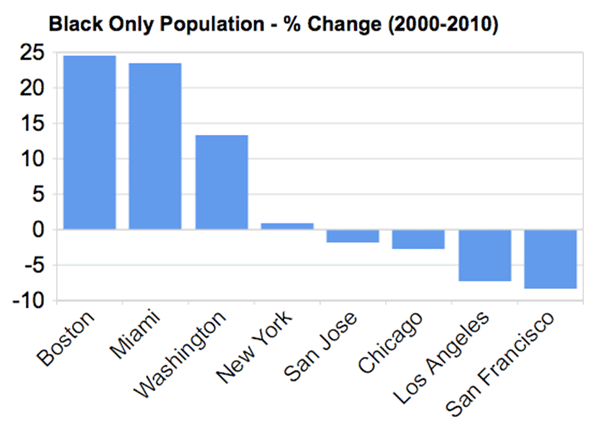
    New York barely broke even on black population, while Chicago, LA, and the Bay Area all actually lost black residents, a stunning reversal from their past as black magnets. However, Boston, not a traditional black population hub, grew its black population strongly on a percentage basis, as did Miami and DC, though as noted before, the share change in DC was negative.  Here is that metric for the same metros:


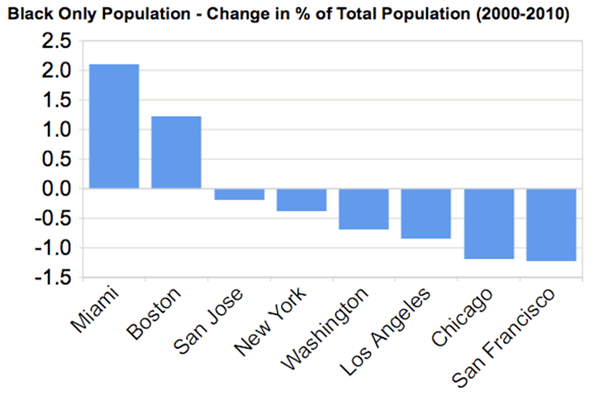
    With the notable exceptions of Boston and Miami – and Philadelphia, seldom ranked highly as a global city but still a traditional large northern metropolis – most global city regions appear to be increasingly inhospitable to Blacks.  Thus their model of success, whatever its appeal to some, at a basic level simply lacks inclusiveness. This shows its clear limits as an overall model for America’s urban centers as a whole.

    Aaron M. Renn is an independent writer on urban affairs based in the Midwest. His writings appear at The Urbanophile. Data analysis, maps, and charts in this piece were prepared with Telestrian.

  • The Next Boom Towns In The U.S.

    What cities are best positioned to grow and prosper in the coming decade?

    To determine the next boom towns in the U.S., with the help of Mark Schill at the Praxis Strategy Group, we took the 52 largest metro areas in the country (those with populations exceeding 1 million) and ranked them based on various data indicating past, present and future vitality.

    We started with job growth, not only looking at performance over the past decade but also focusing on growth in the past two years, to account for the possible long-term effects of the Great Recession. That accounted for roughly one-third of the score.  The other two-thirds were made up of a a broad range of demographic factors, all weighted equally. These included rates of family formation (percentage growth in children 5-17), growth in educated migration, population growth and, finally, a broad measurement of attractiveness to immigrants — as places to settle, make money and start businesses.

    We focused on these demographic factors because college-educated migrants (who also tend to be under 30), new families and immigrants will be critical in shaping the future.  Areas that are rapidly losing young families and low rates of migration among educated migrants are the American equivalents of rapidly aging countries like Japan; those with more sprightly demographics are akin to up and coming countries such as Vietnam.

    Many of our top performers are not surprising. No. 1 Austin, Texas, and No. 2 Raleigh, N.C., have it all demographically: high rates of immigration and migration of educated workers and healthy increases in population and number of children. They are also economic superstars, with job-creation records among the best in the nation.

    Perhaps less expected is the No. 3 ranking for Nashville, Tenn. The country music capital, with its low housing prices and pro-business environment, has experienced rapid growth in educated migrants, where it ranks an impressive fourth in terms of percentage growth. New ethnic groups, such as Latinos and Asians, have doubled in size over the past decade.

    Two advantages Nashville and other rising Southern cities like No. 8 Charlotte, N.C., possess are a mild climate and smaller scale. Even with population growth, they do not suffer the persistent transportation bottlenecks that strangle the older growth hubs. At the same time, these cities are building the infrastructure — roads, cultural institutions and airports — critical to future growth. Charlotte’s bustling airport may never be as big as Atlanta’s Hartsfield, but it serves both major national and international routes.

    Of course, Texas metropolitan areas feature prominently on our list of future boom towns, including No. 4 San Antonio, No. 5 Houston and No. 7 Dallas, which over the past years boasted the biggest jump in new jobs, over 83,000. Aided by relatively low housing prices and buoyant economies, these Lone Star cities have become major hubs for jobs and families.

    And there’s more growth to come. With its strategically located airport, Dallas is emerging as the ideal place for corporate relocations. And Houston, with its burgeoning port and dominance of the world energy business, seems destined to become ever more influential in the coming decade. Both cities have emerged as major immigrant hubs, attracting on newcomers at a rate far higher than old immigrant hubs like Chicago, Boston and Seattle.

    The three other regions in our top 10 represent radically different kinds of places. The Washington, D.C., area (No. 6) sprawls from the District of Columbia through parts of Virginia, Maryland and West Virginia. Its great competitive advantage lies in proximity to the federal government, which has helped it enjoy an almost shockingly   ”good recession,” with continuing job growth, including in high-wage science- and technology-related fields, and an improving real estate market.

    Our other two top ten, No. 9 Phoenix, Ariz., and No. 10 Orlando, Fla., have not done well in the recession, but both still have more jobs now than in 2000. Their demographics remain surprisingly robust. Despite some anti-immigrant agitation by local politicians, immigrants still seem to be flocking to both of these states. Known better s as retirement havens, their ranks of children and families have surged over the past decade. Warm weather, pro-business environments and, most critically, a large supply of affordable housing should allow these regions to grow, if not in the overheated fashion of the past, at rates both steadier and more sustainable.

    Sadly, several of the nation’s premier economic regions sit toward the bottom of the list, notably former boom town Los Angeles (No. 47). Los Angeles’ once huge and vibrant industrial sector has shrunk rapidly, in large part the consequence of ever-tightening regulatory burdens. Its once magnetic appeal to educated migrants faded and families are fleeing from persistently high housing prices, poor educational choices and weak employment opportunities. Los Angeles lost over 180,000 children 5 to 17, the largest such drop in the nation.

    Many of L.A.’s traditional rivals — such as Chicago (with which is tied at No. 47), New York City (No. 35) and San Francisco (No. 42) — also did poorly on our prospective list.  To be sure,  they will continue to reap the benefits of existing resources — financial institutions, universities and the presence of leading companies — but their future prospects will be limited by their generally sluggish job creation and aging demographics.

    Of course, even the most exhaustive research cannot fully predict the future. A significant downsizing of the federal government, for example, would slow the D.C. region’s growth. A big fall in energy prices, or tough restrictions of carbon emissions, could hit the Texas cities, particularly Houston, hard. If housing prices stabilize in the Northeast or West Coast, less people will flock to places like Phoenix, Orlando or even Indianapolis (No.11) , Salt Lake City (No. 12) and Columbus (No. 13). One or more of our now lower ranked locales, like Los Angeles, San Francisco and New York, might also decide to reform in order to become more attractive to small businesses and middle class families.

    What is clear is that well-established patterns of job creation and vital demographics will drive future regional growth, not only in the next year, but over the coming decade.  People create economies and they tend to vote with their feet when they choose to locate their families as well as their businesses.  This will prove   more decisive in shaping future growth   than the hip imagery and big city-oriented PR flackery that dominate media coverage of America’s changing regions.

    Cities of the Future Rankings
    Rank Metropolitan Area
    1 Austin, TX
    2 Raleigh, NC
    3 Nashville, TN
    4 San Antonio, TX
    5 Houston, TX
    6 Washington, DC-VA-MD-WV
    7 Dallas-Fort Worth, TX
    8 Charlotte, NC-SC
    8 Phoenix, AZ
    10 Orlando, FL
    11 Indianapolis, IN
    12 Salt Lake City, UT
    13 Columbus, OH
    14 Jacksonville, FL
    15 Atlanta, GA
    16 Las Vegas, NV
    16 Riverside, CA
    18 Portland, OR-WA
    19 Denver, CO
    20 Oklahoma City, OK
    21 Baltimore, MD
    22 Louisville, KY-IN
    22 Richmond, VA
    24 Seattle, WA
    25 Kansas City, MO-KS
    26 San Diego, CA
    27 Miami, FL
    28 Tampa, FL
    29 Sacramento, CA
    30 Birmingham, AL
    31 New Orleans, LA
    32 Philadelphia, PA-NJ-DE-MD
    33 Minneapolis, MN-WI
    34 St. Louis, MO-IL
    35 Cincinnati, OH-KY-IN
    35 New York, NY-NJ-PA
    37 Boston, MA-NH
    38 Memphis, TN-MS-AR
    39 Pittsburgh, PA
    40 Virginia Beach, VA-NC
    41 Rochester, NY
    42 Buffalo, NY
    42 San Francisco, CA
    44 Hartford, CT
    45 Milwaukee, WI
    45 San Jose, CA
    47 Chicago, IL-IN-WI
    47 Los Angeles, CA
    49 Providence, RI-MA
    50 Detroit, MI
    51 Cleveland, OH

    This piece originally appeared at Forbes.com.

    Joel Kotkin is executive editor of NewGeography.com and is a distinguished presidential fellow in urban futures at Chapman University, and an adjunct fellow of the Legatum Institute in London. He is author of The City: A Global History. His newest book is The Next Hundred Million: America in 2050, released in February, 2010.

    Photo by Exothermic Photography

  • Will J.R. Recognize the New Dallas?

    In the sixties and seventies, Dallas’s prime tourist attraction was an assassination site. The town seriously needed a new image. It got one in a soap opera that revealed a city besieged by blonds, big  hair and big homes. “Dallas,” which premiered in 1978, did for Big D what “Sex in the City” and “Seinfeld” did for New York: it painted a portrait of the city for the world.

    The last “Dallas” episode aired in 1991, but TNT recently resurrected the hit show. This iteration features a new crop of Ewings beside originals Larry Hagman, Linda Gray, and Patrick Duffy. Dallas, of course, was never like “Dallas.” Since the series premiered, Dallas evolved. From its residents to its politics, Dallas today bears little resemblance to the city the show depicted. Which Dallas will J.R. come home to?

    When the series debuted, Dallas was a conservative place. In 1980, Reagan took 59 percent in Dallas County, the anchor of the much larger Dallas-Fort Worth metroplex, now home to more than 6 million people. As the county grew, it became more diverse, and consequently, more Democratic.  No one would mistake it for San Francisco, politically and demographically, but it more resembles present-day Los Angeles than old Dallas.    

    In 2008, for example, Obama won 57 percent in Dallas County. Since “Dallas” first aired, Dallas elected two female Jewish mayors and an African-American, current U.S. Trade Representative Ron Kirk. Although voters rejected gay marriage in 2005, they sent openly gay city councilor Ed Oakley to a mayoral runoff two years later (Oakley lost). If a real J.R. today causes trouble, he’ll contend with Sheriff Lupe Valdez, who’s also gay.     

    Minority growth transformed Dallas County politics. In 1980, there were two white residents for each non-white resident. Now, it’s the other way around. After “Dallas,” whites fled to northern exurbs. African-Americans, Hispanics, and other minorities spread throughout the urban core and inner-ring suburbs. Dallas votes Democratic; the surrounding counties don’t. Southfork Ranch, the white mansion in the “Dallas” opening, sits in rock-Republican Collin County, a mostly white, upper-middle class area with more than five times the residents as were there in 1980. In many respects, this is where “Dallas” culture – as defined by the old series – still thrives.

    Outposts of the exclusive “Dallas” lifestyle still exist in much of North Dallas. George W. Bush settled into his post-presidency in an 8,500 sq. ft. Preston Hollow estate. Old-moneyed enclaves Highland Park and University Park draw the ire and envy of the metroplex. In Good Christian Bitches, socialite Kim Gatlin dishes about Botoxed beauties and Bible belt back-stabbers. These clichés sell: ABC used her Park Cities-inspired tale for their upcoming series “Good Christian Belles.”

    Besides the population, the economy has also diversified: oil is now an ensemble player, not the lead. Exxon Mobil has headquarters near Dallas, but Houston is the energy superstar, despite not getting its own show. The metroplex hosts twenty Fortune 500 companies, including Southwest Airlines, Texas Instruments, and GameStop. This mix, along with the fact the region mostly avoided the housing crisis, explains why the recession hurt Dallas less than other cities.

    If you only saw “Dallas,” you’d suspect shoulder pads and cowboy boots pass for high-fashion. But Dallas was always more cosmopolitan than the series let on. Neiman Marcus started in Dallas. Dallasites who can afford to—and many who can’t—gather at upscale eateries, fashion premiers, and charity galas.  J.R. Ewing-types may fill Cowboys Stadium suites, but they also fill box-seats at the $354 million AT&T Performing Arts Center. It’s not all BBQ, rodeos, and pageant queens in Big D.

    That perception, nonetheless, persists as does the idea of J.R. as the archetypal Texan. On a trip to Spain, his name came up after I told my hosts I was from Texas. Who knew Sevillanos loved Aaron Spelling productions? As Dallas transforms, it can’t shake the cowboy/oilman stereotype. Like a Hollywood starlet, Dallas has been typecast.

    But still I hope the next “Dallas” includes a broader cast of characters. An uptown Indian high-tech executive or feisty female mayor would be nice. Producers must show off the city’s grandiosity. Dallas strives for bigger and best, for bragging rights if no more; it never lets up. The same year it lost a quixotic Olympic bid, it opened the colossal American Airlines Center. Ridiculed in the nineties, the Dallas Mavericks stand as N.B.A. champs today. Always scouting for new business, Dallas lured AT&T from San Antonio in 2008.

    “Dallas” left fans wondering, “Who shot J.R.?” The real mystery, three decades later, is why a multi-layered city retains a one-note reputation. Dallas, after all, has remade itself.          

    Writer Jason Thurlkill grew up near Dallas. He reported for “The Hotline” and a “New York Observer” publication. Previously, he worked for a Washington D.C. political consulting firm. He studied government at the University of Texas and earned his Master of Public Policy at the University of Chicago.

    Photo by david.nahas.

  • Listing the Best Places Lists: Perception Versus Reality

    Often best places lists reflect as much on what’s being measured, and who is being measured as on the inherent advantages of any locale.  Some cities that have grown rapidly in jobs, for example, often do not do as well if the indicator has more to do with perceived “quality” of employment.

    Take places like Denver and Seattle. Both do well on what may be considered high-tech measurements – bandwidth, educated migration, entrepreneurial start ups – but have trailed other places in terms of creating jobs. Others, such as Oklahoma City and Raleigh, do better in terms of overall job creation and cost competitiveness.

    There are effectively few truly objective criteria, and the Area Development list does tend to weigh a bit heavy on the factors that help more expensive – although not necessarily the most costly – cities. If cost of doing business, or regulatory environments were given more weight, some of the high fliers would not do as well.

    We prefer to focus less on atmospherics and more on how people, and businesses, are voting for their feet. San Francisco and New York have generally had slower job growth and greater outmigration, but do well on lists that focus on perceived qualitative factors.

    But then there is Austin. Here is one region that has it all, the low costs and favorable regulatory climate of Texas along with the amenities associated with a high-tech region. The area creates a large number of jobs of varying types and is still inexpensive enough to attract young, upwardly mobile families. This gives it a critical advantage over places like Silicon Valley, Los Angeles or New York.  Unlike those three centers, Austin performs extraordinarily well in quantitative measurements.

    The region that most closely matches Austin in these respects is not Seattle and Denver, but Raleigh Durham. Recently a group of leaders from Raleigh made a visit to Denver to learn what makes that city successful. Speaking to the group, we pointed out that by objective measurement – job growth, educated migration, population growth – Raleigh beat Denver by a long shot, yet it was to Denver the group was looking for inspiration. In fact, over the past three years, Americans have moved to Raleigh at a rate more than three times that of Denver.  Perception can be a funny thing which makes a winner feel inferior to a clear runner-up.

    Another strange result is that New York and Houston had the same number of mentions. Yet looking at numbers — from educated migration, job growth, population increase — Houston slaughters New York. People, from the college educated on down are flocking to Houston while fleeing, in rather large numbers, from New York. One has to wonder where the rankers live and where they are coming from. Houston triumphs on performance, while New York, to a large extent, wins on perception. 

    Looking simply at job growth over the past ten years for the Leading Locations mentioned on at least five surveys, the 14 regions separate themselves into three groups.  The top tier of places – Austin, Raleigh, San Antonio, and Houston – all have seen job growth of more than 12% and seem to be recovering from the recession faster than the others.  

    Salt Lake City and Charlotte were tracking with the top tier of places until 2007 but have since fallen to the second tier of cities.  The remainder of the second tier includes steady growers Dallas and Lincoln, along with Oklahoma City, a region that has seen a boom in jobs since bottoming out in 2003.

    The final job growth tier of places includes five regions that have fewer jobs than ten years ago.  Seattle drops just below the zero line after being hit particularly hard by the 2001 and 2008 recessions, while New York and Denver finish near the national rate.  Pittsburgh and Boston spent most of the decade below their 2000 employment levels, but each seem to be recovering from the recession faster than many of the other Leading Locations cities. 

    But perhaps the biggest problem with lists has to do with the size of regions. Much of the fastest growth in America, particularly in terms of jobs, has been in small metros, many with fewer than 1 million or 500,000 residents. Smaller dynamic areas such as Anchorage, Alaska; Bismarck, North Dakota; Dubuque, Iowa; or Elizabethtown, Kentucky – all in the top 25 of NewGeography’s Best Cities for Job Growth 2011 Rankings – are too small to show up on some lists yet may be a location of choice for expansion. This reflects not so much their relative desirability but the fact that, unlike larger regions, they simply are not included on many rankings.

    Ultimately, a list of lists does tell us much, but perhaps only so much for a specific individual or business. For someone interested in the movie business, for example, Los Angeles – and increasingly places like New Orleans or Albuquerque – are great draws, but perhaps not so much for financial services.  The lists of lists are useful to identify hotspots, but for most location decisions, it may be more imperative to drill down to more detailed industry sectors and workforce attributes. And most of all, take the perception factor into account and look instead at the real numbers to tell you where to go.

    This piece first appeared at AreaDevelopment.com, as part of its Leading Locations series discussing best cities rankings.

    Joel Kotkin is a Distinguished Presidential Fellow in Urban Futures at Chapman University in California, an adjunct fellow with the London-based Legatum Institute, and the author of The Next Hundred Million: America in 2050. Mark Schill is Vice President of Research at Praxis Strategy Group, an economic research and community strategy firm.  Both are editors at NewGeography.com, a provider of two surveys for Area Development’s Leading Locations list.

    Photo by mclcbooks

  • Rethinking Urban Dynamics: Lessons from the Census

    Much has been made of the vaunted “back to the city” movement by “the young and restless,” young professionals, the creative class, empty nesters and others were voting with their feet in favor of cities over suburbs.  Although there were bright spots, the Census 2010 results show that the trend was very overblown, affecting mostly downtown and near downtown areas, while outlying ones bled population.  One culprit for this discrepancy seems to be that the intra-census estimates supplied by the Census Bureau were inflated – in some cases very inflated.

    Looking at selected core cities for major US metropolitan areas, many of them were materially over-estimated:


    One particularly egregious case relates to Atlanta. Its huge projected population increase in the 2000s led me to describe it as “one of America’s top urban success stories.”  The reality proved to be quite different. Rather than strong population growth in the city, the population growth turned out to be basically flat, quite a different story.  Other declines might be more predictable, such as Detroit, or those who had previously challenged estimates like Cincinnati and St. Louis.  Still, even urban cores in rapidly growing regions like Dallas and Houston were not immune from this trend.

    There were some exceptions. Cities like Indianapolis, Columbus, and Oklahoma City came in slightly ahead of expectations, but the number of cities with misses and the sizes of the positive and negative misses tilted towards the down direction.

    It seems clear now that the justification for much of the “back to the city” story reflected bad estimates. People can’t be faulted for relying on the official government numbers – I did. But the reality of the 2010 Census, as demonstrated by Wendell Cox and others, is that the 1990s were actually better for urban population growth in America than the 2000s in many respects.

    One legitimate bright spot for cities lay in the growth of downtown and near downtown areas.  Though often starting from low bases, these areas often showed impressive increases.  For example, St. Louis showed good growth downtown despite a very disappointing decline in total city population:

    The poster child for this phenomenon was Chicago, where a fairly expansive area in the greater core showed large population growth.  Areas that were formerly almost all commercial, such as the Loop, added significant residential population, while areas that were nearly derelict like the near South Side have blossomed into thriving upscale neighborhoods.


    The problem, from places ranging from Chicago to Cleveland, is that the gains in the “core of the core” have been more than offset by losses elsewhere, especially the flight of blacks and other minorities – many of them immigrants – to the increasingly diverse suburbs.

    Cities across America have invested enormous sums into downtown redevelopment and major projects in selected districts.  The good news: these investments have shown some ability to move the needle in terms of attracting young professionals downtown.  The bad news lies with the fact that these developments have been extremely costly, and have not transformed the overall demographic or economic climates of the cities that tried them.  This demonstrates the limits of the policies.  Those who aren’t in the young professional, empty nester, or creative class demographic have rightly figured out that they are no longer the target market of city leadership. No surprise then that many of them    have decided to vote with their feet.

    Given the resulting overall negative swings, cities may want to revisit their strategy of putting all their chips in the downtown redevelopment basket in favor of less glamorous improvements in basic neighborhood safety, services, schools and other critical elements.  A handful of elite enclaves and talent hubs may be able to thrive on a “favored demographic quarter” strategy, but for most places there just aren’t enough young professionals and artists to go around.

    Aaron M. Renn is an independent writer on urban affairs based in the Midwest. His writings appear at The Urbanophile.

    * Actual population minus projected population as of 4/1/2010 using a run rate projection based on the 2008-2009 estimated population growth.
    ** Base is the projected 4/1/2010 population above.

    Photo by Ian Freimuth

  • The Evolving Urban Form: Dallas-Fort Worth

    The Dallas-Fort Worth metropolitan area (Note 1), which corresponds to the Dallas-Fort Worth urban area, provides a casebook example of expanding urbanization. Dallas-Fort Worth has been one of the fastest growing major metropolitan areas in the nation for decades. Dallas-Fort Worth was among only three US metropolitan areas adding more than 1,000,000 residents between 2000 and 2010. Only Houston’s addition of 1,230,000 exceeded that of Dallas-Fort Worth, which grew by 1,210,000, a 23.4 percent growth rate. Atlanta was the third metropolitan area to add more than one million residents, at 1,021,000. During the 2000s, Dallas-Fort Worth passed Philadelphia to become the nation’s fourth largest urban area, with a population of 6,372,000. Only New York, Los Angeles and Chicago are larger.

    On an international scale, the United Nations estimates indicate that only Singapore, Houston and Atlanta had greater percentage growth between 2000 and 2010 among high-income world urban areas that exceed 4,000,000 in population.

    The Core: The core of the metropolitan area experienced the earliest growth and has since seen its share of growth and its growth rate decline significantly. Dallas County, which includes the historical core municipality of Dallas (Note 2), had a growth rate of 6.7 percent between 2000 and 2010, approximately one third less than the national growth rate of 9.7 percent. Nearly all of the growth in Dallas County was outside the city of Dallas, which added only 0.8 percent to its population, less than one-tenth of the national rate. The city of Dallas added 9,000 residents, while the suburbs within Dallas County added 140,000 residents.

    Overall, Dallas County accounted for 12 percent of the metropolitan area’s growth between 2000 and 2010. This is down from 41 percent between 1950 and 2000. Between 1900 and 1950, Dallas County accounted for an even larger share (66 percent) of growth (Figure 1). Dallas County’s annual growth rate fell from 4.1 percent between 1900 and 1950 to 2.6 percent between 1950 and 2000 to 0.7 percent in the last decade (Figure 2).


    Inner Suburban Counties: During the 2000s, the greatest growth was experienced in the inner suburban counties (those abutting the core county, Dallas). These six counties (Collin, Denton, Ellis, Kaufman, Rockwall and Tarrant, where Fort Worth is located) experienced a population gain of 38.9 percent. Inner suburban counties now contain 56 percent of the metropolitan area population. Between 2000 and 2010, the inner suburban counties captured 82 percent of the metropolitan area, up from 53 percent between 1950 and 2000 and 38 percent between 1900 and 1950. The inner suburban counties grew 1.7 percent annually from 1900 to 1950, increasing to 3.2 percent between 1950 and 2000 and 3.3 percent in the 2000s.

    Outer Suburban Counties: The outer suburban counties represent a comparatively small portion of the metropolitan area’s population. These five counties (Delta, Hunt, Jasper, Parker and Wise) accounted for only 7 percent of the metropolitan area population. The 2000 to 2010 growth rate was 20.9 percent, somewhat below the metropolitan area rate of 23.4 percent, and more than double the national population growth rate of 9.7 percent national growth rate.

    Between 2000 and 2010, the outer suburban counties captured 6 percent of the metropolitan area growth, the same share as between 1950 and 2000. However, perhaps surprisingly, their combined 1950 population was 19 percent below that of 1900. This illustrates the declining fortunes in the early part of the 20th century of counties that were dominated by agriculture, as the farm population and population of many small farm dependent communities declined. Of course, the 1900 to 1950 losses have since been compensated many times over by the post 1950 suburbanization. Nonetheless, one outer suburban county, Delta is unique in continuing to lose population through the 2010 census. Delta County’s 2010 population of 5,200 is approximately one third of its 1900 population of 15,200.

    The outer suburban counties lost 0.4 percent of their population annually from 1900 to 1950, but turned around to gain 2.1 percent from 1950 to 2000. Between 2000 and 2010, the growth rate fell back to 1.9 percent.

    The City of Dallas: The historical core municipality of Dallas illustrates of the dynamics of aggressive annexation policies. In 1910, Dallas covered only 16 square miles (41 square kilometers) and had a population of 92,000. Even at this early date, the city of Dallas was not very dense, with 5,700 residents per square mile (2,200 per square kilometer). The city reached its peak density of 7,300 (2,800 per square kilometer) in 1940, after having expanded to 41 square miles (106 square kilometers) and a population of 295,000.. Even at this peak density, the city of Dallas remained well below the densities of other core cities, especially in the East and Midwest, most of which had densities exceeding 10,000 per square mile (3,900 per square kilometer).

    By 1950, the city had expanded to 112 square miles (289 square kilometers) and with a population of 334,000, the population density had fallen to 3,900 (1,500 per square kilometer). Larger annexations were to follow, with the city reaching 343 square miles (885 square kilometers) by 2010. With a population of 1,198,000, the population density was 3,500 per square mile (1,350 per square kilometer), less than one-half the 1940 peak. Virtually all new owned housing was built consistent with the post-World War II suburban form, as occurred in metropolitan areas around the nation. The city’s addition of 9,000 residents between 2000 and 2010 was far less than the 182,000 gain between 1990 and 2000. By 2000, there was little greenfield land left to develop in the city and the population could be peaking. Indeed, the population could decline in future censuses, as has happened in geographically constrained urban cores around the world. Any such decline could, however, be counteracted by immigration, as has occurred in some urban cores.

    Ethic Trends in the Metropolitan Area: As would be expected in a state bordering Mexico, the Latino population of Dallas-Fort Worth grew substantially between 2000 and 2010, at a 43 percent rate. Overall, Latinos accounted for 42 percent of the metropolitan area’s growth. The Latino population increase was nearly 520,000, more people than live in the core city of Atlanta.

    However, unlike a number of other metropolitan areas, there was strong growth in the African-American population, which added 33 percent to its count. African-Americans accounted for 19 percent of the metropolitan area’s growth.

    This growth was strongest in the core county of Dallas, where Latino and African-American growth made up for a decline in the rest of the population.  In the inner suburban counties, 53 percent of the growth was Latino or African-America, while the lowest share of Latino and African American growth was in the outer suburban counties, at 30 percent.

    Overall, 75 percent of Latino growth and 69 percent of African-American growth took place in the suburban counties, which is a substantial change from the past (Figure 3).

    The Urban Area: Urban area data has not been released from the 2010 census. However, it is clear that Dallas-Fort Worth has become less dense since 1950. Between 1950 and 2000, the population density of the urban area declined approximately 10 percent.   Even so, it is surprising to some that the Dallas-Fort Worth urban area, with its low-density reputation, was only 12 percent less dense that Portland urban area in 2000, despite the aggressive densification strategies employed by Portland.

    The Expanding Metropolitan Area: The story in Dallas-Fort Worth is little different (Table) from what has emerged in metropolitan areas around the world, in places like Seoul, Mexico City and Mumbai. Dallas-Fort Worth also illustrates a trend only now becoming more obvious, that middle-sized and smaller metropolitan areas are generally growing faster than the megacities within their own countries (see the report by the McKinsey Global Institute). The United States has two megacities, the New York metropolitan area, which grew 3.1 percent from 2000 to 2010 and Los Angeles, which grew 3.7 percent. Dallas-Fort Worth’s far higher growth rate of 23.4 percent translated into an actual population increase of 175,000 more than the combined increase of the two megacities, despite their having five times the population.

    Dallas-Fort Worth: Population Trend by Sector and County 
    1900-2010
    1900 1950 2000 2010
    CORE COUNTY
    Dallas County       82,756    614,799  2,218,899  2,368,139
    INNER SUBURBAN COUNTIES    222,747    527,281  2,596,623  3,585,286
    Collin County       50,087      41,692    491,675    782,341
    Denton County       28,318      41,365    432,976    662,614
    Ellis County       50,059      45,645    111,360    149,610
    Kaufman County       33,376      31,170      71,313    103,350
    Rockwall County         8,531        6,156      43,080      78,337
    Tarrant County       52,376    361,253  1,446,219  1,809,034
    OUTER SUBURBAN COUNTIES    149,302    120,754    346,022    418,348
    Delta County       15,249        8,964        5,327        5,231
    Hunt County       47,295      42,731      76,596      86,129
    Johnson County       33,819      31,390    126,811    150,934
    Parker County       25,823      21,528      88,495    116,927
    Wise County       27,116      16,141      48,793      59,127
    METROPOLITAN STATISTICAL AREA    454,805  1,262,834  5,161,544  6,371,773

    The Future? It is an open question whether the rapid growth of Dallas-Fort Worth will continue. As it continues to grow, the stagnation that now afflicts the nation’s two megacities and its near-megacity, Chicago could spread to Dallas-Fort Worth. On the other hand, Dallas-Fort Worth has advantages that could permit its growth to continue for multiple decades into the future. Texas has a favorable business climate, low taxes and less heavy handed regulation than New York, California and Illinois. Dallas-Fort Worth has plenty of developable land as well as a political culture not cowed by development. The economic advance of its growing population, particularly the burgeoning Latino population, depends upon public policies that favor housing affordability and urban expansion. If it continues on its current course, Dallas-Fort Worth could pass the Chicago metropolitan area in population by 2050 and could even challenge Los Angeles later in the century.

    —-

    Note 1: As currently defined by the Census Bureau. Officially titled the Dallas-Fort Worth-Arlington metropolitan statistical area. Metropolitan areas are essentially labor markets and include a principal urban area and rural (non-urban) areas and may include smaller urban areas.

    Note 2: Fort Worth is not considered a historical core municipality, based upon the discussion in Perspectives on Urban Cores and Suburbs, though the Census Bureau considers Fort Worth and Arlington to be principal cities (which are a different thing). The "Dallas-Fort Worth" terminology is used because of its wide acceptance and to make the geographical expanse of the metropolitan area more clear.

    Wendell Cox is a Visiting Professor, Conservatoire National des Arts et Metiers, Paris and the author of “War on the Dream: How Anti-Sprawl Policy Threatens the Quality of Life

    Photo by Trey Ratcliff

  • What The Census Tells Us About America’s Future

    With the release of results for over 20 states, the 2010 Census has provided some strong indicators as to the real evolution of the country’s demography. In short, they reveal that Americans are continuing to disperse, becoming more ethnically diverse and leaning toward to what might be called “opportunity” regions.

    Below is a summary of the most significant findings to date, followed by an assessment of what this all might mean for the coming decade.

    Point One: America is becoming more suburban.

    For much of the past decade, there has been a constant media drumbeat about the “return to the cities.” Urban real estate interests, environmentalists and planners have widely promoted this idea, and it has been central to the ideology of the Obama administration, the most big-city dominated in at least a half century. “We’ve reached the limits of suburban development,” Housing Secretary Shaun Donovan opined last February, “People are beginning to vote with their feet and come back to the central cities.”

    Donavan and others cite such things as the energy price spike in the mid-aughts as well as the mortgage crisis as contributing to the “back to the city” trend. Yet in reality the actual numbers suggest that Donavan and his cronies may need a serious reality check. The Census reveals that, contrary to the “back to the city” rhetoric, suburban growth continues to dominate in most regions of the country, constituting between 80% and 100% of all growth in all but three of the 16 metropolitan areas reporting.

    This includes sprawling regions like Houston, “smart growth areas like Seattle and Portland  (where suburbs accounted for more than 80% of all growth over the decade) and Midwestern regions like St. Louis, which like Chicago saw a sharp decline in the urban population. The only exceptions have been Oklahoma City, Austin or San Antonio, with vast expanses still allowing for much of new development to take place within the city limits.

    To be sure, no one should pretend that urban fortunes have sunk to their 1970s nadir. Yet overall, central cities, which accounted for a 11% of metropolitan growth in the 1990s, constituted barely 4% of the growth in the last decade.  Some core cities, notably Chicago, have shrunk after making gains in the ’90s. Indeed Chicago — the president’s adopted hometown and the poster child of the urban “comeback” — took what analyst Aaron Renn humorously dubbed “a Census shellacking,” losing some 200,000 people, while the outer suburban ring continued to grow and diversify their populations. The Windy City’s population is now down to the lowest level since the 1910 Census.

    Point Two: America is becoming more diverse, and the diversity is spreading.

    The racial reordering of America is proceeding apace. Nowhere is this more clear than in Texas, where Hispanic and Asian populations have driven much of the state’s demographic growth. Latinos alone now account for roughly 38% of all Texans. Immigration rates in Dallas and Houston  are now higher than for Chicago, Washington, Seattle and Atlanta. Texas, notes long-time observer Candace Evans, is becoming the country’s premier laboratory for promoting a successful diversity.

    There are other major shifts in ethnic demographics. For one thing, minorities continue to head to the suburban rings around most major cities. African-Americans and even Latinos may be fleeing places like Chicago, but they continue to move in large numbers to suburban locales in surrounding Illinois counties. , especially south of the city.  Others appear to  have headed to places like the traditional black-opportunity magnet of Atlanta and or other southern hubs, such as Nashville.

    Another trend appears to be the migration of ethnic minorities to areas that, in the past, have been primarily white. This is clear in the thriving Indianapolis area, where the African-American population grew by 28% and the Hispanic population by 161%, or some 56,000 souls.   Look for more minority growth in such areas which have the advantage of affordable housing, robust economies and better than average job growth.

    3. The Shift to “Opportunity Regions”

    As the economy slid in the last years of the decade, population growth slowed, particularly in some Sun Belt states, such as Florida and Nevada, that thrived during the bubble. In contrast newcomers flocked to places, notably in the Texas cities, that offered better prospects. Austin, San Antonio, Houston and Dallas-Ft. Worth regions all grew by 20% or more over the decade.

    The key here seems to be affordability and jobs. As economist Mark Sharpe has illustrated, Texas private sector job growth last year was 2.7%, compared with 1% nationally. Unfortunately, unemployment remains over 8%, since of this growth was absorbed by newcomers. In contrast, places with the slowest, or negative growth, tend also to be losing jobs. For example, although the residential population of Chicago’s loop tripled in the past decade to 20,000,the famed business district lost almost 65,000 jobs.

    But it’s not just Sun Belt cities that are gaining on places like Chicago.  Indianapolis has emerged as a different kind of “opportunity region.” It lacks the dynamism and diversity of the Texas cities, but it has continued to attract people from all over the country, including the surrounding rural or old Rust Belt parts of the state. Overall the Indianapolis region grew nearly 15% over the decade, roughly 50% higher than the national average, as much as Portland and more than Seattle.

    In contrast, growth seems to be slowing in some formerly hot areas. Population increases for Seattle, Portland and Denver were around 14%,  about half the rate of the previous decade. Part of this may have to do with high unemployment, particularly in Oregon, and high housing prices. Still, these three areas continue to grow much faster than regions such as Chicago, St. Louis or Baltimore where growth struggled in the single digits

    Possible Long-term Implications

    These shifts suggest that the Obama administration might want to rethink its high-density and urban-oriented strategy. Despite all the media focus on an imagined “back to the city” movement, Americans continue to disperse to “opportunity regions” and toward the suburbs. As a result, expect generally conservative-leaning suburbs and exurbs to gain more power after reapportionment and core city influence to decline further.

    Yet the Census numbers also have some unsettling aspects for Republicans. The increasing minority population even in heartland states such as Indiana, not to mention Texas, could undermine GOP gains, particularly if the party listens to its strong nativist wing. Diversification in the suburbs could ultimately turn some of these areas to the center or even left.

    The new American generation arising in the census will be increasingly diverse. A growing portion will consist of the children of immigrants, and they will be predominately English-speaking.  This suggests a more active and engaged minority population, perhaps susceptible to a pro-growth GOP message and the economy of “opportunity regions” but likely hostile to overtly anti-immigrants posturing.

    Whatever your politics or economic interests, the Census suggests that the country is changing in dramatic way– if not always in the ways often predicted by pundits, planners or the media. It usually makes more sense  to study  the actual numbers, than follow the wishful thinking of largely urban-centric, big-city-based and often quite biased analysts.

    This piece originally appeared at Forbes.com

    Joel Kotkin is executive editor of NewGeography.com and is a distinguished presidential fellow in urban futures at Chapman University, and an adjunct fellow of the Legatum Institute in London. He is author of The City: A Global History. His newest book is The Next Hundred Million: America in 2050, released in February, 2010.

    Indianapolis Photo by IndySawmill

  • Census 2010: A Texas Perspective

    If you want to get a glimpse of the future of the U.S., check out Fort Worth, TX. Never mind the cowboy boots, but you might want to practice your Spanish.

    Texas is growing explosively and much of that growth is among Latinos.   The latest Census Bureau figures show the Lone Star State grew by 20%, to over 25 million people, recording about a quarter of the nation’s overall growth. The rate of growth was twice the national average. The implications are huge politically, as Texas stands to gain 4 new Congressional seats from this expansion, and Hispanic leaders want in.

    A majority of the Hispanic growth came from births to families already living here. While migration from other states and countries contributed about 45%.  

    The Texas story stands in contrast to the Rust Belt states and the Northeast, where overall growth is minimal.   Texas’s Hispanic-fueled growth spurt out-paced the entire countries, helped brace our housing market and our economy.

    A close look at Texas growth reveals much about   American’s home-buying habits. Rural areas got smaller – few want to live in the boonies of far west Texas while it appears suburban areas won over the most transplants.

    But arguably the biggest winner was Ft. Worth, or Cow Town as we call it. Fort Worth grew by a whopping 38.6%, the largest increase in the state, followed by Laredo’s 33%, Austin at 20.4%, and San Antonio at 16%. In contrast the city of Dallas, my home, grew by a scant .8% – a bit deflating to a city all puffed up about a $354 million arts center, a downtown park and greenway, and the $185 million Perot Museum of Nature & Science underway.

    Houston remains the state’s largest metropolitan area but sustained growth of only 7.5%, though Harris County – mostly due to growth in the suburbs – grew by 20%. As in Ft. Worth and elsewhere, Hispanics have been the driver, and now comprise 41% of the Harris County population. The biggest growth took place in formerly rural towns just outside the big cities, one-shop stop farmer’s crossings or granaries.  

    Curtis Tally shakes his head at how fast little Justin, north of Fort Worth, has grown. Subdivisions sprouted up on what was once farmland around his Justin Feed Co. in southern Denton County. From 1891 residents in 2000, Justin has 3,246 today.  

    "We were selling seed for pastures; now we’re selling seeds for lawns," Tally, 74, who has been in business in Justin since 1958, told the Fort Worth Star Telegram.

    If you think that’s amazing, wait ‘till you get to Fate, Texas, 25 minutes east of Dallas on Interstate 30. Ten years ago you would have missed Fate, a town of 500 so small the utility invoicing was done on postcards if you blinked while driving. Today, Fate is the fastest-growing town in the state, with 6,357 residents – an increase of 1,179%!  Residents who live there say it’s far enough away from Dallas to be in the country, but still close to the big city. Fate draws many first time homebuyers who are starting families (home prices range from $50,000 to $300,000) Here’s what Fate resident Tina Nelson told The Dallas Morning News:

    “My kids can go ride bikes all day long and I don’t have to worry too much about where they are,” said Tina. “It’s like the 1950s (here) the sun goes down and everyone’s porch light comes on.”

    On the western side of Lake Ray Hubbard, a few minutes from Fate and slightly closer to Dallas is Sunnyvale, another fast-growing little hick town where professionals are building $2 million dollar homes on a 124 acre family ranch turned into home sites called St James Park. They send their children to a two-year old, $50 million public school with the highest ratings in the state.

    The young man building homes on the 49 two acre estate sites is Jojy Koshy of Atrium Fine Homes. At 31, Jojy holds a masters in business from the University of Texas and tells me, with pride, how his parents immigrated to the Dallas suburb of Plano in 1986 from India.

    “My parents instilled a strong work ethic in us,” he says. “I know this market is challenging, but I believe that if I work longer, harder, and keep our clients completely satisfied, we will have a great business.”  

    It’s the same story across the state. The Interstate 35 corridor between Austin and San Antonio filled in with development as the cities merged closer to becoming one big schizophrenic metropolis. The string of counties along the Rio Grande, anchored by Brownsville and McAllen have been growing, and may be beneficiaries of the crime wave south of the border.   A sharp Dallas Realtor took out an ad in the Monterrey newspaper advertising homes for sale in Dallas and snagged several buyers. Even the wife of the Monterrey mayor moved to a Dallas suburb, escaping the cartel and seeking to be closer to her family here.

    Aside from escaping death in Mexico, what is driving people to Texas? Start with our rising star, Fort Worth. The city has both a cowboy pizzazz personality and a lower crime rate than Dallas. Fort Worth’s arts district has overshadowed Dallas’s for years, and the neighborhoods offer true community – places where the kids can still walk, not be bussed, to school. Rose Bowl winner Texas Christian University is on the upswing, downtown is charmingly vibrant, and an urban renaissance is taking hold on the city’s western edge called West 7th.   

    What are people seeking in Texas? I’d call it quality of life with room for upward mobility: affordable homes with mortgage payments that leave some money for recreation, good public schools for their kids and generally less onerous tax regime.

    Yet with our many gains, Texas faces great challenges. The state has the third-highest teenage pregnancy rate in the nation, which is actually an improvement from last year, when we were number two. There are a rising number of children are living in poverty in Texas. Many of these children may be anchor babies born to illegal immigrants who cross the border to ensure their children and ultimately, themselves, citizenship. In 2006, 70% of the women who gave birth at Dallas County’s Parkland Memorial Hospital were illegal immigrants.  

    Increasingly, Latinos, illegal or not, take those babies home to the suburbs. Texas suburbs are no longer lily-white.  This is true in working class places like Bedford, Texas, outside Fort Worth, where the black population has almost doubled. In affluent Southlake, the population this decade shifted from 95 percent Anglo down to 88 percent.   Looking for a great selection of Asian food? You’ll starve (or go broke) in downtown Dallas. Go north to Carrollton, Texas where you’ll find a 78,000 square foot Super H Mart in what was once a Mervyns department store. Inside you’ll find seven types of gray, fuzzy, Chinese long, acorn, spaghetti, butternut, and kombucha squash eight food stalls said to rival any of those found in Seoul and Singapore, two cities known for their gourmet street food. Manduguk, anyone?

    The new Texans are coming here not just to live, but to dig in economically.  

    In the end, we are seeing the birth of a Texas that is neither the white bread, big hair idyll of the cultural conservatives or the free market dystopia imagined by liberals. It is becoming more diverse, without losing its capitalist energy. With all its blemishes,  the emerging Texas may well become the model for how America evolves in the coming decades.

    Candy Evans is an independent journalist based in Dallas, Texas, She covers Texas for AOL’s HousingWatch and blogs at secondshelters.com.

    Photo by Rick

  • The Still Elusive “Return to the City”

    Metropolitan area results are beginning to trickle in from the 2010 census. They reveal that, at least for the major metropolitan areas so far, there is little evidence to support the often repeated claim by think tanks and the media that people are moving from suburbs to the historical core municipalities. This was effectively brought to light in a detailed analysis of Chicago metropolitan area results by New Geography’s Aaron Renn. This article analyzes data available for the eight metropolitan areas with more than 1 million population for which data had been released by February 20.

    Summary: Summarized, the results are as follows. A detailed analysis of the individual metropolitan areas follows (Table 1).

    • In each of the eight metropolitan areas, the preponderance of growth between 2000 and 2010 was in the suburbs, as has been the case for decades. This has occurred even though two events – the energy price spike in mid-decade and the mortgage meltdown – were widely held to have changed this trajectory. On average, 4 percent of the growth was in the historical core municipalities, and 96 percent of the growth was in the suburbs (Figure 1).
    • In each of the eight metropolitan areas, the suburbs grew at a rate substantially greater than that of the core municipality. The core municipalities had an average growth from 2000 to 2010 of 3.2 percent. Suburban growth was 21.7 percent, nearly 7 times as great.  Overall, the number of people added to the suburbs was 14 times that added to the core municipalities.
    Table 1:
    Metropolitan Area Population: 2000-2010
    2000 Population
    Historical Core Municipality Suburbs Metropolitan Area
    Austin              656,562            593,201         1,249,763
    Baltimore              651,154         1,901,840         2,552,994
    Chicago           2,895,671         6,053,068         8,948,739
    Dallas-Fort Worth           1,188,580         3,972,964         5,161,544
    Houston           1,953,631         2,761,776         4,715,407
    Indianapolis              860,454            664,650         1,525,104
    San Antonio           1,144,646            567,057         1,711,703
    Washington              572,059         4,181,934         4,753,993
    Total           9,922,757       20,696,490       30,619,247
    2010 Population
    Austin              790,390            925,899         1,716,289
    Baltimore              620,961         2,089,528         2,710,489
    Chicago           2,695,598         6,599,081         9,294,679
    Dallas-Fort Worth           1,197,816         5,173,957         6,371,773
    Houston           2,099,451         3,846,449         5,945,900
    Indianapolis              903,393            852,848         1,756,241
    San Antonio           1,327,407            815,101         2,142,508
    Washington              601,723         4,883,034         5,484,757
    Total         10,236,739       25,185,897       35,422,636
    Change: 2000-2010
    Austin              133,828            332,698           466,526
    Baltimore              (30,193)            187,688           157,495
    Chicago             (200,073)            546,013           345,940
    Dallas-Fort Worth                 9,236         1,200,993         1,210,229
    Houston              145,820         1,084,673         1,230,493
    Indianapolis               42,939            188,198           231,137
    San Antonio              182,761            248,044           430,805
    Washington               29,664            701,100           730,764
    Total              313,982         4,489,407         4,803,389
    Percentage Change: 2000-2010
    Austin 20.4% 56.1% 37.3%
    Baltimore -4.6% 9.9% 6.2%
    Chicago -6.9% 9.0% 3.9%
    Dallas-Fort Worth 0.8% 30.2% 23.4%
    Houston 7.5% 39.3% 26.1%
    Indianapolis 5.0% 28.3% 15.2%
    San Antonio 16.0% 43.7% 25.2%
    Washington 5.2% 16.8% 15.4%
    Total 3.2% 21.7% 15.7%
    Chicago excludes Kenosha County, WI
    Washington excludes Jefferson County, WV
    Indianapolis core municipality: Indianapolis & Marion County

    Analysis of Individual Metropolitan Areas: The major metropolitan areas for which data is available are described below in order of their population size (Figure 2 and Table 1).

    Chicago:The core municipality of Chicago lost 200,000 residents between 2000 and 2010. Suburban growth was 546,000, adding up to total metropolitan area growth of 346,000 people. The suburbs accounted for 158 percent of the metropolitan area growth. The core municipality decline was stunning in the face of the much ballyhooed urban renaissance in that great city. Yet this renaissance was limited enough as to not lead to an expanding population.

    The decline in the core municipality population represents a major departure from the 2009 Bureau of the Census estimates, which would have implied a 2010 population at least 170,000 higher (assumes the growth rate of 2008 two 2009).

    Instead all of the growth was in the outer suburbs, beyond the inner suburbs of Cook County.

    Dallas-Fort Worth: The historical core municipality of Dallas had a modest population increase of 9000, or less than 1 percent between 2000 and 2010. In contrast, the suburbs experienced an increase of 1.2 million, or 30 percent. Thus, approximately 1 percent of the metropolitan area growth was in the core municipality, while 99 percent was in the suburbs, most of it in the outer suburbs. The inner suburbs added 14 percent to their 2000 population, while the outer suburbs added 36 percent.

    The population figure for the core municipality of Dallas – consistently among the strong core areas –  was surprisingly low, at 9 percent below (117,000) the expected level. The suburban population was 1 percent (71,000) below expectations.

    Houston: The historical core municipality of Houston had comparatively strong population growth, adding 146,000 and 8 percent to its 2000 population. However this figure was 8 percent, or 174,000 below the expected figure. By contrast, the suburban growth was 39 percent, more than five times that of the central jurisdiction. The suburban population growth was 1,085,000, more than six times that of the core jurisdiction. The suburban population was 4 percent or 144,000 higher than expected.

    The core jurisdiction of Houston accounted for 12 percent of the metropolitan area growth while the suburbs s accounted for 88 percent. This was evenly distributed between the inner suburbs of Harris County and the outer suburbs. The inner suburbs added 38 percent to their population while the outer suburbs added 41 percent.

    Washington:Reversing a decade’s long trend, the historical core jurisdiction of Washington (DC) had a small population gain between 2000 and 2010. But the Washington, DC gain of 30,000 pales by comparison to the suburban gain, which was more than 20 times greater, at 700,000. The core jurisdiction accounted for 4 percent of the population gain, while the suburbs accounted for 96 percent.

    More than 60 percent of the growth in the metropolitan area was outside the inner suburban jurisdictions that border Washington, DC (Arlington County and Alexandria in Virginia, together with Montgomery County and Prince George’s County in Maryland), while the inner suburbs accounted for 36 percent of the growth. The population increase in the inner suburbs was 9 percent, compared to 37 percent in the outer suburbs.

    Jefferson County in West Virginia was not included in the analysis because data is not yet available.

    Baltimore: The historical core municipality of Baltimore, the site of another ballyhooed urban comeback, lost 30,000 people, or 5 percent of its 2000 population. Baltimore’s 2010 population was 4 percent or 16,000 below the expected level. The suburbs experienced a 10 percent or 188,000 person increase.  The region’s population increase was roughly equal in numbers between the inner suburbs and the outer suburbs, although the exurban percentage increase was nearly twice as large.

    San Antonio:The historical core municipality of San Antonio experienced the largest population increase among the eight metropolitan areas, at 183,000, a roughly 16 percent population jump. The city of San Antonio accounted 43 percent of the growth while suburbs in Bexar County and further out accounted for a larger 57 percent. However, the suburban population increase was 248,000 or 44 percent. This is something of a turnaround in trends that favored the city of San Antonio in the past because of its vast sprawl and predominant share of the metropolitan population.

    The city of San Antonio population was 5 percent or 65,000 people short of the expected 2010 level. The suburban population was 15 percent more or 104,000 more than the expected level.

    Indianapolis:The historical core area of Indianapolis and Marion County (including enclaves within Indianapolis) grew 5 percent and accounted for 19 percent of the metropolitan area growth. In contrast, the surrounding suburbs grew 28 percent, representing r 81 percent of the metropolitan area growth. Overall, the core municipality added 44,000 people, while the suburbs added more than four times as many, at 188,000.

    Austin:The historical core municipality of Austin experienced the greatest growth of any core jurisdiction in the eight metropolitan areas, at 20 percent. Even so, growth in the suburban areas was nearly 3 times as high at 56 percent. The city of Austin accounted for 29 percent of the metropolitan area population growth, while the suburbs accounted for 71 percent. Overall, the central municipality grew 134,000, while the suburbs grew 2.5 times as much, at 333,000.

    Generally it is fair to say that, so far, suburban areas are growing far faster than urban cores. In addition, most of the fastest growing core municipalities are those areas that are themselves largely suburban, particularly in relatively young cities like San Antonio, Houston and Austin.
     
    Among the eight metropolitan areas analyzed, the older core jurisdictions (with median house construction dates preceding 1960) tended to either lose population or grow modestly. This is illustrated by the city of Chicago, with a median house construction date of 1945, Baltimore with a median house construction date of 1946 and Washington with a median house construction date of 1949 (Table 2). Generally, the central jurisdictions with greater suburbanization (with median house construction dates of 1960 or later) grew more quickly. For example, highly suburban central jurisdictions like Austin with a median house construction date of 1983 and San Antonio, with a median house construction date of 1970, grew fastest. So much for the long forecast, and apparently still elusive, “return to the city”.

    Table 2:
    Historical Core Municipalities: Growth & Median House Age
    Historical Core Municipality
    Growth: 2000-2010 Share of Metropolitan Growth Median House Construction Year
    Austin 20.4% 28.7% 1983
    Baltimore -4.6% -19.2% 1946
    Chicago -6.9% -57.8% 1945
    Dallas-Fort Worth 0.8% 0.8% 1974
    Houston 7.5% 11.9% 1975
    Indianapolis 5.0% 18.6% 1967
    San Antonio 16.0% 42.4% 1979
    Washington 5.2% 4.1% 1949
    Average 3.2% 3.7%

    Wendell Cox is a Visiting Professor, Conservatoire National des Arts et Metiers, Paris and the author of “War on the Dream: How Anti-Sprawl Policy Threatens the Quality of Life

  • Dallas Charges Up for the Electric Chevy

    If they build it, will we come? Planners, utilities, auto industry execs, and retailers are hopeful that we will, as they get themselves ready for electric vehicles in the Dallas/Fort Worth Metroplex. This isn’t a pie-in-the-sky vision for the future. The reality is unfolding right now. In 2011, NRG Energy will install upwards of 70 car-charging stations across Dallas and Forth Worth. As the Nissan Leaf and the Chevy Volt begin to penetrate the D/FW market, NRG aims to capture the revenue stream from charging car batteries here, just it is doing in Houston. NRG’s news comes on the heels of electric utility TXU Energy’s announcement of its own installation of twelve public charging stations being allocated across Dallas and Fort Worth.

    I’ve been watching the wave for several years as part of my work with emerging companies. At numerous conferences on electric vehicles, I’ve observed stakeholders – many of them in competition with each other – come together to swap ideas, network, and hammer out standards. It’s been an education in the necessity of collaboration to foster sustainable development.

    Cooperation hasn’t been guided by idealism so much as by the urge to survive in a market that, until recently, was practically non-existent. Start-ups that have failed to collaborate have fallen by the wayside. As one conference speaker joked, “We’ve got to build up the market before we tear each other down.”

    Profit-making may be the motivation of electric-vehicle manufacturers, but others at the table have their own agendas for EV readiness. The city of Dallas, for example, is in Serious Nonattainment status for ozone pollution. The region risks losing funding if it doesn’t clean up its air. “Seventy percent of air pollution in Dallas comes from on-road/off-road vehicles, so EVs can play a substantial role in resolving this,” said Jennifer Cohen, Executive Director for the North Texas Clean Air Coalition. Cohen was an organizer of the Electric Vehicle North Texas Electric Vehicle Showcase last September at the State Fair of Texas.

    At the Electric Vehicle Showcase. Betsy del Monte, Director of Sustainability for Dallas-based construction giant BECK told a panel, “Mass transit alone cannot solve our problem. We also need to look at the broader picture in terms of development. Of the palette of materials that we have available, EVs are one of the tools we must come to rely on.”

    Tom Reddoch, Director of Energy Efficiency for Electric Power Research Institute, agreed: “This is a success story. EPRI is connecting two giants, the electric industry with the auto industry.” To assist stakeholders with the information they need to build communities that can sustain a transition to electric vehicles, EPRI sees three keys: regionally-driven consumer attitudes, the installation of charging infrastructure in order to ensure a positive response for the drivers’ first experiences, and utility readiness. “We have plenty of capacity to go around, especially if people charge at night,” said Reddoch, “but there could be localized effects where cars cluster. The construction community, developers, and architects need to address this together.”

    At a technical level, tools are emerging that can help integrate electric vehicles into the transportation landscape. “We’ve arrived at an interesting nexus between the power industry and the auto industry,” said Brad Gammons of IBM. “There is not going to be a dominant leader so we need standards across the value chain… Collaboration ensures that things happen efficiently.”

    Not all collaboration requires complex software. Some of it is happening on the ground, person to person. The installation of electric vehicle charging infrastructure in D/FW is giving two cities with a long (if friendly) rivalry a chance to mutually benefit by working together. “To get the mayor of Fort Worth to travel to Dallas to talk about EVs is huge,” said Jim Greer of Oncor electricity.

    Range anxiety continues to be a barrier to electric vehicle adoption, even though three-fourths of Americans commute less than 40 miles per day. “To handle range anxiety, we need to provide home-based charging capability,” said del Monte from BECK.

    At the same time, Half Price Books unveiled Dallas’ first public charging station. Granted, there’s not a line around the block for the EV charger yet. But just having it at one of Dallas’ most popular bookstores sends a tangible signal to drivers that the future is here and now.

    As the infrastructure falls into place, the question remains: Will drivers buy the cars? We’ll find out very soon. The Chevy Volt is scheduled to arrive on car dealers’ lots in Dallas-Fort Worth in March.

    Photo of the Chevy Volt, a plug-in electric vehicle by IFCAR

    Anna Clark is the author of Green, American Style and the president of EarthPeople. She lives in one of Dallas’ first residences to earn a Platinum-LEED certification from the U.S. Green Building Council.